Embed Size (px)
Citation preview

=
jf
/
REPORT
TO THE
NATIONAL AERONAUTICS AND SPACE ADMINISTRATION
//cn d/e
Fo#
ANNUAL STATUS REPORT J
(Includes Semiannual Status Report #12)
for
GRANT NAGW-533
LABORATORY EVALUATION AND APPLICATION OF
MICROWAVE ABSORPTION PROPERTIES UNDER SIMULATED
CONDITIONS FOR PLANETARY ATMOSPHERES
Paul G. Steffes, Principal Investigator
February I, 1989 through October 31, ]989
Submitted by
Professor Paul G. Steffes
School of Electrical Engineering
Georgia Institute of TechnologyAtlanta, GA 30332-0250
(404) 894-3128
(_!ASA-CR-18_916) LA/!nRATFIF_y cV,_LUATI,_ N AND
APPLICATIFIN O_ MICRONAVF AbSi]RPTION
PRGPER/IES UNnER SIMULATED CUND_TTUNS FnR
PLANETARY AT_NSPHER_S Annual Stratus _epor.+_1 F_b. - 31 Oct. !989 (_eor_i_ Ins_ of G J/VI
N90-1_O25
https://ntrs.nasa.gov/search.jsp?R=19900005709 2018-11-24T02:22:01+00:00Z

TABLE OF CONTENTS
II
III
IV
V
Vl
Vll
VIII
INTRODUCTION AND SUMMARY
OUTER PLANETS STUDIES
VENUS STUDIES
PUBLICATIONS AND INTERACTIONS WITH OTHER INVESTIGATORS
CONCLUSION
REFERENCE
KEY FIGURES
APPENDIX
PAGE
1
8
16
24
27
28
31
46

3
I. INTRODUCTION AND SUMMARY
Radio absorptivity data for planetary atmospheres obtained from spacecraft radio
occultation experiments and earth-based radio astronomical observations can be
used to infer abundances of microwave absorbing atmospheric constituents in those
atmospheres, as long as reliable information regarding the microwave absorbing
properties of potential constituents is available. The_use of theore_ically-
derived microwave absorption properties for such atmospheric constituents, or
laboratory measurements of such properties under environmental conditions which
are significantly different than those of the planetary atmosphere being studied,
often leads to significant misinterpretation of available opacity data. For
example, results obtained for the microwave opacity from gaseous H2SO4 under=
simulated Venus conditions, during the first two years of Grant NAGW-533, showed
that not only was the opacily from H2SO4 much greater than theoretically
predicted, but that its frequency (wavelength) dependence was far different than
that theoretically predicted (Steffes, 1985 and Steffes, 1986). Subsequent
measurements made by Steffes and Jenkins (1987), showed that the microwave
opacity of gaseous ammonia (NH3) under simulated Jovian conditions did indeed
agree with theoreticaLpredictions to within experimental accuracy at wavelengths
longward of 1.3 cm./ Work performed by Joiner et al. (1989) during the fourth
and fifth years of Grant NAGW-533 and continuing into this past grant year
(February I, 1989 through October 31, 1989) has shown that laboratory
measurements of the millimeter-wave opacity of ammonia between 7.5 mm and 9.3
mm and also at the 3.2 mm wavelength require a different lineshape to be used
in the theoretical prediction for millimeter-wave ammonia opacity than had been
previously used. The recognition of the need to make such laboratory
measurements of simulated planetary atmospheres over a range of temperatures and
OI_GINAL PAGE ISOF, POOR QUALITY

4
pressures which correspond to the altitudes probed by both radio occultation
experiments and radio astronomical observations, and over a range of frequencies
which correspond to those used in both radio occultation experiments and radio
astronomical observations, has led to the development of a facility at Georgia
Tech which is capable of making such measurements. It has been the goal of this
investigation to conduct such measurements and to apply the results to a wide
range of planetary observations, both spacecraft and earth-based, in order to
determine the identity and abundance profiles of constituents in those planetary
atmospheres. _ _=
A key activity for the past grant year has continued to be laboratory
measurements of the microwave and millimeter-wave properties of the simulated
atmospheres of the outer planets and their satellites. As described in the
previous Semiannual Status Report #]I for Grant NAGW-533 (February I, 1989
through April 30, 1989), initial laboratory measurements of the millimeter-wave
opacity of gaseous ammonia (NH3) in a hydrogen/helium (H2/He) atmosphere, under
simulated conditions for the outer planets were completed in 1988. These
measurements were conducted at frequencies from 32 to 40 GHz (wavelengths from
7.5 to 9.3 mm). A complete description of this millimeter-wave spectrometer is
given in previous Annual Status Reports for Grant NAGW-533, and in Joiner et al.
(1989).
Since larger variations from theoretically-derived opacity values were expected
at shorter millimeter-wavelengths (see de Pater and Massie, 1985), we have
conducted laboratory measurements at wavelengths near 3.2 mm (94 GHz), where a
large number of observations of the emission from the outer planets have been

5
made. Adescription of this newsystem waspresented in Semiannual StatusReport
#I._._!1(February I, 1989 through April 30, 1989). A better knowledge of the
millimeter-wave absorption properties of NH3 is essential, not only to help
better characterize the distribution and abundance of ammonia at high levels in
Jovian atmospheres, but to make it possible to resolve the contributions from
other absorbing constituents such as H2S (see Bezard et al., 1983). This
knowledge will be of considerable importance for millimeter-wave instruments
proposed for future missions, such as the MSAR (microwave and spectrometer and
radiometer) proposed for the Cassini mission.
In some cases, new observations or experiments have been suggested by the results
of our laboratory measurements. For example, this facility was initially
developed, and then operated, in order to evaluate the microwave absorbing
properties of gaseous sulfuric acid (H2S04) under Venus atmospheric conditions.
The results, obtained at 13.4 cm and 3.6 cm wavelengths, were applied to
measurements from Mariner 5, Mariner 10, and early Pioneer-Venus Radio
Occultation experiments, to determine abundances of gaseous sulfuric acid in the
Venus atmosphere (Steffes, 1985). Further laboratory measurements also suggested
that a substantial variation in the Venus microwave emission, related to the
abundance of gaseous sulfuric acid, might exist near the 2.2 cm wavelength.
Since no observations of the Venus emission at this wavelength had ever been
published, we conducted observations of Venus using the 140-foot NRAO telescope
and the 64-meter DSN/Goldstone antenna in April 1987 to not only search for the
presence of the predicted feature, but to use such a feature to determine a
planet-wide average for sulfuric acid vapor abundance below the main cloud layer.
The results of this observation were substantial in that they not only placed

6
limits on the abundance and spatial distribution of gaseous H2SO 4 and S02, but
they also suggested some limits to long term temporal variations for the
abundance of these two gases.
Recently, we completed calibration and interpretive studies on the data from
these observations and a paper entitled "Observations of the Microwave Emission
of Venus from 1.3 to 3.6 cm," by P.G. Steffes, M.J. Klein, and J.M. Jenkins, has
been accepted by the journal Icarus. One important issue which was discussed
in this paper is the discovery that the microwave absorptivity for gaseous H2SO4
which was measured by Steffes (1985 and 1986) appears to differ from a
theoretical spectrum newly computed from over 11,000 lines by Janssen (personal
communication) by a scale factor. That scale fator suggets that the
theoretically-derived "dissociation factor" for gaseous H2SO4 (i.e., the
percentage of H2SO4 which breaks done to form SO3 and H20 ) may have been
underestimated. This results in an underestimation of the absorption from
gaseous H2SO4. Therefore, an experiment has been conducted to correctly evaluate
the "dissociation factor" and thus allow unambiguous calibration of laboratory
data for H2SO4 opacity (see Section llI). This will be critical for the proper
interpretation of a wide range of opacity data.
Another important tool for evaluating potential spatial and temporal variations
in abundance and distribution of gaseous H2SO 4 is the reduction and analysis of
recently obtained Pioneer-Venus radio occultation measurements. The 13 cm
microwave absorptivity profiles, which can be obtained from the radio occultation
data, are closely related to the abundance profiles for gaseous H2SO 4. Starting
in June 1988, we began the reduction of the 1986-87 Pioneer-Venus radio
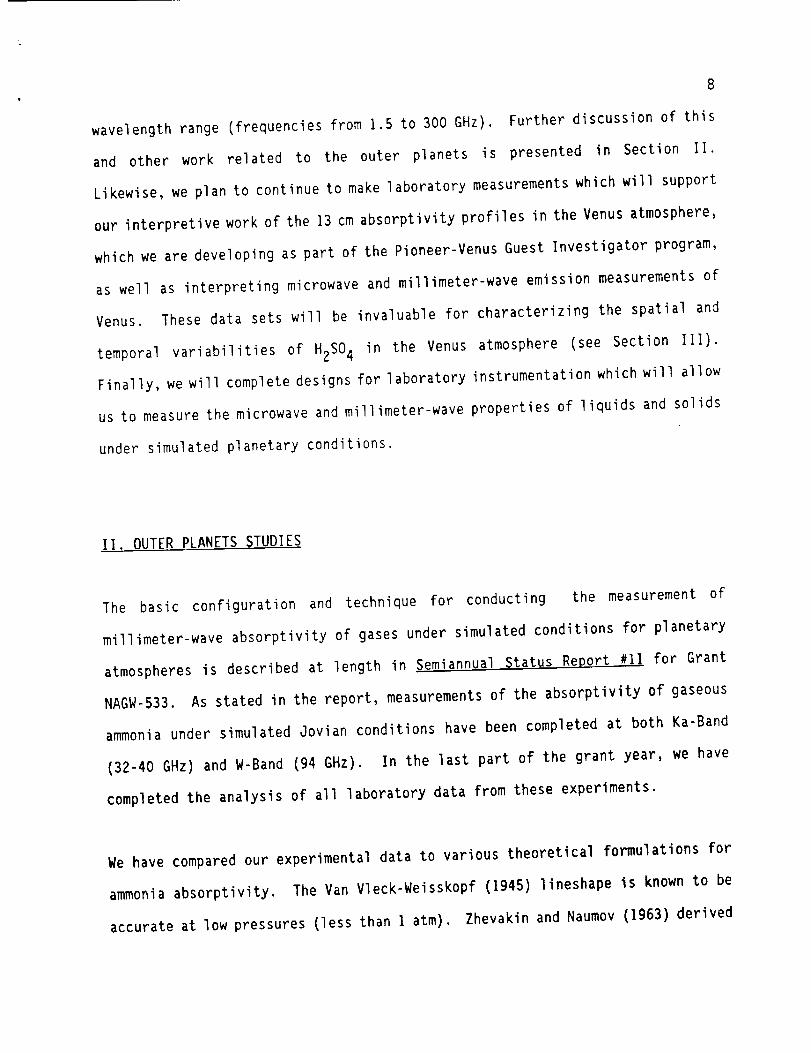
7
occultation measurements (working at JPL with support form the Pioneer-Venus
Guest Investigator Program) in order to obtain the needed 13 cm microwave
absorptivity profiles. Yet another important source of information is the
increasing number of high-resolution millimeter-wavelength Venus emission
measurements which have been recently conducted. Correlative studies of these
measurements with radio occultation measurements and our longer wavelength
emission measurements (Steffes et al., 1989) should provide the necessary data
for characterizing temporal and spatial variations in the abundance of gaseous
H2SO4 and SO2, and for modeling its role in the subcloud atmosphere. However,
unambiguous results will require that we have dependable knowledge of the
equilibrium between gaseous H2SO4, SO3, and H20, both so as to properly interpret
laboratory measurements of the microwave and millimeter-wave opacity of the gases
which elute from liquid sulfuric acid, as well as to model their relation within
the Venus atmosphere. Our results in Section III provide this information.
Recently, we have developed models for microwave and millimeter-wave emission
from the Jovian planets in order to evaluate how adjustments to ammonia abundance
profiles affect the predicted emission spectrum. We have also compared these
results with observations from earth-based radio telescopes. (In the future,
we should be able to take advantage of the availability of data from several
millimeter-wave radio telescope arrays in order to develop localized ammonia
abundance profiles over the entire disk of one or more Jovian planets.) In the
next year of Grant NAGW-533, we propose to use the results of our laboratory
analysis of the millimeter-wave absorption from gaseous NH3 under simulated
Jovian conditions to complete a formulation which accurately predicts the opacity
from gaseous ammonia in a Jovian-type atmosphere over the entire I mm to 20 cm
8
wavelength range (frequencies from 1.5 to 300 GHz). Further discussion of this
and other work related to the outer planets is presented in Section If.
Likewise, we plan to continue to make laboratory measurements which will support
our interpretive work of the 13 cm absorptivity profiles in the Venus atmosphere,
which we are developing as part of the Pioneer-Venus Guest Investigator program,
as well as interpreting microwave and millimeter-wave emission measurements of
Venus. These data sets will be invaluable for characterizing the spatial and
temporal variabilities of H2SO 4 in the Venus atmosphere (see Section Ill).
Finally, we will complete designs for laboratory instrumentation which will allow
us to measure the microwave and millimeter-wave properties of liquids and solids
under simulated planetary conditions.
II. OUTER PLANETS STUDIES
The basic configuration and technique for conducting the measurement of
millimeter-wave absorptivity of gases under simulated conditions for planetary
atmospheres is described at length in Semiannual Status Report #11 for Grant
NAGW-533. As stated in the report, measurements of the absorptivity of gaseous
ammonia under simulated Jovian conditions have been completed at both Ka-Band
(32-40 GHz) and W-Band (94 GHz). In the last part of the grant year, we have
completed the analysis of all laboratory data from these experiments.
We have compared our experimental data to various theoretical formulations for
ammonia absorptivity. The Van Vleck-Weisskopf (1945) lineshape is known to be
accurate at low pressures (less than I arm). Zhevakin and Naumov (1963) derived

9
a different lineshape and found that their lineshape gave better results than
the VanVleck-Weisskopf theory whencomparedto experimental data for atmospheric
water vapor absorption. This lineshape was also derived independently by Gross
(1955) and is sometimes referred to as the kinetic lineshape. Ben-Reuven(1966)
derived a more comprehensive lineshape which was found to be more accurate at
higher pressures. Several modifications to the Ben-Reuvenformalism (i.e. Morris
and Parsons, 1970) have beenmadefor applications in planetary science as more
laboratory data under planetary conditions has becomeavailable. Recently,
Spilker and Eshleman(1988) have derived newpressure and temperature dependences
for the Ben-Reuvenlineshape based on laboratory data under simulated Jovian
conditions from high accuracy measurementsat 9-18 GHz. Their formalism maybe
extrapolated to the frequencies and conditions of our experiments.
Figure ] shows a graph of the four theoretical formulations which have been
investigated for ammoniaabsorptivity from ] to 1000 GHz(under the conditions
of the Ka-Band experiment). These are labeled VVWfor the Van Vleck-Weisskopf
lineshape, BR-BGfor the Berge and Gulkis (1976) formalism of the Ben-Reuven
lineshape, BR-TS for the Spilker modified Ben-Reuven lineshape (private
communication, 1988), and ZN-G for the Zhevakin-Naumov(1963) or Gross (1955)
lineshape. The contribution from the rotational lines near 600 GHz has been
included. All calculations employcenter frequencies and line intensities given
by Poynter and Kakar (]975). The two Ben-Reuvenformalisms also include the
modification by Morris and Parsons (1970).
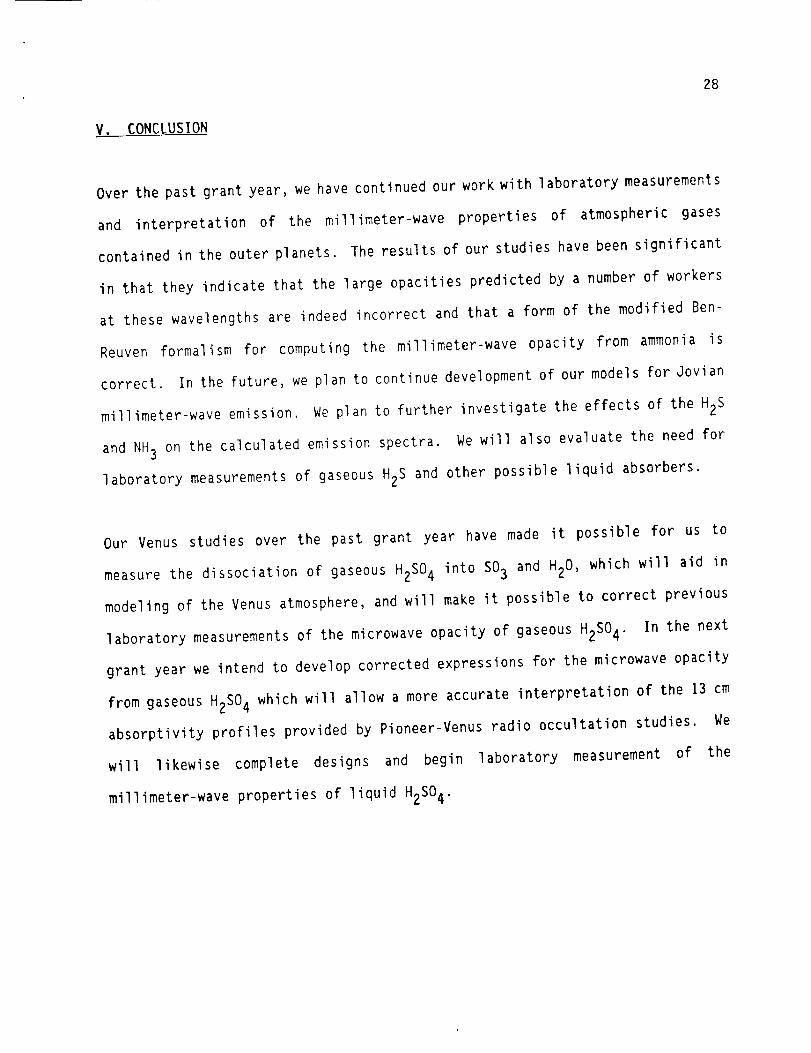
Figure 2 showsthe results of our Ka-Bandexperiment as comparedto three of the
theoretical lineshapes. The Spilker modified lineshape is not shownhere, but

]0
is essentially the sameas the Gross (Zhevakin-Naumov)shape for this frequency
range (see Figure I). Since the data favors both the Gross lineshape and the
Spilker formalism at these frequencies, it is not clear which is more
appropriate. However, by making measurementsat a higher frequency where the
lineshapes are more distinct, it is possible to determine which of these
lineshapes is more appropriate. Figure 3 shows the results of our 94 GHz
experiment as compared to all four theoretical lineshapes. At this frequency
it is clear that neither the Van-Vleck Weisskopf lineshape nor the Gross
lineshape is adequate in describing the observed opacity.
|
Because the Spilker formalism is based on laboratory data which was taken at
pressures greater than I arm, we cannot assume that it is valid at lower
pressures. In fact, this model contains a singularity around I atm. Theory
predicts that there should be a smooth transition from the Ben-Reuven formalism
to the Van Vleck-Weisskopf formalism at some low pressure. However, it is not
known at what pressure this transition occurs. Although absorptivity
measurements were initially made at several pressures ranging from I to 2 atm,
the sensitivity of our measurement apparatus was not great enough to detect
ammonia absorption under experimental conditions at pressures near I atm. In
fact, no reliable data at Ka-Band (32-40 GHz) was taken below 2 atm. However,
at W-Band (94 GHz), one reliable data set at pressures near I arm was available.
Careful analysis of the data taken at a pressure of I atm shows that although
no significant absorption was detected, the error bars reflect an upper limit
for the opacity due to ammonia. This upper limit is well below the Van Vleck-
Weisskopf theory even at I atm. This analysis is significant in that it shows
the transition to the Van-Vleck Weisskopf theory must occur at some pressure

pressure below I atm.
11
Another activity over the past grant year has been the development of a
radiative transfer model of the Jovian atmosphere. This model will utilize our
laboratory data and can also be used to evaluate the need for further laboratory
measurementsof other possible absorbers. The model is similar to that described
in dePater and Massie (1985), where a simple spherical model has been used
instead of an oblate spheroid. The model is written in PASCALand can be run
on any IBMcompatible personal computer. With appropriate modifications, it can
also be used to model the other Jovian planets. At the present time, we have
a working model which we have used to generate simulated emission spectra. Over
the next several months, we plan to further improve the model so that we may
evaluate the effects of various microwave and millimeter-wave absorbers.
The temperature-pressure profile for our Jovian model is shownin Figure 4, where
wehave tried to match the profile given by dePater and Massie (1985) as closely
as possible. The dePater and Massie profile is based on Voyager data from Lindal
et al, (1981) with an adiabatic extrapolation to the deeper levels of the
atmosphere. We have also matched their ammonia abundance profile in order to
see how our model compares with theirs. The ammonia abundance profile is shown
in Figure 5. A sample output from our model is shown in Figure 6. This model
utilizes the Ben Reuven (Berge and Gulkis, 1976) formalism for ammonia
absorption. When all of the assumptions of dePater and Massie are matched, we
find that our spherical model differs from their oblate spheroid model by less
than 5K (less than 3%) at all wavelengths from I mm to 10 cm (3-300 GHz). This
is certainly within the error bars of the actual radio observations at these

wavelengths.
12
The next step will be to develop somekind of formulation for computing the
absorption from ammoniaat all temperatures, pressures, and frequencies based
on all of the available laboratory data. Because laboratory data exists only
at a few frequencies and at pressures above ] atm, it is impossible to develop
a single expression which will work under all conditions. The Spilker model
provides a good estimate for the frequency dependenceof the ammoniainversion
spectrum under Jovian conditions at pressures around 2 atm. However, because
of a singularity near ] arm, it cannot be used in the model at all pressures.
Instead of trying to use one single formulation for ammoniaabsorptivity which
works at all temperatures, pressures, and frequencies, we will try a different
approach. Wewill use the different theoretical and empirical formulations (i.e.
those in Figure 1) over the entire frequency spectrum, but only at pressures and
temperatures where they are knownto be accurate. Since the abundanceprofile
of ammoniacontains abrupt changesat cloud layers, wemaychange the absorption
spectrum at points in the model which will not cause severe discontinuities.
For example, we may use either the Van Vleck-Weisskopf or the Ben-Reuven
lineshape to describe ammoniaabsorption in the upper atmosphereabove the main
cloud layer (pressures below 0.7 atm.), where ammoniais depleted and the overall
pressure is low. Since the contribution to the brightness temperature is
negligable at these pressures, the assumed lineshape will not affect the
calculated brightness temperature. The Berge and Gulkis formulation of the Ben-
Reuvenlineshape maybe used from the main cloud layer to pressures above 1 atm.
where the mixing ratio of ammonia levels off. The Spilker formalism may then
be used at pressures above I atm., where it is known to be accurate.

13
We attempted to run our model using this approach. However, the Spilker
formalism failed at higher frequencies for pressures greater than 1 atm. Further
analysis of the Spilker formalism is needed before this lineshape can be used
at higher frequencies and at pressures between I and 2 atm. We will continue
to develop a model for ammonia absorption, based on laboratory results, which
can be used in the emission model.
At the present time, the laboratory results can be used to give a lower limit
for the abundance of ammonia on Jupiter. Since our laboratory results show that
ammonia is les.____ssopaque than than the Ben-Reuven lineshape predicts, the models
of brightness temperature produced using the Ben-Reuven lineshape give a lower
limit for the predicted brightness temperature. In other words, model output
using the laboratory data will give higher brightness temperatures than those
using the Berge and Gulkis (1976) Ben-Reuven formalism. DePater and Massie
(1985) showed than more opacity was needed in order to account for the cooler
brightness temperatures observed at millimeter-wavelengths. Thus, our laboratory
results show than more ammonia must be present or other absorbers must exist in
order to explain the observations.
Figure 7 shows several weighting functions for our Jovian model using the Berge
and Gulkis model for ammonia absorption. At the peak of the ammonia inversion
spectrum at 23 GHz, the main contribution to the brightness temperature comes
from the layers just below the high-altitude crystalline ammonia cloud layer.
At 40 GHz (Ka-Band_, the main contribution centers around I atm. The weighting
functions for 10 GHz and 94 GHz are almost identical. Since laboratory data has


15
of this figure shows that by using higher concentrations of H2S, absorption could
be measured with our laboratory configuration.
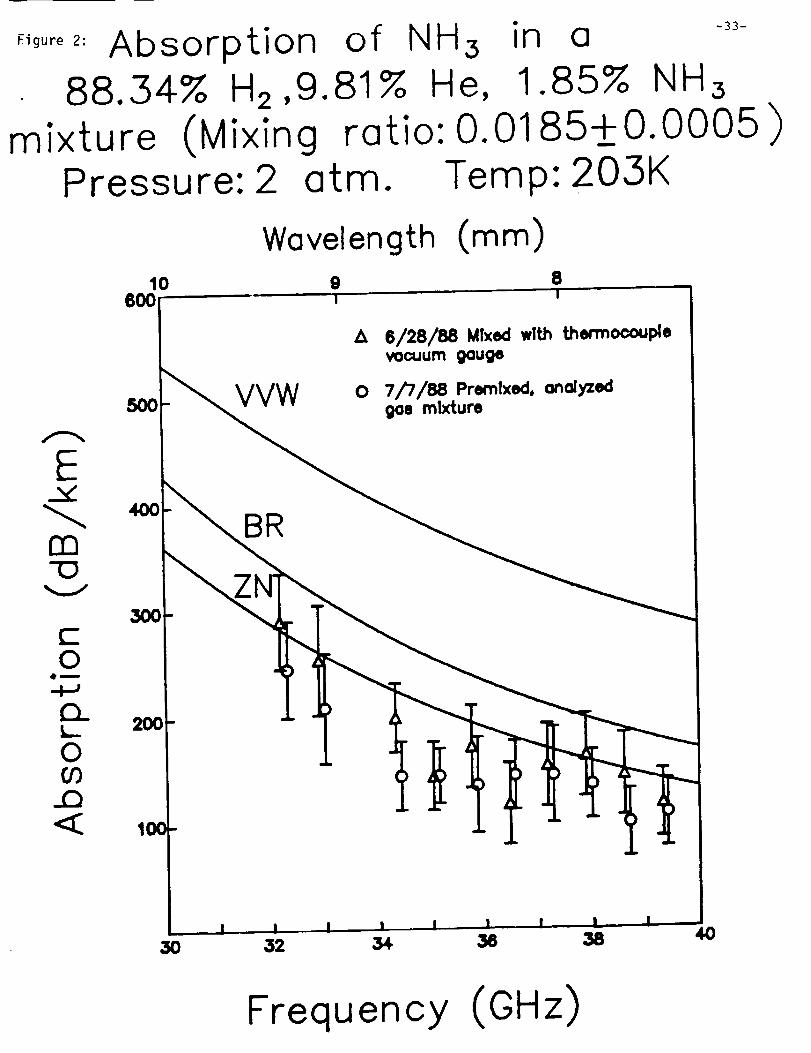
Larson et al. (1984) have developed a profile for the vertical distribution of
hydrogen sulfide for Jupiter. This profile is shown with the ammonia profile
in Figure 5. An ammonium hydrosulfide cloud (NH4SH) is proposed around 2 arm,
above which H_S is depleted and below which a solar abundance of H2S exists. The
model was run using this profile along with our formulation for hydrogen sulfide
absorption. The model spectra with and without hydrogen sulfide absorption are
shown in Figure 9. The hydrogen sulfide spectrum should be slightly smoothed
as in Bezard et al. (1983). However, this does give an upper limit on the effect
of adding this H_S profile to the model. This profile is also a lower limit on
the amount of H2S which may be present in the atmosphere of Jupiter. Several
researchers (e.g. Briggs and Sackett, 1989) have suggested that as much as ten
times the solar amount of H2S may be present on the Jovian planets. A third
model emission spectrum resulting from an H2S profile similar to that in Figure
5, but with ten times the solar abundance below the NH_SH cloud is also shown in
Figure 9. Note that at the H2S line centers, the calculated brightness
temperature is not dependent on the H2S mixing ratio, but is dependent on the
level at which the ammonium hydrosulfide cloud is placed. This is similar to
the effect at the center of the ammonia inversion spectrum at 23 GHz, where the
brightness temperature is dependent on the level of the ammonia cloud layer as
shown by the weighting function in Figure 7.
Over the next several months, we plan to further investigate the effects of
different H2S and NH3 abundance and absorption profiles on the calculated
.2 21_C
16
emission spectra. We will also investigate the possible effects of cloud
condensates on the millimeter-wave emission. We will then evaluate the need for
laboratory measurements of gaseous H2S and other possible liquid absorbers.
III VENUS STUDIES
The laboratory measurement of the dissociation factor of gaseous HzSO4 in
equilibrium with liquid sulfuric acid is desperately needed in order to allow
proper interpretation of both future and existing work on the opacity of gaseous
H2SO4 and to properly model its saturation abundance in the Venus atmosphere.
Steffes (1985,1986), estimated that about 47% of the gaseous H2SO4 which
vaporized from a liquid sulfuric acid reservoir, dissociated to form gaseous SO3
and H20. Using this assumption, Steffes proceeded to calculate the mixing-ratio
normalized opacity of gaseous H2SO4, which is believed to be the major
predominant microwave absorber at altitudes above 30 Km in the Venus atmosphere.
The laboratory measurements used for calculating the normalized opacity were
conducted at wavelength ranging from 1.3 to 22 cm. One wavelength of major
interest is 13 cm. Its importance is due to the fact that measurements of
localized absorptivity at that frequency have been provided by the Pioneer-Venus
Orbiter Radio Occultation (ORO) experiment.
A. EXPERIMENTAL SETUP
The measurements are conducted using the apparatus shown in Figure 10. In this
setup, a large vacuum chamber (of known volume), is constructed using Pyrex glass

]7
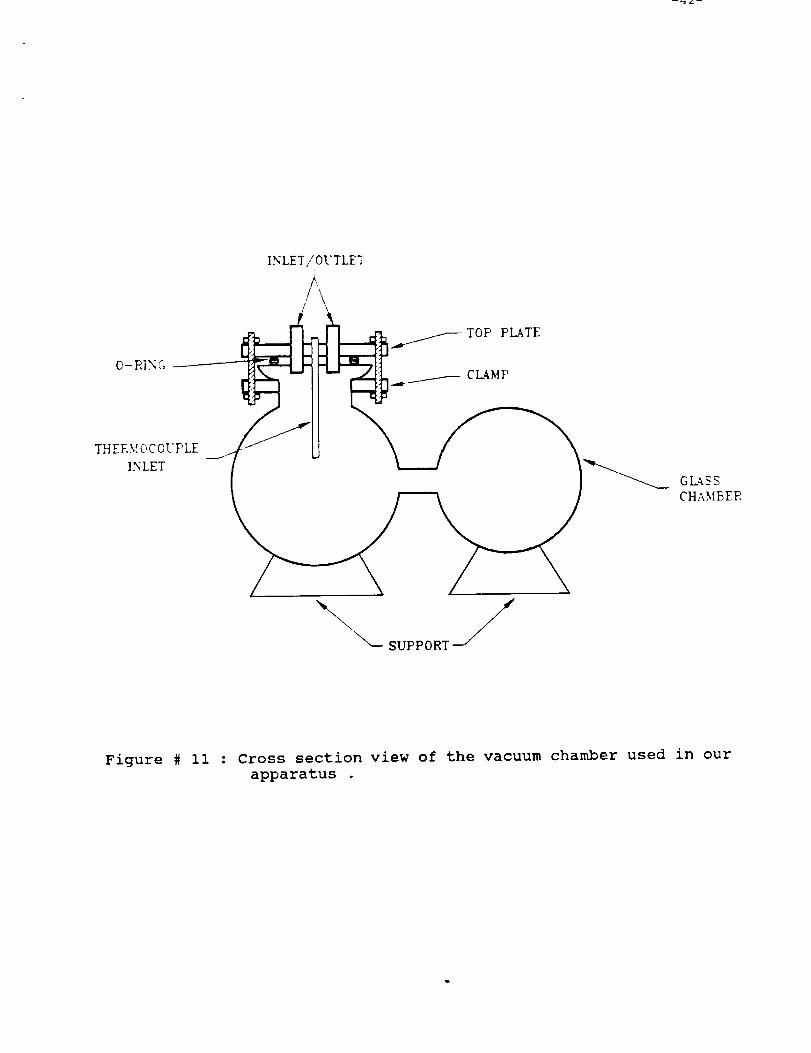
as shownin Figure ]I. The reason for choosing Pyrex is its ability to withstand
high temperatures (600 K). The top of the glass chamber was sealed using a
stainless steel plate. A high temperature O-ring was sandwiched between the
glass and the plate to insure that leaks are minimal at that junction. A special
purpose clamp is used to hold the plate to the glass lip. Stainless steel pipes
and valves are used throughout the system in order to minimize acid-metal
reaction at high temperatures. Thepipes were submergedin sulfuric acid solution
to dissolve surface impurities. The flask is also constructed of Pyrex glass.
Another reason for choosing glass is the ability to monitor the status of the
sulfuric acid vapor, and to makesure that no vapor condensation is occurring
during pressure measurement.
The chamberand the flask had to be fitted inside a temperature controlled oven.
The temperature inside the oven is monitored using a pre-calibrated thermocouple.
The output of the thermocouple is connected to a digital voltmeter, the
temperature is then inferred using voltage versus temperature data of the
thermocouple. Twovacuumgauges are used in the experiment. GaugePI is used to
monitor the status of the chamber, i.e. checks for leaks. The range on PI is 0 -
20 Torr. GaugeP2 is connected to a digital pressure display. The gauge is able
to measure pressures ranging from 0 to 800 Torr in ] Torr increments, with
accuracy of ± I Torr throughout its usable range. The latter gauge is used to
measure total pressure in the chamber at the desired temperature. A nitrogen
buffer is used in the setup so as not to allow any sulfuric acid vapor to come
in contact with gauge P2. The buffer is filled with a predetermined amount of
nitrogen. Nobuffer is necessary for gaugeP1 because the valve is closed during
pressure measurements.The experiment is conducted at six distinct temperature

18
points ranging from 490 to 600 K. Twodifferent concentrations of liquid sulfuric
acid are used, 99% and 95.9%. Acid samples were provided by the Du Pont Company.
The flask is filled with a precisely known volume of liquid sulfurlc acid at room
temperature. The volume measurements are made using a ]-ml syringe with 0.01 ml
gradations. For volumes less than I ml, repeatable accuracies of better than .01
ml have been obtained.
The apparatus is first heated to the desired temperature (usually taking about
four hours). At that point, a vacuum is drawn. Using gauge P] we are able to make
sure that leaks are minimal, since any major leak can affect the total measured
pressure, therefore altering the dissociation constant. Our system had a leak
rate of approximately I Torr/hour. The system is allowed to reach thermal
equilibrium, by continuously monitoring the temperature. The flask valve is then
opened allowing the liquid HzSO_ to reach vapor pressure equilibrium with the
evacuated chamber. Once equilibrium is reached, the valve is closed, and a check
is made to verify that the remaining liquid is clear. The valve is usually opened
for a period of ten minutes. The buffer is then opened and the chamber pressure
is recorded. It is important to emphasize that throughout this process the
temperature had to be within certain limits of the desired value, thus allowing
the temperature variation factor to be minimal. In this case we were able to
maintain oven temperature to within ± 5 K. The system is then allowed to cool
overnight to its original room temperature. The remaining volume of liquid
sulfuric acid is measured and the evaporated volume is inferred.

B. RELATION BETWEEN MEASURED QUANTITIES AND RESULTS
19
Let VLiquid (ml) denote the volume of liquid H2SO4 and liquid H20 which evaporates
from the flask in Figure 10.
= + VH2o (I)VLiquid VH2SO 4
The percent concentration of the liquid sulfuric acid (by mass) is defined as
follows : (i.e. PCM = .99 for 99% concentration by mass)
PCM = VH2s°4 PH2S04
VH2SO 4 PH2S04 -F VH20 _)H20(2)
where pH2o = density of H20 (1 gm/ml). From equation (I) and (2) one can solve
for andVM20 VM2SO 4 :
and
VH2 0 =
VH2so 4 =
VH2so4 pH2so4 ( I - PCM)
PCM (3)
VLiqu_d• PCM
PCM + #H2so4 (I- PCM) (4)

!
2O
In equations (3) and (4), the density of liquid HzO have been assumed to be ]
gm/ml. Given the density of liquid sulfuric acid (gm/ml), it is possible to
compute the number of HzSO4 molecules which are converted to vapor phase by the
relation :
nvapo r == (VH2sO 4 " IOH2s04)/98 + (VH20 • pH2o)/]6(5)
where nvapor is the number of molecules (in moles) which vaporized during the
experiment. The total number of molecules in the chamber (ntota_) which resulted
from the vaporized molecules can be determined assuming a dissociation factor
D"
F V,2so4• #,2so4 l [ V,2o"p,2o 1nTota t = (]+D) + (6)
L 98 ] L 16 J
where D is the portion of H2SO4 molecules which dissociate to form SO3 and HzO.
(The range of D is between 0 and I). The pressure P (Arm) obtained from the
evaporated liquid sulfuric acid can be directly measured during the experiment.
P is related to ntota _ by the ideal gas equation :
P Vchambe r : nTota L • R • T (7)
V=hamber (I) is the volume of the chamber occupied by the evaporated gas. R is the
ideal gas constant (.08205 l.Atm/mole.K), and T is the temperature of the chamber
in Kelvins (K). Combining the above equations, and solving for the dissociation

constant D yields :
21
D784 • PCM • P • Vchamber + VH2504 "PH2504 • R • T • (41 PCM - 49)
8 (PCM) V,2so4 "#"2s°L .R • T(8)
Thus if the chamber volume, temperature of the system, density of sulfuric acid,
pressure resulting from the evaporated liquid acid, and the amount of evaporated
liquid are known, by using equation (8) one can compute the dissociation factor
D.
Another important derivation is the calculation of the partial pressure of
sulfuric acid (P,2so4 (Atm)). The calculation of the partial pressure, will enable
us to go back and correct the measured normalized microwave absorptivity
(Steffes, ]985) for gaseous H2SO4 in a CO2 atmosphere at 13.4 and 3.6 cm.
wavelength. The total pressure P can be written as :
P PH2o + Pso 3 +" PH2SO 4(9)
- , (9) becomes :Since PH2o Psos
P = + 2 = PH2SO4 + 2 P.2oPH2so4 Pso3(lO)

The dissociation factor D can also be written as :
22
D - Ps°3
PH2SO 4 + Pso 3
Combining (10) and (11) yield :
(11)
1 -D
P =P .H2SO 4 ----
I + D (12)
Thus the partial pressure of sulfuric acid can be computed from the knowledge
of the total pressure measured and the calculated dissociation factor D using
(8). Note that when the dissociation factor is unity (10) and (12) yield :
P 2 :2= Pso 3 PH20
(13)
Knowing the volume of the evaporated liquid and the pressure in the chamber the
dissociation factor D can be calculated. Using D, the partial pressure of gaseous
sulfuric acid can then be calculated using (12).
C. RESULTS
Figure 12 is a plot of the calculated partial pressure of gaseous sulfuric acid
above liquid sulfuric acid as a function of temperature for a 99% (by weight)
concentration. Illustrated points are from laboratory measurements. The solid

23
line is the partial pressure of sulfuric acid as calculated by Steffes (1985).
Dashed line is a best-fit curve to the lab measurements. The temperature
dependence of the vapor pressure of gaseous sulfuric acid is given by :
n p : 2.72 3952/T (14)
where p is the sulfuric acid vapor pressure in atmospheres and T is the
temperature in Kelvins. A similar result is obtained for a 95.9% concentration
as shown in Figure 13. Its best-fit expression is given by (15):
n p : 2.89 4132/T (15)
Figure 14 compares the best-fit results from these measurements with those
obtained by Steffes (1985). Examination of our results indicate that the
dissociation factor increases as the concentration is decreased. This is to be
expected, since lower concentration means less sulfuric acid vapor pressure.
Notice that the slope is constant for both concentrations, which suggests that
partial pressure is proportional to concentration. Thus as concentration of
sulfuric acid decreases so does the vapor pressure. Our results indicate that
Steffes (1985) overestimated partial pressure at higher temperatures, and
underestimated partial pressure at lower temperatures.
Although the above results are very critical in interpreting future and present
work on the opacity of gaseous sulfuric acid, we need to further study the
partial pressure of H2SO 4 at lower temperatures. Thus, our results in this
present form cannot currently be extrapolated to lower temperatures. The results

24
from lower temperatures studies will allow us to develop a single expression for
partial pressure of gaseious H2SO 4 over a larger temperature range. In the next
grant year, we will go back to the results obtained by Steffes (1985) and correct
the normalized microwave absorptivity of gaseous sulfuric acid at 13.4 and 3.6
cm, in order obtain new sulfuric acid mixing ratio profiles for the Venus
atmosphere. Our results can also be used to infer the saturated sulfuric acid
abundance by using published data on the pressure-temperature dependence of the
Venus atmosphere (Seiff et.al, 1980) along with our results. Since total pressure
is known and saturated partial pressure can be calculated using our formulas,
mixing ratio is then easily calculated.
IV. PUBLICATIONS AND INTERACTION WITH OTHER INVESTIGATORS
Over this past grant year, a paper was published in Icarus, describing results
and applications of the laboratory measurements of the millimeter-wave opacity
of ammonia between 7.5 and 9.38 mm, described in previous reports (Joiner et al.,
1989). In addition, we completed a paper describing observations and interpretive
studies of the 1.3 to 3.6 cm Venus emission spectrum (Steffes et al., 1989),
which was also accepted for publication in Icarus. We also submitted updated
summaries of our most recent laboratory measurements for inclusion in the twenty-
third issue of the Newsletter of Laboratory Spec_ro_cgpy for Planetary Science.
We will attend the 21st Annual Meeting of the Division for Planetary Sciences
of the American Astronomical Society the week of October 30 through November 4,
1989. We will present 4 papers (abstracts attached--see Appendix A.) Three of
these papers will address laboratory measurements and interpretive studies of

25
the Venus atmosphere, and one will present results of millimeter-wave studies
of the Jovian atmosphere.
In addition to the radio astronomical observations of Venus and analysis work
conducted jointly with Dr. Michael J. Klein of JPL, we have also worked with Dr.
Michael A. Janssen of JPL regarding models for the Venus atmosphere and the outer
planets, interpretation of microwave emission measurements, and theoretical
models for the absorption spectrum of H2SO4. We have also worked with Dr.
Arvydas J. Kliore of JPL on the reduction and interpretation of data from recent
Pioneer-Venus Radio Occultation Studies as part of our involvement in the
Pioneer-Venus Guest Investigator Program. More informal contacts have been
maintained with groups at the California Institute of Technology (Drs. Duane O.
Muhleman, Kathryn Pierce, and Arie Grossman, regarding interpretation of radio
astronomical measurements of Venus and the outer planets). We have also worked
closely with the Stanford Center for Radar Astronomy (Drs. V.R. Eshleman, G.L.
Tyler, and T. Spilker, regarding Voyager results for the outer planets, and
laboratory measurements), and at JPL (Drs. Robert Poynter and Samuel Gulkis,
regarding radio astronomical observations of the outer planets and Venus). We
have also worked with Dr. Imke de Pater (University of California-Berkeley) by
using out laboratory measurements of atmospheric gases in the interpretation of
radio astronomical observation of Venus and the outer planets. We have also
studied possible effects of the microwave opacity of cloud layers in the outer
planets' atmospheres. In this area, we have worked both with Dr. de Pater and
with Dr. Paul Romani (Goddard SFC).
During the Voyager-Neptune encounter, we supported the Voyager Radio Science Team

26
by providing calculations of the expected atmospheric absorption by gaseous H2S
and NH3 in the Neptune atmosphere, at the Voyager S-Band and X-Band downlink
frequencies. These calculations were used both for pre-encounter operational
planning and post-encounter interpretive studies.
Dr. Steffes has also been active in the review of proposals submitted to the
Planetary Atmospheres Program at NASA(both as a "by-mail" reviewer and as a
memberof the February 1989 review panel) and as a reviewer of manuscripts
submitted to Icarus, the Journal of Geophysical Research, Physics Reports, and
Annual Review of Astronomy and Astrop_sics. We have also continued to serve
the planetary community through the distribution of reprints of our articles
describing our laboratory measurements and their application to microwave and
millimeter-wave data from planetary atmospheres. The results of these
measurements have been used in the mission planning for radio and radar systems
aboard the Galileo and Magellan missions, and more recently, for proposed
experiments for the Cassini mission. Dr. Steffes also participated as a member
of the International Jupiter Watch (IJW) Laboratory/Theory Discipline Team.
Another source of close interaction with other planetary atmospheres principal
investigators has been Dr. Steffes' membership in the Planetary Atmospheres
Management and Operations Working Group (PAMOWG). Travel support for Dr.
Steffes' attendance at PAMOWGmeetings, as well as the November AAS/DPS meeting,
has been provided by Georgia Tech in support of Planetary Atmospheres Research.
Also, in support of Planetary Atmospheres Research, Georgia Tech has provided
a Hewlett-Packard Vectra QS-16 Computing System.
As in the past, we have maintained contact with members of the Georgia

27
congressional delegation, keeping them aware of our work and aware of our
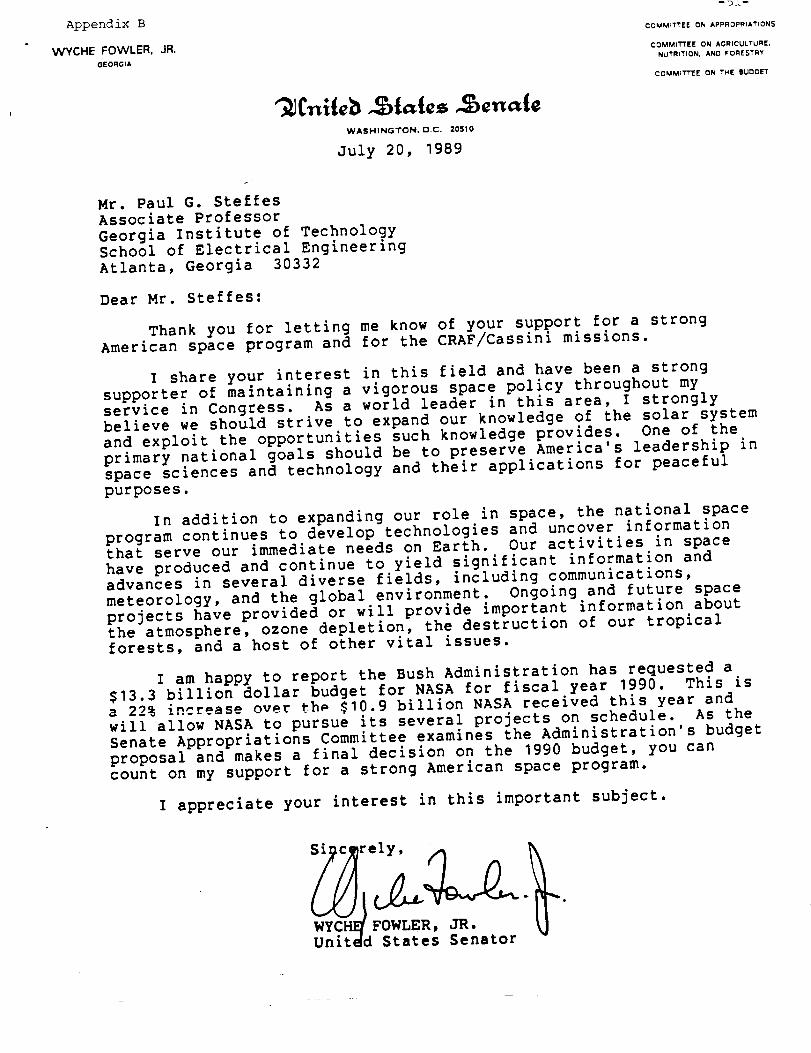
continued support for the solar system exploration program. We were especially
pleased with the support received from Senator Wyche Fowler for the CRAF/Cassini
"new start," after briefing his staff on this issue. (See Appendix B)
V. CONCLUSION
2B
Over the past grant year, we have continued our work with laboratory measurements
and interpretation of the millimeter-wave properties of atmospheric gases
contained in the outer planets. The results of our studies have been significant
in that they indicate that the large opacities predicted by a number of workers
at these wavelengths are indeed incorrect and that a form of the modified Ben-
Reuven formalism for computing the millimeter-wave opacity from ammonia is
correct. In the future, we plan to continue development of our models for Jovian
millimeter-wave emission. We plan to further investigate the effects of the H2S
and NH3 on the calculated emission spectra. We will also evaluate the need for
laboratory measurements of gaseous H2S and other possible liquid absorbers.
Our Venus studies over the past grant year have made it possible for us to
measure the dissociation of gaseous H2SO 4 into SO3 and H20, which will aid in
modeling of the Venus atmosphere, and will make it possible to correct previous
laboratory measurements of the microwave opacity of gaseous H2SO 4. In the next
grant year we intend to develop corrected expressions for the microwave opacity
from gaseous H2SO 4 which will allow a more accurate interpretation of the 13 cm
absorptivity profiles provided by Pioneer-Venus radio occultation studies. We
will likewise complete designs and begin laboratory measurement of the
millimeter-wave properties of liquid H2SO 4.

29
VI. REFERENCE
Ayers, R.P., R.W. Gillet, and J.L. Gras 1980. On the vapor pressure of sulfuric
acid. Geophvs. Res. Lett. 7, 433-436.
Ben-Reuven, A. 1966. Impact broadening of microwave spectra. Phys. Rev. 145, 7-22.
Berge, G.L., and S. Gulkis 1976. Earth-based radio observation of Jupiter:
Millimeter to meter wavelengths. In Jupiter (T. Gehrels, Ed.), pp. 621-692. Univ.of Arizona Press, Tuscon.
Bezard, B., A. Marten, J. P. Baluteau, D. Gautier, J. M. Flaud, and C. Camy-
Peyret 1983. On the detectability of H2S in Jupiter. _carus 55, 259-271.
Briggs, F. H., and P. D. Sackett 1989. Radio observations of Saturn as a probeof its atmosphere and cloud structure. Icarus 80, 77-103.
de Pater, I., and S. T. Massie 1985. Models of the millimeter-centimeter spectraof the giant planets. Icarus 62, 143-171.
Goodman, G. C. 1969. Models of Jupiter's atmosphere Ph.D. dissertation,University of lllinois, Urbana.
Gross, E. P. 1955. Shape of collision-broadened spectral lines. Phys. Rev. 97,395-403.
Helminger, P., R. L. Cook, and F. C. Delucia ]972. Microwave spectrum andcentrifugal distortion effects on H2S. J. Chem. Phys. 56, 4581-4584.
Joiner, J., P. G. Steffes, and J. M. Jenkins 1989. Laboratory measurements of
the 7.5-9.38 mm absorption of gaseous ammonia (NH3) under simulated Jovianconditions. Icarus 81, 386-395.
Larson, H. P., D. S. Davis, R. Hofman, and G. L. Bjoraker 1984. The Jovian
atmospheric window at 2.7 microns: A search for H2S. Icarus 621-639.
Lindal, G. F., G. E. Wood, G. S. Levy, J. O. Anderson, D. N. Sweetnam, H. B.
Hotz, B. J. Buckles, D. P. Holmes, P. E. Dams, V.R. Eshleman, G. L. Tyler, and
T. A. Croft 1981. The atmosphere of Jupiter: An analysis of the Voyager Radio
Occultation measurements. J. Geophys. Res. 86, 8721-8727.
Morris, E. C., and R. W. Parsons 1970. Microwave absorption by gas mixtures at
pressures up to several hundred bars. Astron. J. Phys, 23, 335-349.
Poynter, R. L., and R. K. Kakar 1975. The microwave frequencies, line parameters,
and spectral constants for NH3. Astrophys. J. Suppl. 29, 87-96.
Seiff, A., B. D. Kink, R. E. Young, R. C. Blanchard, J. T. Findlay, G. M. Kelly,and S. C. Sommer 1980. Measurements of thermal structure and thermal contrasts
in the atmosphere of Venus and related dynamical observation: Results from the
four Pioneer Venus probes. J. Geophy. Res., 85, 7903-7933.

3O
Spilker, T. R., and V. R. Eshleman ]988. A new formalism for predicting microwaveabsorption by ammonia based on laboratory measurements under varying conditions.Bull. Amer. Astron. Soc. 20, No. 3, 867.
Steffes, P. G. 1985. Laboratory measurements of the opacity and vapor pressureof sulfuric acid under simulated conditions for the middle atmosphere of Venus.Icarus 64, 576-585.
Steffes, P. G. 1986. Evaluation of the microwave spectrum of Venus in the 1.2to 22 centimeter wavelength range based on laboratory measurements of constituentgas opacities. Astrophysical Journal 310, 482-489, November I, 1986.
Steffes, P. G. and J. H. Jenkins 1987. Laboratory measurements of the microwave
opacity of gaseous ammonia (NH3) under simulated conditions for the Jovianatmosphere. Icarus 72, 35-47.
Steffes, P. G., M. J. Klein, and J. M. Jenkins 1989. Observation of the microwaveemission of Venus from 1.3 to 3.6 cm. Icarus, in press.
Van Vleck, J. H., and V. F. Weisskopf 1945. On the shape of collision-broadenedlines. Rev. Mod. Phys. 17, 433-443.
Zhevakin, S. A., and A. P. Naumov 1963. Coefficient of absorption ofelectromagnetic waves by water vapor in the range 10 microns-2 cm. Radiophys.Quantum Electron. 6, 674-694.

Vll. Key Fiqures
31

-32-
0
g-- -P= _ .t-
O
..ID _"
_c,O >n_
U _7',
• 1=- -I-- I ="
_'_r--
•m c--
r.- e- v-
L-- >,
oI=,..
_ E
__ e" I1.1 0
II
II
I
,,...4
II
Z
II
0
I1
lll I t I t I IIIt I I I I I 1111 i I I I I
III I L, [ ], III]11 1 I
I I
\
\
J II|ll i I l I
I
",,-I
Illll _ I I li IIIIIt I t I
¢0
0
;>,,
_t
u.zo/sq ,dop l O!' do NOIId IOSHV
"'_ _: Absorption of NH3 in o -_-88.34% H2, (. .81% He, 1.85% NH3
mixture (Mixing rGtio:O.0185+_O.O005)Pressure: 2 atm. Temp: 205K
Wavelength (mm)10 g 8
6001 " ' ........ | - ' II II z_ e128188Mr_od.r_ _o_o_, I
_L \ vvw o ,2/%l_r,x,.,_,,,,,
! ! I J I , I f L--_ I
Frequency (GHz)

-34-
O4.1
5...tOI2LEO
U_
l--O
°1...
.p-
c-
OLJ
c--cO
0"3
t--
0 0or- •._:V,
D 0
rD tO
Z "_
E
-r-- U
i=U
5-. (lJ
u_ 0(I,1
L
0
II
01II
2_
0
0
11
ZX
r--
G_
II
X
II
p_
O• _..._
O(h
<
c_
O
OO
I I I I 1 I I
, I I I I I ,
O O O _ 00 LO 0
CO CO _ _ -_
I
: w |
I
1
I
I
I
1
!
_ i _
e¢'_! r,d,
I : I!
I1 1 1
C_
C_
C_
_D
b_
)-0Z
u ."I/ffp Nor,l, dl'lO flV

-35-
i
I
e- r--
I.,,,
E
_kC
--1
-r--
1.1.
I
t¢3
\
\
\
I 1.
i.¢,3¢xl
I
¢-.1
1
t¢-3v-.-t
\\
\\
\
\
m
qI
J
I
¢-1

-36-
F
"_ F
>t-o
L
_V("t
a:;
¢4
a:z
,'.4
ID
ta.
,¢--1
\\
i'M
212
r_
0
zt'xl
I l t 1 I I I I I
-4
OI,LV'8 DNIXIIAI
_3

-37-d,
i t I l I
!-tII
'7,
v--4
E',...)
©
,-2
>.<

-38-
WEIGHTING FUNCTIONS Arbitrary Units
' I t I I
m
c7z
i
_F
...................... 2;:"
.............................................................. 23 GHz
--'A" _'<
. ,-_
'""_ 40 GHz
l0 GHz
I 1 I I !
e-
¢D
- "-,4
rjZ
e-
I e-.__,
! G
[ _..
i <'
g
I
II
t
I

-39-
II iI
("--1II
[.-
II L
X
II(--q
X
II
<
&;,'7
_L_I ....
f
S
->
UIJ_LLLL__I__ IIIII i I t____
f
r
NI
©
_2
0
p-
myjflp NOIid_IOgffV
,_,-,
0
Ur
e-
f_I
f_
"F-o P
o
c_
C'q
©
_ F
.x: I
i
0
_ ,
o C
(lJ
I I 1 I
J
-40-
E
L_Z
>
u_. I_)I B_LLV'd_ffl_L SS.'qNJ.HDI"d_I

VACUUM GAUGES/PRESSURE GAUGES
P1 P2
N,q'ROGEN EXHAUST
SOURCE"_REGULATOR
vacuum_/r/L _ -PUMP j
1
FLASK
CONTAININGLIQUIDH2SO4
/
II
!
)NITROGEN
BUFFER
II
IL___J
VACUUk4 CHAMBER(GLASS)I 'L
--qlII
J ..--THERMOCOUPLE
IIJ
TEMPERATURE CHAMBER
(600 K l,_kX)
Figure # i0 : Laboratory apparatus used to measure the dissociation
factor D, for H_O 4 above liquid sulfuric acid .
O-RING
INLET/OUTLET
/\; \
TOP PLATE
CL_MP
THERMOCOUPLE
INLET
_X_SUPPORTY
Figure # Ii : Cross section view of the vacuum chamber used in our
apparatus .

?)
m
r-
v
<
F-ro<
i
STEFFES
"k/
///
/.-/ _/ -_ / ±
--_i THIS WORKT .-.>
-- ///_
/" y/
I /
_L/
I_ iiltl:lli
470I I t I I I t I t ] I t i
520 570
TEMPERATURE(K)
i t i I
62O
Figure # 12 : Vapor pressure of gaseous H_O 4 (99%) above liquid
sulfuric acid as a function of temperature. The
illustrated points are from laboratory measurements.
Vapor pressure expression (solid line) from Steffes
(1985) is compared with a best-fit expression for
our measurements (dotted line). Error bars for
pressure and temperature are shown.

-44-
II !
A-
_q
m
<ur
THIS _%O RI,2
J
- •/
i- i
-0-
/_2
/ !
%/-1-
j ,---O-
iii_rili!jUllllllllJtlJ;rt*_t
62O52O 57O
TEMPERATURE (K)
Figure # 13 : Vapor pressure of gaseous H_O 4 (95.9%) above liquid
sulfuric acid as a function of temperature.
Illustrated points are from laboratory measurements.
Dotted line is a best-fit expression for our
measurements. Error bars for pressure and
temperature are shown.

i
p-
b..
M.
-%;
10 -__+70
/
i _./.w
AYERS --..
ET AL "-%./
/
//1
/
/ i
/ /
/
STEFFES -.
THIS _VORI,2
tt f
/
(95.9_)
'''''''''"'soo " '62o4.-
TEMPERATURE (K)
Figure # 14 : Best-fit expression (dotted line) for our measured
partial pressure of .H_O 4 as a function oftemperature in comparlson with vapor pressureexpressions from Ayers et, el. (1980) and Steffes(1985) .
--A6._iv

-4'7-
_>-
!i+E
'r--
oi,_
r,-• i
tl-I0 _
('X] L
-,,"-I
"0
I
_t '+-o
i
!i:+U_"I _ 0
' (3
°I_.<.,-,_r-.+ <.-+
U •(%; rL
t+-- I,'_
0,. o
_|0 e"OIP" "_'" _"_
+-- ,1-+ I= _"1
• r- .1_ Io_-- _ p--•I_ ,,-- I _ 0,- i,.-I_-"' _"(_J l -I-- • .,C::
4,-+IV _ _ 0
Ol,_ .._ . OJ
, i
3c4p
4_
E
++o
£
En
3
ii
_#
cO
E
=

-48-

-50-
liD
Io
_g
!I
c,J).o_-r
o_ '.Ll
fJo-_-
'..I.
o_
,-g
t_4o
x-,-I
ill
2
(
£I,(
Ec:"
I,
o1,_
"r.
¢
I--
el- (a_ _.
ul qJqJ U
qJ C_.e'v')
V1
>_L U_
.f.3 ,1__J-_
=_ I
e.-4j"10 0 e-
oZ
::3
_,_ o_=-... 0 _
r_c_ L0 ._
I'_ .P"l_ I,,. e"
e- 0 E
7
1
>o ;;.
.¢.
- o.
3-
e_
.1
I ;o
,i
_' u't.11:_ iii
J
Appendix B
WYCHE FOWLER. JR.GEORGIA
WASHINGTON, D.C. 20510
July 20, 1989
--.nr--
COMMITTEE ON APPROPRIATIONS
COMM_t'rTEE ON AGRICULTURE.
NUTRITION, AND FOREt_"rRV
COMMITTEE ON THE BUDGET
Mr. Paul G. Steffes
Associate Professor
Georgia Institute of Technology
School of Electrical Engineering
Atlanta, Georgia 30332
Dear Mr. Steffes:
Thank you for letting me know of your support for a strong
American space program and for the CRAF/Cassini missions.
I share your interest in this field and have been a strong
supporter of maintaining a vigorous space policy throughout myservice in Congress. As a world leader in this area, I strongly
believe we should strive to expand our knowledge of the solar system
and exploit the opportunities such knowledge provides. One of the
primary national goals should be to preserve America's leadership in
space sciences and technology and their applications for peaceful
purposes.
In addition to expanding our role in space, the national space
program continues to develop technologies and uncover information
that serve our immediate needs on Earth. Our activities in space
have produced and continue to yield significant information andadvances in several diverse fields, including communications,
meteorology, and the global environment. Ongoing and future spaceprojects have provided or will provide important information about
the atmosphere, ozone depletion, the destruction of our tropical
forests, and a host of other vital issues.
I am happy to report the Bush Administration has requested a
$13.3 billion dollar budget for NASA for fiscal year 1990. This isa 22% increase over thp $10.9 billion NASA received this year and
will allow NASA to pursue its several projects on schedule. As the
Senate Appropriations Committee examines the Administration's budget
proposal and makes a final decision on the 1990 budget, you can
count on my support for a strong American space program.
I appreciate your interest in this important subject.