Embed Size (px)
Citation preview

CMS Week, CERN, 2002 R M Brown - RAL 1
Performance Characteristics of Production VPTs
R M Brown, B W Kennedy, P R Hobson
(with crucial input from D J A Cockerill, M Raymond, C Seez)(and thanks to M Sproston, A L Lintern, J H Williams and
K W Bell for the RAL Measurements)
4 December 2002

CMS Week, CERN, 2002 R M Brown - RAL 2
Outline of Talk Delivery status Test Status Specification Test set-up Test Results Radiation levels Face plate irradiation VPT Performance Anomalous behaviour Conclusions

CMS Week, CERN, 2002 R M Brown - RAL 3
Photodetectors: end caps
•B-field orientation favourable for VPTs (Axes: 8.5o < || < 25.5o wrt to field)
•More radiation hard than Si diodes (with UV glass window)
• Gain 8 -10 at B = 4 T
• Active area of ~ 280 mm2/crystal
• Q.E. ~ 20% at 420 nm
= 26.5 mm
MESH ANODE
Vacuum Phototriode (VPT):
Single stage photomultiplier tube with fine metal grid anode (10 m pitch)
CMS Week, CERN, 2002 R M Brown - RAL 4
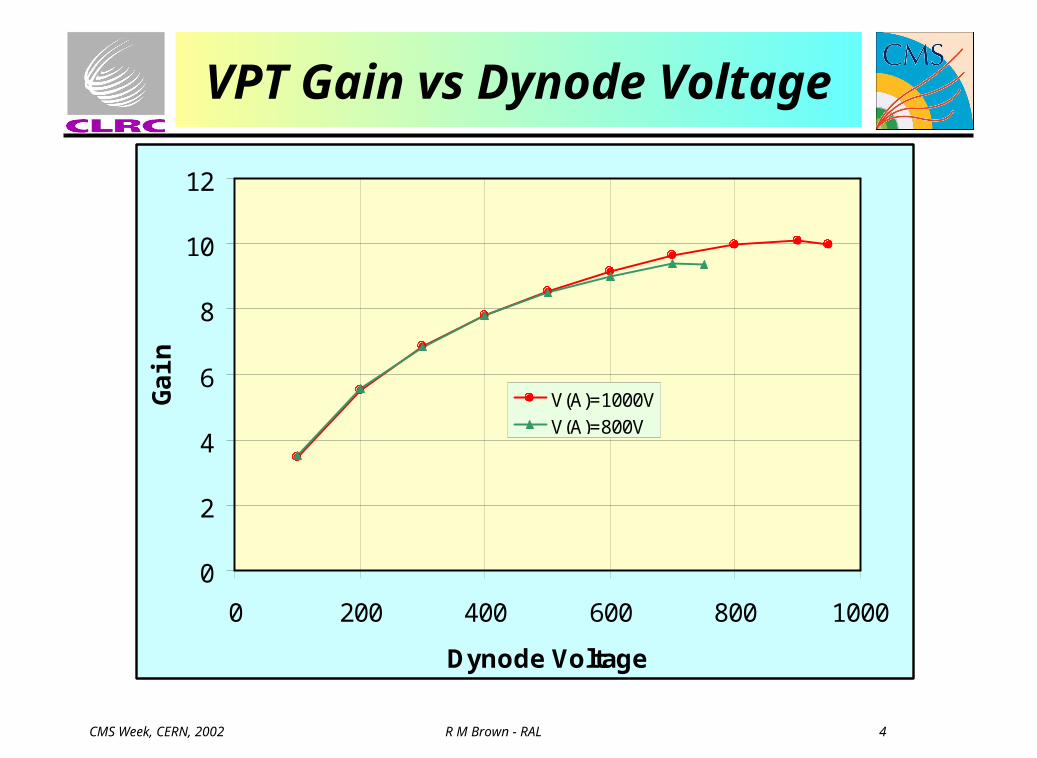
VPT Gain vs Dynode Voltage
0
2
4
6
8
10
12
0 200 400 600 800 1000
Dynode Voltage
Gai
n
V(A)=1000V
V(A)=800V

CMS Week, CERN, 2002 R M Brown - RAL 5
Technical specification
Response in a magnetic field:
There shall be a complete absence of internal discharge at normal operating voltage, in zero field, and for magnetic fields between 1 and 4T, at angles in the range 0o to 26o to the VPT axis.

CMS Week, CERN, 2002 R M Brown - RAL 6
Delivery Status
0
2000
4000
6000
8000
10000
12000
14000
16000
# VPT
Date
VPT production
Planning 500 1000 1600 2300 3300 4300 5300 6300 7300 8400 9500 10500 11500 12600 13700 14800 15500
Delivered 500 1200 1900 2600 3200
Q1 2001
Q2 2001
Q3 2001
Q4 2001
Q1 2002
Q2 2002
Q3 2002
Q4 2002
Q1 2003
Q2 2003
Q3 2003
Q4 2003
Q1 2004
Q2 2004
Q3 2004
Q4 2004
Q1 2005
Q2 2005
Q3 2005
Q4 2005
%
18%21%

CMS Week, CERN, 2002 R M Brown - RAL 7
Characterisation of VPTs
4.0T Solenoid at Brunel 1.8T Dipole Magnet at RAL
Detail of RAL test Cell
Perspex diffuser plate with LEDs at corners. (Red circle indicates effective VPT diameter)
All VPTs are measured at 0 B 1.8T and -30o 30o at RALSample VPTs are measured at B =4.0T and = 15o at Brunel

CMS Week, CERN, 2002 R M Brown - RAL 8
Acceptance testing status
Ordered 500+15000 = 15500
Delivered 500+2700 = 3200
Visual inspection 500+2700 = 3200
Tested up to 1.8T 500+2200 = 2700
Tested at 4T 100+165 = 265
Faceplate irradiations 17 batches (36 faceplates)

CMS Week, CERN, 2002 R M Brown - RAL 9
Delivery and testing vs time

CMS Week, CERN, 2002 R M Brown - RAL 10
Determining the grid orientation
The result of the ‘’ scan depends on the ‘’ orientation of the grid. (Not fixed in prodn)
is determined during visual inspection. (Laser interference pattern)

CMS Week, CERN, 2002 R M Brown - RAL 11
Anode response vs angle (1.8T)
Arrows indicate angular range covered by EE
CMS Week, CERN, 2002 R M Brown - RAL 12
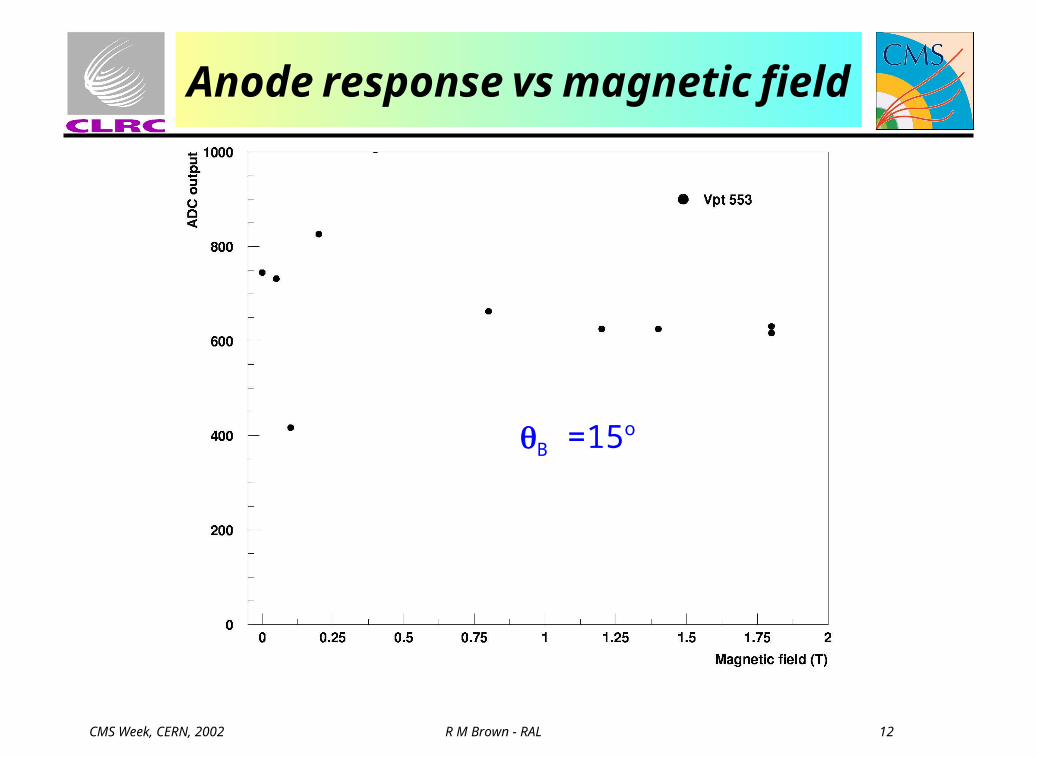
Anode response vs magnetic field
B =15o

CMS Week, CERN, 2002 R M Brown - RAL 13
Anode sensitivity
86% have18< A< 40 e/MeV
A

CMS Week, CERN, 2002 R M Brown - RAL 14
Normalisation of RAL Test Set-up
2002 2001 Difference
18.7 18.9 -1.0%
20.3 20.1 +1.4%
19.9 19.8 +1.0%
15.9 16.1 +0.8%
18.8 22.8 -20.9%
Estimated yield (e/MeV)For 5 prototype RIE tubes
‘Absolute yield’ estimatedfrom 1999 test beam run in H4
using prototype VPTs from ET, Hamamatsu and RIE.

CMS Week, CERN, 2002 R M Brown - RAL 15
RAL/RIE Correlation
Anode sensitivity (RAL) (pulsed, B=1.8T)
versus
Photocathode-efficiency x Gain (RIE)
(dc, B=0T)

CMS Week, CERN, 2002 R M Brown - RAL 16
Relative gain at 4T
Production tubes
0
10
20
30
40
50
60
70
0.8 0.85 0.9 0.95 1 1.05 1.1 >1.1
Relative 4T/0T pulsed gain (upper bin edge)
Nu
mb
er
in b
in
Passed

CMS Week, CERN, 2002 R M Brown - RAL 17
Doses and neutron fluences
Integrated dose (kGy) and neutron fluence (x1013 cm-2) for L = 5x10⁵ pb-1 (~10 yrs)
Black: Dose in the Crystals at the position of the shower maximumBlue: Dose behind the crystals at the position of the photodetectorsRed: Neutron fluences behind the crystals
0.20.350.5
3
2050
1.22
5
70
HCAL Barrel
ECAL Barrel
ECAL Endcap

CMS Week, CERN, 2002 R M Brown - RAL 18
Faceplate irradiationYC-49 Batch 31226b
20.8 kGy dose
-0.02
0
0.02
0.04
0.06
0.08
0.1
300 400 500 600 700 800
Wavelength (nm)
Ind
uc
ed
ab
so
rba
nc
e
91.4% transmission of PbWO4 spectrum after 20.8 kGy
Radiation Hardness: Sample faceplates shall, neglecting surface reflection losses,
transmit at least 90% of PbWO4 light, following a dose of 20 kGy and exposure to a
fluence of 5x10¹⁴ fast neutrons cm-2.
CMS Week, CERN, 2002 R M Brown - RAL 19
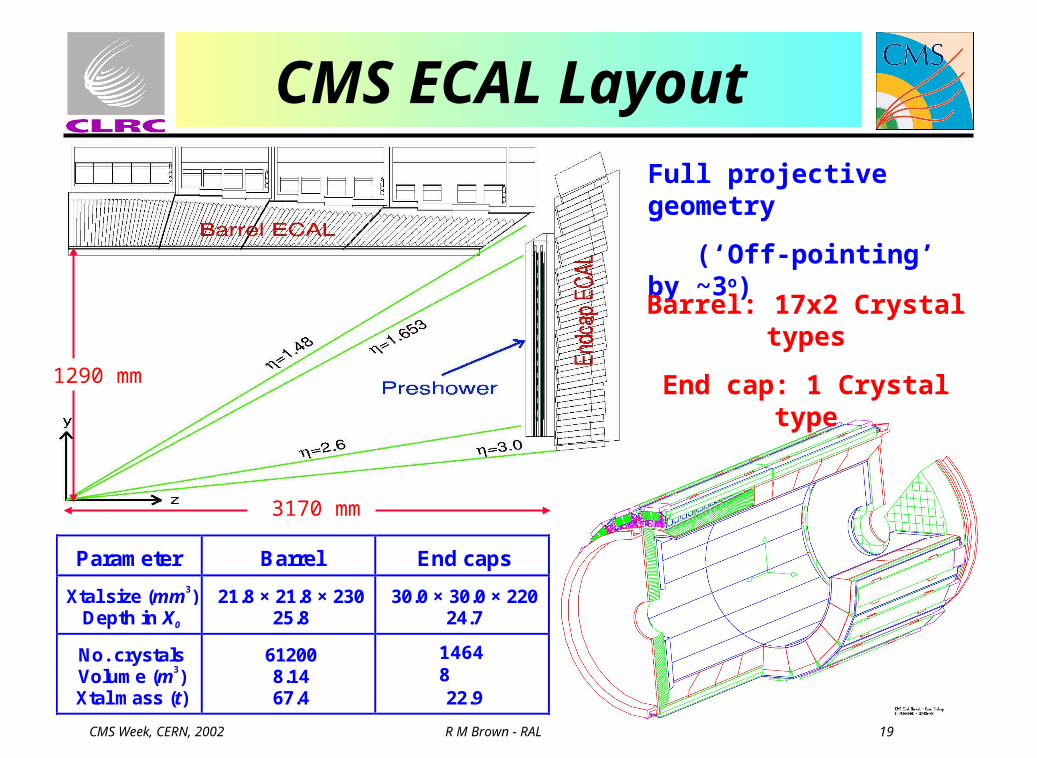
CMS ECAL Layout
3170 mm
1290 mm
Parameter Barrel End caps
Xtal size (mm3)Depth in X0
21.8 × 21.8 × 23025.8
30.0 × 30.0 × 22024.7
No. crystalsVolume (m3)Xtal mass (t)
612008.1467.4
146642.7722.9
Full projective geometry
(‘Off-pointing’ by ~3o)
Barrel: 17x2 Crystal types
End cap: 1 Crystal type
14648

CMS Week, CERN, 2002 R M Brown - RAL 20
Transverse Noise
Analysis by Chris Seez et al:
‘Transverse noise’ ETnoise = Enoise x sin
Allows for light loss in PWO (dose vs ),etc
Exploits variation in VPT response to achieve uniform ET
noise after ‘sorting’
But assumes Response A 34 e/MeV
(28 e/MeV more realistic)
Coverage27%
29%
19%
12%
11%
2%

CMS Week, CERN, 2002 R M Brown - RAL 21
Possible noise improvements for endcapif reduce dynamic range requirement to 1500 GeV
Cpf -> Cpf/2, Rpf -> 2.Rpfcharge amp. gain doubled and subsequent noise sources less significant
Gain RG Diff. stage gain
Energy range [GeV]
Noise [electrons]
Energy range [GeV]
Noise [electrons]
32 20 8 0 – 94 3166 0 – 47 2409
8 20 2 94 – 375 3351 47 - 188 2517
4 40 2 375 - 750 3934 188 – 375 2785
1 80 1 750 – 3000 7478 375 – 1500 4694
3 TeV fullscale
1.5 TeV fullscale
Noise simulation of ‘MGPA’(From talk by Mark Raymond)

CMS Week, CERN, 2002 R M Brown - RAL 22
Anomalous behaviour at 1.8T

CMS Week, CERN, 2002 R M Brown - RAL 23
Response vs time

CMS Week, CERN, 2002 R M Brown - RAL 24
Anomalous behaviour at 4T

CMS Week, CERN, 2002 R M Brown - RAL 25
Summary VPT Production is well underway (>20% delivered on schedule)
RAL capacity for testing at 1.8T is adequate and allows for some re-testing if required
Batch VPT testing at 4T and faceplate irradiation checks progressing smoothly at Brunel
The measured performance of the VPTs matches the EE design objectives, but ‘sorting’ will be required to accommodate the spread in anode response
Anomalous behaviour has been observed in some tubes at certain angles in a high magnetic field. This is under investigation by RIE