Embed Size (px)
Citation preview
Earnings Premiums and Penalties for Self-Employment and Informal Employees Around the World
DRAFT, PLEASE DO NOT QUOTE: January 2015
T. H. Gindling (UMBC), Nadwa Mossaad (UMBC) and David Newhouse (World Bank)
Abstract
Using household survey data from 73 countries and multiple years in the World Bank’s International Income Distribution Database (I2D2), this paper estimates for each country and year: (a) the proportion of workers who are non-professional own-account workers, employers or professional own-account workers, informal sector employees and formal sector employees and (b) the earnings premium or penalty associated with the two types of self-employment and informal sector employment.
1
I. Introduction
A defining characteristic of labor markets in developing countries is the high proportion of workers who are self-employed or work in the informal sector. Despite a vast literature, there is still little consensus on the extent to which self-employed and informal sector workers are in those sectors because they are excluded from formal sector employment or because, based on pecuniary or non-pecuniary factors, they choose to be in those sectors. Earnings penalties for self-employment and informal employment are often interpreted as evidence that workers are in those sectors because they are excluded from higher-paid formal employment. Many studies have examined earnings differences between informal and formal employment and self-employment and wage employment for individual countries or for some regions of the world such as Latin America. However, there is very little comparative literature on how and why these earnings gaps differ across countries around the world.
This paper uses data from 73 countries and multiple years from a comprehensive set of harmonized household surveys, the World Bank International Income Distribution Database (I2D2), to estimate: (a) the proportion of workers who are non-professional own-account workers, employers or professional own-account workers, informal sector employees and formal sector employees and; (b) the earnings premium or penalty for non-professional own-account workers, employers and professional own-account workers, and informal sector employees. The estimated premium/penalties for each country/year are from Ordinary Least Squares estimates of wage equations that control for basic worker characteristics such as age, education, and gender, as well as industry of work.
This study address the following questions: What proportion of workers fall into the following categories: non-professional own-account workers, employers and professional own-account workers, informal employees and formal employees? How does the proportion of workers in each category change as countries develop? How does the proportion of workers in each category differ across countries and regions? Do workers appear to earn an earnings premium or pay an earnings penalty for self-employment and informal sector employment? Is there a difference between the self-employed who are employers and professional own-account workers vs. non-professional self-employed workers. How does the estimated self-employment earnings penalty or premium change as countries develop? How do estimates of this premium or penalty vary across countries and regions? How do these penalties or premiums differ between types of workers within countries.
We find that approximately 50% of workers in low income countries are non-professional own-account workers and that the majority of the rest are informal employees. Fewer than 10% are formal employees, and only 2% of workers in low income countries are employers or professionals. As countries develop, the proportion of workers who are formal employees, employers and professionals increases, while the proportion of workers who are non-professional own-account workers falls. In high income countries
2
only 7% of workers are non-professional own-account, approximately 4% are employers and professionals, and almost 90% are employees.
Regionally, the proportion of self-employed is smallest in the developing economies of Europe and Central Asia. Our most comprehensive estimate is that approximately 95% of workers in Europe and Central Asia are wage and salaried employees, although half of these are informal employees. This is even higher than the proportion of workers who are employees in high-income European countries, and compares to 68% of workers who are employees in Latin American and the Caribbean.
Across all regions and income levels, non-professional own-account workers and informal sector workers face an earnings penalty compared to formal employees. This penalty is statistically significant in all regions except for the developing economies of Europe and Central Asia (where the penalty is small and often statistically insignificant). Both the non-professional own-account and informal earnings penalties are small (and often insignificant) in low income countries, and these penalties increase as a country’s GDP increases. The earnings penalties for self-employment are largest in high income countries.
On average across the world, employers and professional own-account workers earn a premium compared to employees, although there are important differences across countries and between men and women. Earnings premiums for employers and professionals are largest for men in middle-income Latin American countries. On the other hand, in no region of the world do women employers and professionals earn a statistically significant premium compared to employees. In addition, neither male nor female employers and professionals earn premiums in either high income or developing Europe and Central Asia. It appears that there is something about Latin America that favors employers and professionals (there are more of them and they earn premiums vs. formal employees), while employers and professionals do not appear to be favored in Europe and Central Asia (where there are fewer of them and they do not earn premiums vs. formal employees). It is possible that different regulations and laws in the two regions explain the difference. We explore this possibility in a companion paper.
Earnings premiums for male employers and professionals are evidence consistent with the hypothesis that men in these categories have a comparative advantage in self-employment, or are being compensated for the higher costs and risks of self-employment compared to wage and salaried employment. The lack of earnings premiums for female employers and professionals suggests that something is keeping women from taking advantage of this comparative advantage. One possibility is that because women are primarily responsible for unpaid domestic work, women are willing to accept lower earnings as employers and professional own-account workers in compensation for the flexibility in hours and location of work (while men are not).
Earnings penalties for non-professional own-account workers and informal employees are consistent with labor market segmentation as an explanation for the high levels of informality and self-employment in developing countries. In the labor market segmentation view self-employment is prevalent in low-income economies because most
3
workers are excluded from the formal economy, and the formal economy is incapable of providing enough good, high-wage jobs for everyone who wants them. As countries develop, the proportion of workers who are self-employed falls and the wage differential between the self-employed and employees should eventually disappear. While earnings penalties for informal employees and non-professional own account workers in middle-income countries can be seen as evidence in favor of the labor market segmentation hypothesis, the finding that earnings penalties for non-professional own-account and informal sector workers are smallest and statistically insignificant in the lowest income countries is not. Nor is our finding that these penalties increase as countries develop.
We find that as the GDP per capita of a country increases, the earnings of formal employees increases relative to employers and professionals, non-professional own-account workers and informal employees. As noted, this is not consistent with a labor market segmentation explanation for earnings penalties for informal employees and non-professional own-account workers. We highlight two other hypotheses that are consistent with the trend that the earnings of formal employees relative to self-employed and informal employees increases with GDP per capita. One is a dualistic economy model where formal sector firms in low income countries have low productivity because a lack of credit, lack of reliable inputs, lack of export markets and a lack of demand does not allow them to take advantage of economies of scale. For these reasons, formal sector firms in low income countries will be less productive. As countries develop, demand increases, credit and export markets develop, and therefore the productivity of formal sector firms increases. The increase in productivity allows firms to share rents with workers, driving up the earnings of formal employees relative to informal employees and self-employed workers.
The second hypothesis is that self-employed workers may be willing to accept lower earnings as compensation for increased flexibility in terms of hours and location of work. This is likely to especially true for women who are responsible for the majority of unpaid domestic work such as child care or elder care. Self-employment may be valued because it provides the flexibility that allows for both domestic work and paid employment, whereas wage and salaried employment with inflexible working hours does not. The compensating differential explanation suggests that the self-employment earnings penalty will be particularly large in more developed countries, where the opportunity cost of time is higher and therefore the flexibility of self-employment will be valued more. Evidence supporting this last hypothesis is that penalties for self-employment are larger for women than for men, and that the additional penalty that women pay for self-employment over men increases as GDP per capita increases.
II. Literature Review
A. Theoretical
In a standard neo-classical model in which labor markets are perfectly competitive, labor
4
is free to move between sectors, and workers maximize earnings, identical workers would earn the same amount whether they are wage employees or self-employed workers. In a competitive labor market, this will be true even though firms offer facilities that boost worker productivity, such as access to capital, export markets, and the opportunity to specialize. Assuming diminishing returns to labor in wage employment, the free movement of labor will equalize earnings between wage employees and the self-employed.
What are departures from the competitive labor market model that could lead to an observed self-employment penalty or premium? One possibility is that the model is correct, but that empirically the measures of the compensation of self-employed or wage employees are not measured properly. Absolute estimates of wage gaps are inherently imprecise due to the difficult of measuring self-reported profits and of valuing non-wage benefits. For example, self-employed workers might systematically under-report earnings, which could lead to an observed self-employed penalty even when none exists (Hurst, Li and Pugsley, 2010). On the other hand, the self-reported earnings of employees include only returns to labor, while the self-reported earnings of the self-employed may also include returns to capital, as well as the returns to the risk of entrepreneurship. Failing to account for this may overestimate the self-employment earnings premium. Furthermore, wage employees often do not include the value of non-wage benefits, such as firms’ contribution to pensions, sick pay, severance pay, and health care, in their reported earnings. In the competitive labor market described above, self-employment earnings would include compensation for these foregone non-wage benefits (Meghir et a. 2012), which would lead the estimates to overestimate the self-employment premium.
Other explanations for a persistent earnings differential between the self-employed and employees must explain why workers fail to move from one sector to another in response to a systematic earnings difference between sectors. The traditional view of self-employment in developing economies associates self-employment with informality within a segmented or dualistic labor market where formal sector jobs are restricted by minimum wage, tax laws and labor market regulations that limit the growth of employment in the formal sector. Key to this view is that either government regulations, especially labor market regulations, or efficiency wages, limit the availability of formal sector employment and make it difficult for non-formal sector workers to compete for formal sector jobs. That is, some workers are “excluded” from the formal sector by labor market regulations or efficiency wages. Limiting competition from these “excluded” workers keeps the wages of formal sector workers above the equilibrium wage in the excluded sectors, resulting in wage penalties for the excluded workers. The dualistic labor market view subscribes to the notion that informality stems from an imbalance between high population growth and the slow growth of “good” formal jobs (Harris and Todaro, 1970; Fields 2005, 2009; Tokman 1978; De Mel et al. 2010;). This view argues that workers unable to find adequate employment opportunities in the formal sector are forced to take employment as self-employed workers in the low paid, marginal informal sector.
5
One distinguishing feature of labor market segmentation is earnings differentials; an earnings gap between informal sector workers and equally-qualified formal wage and salaried employees which has often been interpreted as a measure of the degree of labor market segmentation (Schultz 1961; Becker 1962; Mincer 1962). For example, Fields (2009) notes, “The distinguishing feature used by Nobel laureates Arthur Lewis (1954) and Simon Kuznets (1955) as well as other dual economy modelers is the fact that workers earn different wages depending on the sector of the economy in which they are able to find work.” In this view, self-employment and informality are prevalent in low-income economies because the formal economy is incapable of providing enough good, high-wage jobs. As countries develop, the proportion of workers who are self-employed and informal employees falls, and the wage differential between the self-employed and informal employees vs. formal employees should eventually disappear. Typically, in this view regulations rather than efficiency wages are the cause of labor market segmentation, and countries with more restrictive regulations (especially labor market regulations) should exhibit bigger self-employment and informal wage penalties.
An alternative explanation for why there might be a self-employment earnings penalty that does not rely on segmented labor markets is that workers maximize utility rather than earnings, leading to systematic compensating wage differentials. For example, if self-employment is more desirable than wage employment for reasons unrelated to earnings, such as greater autonomy and flexibility, we would expect to see a self-employment earnings penalty. Unlike the labor market segmentation explanation for self-employment wage penalties, the compensating differential explanation suggests that the self-employment wage penalty will be particularly large in more developed countries and among better educated workers, where the opportunity cost of time is higher and therefore the flexibility of self-employment will be valued more.
A third factor that could lead to an observed earnings differential between the self-employed and informal employees vs. formal employees is self-selection (Roy, 1951; Heckman, 1979). For example, some workers may have a comparative advantage in self-employment and therefore choose to be self-employed, while others may have a comparative advantage in wage employment and therefore choose to be employed in firms. Our measured self-employment earnings differential compares those who selected self-employment with those who selected wage employment. However, this would lead to an upwardly biased estimate of both the earnings of both the wage and the self-employed, and so it is unclear how this would affect the observed self-employment penalty.
High adjustment or entry costs into self-employment could also contribute to an observed self-employment premium because the future earnings of self-employed workers would need to compensate for these costs. One such adjustment cost is the initial investment needed to set up a small business, often paid for through credit. If credit markets are imperfect and it is difficult to obtain credit, then self-employed workers must be paid more than they could get as employees in order to compensate them for the high costs of credit. On the other hand, in low-income countries much self-employment may require little capital, while searching for higher-paid wage employment may involve moving
6
location and other expensive search costs.1 For those facing credit constraints, starting a low-level business as a petty trader or farmer may entail less upfront cost than searching for a wage job. In this case, imperfect credit markets would create a self-employment earnings penalty.
Another adjustment cost could be associated with complying with the regulations and permits needed to start your own business. These costs can be substantial in many developing countries (de Soto, 1989). If there are regulatory and other costs to becoming self-employed that limit access to self-employment, then self-employed workers will be paid more to compensate for these additional costs, causing an observed self-employment wage premium. For example, if it is costly and time consuming to obtain all of the necessary permits and permissions to work as self-employed (i.e. a more regulated economy), or if taxes are higher for the self-employed than for employees, then self-employed workers may be paid more than they could get as employees in order to compensate them for the high costs of entry. Note that the self-employed would need to be compensated for these regulatory costs even if they attempt to avoid them, if there are costs to violating these regulations.
A final possible reason why wage employees may earn more than similar self-employed workers is that workers may successfully bargain for a portion of the quasi-rents earned by firms. Several studies have identified non-competitive-rents as an important determinant of inter-industry wage differentials.2 Most recently, Abowd, et al (2012) find that shared quasi-rents account for a large percentage inter-industry wage differentials in the United States and France. Based on wage bargaining models that allow for on the job search (Cahuc, et al, 2006, Mortenson, 2003), they posit that the wage firms pay employees is the sum of the opportunity cost of wage employment plus the workers’ share of quasi-rents. Under the assumption that comparable workers’ profits in self-employment is an approximation of wage workers’ opportunity cost, the self-employment earnings penalty will be determined by the bargaining power of workers and the size of the quasi-rent. That is, the self-employment earnings penalty will increase if the relative bargaining power of employees increases or if firms’ quasi-rents increase.
The bargaining power of workers, and therefore self-employment wage penalties, could be increased by labor market institutions such as unions, or the presence of efficiency wages. Van Reenan (1996) focuses on the role of innovation and increased labor productivity in generating quasi-rents, which firms can then “share” with workers as efficiency wages. That study presents strong evidence that in British firms workers in firms that adopt more innovative and more productive technologies earn more than identical workers in other firms. It argues that more productive firms allocate part of their “quasi-rents” from innovation to workers in the form of higher wages. To the extent firms share quasi-rents with workers, this would contribute to a self-employment wage penalty.
1 The costs of searching for wage employment include information costs. A lack of information may help to create a self-employment wage penalty. For example, self-employed farmers in rural areas in developing countries may not be aware that they could earn more in urban areas (Bryan, Chaudhuri, and Mobarak, 2012, Jensen 2012).2 See, among others, Dickens and Katz (1987), Krueger and Summers (1988), and Mortenson (2003)
7
These penalties would be larger in countries where firms are more productive, and therefore have more quasi-rents to share, and/or in countries in which labor market institutions favor workers in the wage bargaining process.
In one traditional dualistic model of economic development, the formal sector in the least developed countries is small (and self-employment and informal employment are large) because lack of demand, lack of credit, reliable inputs, and export markets keep scale and productivity low for formal sector products (see Lewis, 1954 and La Porta and Schleifer, 2014). For this reason, formal sector firms in low income countries will be less productive. Since firms in low-income countries tend to be less productive than those in more developed countries, quasi-rents and therefore self-employment penalties would likely be smaller for workers in low-income countries. As demand increases for domestic products and credit, input and export markets expand, the scale of production and productivity increase in the formal sector. As countries develop, firms not only earn more quasi-rents, but labor market institutions may also become more effective in increasing workers’ bargaining power. Both of these factors will lead to increased earnings for formal sector employees relative to the self-employed and informal sector workers.
B. Empirical
This paper contributes to the literature on the estimation of the magnitudes and causes of earnings differentials between self-employed and informal sector employees relative to formal sector wage and salary employees. Many of these studies examine wages in middle-income countries and conclude that workers in the informal sector earn less than equally qualified employees in the formal sector (i.e. Heckman and Hotz 1986; Gindling, 1991; Basch and Paredes-Molina, 1996; Günther and Launov, 2006). However, not all informal sector workers are self-employed, and the self-employed may be very different from informal sector employees. In a review of the evidence from Latin America, Perry et al. (2007, p.6) concludes that the self-employed voluntarily opt out of the formal sector, while informal salaried workers are queuing for more desirable jobs in either the formal salaried sector or as self-employed workers.
When researchers estimate formal-informal wage differentials separately for informal sector employees and self-employed workers, they typically find different results for the two groups. Compared to formal sector wage and salary employees, Arias and Khamis (2009) find an earnings penalty for informal wage and salary employees but an earnings premium for self-employed workers in Argentina. Nguyen et al. (2013) find the same thing in Vietnam. Bargain and Kwenda (2011) find similar results in Brazil and Mexico. However, for South Africa they find that both informal sector employees and self-employed workers pay an earnings penalty, relative to formal sector employees. Maloney (1999) finds that workers who transition from wage and salary employment into self-employment in Mexico benefit from higher earnings, while workers who transition into informal sector wage and salary employment experience a decline in earnings. Saavedra and Chong (1999) find an earnings penalty for informal sector employees, but
8
no difference between the wages of informal self-employed workers and formal sector employees.
COMMENT: We need a broader review of cross-country comparisons of self-employment and informal earnings differentials.
In summary, while the literature on wage differentials points to consistent earnings penalties for informal sector wage and salary employment, this is not the case for self-employment relative to wage and salaried employment. Most published studies conclude that self-employed workers do not earn less than equally qualified formal sector wage and salaried employees. However, most of these studies are from middle income and/or Latin American countries; there are few studies of self-employment earnings penalties or premiums in low-income countries outside of Latin America. In at least one African country (South Africa), a published study has shown that self-employed workers pay an earnings penalty. Our paper contributes to the literature on informal and self-employment wage penalties or premiums by estimating and comparing these earnings differentials for a wider range of developing and high income countries than currently exists in the literature.
III. Data
The data source for this paper is a data base of micro-level household surveys harmonized by the Development Economics Research Group of the World Bank, the International Income Distribution Database (I2D2).3 This database consists of nationally representative labor force surveys, budget surveys or living standards measurement surveys. The main advantage of these household surveys is that they provide information on the earnings of the self-employed as well as of wage and salary employees, in addition to other relevant information on individual socioeconomic characteristics. The data include three sets of consistently defined and coded variables: (i) demographic variables, (ii) education variables, (iii) labor force variables.
Not all variables are available in all countries and years. In our analysis, we only use surveys where we can identify whether the worker is self-employed or a wage and salary employee, also where data is collected on the earnings of both the self-employed and wage and salaried workers. 4 In most countries, data are available for multiple years. Our full sample consists of 347 surveys (country/year combinations), representing 73 countries, from 1980 to 2013. Within each country, we limit our samples to the working age population, 15-65 years old. The full country–year combinations available for our analysis, as well as the estimated earnings premiums(+)/penalties(-) for each country/year observation, are listed in the appendix in table A1.
3 The database is an updated version of that described in Montenegro and Hirn (2009). Version 4 of the I2D2, which was released in October 2013, was used. 4 Self-employed workers include those who self-identify as either an own account worker or an owner/employer. We use the ILO definition of own account workers as “workers who, working on their own account or with one or more partners, hold the type of job defined as a self- employed job, and have not engaged on a continuous basis any employees to work for them during the reference period”
9
We begin by examining the earnings differentials between self-employed workers and all wage and salaried employees. Self-employed workers include both own-account workers and employers. We are able to examine differences between self-employed workers and employees using 347 household surveys from 75 countries. 62% of these surveys are from Latin America, and over 90% of these surveys are from either Latin America or Europe and Central Asia.
We recognize that within the self-employed there may be dramatic differences between employers, professional or technical own-account workers (i.e. lawyers, doctors, accountants, etc.) and non-professional own-account workers. Therefore, where possible, we separate self-employed workers into two categories: (i) non-professional own-account workers and (ii) employers and professionals. We are able to examine earnings differences between these two types of self-employed workers vs. employees in 152 surveys and 42 countries. Over 50% of these surveys are from Europe and Central Asia (33% from high income countries ECA countries, 18% from developing ECA countries) and 34% are from Latin America.
There may also be substantial differences between formal and informal employees, especially in developing countries. We identify formal employees as those who exhibit one or more of the following characteristics: union membership, employer pays for social security, has health insurance, or has a formal work contract. Employees who are not identified as formal are classified as informal. We are able to examine differences between formal and informal employees, and between self-employed workers vs. informal or formal employees. The sample of countries where we can identify formal from informal employees is dominated by Latin America; 90% of surveys where we can identify formal and informal employees are from Latin America.
IV. The Extent of Self-employment and Informal Employment Around the World
Table 1 presents the mean proportion of workers in each employment category across all surveys in the sample and for countries at different income levels. Specifically, Table 1 presents the proportion of workers who are: self-employed, non-professional own-account, professional own-account, informal employees and formal employees. To calculate the means across countries, the proportion of workers in each employment category from each survey (country/year combination) are weighted by total employment for that country and year. In addition, because the number of surveys in the data base for each country are different, the results from each survey (country/year combination) are weighted by the inverse of the number of surveys for that country. Weighted this way, each country is effectively counted only once even if there is more than one survey for that country.
Approximately 50% of workers in low income countries are non-professional own account workers. As per capita income increases, the proportion of non-professional
10
own-account falls, to 20% in upper middle income countries and 7% in high income countries. At the same time, as per capita income increases from low to upper-middle income countries the proportion of employers and professionals increases from 2% in low income countries to over 4.5% in upper middle income and high income countries.
Fewer than half of workers in low income countries are wage and salaried employees. This proportion increases as the per capita income of a country grows, and almost 90% of workers in high income countries are wage and salaried employees. In addition, as countries develop the proportion of employees in the formal sector increases, from less than 10% of workers in low income countries to almost half of all workers in upper middle income countries. We do not have direct estimates of informal and formal sector employees for high income countries, but this is likely because the informal sector is very small in these countries.
Table 2 presents the proportion of workers in each category by region of the world. For most regions of the world the proportion of workers in each category follows the patterns we saw by income group. For example, in regions characterized by low and lower-middle income countries (East Asia and the Pacific, Middle East and North Africa, South Asia and Sub-Saharan Africa) the proportion of formal sector employees is relatively small and the proportion of non-professional own account worker is relatively large. At the other end of the income scale, in high income countries of Europe and North America, the proportion of formal sector employees is relatively large and the proportion of non-professional own account worker is relatively small. In Latin America, composed mostly of middle-income countries, the proportion of workers in each category is between the low income and high income countries.
Middle-income developing European and Central Asian countries are in some ways similar to high-income European and Central Asian countries and in other ways similar to middle-income Latin American countries. For example, the proportion of self-employed workers in developing European and Central Asian countries is very low, 5%, compared to 11% in high income Europe and Central Asia and 32% in middle-income Latin America. On the other hand, the proportion of informal employees in the developing economies of Europe and Central Asia is high, 45%, compared to 23% in Latin America and almost zero in high income Europe and Central Asia.
V. Methodology: Estimating the Self-employment Earnings Penalty/Premium
We estimate the earnings premium/penalty in each survey using individual worker (i) level data to estimate the following earnings equation for each country(c)/year(t) combination:
iiiiii XSEEPLnY * [1]
Where
11
Yict is the dependent variable, self-reported monthly earnings of worker i in country c in year t.
Xict is a vector of eight worker-specific variables that can be expected to have an effect on earnings that is not related to self-employment or informality. These are: years of education, years of education squared, age, age squared, a gender dummy variable, an urban/rural dummy variable, a set of dummy variables for one-digit industry code, and a set of dummy variables representing the frequency of wage payments.5
μict is the error term SEict is a dummy variable indicating whether the worker is self-employed (1) or a wage and
salary worker (0) EPct is the average self-employment earnings premium, estimated separately for each
survey (country(c)/year(t).
The first set of earnings differential estimates that we present use this specification to estimate the earnings premium or penalty between self-employed workers and all employees. In a second set of estimates we re-estimate equation 1 and include two self-employment dummy variables: one that identifies non-professional own-account workers and the other that identifies employers and professionals own-account workers (the reference category is all employees). From this regression we obtain estimates of the earnings differentials between non-professional own-account workers vs. employees, employers and professionals vs. employees, and non-professional own account workers vs. employers and professionals. In a third set of estimates we separate employees into formal and informal sector employees and estimate the earnings differentials between formal vs. informal sector employees, all self-employed workers vs. informal employees, and all self-employed workers vs. formal employees. Finally, we re-estimate equation 1 and interact the two self-employed and formal/informal dummy variables to obtain estimates of the earnings differentials between non-professional own-account workers vs. formal sector workers, non-professional own-account workers vs. informal employees, and employers and professionals vs. own-account workers.
As noted, equation 1 is estimated separately for every county (c) and year (t) for which we have the appropriate variables in the I2D2 data set. This results in estimates of the earnings premium for each country (c) and year (t) combination in the I2D2 data set, EPct
. EPctis that percent by which the earnings of the self-employed differ from the earnings of wage and salary workers. If EPct is positive, that indicates that there is an earnings premium for self-employment; if EPct is negative, that indicates an earnings penalty for self-employment.
Table 3 summarizes the results of these estimations for all countries in our sample and by the income level of the country. In calculating these means across surveys we weight the estimates in three ways. First, in calculating means across countries the estimates of the
5 The frequency of wage payments is included as a control in order to guard against errors in the coding of wage payment frequencies across surveys, which could otherwise severely distort the results.
12
earnings differentials in each country are weighted by total employment for that country and year. In addition, because the number of surveys in the data base for each country are different, the results from each survey (country/year combination) are weighted by the inverse of the number of surveys for each country. Weighted this way, each country is effectively counted only once even if there are more than one survey for that country. Finally, to take into account that the earnings differentials estimated in each country are estimates with different standard errors, we also weight the results from each survey by the inverse of the estimated standard error on EPct .
VI. Earnings Penalties and Premiums for the Self-employment and Informal Employees Around the World.
In Table 3 we report the results of the estimation of penalties (-) and premiums (+) for all self-employed workers vs. all employees, non-professional-own account workers vs. formal and informal employees, employers and professionals vs. formal and informal employees, and informal vs. formal employees.
Across countries at all income levels a clear ordering emerges, After controlling for education, age, gender, region of residence and industry sector, employers and professional own-account workers earn the most. Employers and professionals earn more than formal and informal employees, and more than non-professional own-account workers. After employers and professionals come formal sector employees, who earn more than non-professional own-account workers and informal employees. Finally, non-professional own-account workers earn more than the lowest-paid category, informal employees (except in low income countries).
In summary, for workers in developing countries both informal employees and non-professional own-account workers face an earning penalty compared to formal employees. In high income countries non-professional own-account workers also pay a significant earnings penalty. On the other hand, employers and professionals in developing countries earn an earnings premium compared to formal employees. In contrast, there is no statistically significant earnings premium for employers and professionals in high income countries.
By Level of Development (GDP per Capita)
Table 3 also presents earnings differentials separately for countries in low, low middle, upper middle and high income countries. These figures show substantial differences between low, middle and high income countries.
Non-professional own-account workers face an earnings penalty compared to formal employees in countries at all income levels, although in low income countries penalties for non-professional own-account workers vs. formal employees are not statistically significantly different from zero. In middle income countries penalties for non-professional own-account workers vs. formal employees are larger than in low-income countries and are statistically different from zero. Earnings penalties for non-professional
13
own-account workers are largest in high income countries. Panels a and b in figure 1, which presents the distribution of self-employment earnings penalties and premiums by a country’s income level, further illustrate this pattern. Most (but not all) low-income countries exhibit a self-employment earnings premium, for middle income countries the earnings differentials between self-employed workers and employees cluster around zero (although most are negative/penalties), while almost all high income countries exhibit earnings penalties for self-employment. The pattern of increasing earnings penalties for self-employed workers shows up whether we examine earnings differentials between the self-employed vs. employees or non-professional own-account vs. employees. Further, the same pattern shows up for all demographic sub-groups that we examine: urban, rural, male, female, by age group and by education level.
Informal employees also face an earnings penalty compared to formal employees in developing countries at each income level. As with the earnings penalty for non-professional own-account workers, the informal earnings penalty is small and not significantly different from zero in low income countries, and the informal employee earnings penalty increases with GDP per capita. The informal earnings penalty increases to over 30% in middle income countries.
Figure 1, panel c, presents earnings differentials between employers and professionals vs. employees. In most low and middle income countries employers and professionals earn a premium compared to employees. On the other hand, in many high income country employers and professionals face a penalty compared to employees, and in high income countries where employers and professionals earn a premium compared to employees, the premium is small.
By Region of the World
In Table 4 we report the results of the estimates of penalties (-) and premiums (+) by region of the world. As we have noted, over 90% of our sample of surveys comes from either Latin America or Europe and Central Asia. Outside of Latin America and Europe and Central Asia, the largest group of surveys in our sample comes from Sub-Saharan Africa. We therefore focus on these regions in our regional analysis. We find some similarities between regions, but also some interesting differences, which suggest that care should be taken when generalizing the results from studies in Latin America to other regions of the world.
In all regions of the world for which we have data (Latin America, developing Europe and East Asia, and Sub-Saharan Africa), non-professional own-account workers pay an earnings penalty compared to formal employees. On the other hand, while employers and professionals earn statistically significant premiums vs. employees in Latin America and Sub-Saharan Africa, this is not true in Europe and Central Asia. In both in high income and developing economies in Europe and Central Asia there is no significant difference in the earnings of employers and professionals compared to formal employees. Similarly, informal employees earn significantly less than formal employees in Latin America, but not in the developing middle-income European and Central Asian
14
economies. Taken together, these results suggest that informal employees are particularly disadvantaged in Latin America (but not in the developing economies of Europe and Central Asia), while employers and professional own-account workers do much better in Latin America and Sub-Saharan Africa than in Europe and Central Asia. As Latin American and the developing countries of Europe and Central Asia have similar GDP per capita, it is not likely that level of development explains these regional differences. Regional differences may be due to different legal and regulatory environments, and issue we examine in a companion paper.
For Urban Workers Only6
Many analyses of self-employment and labor market segmentation focus on urban and non-agricultural labor markets. Therefore, it is useful to see if the results we find using data from only urban workers are consistent with the results that we found using data for all workers (urban plus rural). To examine the possibility that results for urban workers only may yield different results, table 5 replicates table 3 using data for only urban workers.
There are no noticeable differences between table 3 (urban plus rural) and table 5 (urban only). The results for urban workers are similar to the results for urban and rural workers together. Specifically, across countries at all income levels a clear ordering emerges, After controlling for education, age, gender, region of residence and industry sector, employers and professional own-account workers earn the most. Employers and professionals earn more than formal and informal employees, and more than non-professional own-account workers. After employers and professionals come formal sector employees, who earn more than non-professional own-account workers and informal employees. Finally, non-professional own-account workers earn more than the lowest-paid category, informal employees.
In low income countries penalties for non-professional own-account workers vs. formal employees and for informal vs. formal employees are small and not statistically significant. In middle income countries penalties for non-professional own-account workers vs. formal employees and for informal vs. formal employees are larger than in low-income countries and are statistically different from zero. Penalties for non-professional own-account workers are largest and highly statistically significant in high income countries. Panels a and b in figure 2, which presents the distribution of self-employment earnings penalties and premiums by a country’s income level, further illustrate this pattern. Most (but not all) low-income countries exhibit a self-employment earnings premium, for middle income countries the earnings differentials between self-employed workers and employees cluster around zero (although most are negative/penalties), while almost all high income countries exhibit penalties for self-employment.
6 Results for non-agricultural workers only are similar to those presented for urban workers only.
15
Figure 2, panel c, presents earnings differentials between employers and professionals vs. employees. In most low and middle income countries employers and professionals earn a premium compared to employees. In no high income country, on the other hand, do employers and professionals earn a premium compared to employees, and in many high income countries employers and professionals pay a penalty.
For Men and Women
In most countries that we study, women are primarily responsible for unpaid family responsibilities such as child care, housework and elder care. This suggests that women may value the flexibility of self-employment more than men, and therefore may be willing to accept lower earnings to compensate for the greater flexibility in hours and location of work. It is possible, therefore, that self-employment and informal earnings penalties/premiums may differ between men and women. To examine this possibility, we re-estimate the entire set of earnings differentials separately for men and women. The results are presented in Table 6.
The results presented in Table 6 show although both men and women non-professional own-account workers face earnings penalties, the penalties faced by women are larger than the penalties faced by men. The additional penalty faced by female non-professional own-account workers increases as the per-capita income of a country increases. For example, the difference between men and women in the earnings penalty for non-professional own-account vs. formal employees are not significantly different from zero for low-income countries, but is large and statistically significant in middle income countries. From middle income to high income couries the gap between men and women increases further. The difference in non-professional own-account vs. employees earnings penalties between men and women is largest in high income countries.
Differences between male and female employers and professionals is even more striking. In middle and upper income countries male employers and professionals earn a premium compared to employees, while women pay a penalty.
These results suggest that women may be more willing than men to accept a negative compensating earnings differential for self-employment, and that this phenomenon is more pronounced in high income countries.
On the other hand, the earnings penalties paid for informal employment (vs. formal employment) are similar for men and women. This suggests that the differences between men and women in self-employment penalties/premiums may be because of compensating differentials for the flexibility of self-employment, while no similar flexibility exists for informal sector employees.
Table 7 presents earnings penalties/premiums, separately for men and women, for different regions of the world. In all regions women pay a higher penalty than men for non-professional own account vs. formal employees. On the other hand, in all regions the earnings penalties for informal employment vs. formal employment are similar for
16
men and women.
The most noticeable regional difference is in the earnings differences between employers and professionals vs. employees. In Latin America men earn a premium as employers and professionals but women do not, while in Europe and Central Asia neither men nor women earn a significant premium or penalty as employers and professionals.
Figures 3 and 4 present the distribution of earnings premiums/penalties for men and women by countries’ GDP per capita. Patterns for each gender are similar to the overall patterns. Earnings penalties for both no-professional own-account workers and informal employees are small in low-income countries and increase with GDP per capita.
By Education Level
Table 8 presents self-employment and informal/formal earnings penalties/premiums for workers at four education levels: primary incomplete, primary graduate, secondary graduate/university incomplete and university graduate.7 In general, there are statistically significant self-employment earnings penalties for less educated workers, but statistically insignificant premiums for university graduates. This is consistent with the previous result that professional and technical own-account workers, who are likely to be university graduates, earn self-employment premiums while non-professional own-account workers, who are likely to have lower education levels, face self-employment earnings penalties.
At all education levels informal employees face earnings penalties compared to formal employees. Also at all levels, earnings penalties faced by informal employees increase as a countries’ GDP per capita increases. Informal earnings penalties are small and often insignificant in low-income countries and increase and become statistically significant in middle income countries.
By Age
Previous research suggests that successful self-employed workers tend to be older, mid-career workers. This suggests that we might find earnings premiums for older workers but earnings penalties for younger workers. To examine this issue, Table 9 presents earnings differentials for self-employed vs. employees, non-professional own-account vs. employees and employers and professionals vs. employees for three age groups: 15-24, 25-44 and 45-64. Neither earnings penalties for non-professional own-account workers nor earnings premiums for employers and professionals show any clear pattern between age groups; for some income groups they are bigger for older workers and for other income groups they are smaller for older workers compared to younger workers.
For all age levels, informal employees face earnings penalties compared to formal 7 Because professional own-account workers are almost surely university graduates, it does not make sense to report earnings differentials by education level separately for employers and professionals and non-professional own-account workers,
17
employees. Also at all age levels, earnings penalties faced by informal employees increase as a countries’ GDP per capita increases. Informal earnings penalties are small and often insignificant in low-income countries and increase and become statistically significant in middle income countries.
Discussion and Interpretation of Results
We have found evidence in developing countries of earnings penalties for informal employees compared to formal employees. This evidence is consistent with the hypothesis of labor market segmentation between the formal and informal employment sectors in developing countries. Earnings penalties faced by informal sector employees are low and insignificant in low income countries and large and statistically significant in middle income countries. This suggests that labor market segmentation between formal and informal employment is more prominent in middle income countries than in low income countries.
We have also found evidence in developing countries of earnings penalties for non-professional self-employed workers compared to formal employees. This evidence is consistent with the hypothesis of labor market segmentation in developing countries can explain the high level of informal employment and non-professional own-account self-employment if developing countries.
On the other hand, we have found evidence that employers and professional own account workers in developing countries face an earnings premium compared to formal employees. This evidence is consistent with the hypothesis that employers and professional own-account workers have a comparative advantage in self-employment, that the earnings of employers and professionals include returns to capital and risk as well as labor, or receive a positive earnings compensating differential to make up for the additional costs or risks involved in starting their own business. However, while employers and professional own-account workers earn statistically significant premiums vs. employees in Latin America and Sub-Saharan Africa, this is not true in Europe and Central Asia. In both in high income and developing economies in Europe and Central Asia, there is no significant difference in the earnings of employers and professionals compared to formal employees. This suggests that for some reason employers and professionals face disadvantages in Europe and Central Asia that they do not face in Latin America or Sub-Saharan Africa.
We also find evidence that as the per capita GDP of a country increases the earnings of the self-employed fall relative to the earnings of formal employees. This is true both non-professional own-account workers and professional own-account workers and employers. Further, as countries develop the earnings of informal employees vs. formal employees also fall. This evidence is not consistent with the hypothesis that labor market segmentation is causing penalties for self-employment and informal employment, as the labor market segmentation hypothesis would suggest that labor market segmentation, and therefore earnings penalties, would decline as countries develop. This evidence is consistent with the hypothesis that earnings differentials are due to compensating
18
differentials where self-employed and informal employees are willing to pay an earnings penalty in exchange for the flexibility of self-employment or informal employment.
Looked at with another focus, a way to interpret these trends (higher self-employment and informal penalties and falling premiums as countries develop) is that the earnings of formal employees increases relative to the self-employed and informal employees as countries develop. This suggests that we should be focusing on what happens to formal employees rather than the self-employed and informal employees. In one traditional dualistic model of economic development, the formal sector in the least developed countries is small (and self-employment and informal employment are large) because lack of demand for formal sector products is not enough to allow for the necessary economies of scale (see Lewis, 1954 and La Porta and Schleifer, 2014). For this reason, formal sector firms in low income countries will be less productive. As demand increases for domestic products, the scale of production and productivity increase in the formal sector. This will lead to an increase in the proportion of workers in formal employment. It is also likely to lead to an increase in earnings for formal sector employees.
Our evidence is consistent with the view that earnings gaps between the self-employed and employees are due to efficiency wages and the sharing of quasi-rents. Because it is likely that firms in low-income countries are less productive, compared to those in more developed countries, and offer fewer resources that boost worker productivity. Therefore, there are fewer firm rents in low-income countries to share with workers. Then, as countries develop and firms gain access to innovative technologies, the productivity of employees in firms increases and they are able to share more of their quasi-rents with workers, increasing the wages of employees relative to the self-employed. It is also reasonable to expect that the bargaining power of employees will increase as countries develop. If the bargaining power of workers is positively correlated with level of development and labor productivity, then the relationship between the worker’s share of quasi-rents with development and productivity will be even stronger.
Differences between men and women can also help explain why the earnings penalties for non-professional self-employment are much larger in high income countries than in low and middle income countries. Specifically, our results suggest that women in high income countries are more willing to accept lower wages as compensating earnings differentials for the flexibility of self-employment. When we estimate earnings differentials separately for men and women we find that earnings penalties for non-professional self-employment are highest in high-income countries for women but not for men. For men, these earnings penalties are actually smaller in high income countries compared to low and lower-middle income countries. The hypothesis that women are willing to accept negative compensating earnings differentials for the flexibility of self-employment can also help explain why female employers and professionals in high income countries pay an earnings penalty while male employers and professionals earn a premium.
19
VII. Conclusion
20
References:
Abowd, John, Francis Kramarz, Paul Lengermann, Kevin McKinney and Sebastien Roux (2012), “Persistent inter-industry wage differences: rent sharing and opportunity costs,” IZA Journal of Labor Economics, 1:7.
Aleksynska, M., and M. Schindler. 2011. “Labor Market Institutions in Advanced and Developing Countries: A New Panel Database.” IMF Working Paper No. 11/154.
Ardagna, Silvia, and Annamaria Lusardi. 2008. “Explaining International Differences in Entrepreneurship: The Role of Individual Characteristics and Regulatory Constraints.” NBER Working Paper No. 14012.
———. 2010. “Heterogeneity in the Effect of Regulation on Entrepreneurship and Entry Size.” Journal of the European Economic Association 8 (2-3): 594–605.
Arias, Omar, and Melanie Khamis. 2009. “Comparative Advantage, Segmentation and Informal Earnings: A Marginal Treatment Effects Approach.” IZA Discussion Paper No. 3916.
Bargain, Olivier, and Prudence Kwenda. 2011. “Earnings Structures, Informal Employment, And Self-Employment: New Evidence From Brazil, Mexico, And South Africa.” Review of Income and Wealth 57 (s1): S100–S122.
Basch, Michael, and Ricardo D. Paredes-Molina. 1996. “Are There Dual Labor Markets in Chile?: Empirical Evidence.” Journal of Development Economics 50 (2): 297–312.
Becker, Gary S. 1962. “Investment in Human Capital: A Theoretical Analysis.” The Journal of Political Economy 70 (5): 9–49.
Besley, Timothy, and Robin Burgess. 2004. “Can Labor Regulation Hinder Economic Performance? Evidence from India.” The Quarterly Journal of Economics 119 (1): 91–134.
Bryan, Gharad, Shyamal K. Chowdhury, and Ahmed Mushfiq Mobarak. Seasonal migration and risk aversion. Centre for Economic Policy Research, 2012.
Botero, J., S. Djankov, R. La Porta, F. Lopez-de-Silanes, and A. Shleifer. 2004. “The Regulation of Labor.” The Quarterly Journal of Economics 119 (4): 1339–82.
Busse, Matthias, and Jose Luis Groizard. 2008. “Foreign Direct Investment, Regulations and Growth.” The World Economy 31 (7): 861–86.
Cahuc, Pierre, Fabien Postel Vinay, and Jean Marc Robin. "Wage bargaining with on‐ ‐ ‐the job search: Theory and evidence." Econometrica 74.2 (2006): 323-364.‐
Cuñat, Alejandro, and Marc J. Melitz. 2011. “Volatility, Labor Market Flexibility, and the Pattern of Comparative Advantage.” Journal of the European Economic Association 10 (2): 225–54.
De Mel, Suresh, David McKenzie, and Christopher Woodruff. 2010. “Who Are the Microenterprise Owners? Evidence from Sri Lanka on Tokman versus De Soto.” In International Differences in Entrepreneurship, 63–87. University of Chicago Press.
De Soto, H. 1989. The Other Path: The Economic Answer to Terrorism. New York: HarperCollins.
21
Dickens, William, and Lawrence F. Katz. "Inter-Industry Wage Differences and Industry Characteristics." Unemployment and the Structure of Labor Markets, Basil. 1987.
Djankov, Simeon, T. Ganser, C. McLiesh, R. Ramalho, and A. Shleifer. 2008. “The Effect of Corporate Taxes on Investment and Entrepreneurship.” NBER Working Paper No. 13756.
Djankov, Simeon, Rafael La Porta, Florencio Lopez de Silanes, and Andrei Shleifer. 2002. “The Regulation of Entry.” Quarterly Journal of Economics 117 (1): 1–37.
Djankov, Simeon, and R. Ramalho. 2009. “Employment Laws in Developing Countries.” Journal of Comparative Economics 37 (1): 3–13.
Eslava, Marcela, John Haltiwanger, Adriana Kugler and Maurice Kugler. 2010. "Facrot Adjustments after Deregulation: Panel Evidence from Colombian Plants," The Review of Economics and Statistics 92(2): 378-391.
Feldmann, Horst. 2009. “The Unemployment Effects of Labor Regulation around the World.” Journal of Comparative Economics 37 (1): 76–90.
Fields, G. S. 2005. “A Guide to Multisector Labor Market Models.” World Bank, Social Protection Working Paper No. 0505.
———. 2009. “Segmented Labor Market Models in Developing Countries.” In The Oxford Handbook of Philosophy of Economics, 476–510. New York: Oxford University Press.
Freeman, R. 2009. “Labor Regulations, Unions, and Social Protection in Developing Countries: Market Distortion or Efficient Institutions.” NBER Working Paper No. 14789.
Freund, Caroline, and Bineswaree Bolaky. 2008. “Trade, Regulations, and Income.” Journal of Development Economics 87 (2): 309–21.
Freund, Caroline and Bob Rijkers (2013), "Employment Miracles," mimeo, The World Bank, Washington, April.
Frölich, Markus, and Blaise Melly. 2010, "Estimation of quantile treatment effects with Stata." Stata Journal 10 (3): 423.
Gallagher, Mary, John Giles, Albert Park and Meiyan Wang. 2013. "China's 2008 Labor Contract Law: Implementation and Implications for China's Workers," World Bank Policy Research Working Paper No. 6542, July.
Gindling, T. H. 1991. “Labor Market Segmentation and the Determination of Wages in the Public, Private-Formal, and Informal Sectors in San Jose, Costa Rica.” Economic Development and Cultural Change, 585–605.
Gindling, T. H., and David Newhouse. 2013. “Self-Employment in the Developing World.” World Bank Policy Research Working Paper No. 62101.
Hallward-Driemeier, Mary, and David Stewart. 2004. “How Do Investment Climate Conditions Vary Across Countries, Regions and Types of Firms?” Background Paper Prepared for the World Development Report 2005: A Better Investment Climate for Everyone. The World Bank, Washington, DC.
Harris, John R. & Todaro, Michael P. (1970), "Migration, Unemployment and Development: A Two-Sector Analysis", American Economic Review 60 (1): 126–142.
22
Heckman, James J. (1979). "Sample selection bias as a specification error," Econometrica 47 (1): 153–61.
Heckman, James J., and V. Joseph Hotz. 1986. “An Investigation of the Labor Market Earnings of Panamanian Males: Evaluating the Sources of Inequality.” Journal of Human Resources 21 (4): 507–42.
Heckman, James J., and Carmen Pagés. 2004. Carmen Pages, eds.(2004) Law and Employment: Lessons from Latin America and the Caribbean. New York: University of Chicago Press.
Helpman, Elhanan, and Oleg Itskhoki. 2010. “Labour Market Rigidities, Trade and Unemployment.” Review of Economic Studies 77 (3): 1100–1137.
Hurst, Erik, Geng Li and Benjamin Pugsley, 2010. "Are Household Surveys Like Tax Forms: Evidence from Income Underreporting of the Self Employed," NBER Working Papers 16527.
Jensen, Robert. "Do Labor Market Opportunities Affect Young Women's Work and Family Decisions? Experimental Evidence from India." The Quarterly Journal of Economics 127.2 (2012): 753-792.
Krueger, Alan B., and Lawrence H. Summers. "Efficiency Wages and the Inter-industry Wage Structure." Econometrica 56.2 (1988): 259-93.Kuznets, Simon. 1955. “Economic Growth and Income Inequality.” The American Economic Review 45 (1): 1–28.
LaPorta, Rafeal and Andrei Schleifer. 2014. "Informality and Development, Journal of Economic Perspectives, 28(3): 109-126.
La Porta, Rafael, and Andrei Schleifer. 2008. “The Unofficial Economy and Economic Development.” Brookings Papers on Economic Activity, no. 2 (August): 275–352.
Launov, Andrey. 2006. “Competitive and Segmented Informal Labor Markets.” IZA Discussion Paper No. 2349.
Lee, Eddy. 1998. The Asian Financial Crisis: The Challenge for Social Policy. International Labour Organization.
Lee, Sangheon, Deirdre McCann, and Nina Torm. 2009. “The World Bank’s ‘Employing Workers’ Index: Findings and critiques–A Review of Recent Evidence.” International Labour Review 147 (4): 416–32.
Lehmann, Hartmut, and Alexander Muravyev. 2012. “Labor Market Institutions and Informality in Transition and Latin American Countries.” IZA Discussion Paper No. 7035.
Lewis, Arthur. 1954. “Economic Development with Unlimited Supplies of Labor.” Manchester School of Economic and Social Studies 22(2): 139–91.
Maloney, W. F. 1999. “Does Informality Imply Segmentation in Urban Labor Markets? Evidence from Sectoral Transitions in Mexico.” The World Bank Economic Review 13 (2): 275–302.
———. 2004. “Informality Revisited.” World Development 32 (7): 1159–78.Meghir, Costas, Renata Narita, and Jean-Marc Robin. 2012. “Informality in
Developing Countries.” NBER Working Paper No. 18347.Micco, Alejandro, and Carmen Pagés. 2006. “The Economic Effects of Employment
Protection: Evidence from International Industry-Level Data.” IZA Discussion Paper No. 2433.
23
Mincer, Jacob. 1962. “On-the-Job Training: Costs, Returns, and Some Implications.” The Journal of Political Economy 70 (5): 50–79.
Montenegro, C. E., and M. L. Hirn. 2009. “A New Disaggregated Set of Labor Market Indicators Using Standardized Household Surveys from Around the World.” Background Paper for the World Development Report 2009.
Nguyen, Huu, Christophe Nordman, and Francois Roubaud. 2013. “Who Suffers the Penalty? A Panel Data Analysis of Earnings Gaps in Vietnam.” IZA Discussion Paper 7149.
Perry, Guillermo, William Maloney, Omar Arias, Pablo Fajnzylber, Andrew Mason, and Jaime Saavedra. 2007. “Informality: Exit and Exclusion, World Bank Latin America and Caribbean Studies.” World Bank, Washington DC.
Pierre, Gaëlle, and Stefano Scarpetta. 2004. “Employment Regulations through the Eyes of Employers: Do They Matter and How Do Firms Respond to Them?” IZA Discussion Papers 1424.
Roy, Andrew D. (1951), "Some Thoughts on the Distribution of Earnings," Oxford Economic Papers, 3:135-146.
Saavedra, Jaime, and Alberto Chong. 1999. “Structural Reform, Institutions and Earnings: Evidence from the Formal and Informal Sectors in Urban Peru.” The Journal of Development Studies 35 (4): 95–116.
Sabirianova Peter, Klara. 2009. “Income Tax Flattening: Does It Help to Reduce the Shadow Economy?” IZA Discussion Papers 4223.
Schneider, F., A. Buehn, and C. E. Montenegro. 2010. “New Estimates for the Shadow Economies All over the World.” International Economic Journal 24 (4): 443–61.
Schultz, Theodore W. 1961. “Investment in Human Capital.” The American Economic Review 51 (1): 1–17.
Smith, James P., Duncan Thomas, Elizabeth Frankenberg, Kathleen Beegle, and Graciela Teruel. 2002. “Wages, Employment and Economic Shocks: Evidence from Indonesia.” Journal of Population Economics 15 (1): 161–93.
Tokman, Victor E. 1978. “An Exploration into the Nature of Informal—formal Sector Relationships.” World Development 6 (9): 1065–75.
Tokman, Víctor E. 1984. “Wages and Employment in International Recessions: Recent Latin American Experience.” Helen Kellogg Institute for International Studies, University of Notre Dame 11.
Van Reenen, John (1996), "The Creation and Capture of Rents: Wages and Innovation in a Panel od U.K. Companies," The Quarterly Journal of Economics:195-226.
Van Stel, André, David Storey, and A. Thurik. 2007. “The Effect of Business Regulations on Nascent and Young Business Entrepreneurship.” Springer, Small Business Economics 28 (2): 171–86.
World Bank. 2013. “Doing Business 2013: Smarter Regulations for Small and Medium-Size Enterprises”. Washington, DC: World Bank Group.
24
A. Self-employed and employeesSelf-
employment Shares
(Standard Error) Employee Shares
(Standard Error) Number of Countries
Number of Surveys
Total sample 0.267 (0.089) 0.733 (0.089) 73 347Income GroupLow Income 0.546 (0.061) 0.454 (0.061) 20 32Low Middle Income 0.441 (0.026) 0.559 (0.026) 23 134Upper Middle Income 0.274 (0.026) 0.726 (0.026) 16 114High Income 0.115 (0.003) 0.885 (0.003) 14 67
B. Dividing self-employed into non -professional own account and employers/professional own-account
Non-Professional Own-account
Share
(Standard Error)Employers & Professionals
Share(Standard Error) Number of
CountriesNumber of
Surveys
Total sample 0.225 (0.104) 0.033 (0.010) 42 152Income GroupLow Income 0.501 (0.076) 0.020 (0.001) 7 9Low Middle Income 0.436 (0.030) 0.013 (0.007) 8 29Upper Middle Income 0.203 (0.025) 0.049 (0.004) 14 52High Income 0.070 (0.003) 0.045 (0.002) 13 62
C. Dividing employees in to informal and formal
Informal Employees
(Standard Error) Formal Employees
(Standard Error) Number of Countries
Number of Surveys
Total sample 0.244 (0.029) 0.447 (0.034) 34 190Income GroupLow Income 0.135 (0.037) 0.089 (0.018) 9 11Low Middle Income 0.319 (0.090) 0.385 (0.062) 20 104Upper Middle Income 0.216 (0.019) 0.485 (0.036) 5 75High Income na na na na 0 0
Table 1: Proportion of Workers in Each Employment Category, by Income Group
25
A. Self-employed and employeesSelf-
employment Shares
(Standard Error) Employee Shares
(Standard Error) Number of Countries
Number of Surveys
Total sample 0.267 (0.089) 0.733 (0.089) 73 347RegionLatin America & Caribbean 0.321 (0.005) 0.679 (0.005) 20 217Europe & Central Asia (High-Income) 0.108 (0.007) 0.892 (0.007) 13 58Europe & Central Asia (Developing) 0.055 (0.009) 0.945 (0.009) 19 43Other 0.272 (0.034) 0.728 (0.034) 21 29
East Asia & Pacific 0.467 (0.002) 0.533 (0.002) 3 3Middle East & North Africa 0.493 (0.014) 0.507 (0.014) 2 3North America 0.116 (0.015) 0.884 (0.015) 1 3South Asia 0.455 (0.020) 0.545 (0.020) 2 3Sub-Saharan Africa 0.521 (0.077) 0.479 (0.077) 13 17
B. Dividing self-employed into non -professional own account and employers/professional own-account
Non-Professional Own-account
Share
(Standard Error)Employers & Professionals
Share(Standard Error) Number of
CountriesNumber of
Surveys
Total sample 0.225 (0.104) 0.033 (0.010) 42 152RegionLatin America & Caribbean 0.235 (0.007) 0.056 (0.002) 7 52Europe & Central Asia (High-Income) 0.051 (0.025) 0.021 (0.010) 12 56Europe & Central Asia (Developing) 0.053 (0.011) 0.056 (0.010) 12 31Other 0.240 (0.134) 0.028 (0.013) 11 14
East Asia & Pacific 0.460 (0.000) 0.007 (0.000) 2 2Middle East & North Africa 0.469 (0.002) 0.025 (0.000) 2 2North America 0.072 (0.000) 0.044 (0.000) 1 3South Asia 0.437 (0.000) 0.020 (0.000) 1 2Sub-Saharan Africa 0.323 (0.183) 0.021 (0.002) 5 5
C. Dividing employees in to informal and formal
Informal Employees
(Standard Error) Formal Employees
(Standard Error) Number of Countries
Number of Surveys
Total sample 0.244 (0.029) 0.447 (0.034) 34 190RegionLatin America & Caribbean 0.229 (0.010) 0.445 (0.027) 18 172Europe & Central Asia (High-Income) na na 0 0Europe & Central Asia (Developing) 0.454 (0.301) 0.526 (0.299) 9 11Other 0.177 (0.041) 0.338 (0.144) 7 7
East Asia & Pacific na na 0 0Middle East & North Africa 0.630 - 0.069 - 1 1North America na na 0 0South Asia na na 0 0Sub-Saharan Africa 0.176 (0.041) 0.338 (0.144) 6 6
Table 2: Proportion of Workers in Each Employment Category, by Region of the World
26
A. All self-employed vs. all employees
Self-employment
vs. Employees
Number of
Countries
Number of
Surveys
Total sample -0.095 (0.076) 73 347Low Income 0.236 (0.055) *** 20 32Low Middle Income -0.168 (0.080) ** 23 134Upper Middle Income -0.027 (0.118) 16 114High Income -0.238 (0.023) *** 14 67
B. Non-professional own-account and employers and professionals vs. all employees
Non-professional
Own Account vs. Employees
Employers & Professionals
vs. Employees
Number of
Countries
Number of
Surveys
Total sample -0.096 (0.067) 0.284 (0.095) *** 42 152Low Income 0.286 (0.021) *** 0.590 (0.030) *** 7 9Low Middle Income -0.167 (0.079) ** 0.223 (0.131) * 8 29Upper Middle Income 0.035 (0.043) 0.563 (0.028) *** 14 52High Income -0.243 (0.018) *** 0.076 (0.030) 13 62
C. All Self-employed vs. informal and formal employees, informal vs. formal employees
Self-employed vs. Formal Employees
Self-employed vs. Informal Employees
Informal vs. Formal
Employees
Number of
Countries
Number of
Surveys
Total sample -0.208 (0.114) ** 0.131 (0.095) -0.341 (0.013) *** 34 190Low Income -0.123 (0.236) 0.076 (0.140) -0.016 (0.080) 9 11Low Middle Income -0.184 (0.028) *** 0.129 (0.065) ** -0.362 (0.015) *** 20 104Upper Middle Income -0.218 (0.150) * 0.132 (0.113) * -0.337 (0.017) *** 5 75High Income na na na na na na 0 0
D. Non-professional own-account vs. formal employees, informal employees and employers and professionals
Non-professional Own-account
vs. Formal Employees
Non-professional Own-account vs. Informal Employees
Non-professional
O.A. vs. Employers
and Professionals
Number of
Countries
Number of
Surveys
Total sample -0.150 (0.052) *** 0.245 (0.059) *** -1.015 (0.048) *** 15 58Low Income -0.157 (0.304) -0.379 (0.122) *** -0.170 (0.192) 4 4Low Middle Income -0.234 (0.045) *** 0.207 (0.074) *** -0.968 (0.086) *** 7 24Upper Middle Income -0.117 (0.063) * 0.260 (0.057) *** -1.042 (0.040) *** 4 30High Income na na na na na na 0 0Notes: * significantly different from zero at 1%; ** significant different from zero at 5%; ***singnificantly different from zero at 10%
(Standard Error)
(Standard Error)
(Standard Error)
Table 3: Self-employment and Informal Earnings Premiums(+) or Penalties(-), by Income Group
(Standard Error)
(Standard Error)
(Standard Error)
(Standard Error)
(Standard Error)
(Standard Error)
27
A. All self-employed vs. all employees
Self-employment
vs. Employees
Number of
Countries
Number of
Surveys
Total sample -0.095 (0.076) 73 347Latin America & Caribbean -0.017 (0.099) 20 217Europe & Central Asia (High-Income) -0.212 (0.146) 13 58Europe & Central Asia (Developing) -0.226 (0.060) *** 19 43Other -0.169 (0.073) ** 21 29
East Asia & Pacific -0.278 (0.000) *** 3 3Middle East & North Africa 0.379 (0.006) *** 2 3North America -0.243 (0.000) *** 1 3South Asia 0.269 (0.044) *** 2 3Sub-Saharan Africa -0.248 (0.068) *** 13 17
B. Non-professional own-account and employers and professionals vs. all employees
Non-professional
Own Account vs. Employees
Employers & Professionals
vs. Employees
Number of
Countries
Number of
Surveys
Total sample -0.096 (0.067) 0.284 (0.095) *** 42 152Latin America & Caribbean 0.049 (0.027) * 0.495 (0.059) *** 7 52Europe & Central Asia (High-Income) -0.398 (0.118) *** 0.103 (0.110) 12 56Europe & Central Asia (Developing) -0.325 (0.057) *** -0.039 (0.046) 12 31Other -0.173 (0.061) *** 0.076 (0.049) 11 14
East Asia & Pacific -0.252 (0.000) *** 0.024 (0.000) *** 2 2Middle East & North Africa 0.389 (0.004) *** 0.702 (0.005) *** 2 2North America -0.225 (0.000) *** 0.109 (0.000) *** 1 3South Asia 0.270 (0.000) *** 0.565 (0.000) *** 1 2Sub-Saharan Africa -0.364 (0.006) *** 0.420 (0.016) *** 5 5
C. All Self-employed vs. informal and formal employees, informal vs. formal employees
Self-employed vs. Formal Employees
Self-employed vs. Informal Employees
Informal vs. Formal
Employees
Number of
Countries
Number of
Surveys
Total sample -0.150 (0.115) 0.186 (0.113) * -0.337 (0.015) *** 34 190Latin America & Caribbean -0.146 (0.116) -0.036 0.084 -0.329 (0.016) *** 18 172Europe & Central Asia (Developing) -0.024 (0.062) 0.190 0.116 * -0.018 (0.054) 9 11
Middle East & North Africa 0.190 0.000 -0.431 na 0.241 na 1 1Sub-Saharan Africa 0.530 (0.019) *** 0.134 0.027 *** -0.663 (0.006) *** 6 6
D. Non-professional own-account vs. formal employees, informal employees and employers and professionals
Non-professional Own-account
vs. Formal Employees
Non-professional Own-account vs. Informal Employees
Non-professional
O.A. vs. Employers
and Professionals
Number of
Countries
Number of
Surveys
Total sample -0.150 (0.052) *** 0.245 (0.059) *** -0.674 (0.035) *** 15 58Latin America & Caribbean -0.122 (0.055) *** 0.259 (0.055) *** -0.670 (0.037) *** 6 47Europe & Central Asia (Developing) -0.221 (0.099) *** -0.245 (0.130) * -0.368 (0.137) *** 6 8
Sub-Saharan Africa -0.696 (0.000) *** 0.035 (0.009) *** -1.002 (0.039) *** 3 3Notes: * significantly different from zero at 1%; ** significant different from zero at 5%; ***singnificantly different from zero at 10%
(Standard Error)
(Standard Error)
(Standard Error)
Table 4: Self-employment and Informal Earnings Premiums(+) or Penalties(-), by Region of the World
(Standard Error)
(Standard Error)
(Standard Error)
(Standard Error)
(Standard Error)
(Standard Error)
28
A. All self-employed vs. all employees
Self-employment
vs. Employees
Number of
Countries
Number of
Surveys
Total sample -0.046 (0.065) 73 347Low Income 0.248 (0.050) *** 20 32Low Middle Income -0.053 (0.046) 23 134Upper Middle Income -0.010 (0.090) 16 114High Income -0.224 (0.022) *** 14 67
B. Non-professional own-account and employers and professionals vs. all employees
Non-professional
Own Account vs. Employees
Employers & Professionals
vs. Employees
Number of
Countries
Number of
Surveys
Total sample -0.126 (0.072) * 0.234 (0.125) * 42 152Low Income 0.272 (0.020) *** -3.556 (1.933) * 7 9Low Middle Income -0.173 (0.047) *** 0.216 (0.161) * 8 29Upper Middle Income -0.040 (0.077) 0.456 (0.095) *** 14 52High Income -0.305 (0.017) *** 0.079 (0.052) * 13 62
C. All Self-employed vs. informal and formal employees, informal vs. formal employees
Self-employed vs. Formal Employees
Self-employed vs. Informal Employees
Informal vs. Formal
Employees
Number of
Countries
Number of
Surveys
Total sample -0.074 (0.063) 0.208 (0.084) ** -0.657 (0.013) *** 34 190Low Income 0.091 (0.178) 0.283 (0.148) * -0.220 (0.110) * 9 11Low Middle Income -0.056 (0.016) *** 0.216 (0.052) *** -0.715 (0.022) *** 20 104Upper Middle Income -0.079 (0.076) 0.204 (0.099) ** -0.636 (0.026) ** 5 75High Income na na na na na na 0 0
D. Non-professional own-account vs. formal employees, informal employees and employers and professionals
Non-professional Own-account
vs. Formal Employees
Non-professional Own-account vs. Informal Employees
Non-professional
O.A. vs. Employers
and Professionals
Number of
Countries
Number of
Surveys
Total sample -0.156 (0.066) ** 0.253 (0.069) *** -0.627 (0.045) *** 15 58Low Income -0.215 (0.390) -0.072 (0.174) -0.134 (0.116) *** 4 4Low Middle Income -0.223 (0.045) *** 0.220 (0.101) ** -0.589 (0.065) *** 7 24Upper Middle Income -0.134 (0.085) 0.265 (0.067) *** -0.639 (0.042) *** 4 30High Income na na na na na na 0 0Notes: * significantly different from zero at 1%; ** significant different from zero at 5%; ***singnificantly different from zero at 10%
(Standard Error)
(Standard Error)
(Standard Error)
Table 5: For Urban Workers Only: Self-employment and Informal Earnings Premiums(+) or Penalties(-), by Income Group
(Standard Error)
(Standard Error)
(Standard Error)
(Standard Error)
(Standard Error)
(Standard Error)
29
A. All self-employed vs. all employees
Female MaleTotal sample -0.177 (0.080) ** -0.053 (0.067) Low Income -0.145 (0.084) * 0.310 (0.036) *** Low Middle Income -0.142 (0.028) *** -0.224 (0.106) ** Upper Middle Income -0.084 (0.118) -0.002 (0.106) High Income -0.400 (0.054) *** -0.072 (0.037) * B. Non-professional own-account and employers and professionals vs. all employees
Female Male Female Male
Total sample -0.218 (0.090) ** -0.114 (0.072) -0.190 (0.075) ** 0.184 (0.156)Low Income -0.116 (0.099) 0.347 (0.007) *** -0.441 (0.195) ** -3.567 (2.003) *
Low Middle Income -0.147 (0.018) *** -0.313 (0.082) *** -0.186 (0.106) * 0.266 (0.146) *
Upper Middle Income -0.070 (0.071) -0.006 (0.046) -0.035 (0.025) 0.584 (0.037) ***
High Income -0.487 (0.014) *** -0.134 (0.037) *** -0.279 (0.068) *** 0.196 (0.070) ***
C. Informal vs. Formal
Female Male Female MaleTotal sample 0.214 (0.667) -0.192 0.259 -0.341 (0.013) *** -0.337 (0.021) ***
Low Income 5.852 (0.638) *** 4.236 1.890 ** -0.016 (0.080) -0.238 (0.105) **
Low Middle Income 0.063 (0.478) -0.428 0.036 *** -0.362 (0.015) *** -0.353 (0.041) ***
Upper Middle Income -0.669 (0.059) *** -0.610 0.021 *** -0.337 (0.017) *** -0.332 (0.018) ***
High Income -0.410 (0.013) *** -0.373 0.019 *** na na na na
D. Non-professional own-account vs. formal and informal employees
Female Male Female MaleTotal sample -0.226 (0.071) *** -0.123 (0.043) *** 0.163 (0.078) ** -0.273 0.045 ***
Low Income -0.284 (0.427) -0.234 (0.318) -0.176 (0.299) 0.408 0.162 **
Low Middle Income -0.327 (0.036) *** -0.153 (0.074) ** 0.136 (0.095) -0.213 0.076 ***
Upper Middle Income -0.193 (0.089) ** -0.104 (0.047) ** 0.175 (0.084) ** -0.296 0.039 ***
High Income na na na na na na na na
Notes: * significantly different from zero at 1%; ** significant different from zero at 5%; ***singnificantly different from zero at 10%
Table 6: Male vs. Female: Self-employment and Informal Earnings Premiums(+) or Penalties(-), by Income Group
(SE)
(SE) (SE)
Non-professional Own Account vs. Employees Employers & Professionals vs. Employees
(SE) (SE)
(SE)
Self-employment vs. Employees
(SE)
Non-professional Own Account vs. Employers & Professionals Informal Employees vs. Formal Employees
(SE) (SE) (SE) (SE)
Non-professional Own-account vs. Formal Employees
Non-professional Own-account vs. Informal Employees
(SE) (SE) (SE)
30
A. All self-employed vs. all employees
Female MaleTotal sample -0.177 (0.080) ** -0.053 (0.067) Latin America & Caribbean -0.091 (0.099) 0.011 (0.086) Europe & Central Asia (High-Income) -0.162 (0.041) *** -0.256 (0.131) ** Europe & Central Asia (Developing) -0.254 (0.054) *** -0.202 (0.062) *** Other -0.300 (0.099) *** -0.075 (0.099) B. Non-professional own-account and employers and professionals vs. all employees
Female Male Female Male
Total sample -0.218 (0.090) ** -0.114 (0.072) -0.190 (0.075) ** 0.184 (0.156)Latin America & Caribbean -0.059 (0.056) 0.000 (0.029) -0.069 (0.043) 0.498 (0.050) ***Europe & Central Asia (High-Income) -0.634 (0.178) *** -0.368 (0.123) *** 0.030 (0.026) -0.027 (0.075) Europe & Central Asia (Developing) -0.433 (0.057) *** -0.322 (0.059) *** 0.001 (0.036) -0.074 (0.064) Other -0.328 (0.119) *** -0.130 (0.102) *** -0.429 (0.090) *** -0.102 (0.316)
C. Informal vs. Formal
Female Male Female MaleTotal sample 0.214 (0.667) -0.192 0.259 -0.341 (0.013) *** -0.337 (0.021) ***Latin America & Caribbean -0.663 (0.054) *** -0.587 (0.034) *** -0.335 (0.009) *** -0.329 (0.025) ***Europe & Central Asia (High-Income) -0.503 (0.134) *** -0.415 (0.049) *** na na na na Europe & Central Asia (Developing) -0.330 (0.056) *** -0.251 (0.020) *** -0.035 (0.071) -0.009 (0.046) Other 0.730 (1.208) -0.040 0.409 -0.671 (0.055) *** -0.643 (0.013) ***
D. Non-professional own-account vs. formal and informal employees
Female Male Female MaleTotal sample -0.226 (0.071) *** -0.123 (0.043) ** 0.163 (0.078) ** 0.273 (0.045) ***
Latin America & Caribbean -0.186 (0.065) *** -0.105 (0.049) ** 0.182 (0.074) ** 0.284 (0.042) **Europe & Central Asia (High-Income) na na na na na na na na Europe & Central Asia (Developing) -0.283 (0.217) -0.202 (0.033) *** -0.257 (0.211) -0.115 (0.074) *Other -0.887 (0.023) *** -0.578 (0.007) *** -0.090 (0.010) *** 0.130 (0.007) ***
Notes: * significantly different from zero at 1%; ** significant different from zero at 5%; ***singnificantly different from zero at 10%
Table 7: Male vs. Female: Self-employment and Informal Earnings Premiums(+) or Penalties(-), by Region of the World
Self-employment vs. Employees
(SE) (SE)
Non-professional Own Account vs. Employees Employers & Professionals vs. Employees
(SE) (SE) (SE) (SE)
Non-professional Own Account vs. Employers & Professionals Informal Employees vs. Formal Employees
(SE) (SE) (SE) (SE)
(SE) (SE) (SE) (SE)
Non-professional Own-account vs. Formal Employees
Non-professional Own-account vs. Informal Employees
31
A. All self-employed vs. all employees
Primary Incomplete
Primary Graduate
Secondary Graduae and University Incomplete
University Graduate
Total sample -0.042 (0.060) -0.099 (0.104) -0.004 (0.025) 0.004 (0.007) Low Income 0.239 (0.089) *** 0.168 (0.076) ** -0.013 (0.014) 0.001 (0.006) Low Middle Income -0.128 (0.034) *** -0.238 (0.077) *** -0.027 (0.074) 0.032 0.091 Upper Middle Income -0.037 (0.089) 0.012 (0.134) 0.077 (0.023) *** 0.034 (0.022) High Income -0.167 (0.049) *** -0.143 (0.026) *** -0.168 (0.029) *** -0.014 (0.011)
B. Informal vs. Formal Primary Incomplete
Primary Graduate
Secondary Graduae and University Incomplete
University Graduate
Total sample -0.363 (0.015) *** -0.379 (0.025) *** -0.431 (0.041) *** -0.444 (0.039) ***Low Income -0.362 (0.248) -0.196 (0.060) *** -0.253 (0.151) * -0.058 (0.155) Low Middle Income -0.394 (0.037) *** -0.365 (0.051) *** -0.520 (0.104) *** -0.408 (0.036) ***Upper Middle Income -0.353 (0.016) *** -0.385 (0.020) *** -0.391 0.025 *** -0.471 (0.053) ***High Income na na na na na na na na Notes: * significantly different from zero at 1%; ** significant different from zero at 5%; ***singnificantly different from zero at 10%
(Standard Error)
(Standard Error)
(Standard Error)
(Standard Error)
(Standard Error)
(Standard Error)
(Standard Error)
Table 8: By Education Level: Self-employment and Informal Earnings Premiums(+) or Penalties(-), by Income Group
(Standard Error)
32
A. All self-employed vs. all employees
Age 15-24 Age 25-44 Age 45-64
Total sample -0.075 (0.107) -0.080 (0.107) -0.056 (0.027) **
Low Income 0.077 (0.010) 0.208 (0.062) *** 0.205 (0.052) ***
Low Middle Income -0.250 (0.045) *** -0.128 (0.057) ** -0.068 (0.010) ***
Upper Middle Income 0.037 (0.095) -0.008 (0.088) -0.051 (0.011)
High Income 0.317 (0.469) *** -0.248 (0.025) *** -0.356 (0.306)
B. Non-professional own-account workers vs. all employees
Age 15-24 Age 25-44 Age 45-64
Total sample -0.137 (0.084) -0.153 (0.057) *** -0.202 (0.073) *** Low Income 0.193 (0.055) *** 0.255 (0.039) *** 0.302 (0.029) *** Low Middle Income -0.247 (0.035) *** -0.200 (0.028) *** -0.205 (0.117) * Upper Middle Income 0.031 (0.048) -0.059 (0.045) -0.080 (0.053) High Income -0.235 (0.049) *** -0.319 (0.012) *** -0.332 (0.020) *** C. Employers and Professionals vs. Employees
Age 15-24 Age 25-44 Age 45-64
Total sample -0.917 (1.287) 0.187 (0.152) 0.277 (0.123) *** Low Income -5.436 (0.114) *** -2.718 (2.078) -2.588 (2.216) Low Middle Income 0.114 (0.310) 0.143 (0.158) 0.465 (0.055) *** Upper Middle Income 0.537 (0.045) *** 0.522 (0.057) *** 0.554 (0.074) *** High Income 0.889 (0.471) * 0.025 (0.044) 0.106 (0.051) ** C. Informal vs. Formal Employees
Age 15-24 Age 25-44 Age 45-64
Total sample -0.311 (0.024) *** -0.317 (0.019) *** -0.393 (0.020) *** Low Income -0.090 (0.117) -0.132 (0.063) -0.232 (0.133) * Low Middle Income -0.330 (0.050) *** -0.324 (0.032) *** -0.416 (0.021) *** Upper Middle Income -0.305 (0.016) *** -0.315 (0.019) *** -0.388 (0.025) *** High Income na na na na na na Notes: * significantly different from zero at 1%; ** significant different from zero at 5%; ***singnificantly different from zero at 10%
(Standard Error)
(Standard Error)
(Standard Error)
(Standard Error)
(Standard Error)
(Standard Error)
(Standard Error)
(Standard Error)
(Standard Error)
Table 9: By Age: Self-employment and Informal Earnings Premiums(+) or Penalties(-), by Income Group
(Standard Error)
(Standard Error)
(Standard Error)
33
Table A1: Earnings Differentials for various workers by country, year and region of the world
34
Table A7 (cont.):
35
Figure 1a: Earnings differentials vs. log GDP per capita – Self-employment vs. employees
Figure 1b: Earnings differentials vs. log GDP per capita – Non-professional own-account vs. employees
36
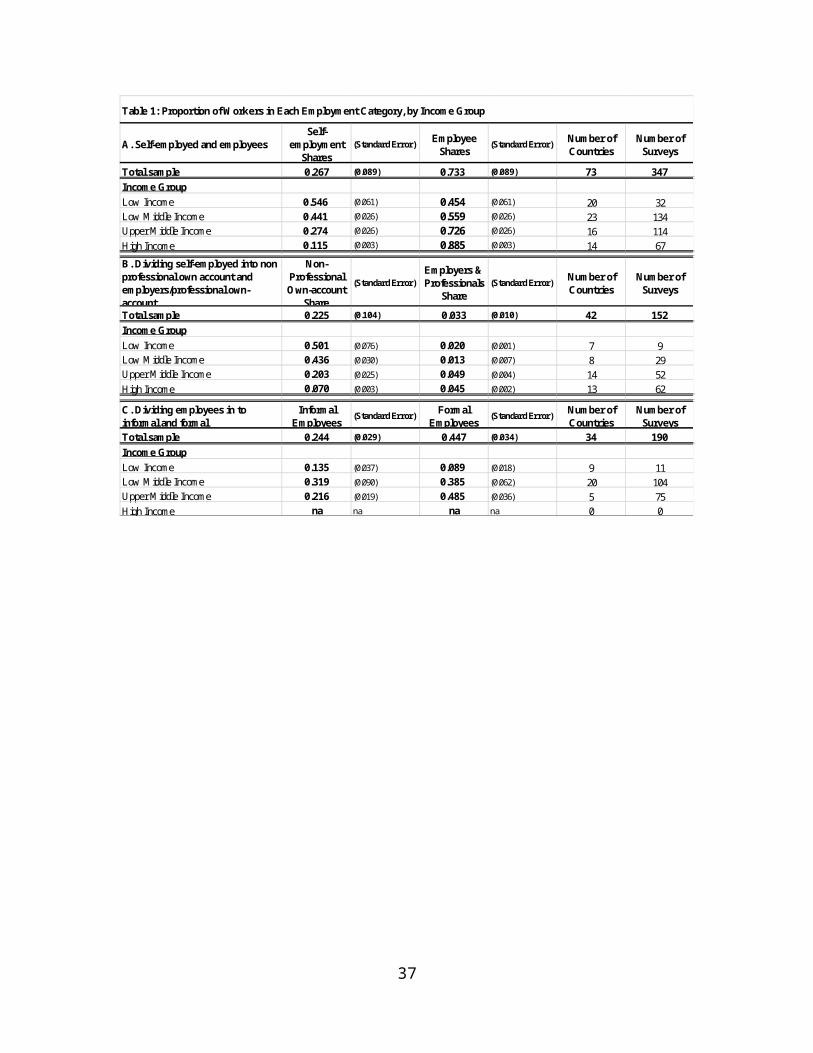
Figure 1c: Earnings differentials vs. log GDP per capita – Employers and professionals vs. employees
Figure 2a: Earnings differentials vs. log GDP per capita – Urban self-employment vs. employees
37
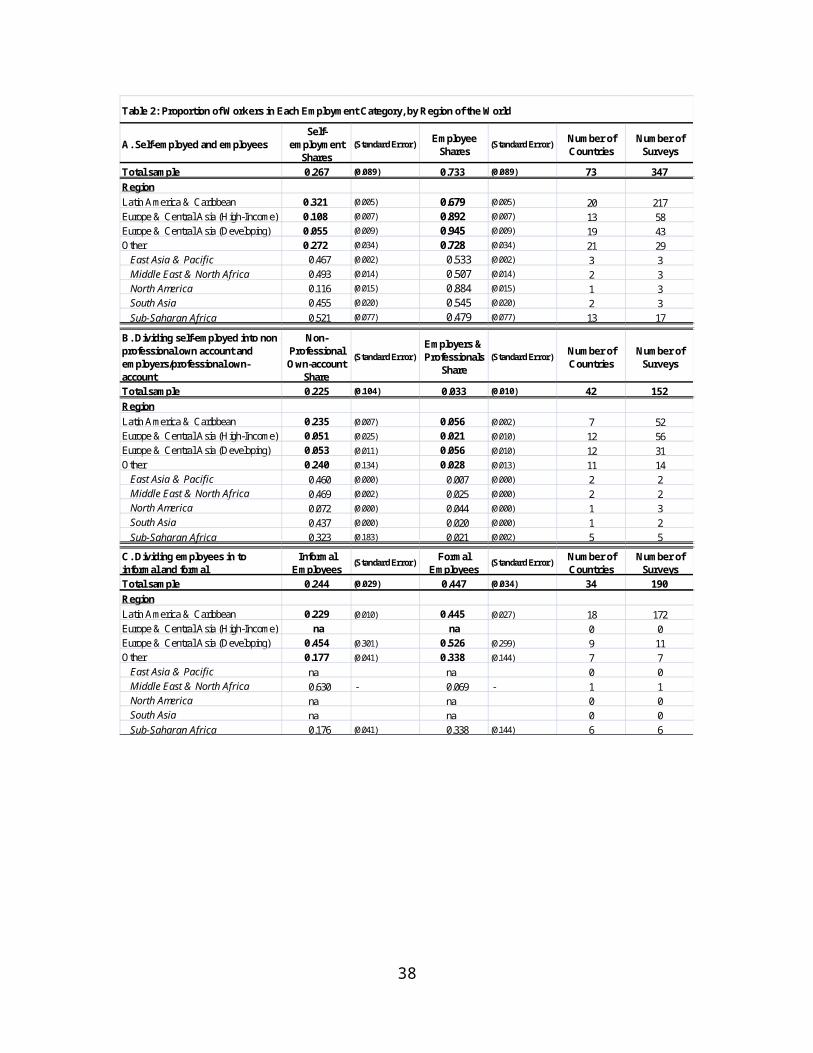
Figure 2b: Earnings differentials vs. log GDP per capita – Urban Non-professional own-account vs. employees
Figure 2c: Earnings differentials vs. log GDP per capita – Urban Employers and professionals vs. employees
38
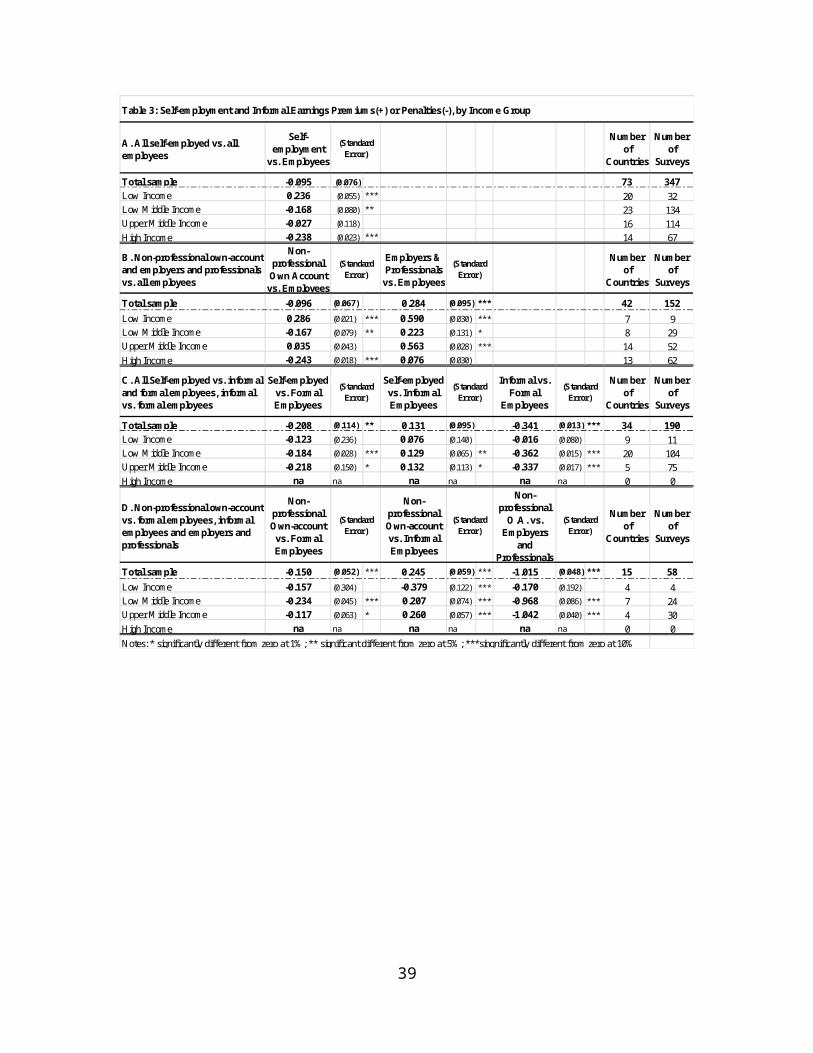
Figure 3a: Earnings differentials vs. log GDP per capita – Female self-employment vs. employees
Figure 3b: Earnings differentials vs. log GDP per capita – Female Non-professional own-account vs. employees
39
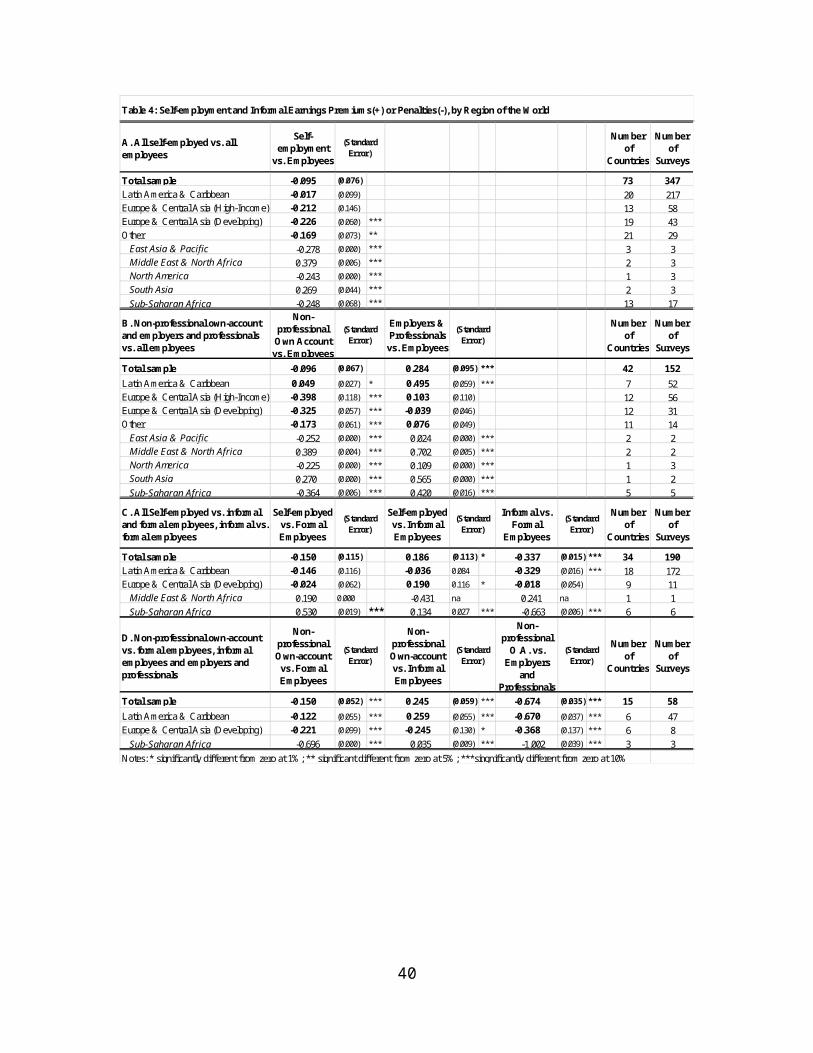
Figure 3c: Earnings differentials vs. log GDP per capita – Female Employers and professionals vs. employees
Figure 4a: Earnings differentials vs. log GDP per capita – Male self-employment vs. employees
40
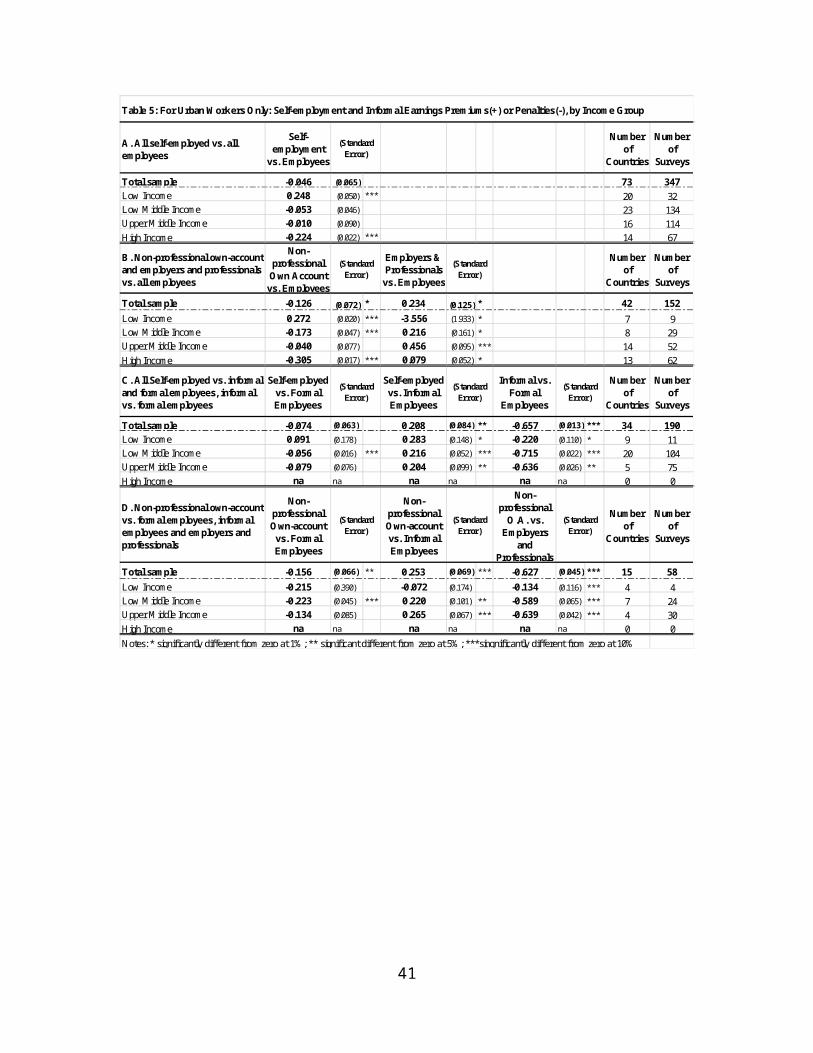
Figure 4b: Earnings differentials vs. log GDP per capita – Male Non-professional own-account vs. employees
Figure 4c: Earnings differentials vs. log GDP per capita – Male Employers and professionals vs. employees
41