Embed Size (px)
Citation preview

1
CMDB in Practice‘Real case-study of Implementing a CMDB in a large global institution’9th July 2008Amir NoorialaBarclays Capital - IT COO Office
2
Agenda
BACKGROUND
IMPLEMENTATION
BUILDING ON THE CMDB – EXAMPLES
BENEFITS
3
Background – About Us
� We are a global investment bank that has grown very aggressively since inception in 2000.- Workforce of 10,900 in 03/2006;
- Workforce of 15,000 in 05/2008.
� Service Management Tools have been in place since the formation of the company.- Many of the tools had not been changed since first implementation. i.e. Remedy version 4.
- Tools had also been customised beyond recognition and were unsupportable by vendors.
- Tools could not handle volume of users that was predicted to continue to increase aggressively over time.
- Poor performance of tools led to some teams using their own in house service management tools.
- Over 2,500 services in the CMDB and 16,000 Service to Host relationships.
� Launched an IT Transformation Programme over 3 years in March 2006- One stream of which was a service management programme to look at the tools, functions and processes within IT and try and
ITIL align them where suitable.
- The service management programme also included the launch of an initiative to launched a cost transparency project; and
- Performance reporting (IT Scorecards)

2
4
Services & all different type of
owner
Mapping of Alert Codes (from
Hosts) to Services
Platform Management
Tool (including Hosts)
Service to Host Relationships
Workflow tool to
request edits to data
Reporting Portal
Background – State of Service Management
1. A single database held a list of all the services in the bank. - Against each service there were 40 types of possible service owner and 30
regions, giving 1000s of type of owner. Multiple names were also possible per owner type.
2. A separate tool held a list of all the platforms in the firm including hosts.
3. A 3rd database took feeds of the services and hosts and allowed relationships to be mapped between the two.
4. A database held a list of all auto-generated host alert codes and how they mapped to an appropriate service and assignment group.
- However the database did not reflect changes in the services (renames / deletions).
- Due to this a large volume of alerts were sent to a catch-all stack where they were manually assigned to a support team.
Incident Management
System
Change Management
System
1 2
3
4
5. The reporting portal only showed statistics on Incidents per Service.
6. Changes were requested in a different tool than the Incident Management Tool.
7. Edits were requested via plain text lists with no Configuration Management function to check requests.
5
6
7
5
CMDB
OMDB
Background – Where we are now
1
3
Incident Module
Problem Module
Change Module
Service Management ConsoleService Management
Reporting Console
2
4
Infrastructure Tools
1. A CMDB v1 has been launched which holds CI types of Services down to network switches.
- The CMDB also contains all types of relationships between CIs and data such as service mappings for host generated alert codes.
2. In the same toolset an integrated incident / problem / change management system has been implemented.
3. An ‘OMDB’ has been created, becoming the master source and reconciliation tool for all infrastructure data.
4. A service management console has been created (in the same toolset) to edit and view the data in the CMDB using a permission-based model.
5. A duplicate database of the CMDB has been created from which a reporting console draws it data.
Reporting Database
5
6
Service Management at Barclays Capital
� Service Management is divided between Service Support and Service Delivery.
� The Service Management Programme (SMP) Phase 1 reengineered new processes for Incident, Problem, Configuration and Financial Management and delivered a new toolset to support them.
Service Desk
Problem Management
Change Management
Release Management
Configuration Management
Service Support
Financial Management
Capacity Management
Availability Management
Service Level Management
Service Continuity
Service Delivery
Moved onto HP Service Centre with Phase 1 of
SMP
BCM and Service Continuity teams
already exist
Function within Infra Engineering (Capacity
& Enterprise Mgmt)
Federated function within Application
Teams
Moved onto HP Service Centre with Phase 1 of
SMP
Currently Using in house tool, SMP Phase
2
Moved onto HP Service Centre with Phase 1 of
SMP
Front-to-Back feeds programme, SMP
Phase 2
Function within InfraEngineering (Capacity
& Enterprise Mgmt)
Central function within IT COO Office,
providing activity based cost reports.
Incident Management
Moved onto HP Service Centre with Phase 1 of
SMP
SMP Phase 1
SMP Phase 2
Existing Processes
3
7
� The different functions within service management interact with each other closely, many have dependencies with each other and all being dependant on configuration management.
Incident Management
Problem Management
ChangeManagement
Configuration Management (CMDB)
ReleaseManagement
Service Level Management
Service Desk
Financial Management
IT Service Continuity
Management
Capacity Planning
Availability Management
Service Request
Security Management
Asset / Inventory Management
Service Reporting
Project SAM
Separate Project
SMP Phase II
SMP
Phase II
SMP
Phase II
Service Management at Barclays Capital SMP Phase 1
SMP Phase 2
Existing Processes
Separate Project
8
Agenda
BACKGROUND
IMPLEMENTATION
BUILDING ON THE CMDB – EXAMPLES
BENEFITS
9
Implementation – Infrastructure provided data
� The CMDB was architected using data that was available from existing infrastructure tools.
� A subset of this data was incorporated into the CMDB v1, using the following principles:
- Data provided had to be of value to the Incident / Problem / Change Management functions;
- The quality of the data collected in the infrastructure tool had to be validated to the highest quality (subjective formula including factors such as automated/manual, coverage of estate, etc).
� All the infrastructure tool provided data is collected and reconciled in the ‘OMDB’ before being fed into the CMDB.
� By having all downstream data sources in a single tool, inconsistencies in naming standards (e.g. name duplication between data sources) can be corrected before being fed into the CMDB and highlighted in order to correct at source.
OMDB
Infrastructure Tools
Logical Host
Physical Server
Network SwitchLocation
Database
Database Server

4
10
Implementation – Linking Service Data to Infrastructure provided data
� There is no way to (currently) derive relationships between services and logical host or services to databases.
� These relationships are required to: - Drive incident / change management functions;
- Give ownership to infrastructure reports such as server and storage utilisation reports; and
- Give ownership to cost transparency reports which relate the costs of infrastructure components up to service owners.
� Hence there is a need for service ownership data be of the highest quality and continually maintained.
Logical Host
Physical Server
Network SwitchLocation
Database
Database Server
ServicesManually
maintained in Service
Management Console
Fed from OMDB
11
Implementation – Service Ownership
� A central ‘ownership hierarchy’ was designed.
� A non-CI level was created ‘above’ services called service groups.- All services have to belong to a single service group without exception
- Service groups can contain multiple services
- The owners of a service groups are exact across all services within.
� A non-CI level was created ‘above’ service groups called management areas.- All service groups have to belong to a management area without exception
- Management areas can contain multiple service groups
- The owners of a management area are exact across all service groups (and hence services) within.
� The ownership of management areas is set monthly as part of the financial management process.
- Ownership includes 6 roles.� CDR – Direct report of CIO and a head of a management area(s)� Support Lead and Manager – head of support for a management area and the deputy� Dev Lead and Manager – head of development for a management area and the deputy� COO – COO of the CDR
- Only 1 name is allowed against each of the roles.
- A name can be across multiple roles and management areas
Services
Management Area
Service Group
CD
R
CO
O
Support Lead
Dev Lead
Support
Manager
Dev M
anager
12
Implementation – Permission-ing Model
� By default the six centrally defined roles are given editing rights for the services within their management area.
� They in turn can permission additional (and an unlimited number of) configuration managers to have edit rights per management area.
� A person can be the configuration manager for multiple management areas and in turn is given the right to add additional configuration managers.
� A default assignment group is defined for every service group and is hence the default for all the services within.
- Ensuring no incident tickets are ever without an assignment group.
� Further custom assignment groups can be defined per service.Services
Management Area
Service Group
CD
R
CO
O
Support Lead
Dev Lead
Support
Manager
Dev M
anager
Configuration Mgrs
Configuration Mgrs
Configuration Mgrs
Default Assignment Group
Custom Assignment
GroupsCustom
Assignment Groups
Used for performance reporting and top level
escalations
Used for incident / problem / change
management

5
13
Agenda
BACKGROUND
IMPLEMENTATION
BUILDING ON THE CMDB – EXAMPLES
BENEFITS
14
Building on the CMDB – Activity Based Cost Reporting
� In order to introduce activity based cost reporting (as opposed to a standard, budget, actual and forecast view), service groupswere fed into the time booking system.
� Each service group allowed time to be booked against Support or Dev each of which had standard service management based tasks with which time has to be specifically booked.
- Incident, problem or configuration management
� CAPEX tools were modified to also include a feed of service groups. As a result all CAPEX requests are assigned a service group.
Services
Management Area
Service Group
CD
R
CO
O
Support Lead
Dev Lead
Support
Manager
Dev M
anager
Support
Given permission to allow people to book time against service
groups.
Appear in time booking system and CAPEX
purchasing tools.
Dev
15
Building on the CMDB – Activity Based Cost Reporting 2
� Activity based reporting was also extended to allocate the cost of hardware to services and their corresponding ownership (CDR, Management Area etc).
� This was initially launched for Physical Servers and derived from the CMDB.
� As multiple services run on the same server the cost is pro-rata’d across the multiple owners.
- i.e. 2 services with different CDRs run on the same box. Each CDR pays for half the box.
� There are plans to extend this to storage and databases next.
Services
Management Area
Service Group
CD
R
CO
O
Support Lead
Dev Lead
Support
Manager
Dev M
anager
Support
Given permission to allow people to book time against service
groups.
Appear in time booking system and CAPEX
purchasing tools.
Dev
Logical Host
Physical Server

6
16
Building on the CMDB – Utilisation Reporting
� Gartner reports an average utilisation figure for production servers across Financial Services firms.
� CIO decided to set a ‘server utilisation’ target for all of IT - Not just production servers – which causes a 5% hit currently.
� Agents were installed on all servers to measure utilisation and this is rolled up via the CMDB to a CDR level.
� There are current plans in place to not just measure average utilisation but look at a SpecInt based weighted figure.
� Utilisation figures are also being produced in draft format on storage.
Services
Management Area
Service Group
CD
R
CO
O
Support Lead
Dev Lead
Support
Manager
Dev M
anager
Utilisation reports rolled up to CDR level
Logical Host
Physical Server
Agent installed on servers to measure
utilisation.
17
Agenda
BACKGROUND
IMPLEMENTATION
BUILDING ON THE CMDB – EXAMPLES
BENEFITS
18
�“Angie”-IT COO.
-Owns relationship with client and has responsibilities such as financials and scorecard reports.
Angie – COO
Beneficiaries
�“Phil”-Support Lead.
-Responsible for support of all services within area.
�“Ali”-Central Incident,
Problem and Change Management team
-Provides central IPC support to IT and CRES support teams.
Phil – Support Lead
Ali – Central IPC
�“Summer”-Project Manager.
-Co-ordinates release of new services into estate.
Summer – Project Mgr
Bobby – Service Desk
�“Bobby”-Help desk staff
-1st Line Support
-Fields all client calls to 55555s
Jim – Central Config
�“Jim”-Central
Configuration Management Team
-Provides CMDB support to IT and CRES support teams
7
19
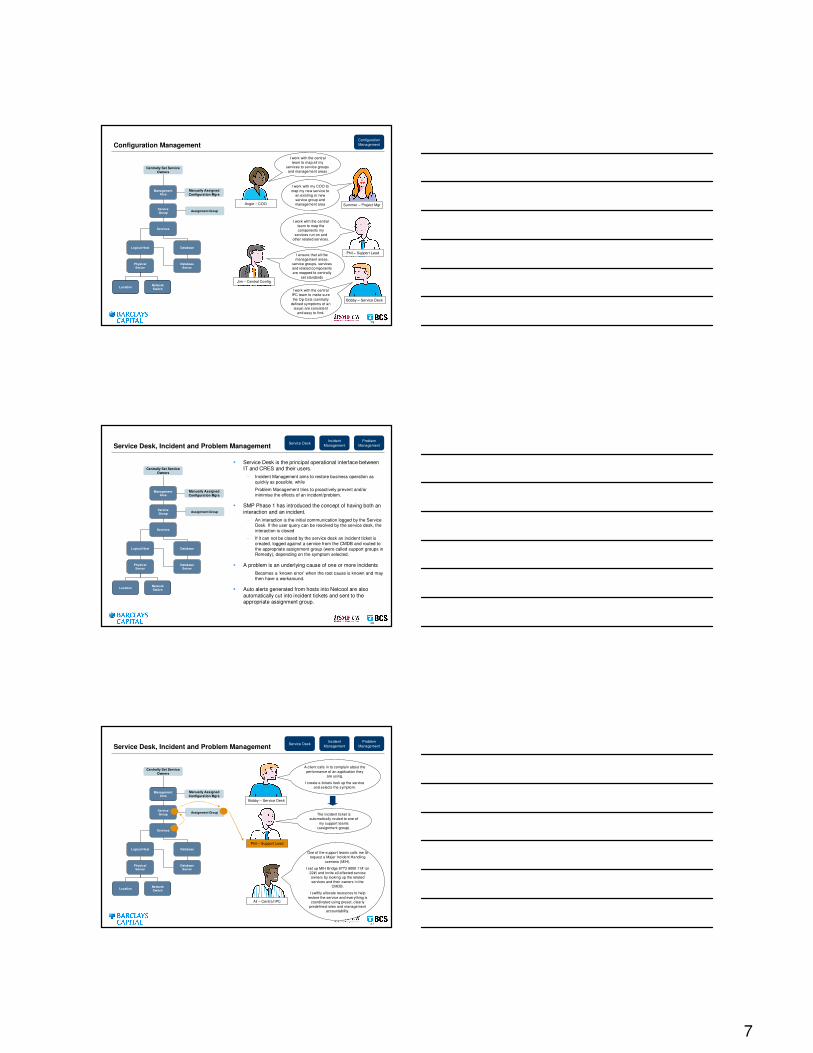
Jim – Central Config
Summer – Project MgrAngie – COO
Configuration ManagementConfiguration Management
Phil – Support Lead
I work with the central team to map all my
services to service groups and management areas
I work with my COO to map my new service to
an existing or new service group and management area
I work with the central team to map the components my
services run on and other related services.
I ensure that all the management areas,
service groups, services and related components are mapped to centrally
set standards
Logical Host
Physical Server
Network SwitchLocation
Database
Database Server
Services
Management Area
Service Group
Manually Assigned Configuration Mgrs
Assignment Group
Centrally Set Service Owners
Bobby – Service Desk
I work with the central IPC team to make sure the Op Cats (centrally
defined symptoms of an issue) are consistent
and easy to find.
20
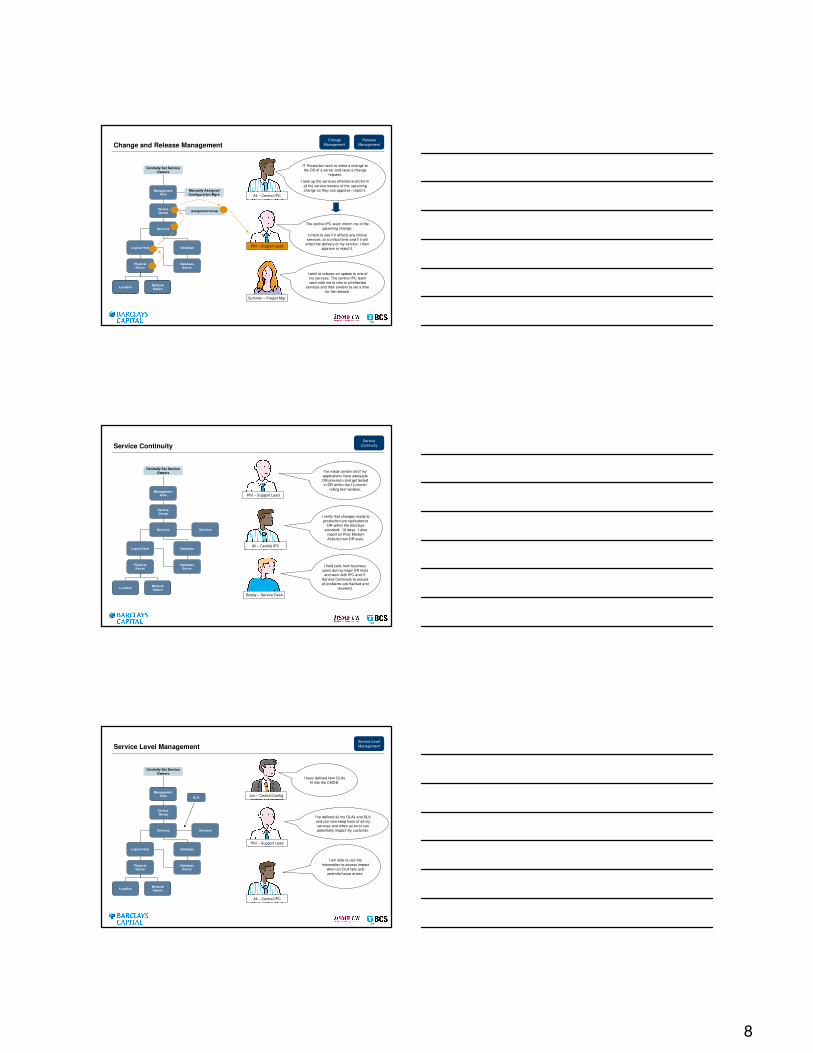
� Service Desk is the principal operational interface between IT and CRES and their users. - Incident Management aims to restore business operation as
quickly as possible, while
- Problem Management tries to proactively prevent and/or minimise the effects of an incident/problem.
� SMP Phase 1 has introduced the concept of having both an interaction and an incident.- An interaction is the initial communication logged by the Service
Desk. If the user query can be resolved by the service desk, theinteraction is closed
- If it can not be closed by the service desk an incident ticket is created, logged against a service from the CMDB and routed to the appropriate assignment group (were called support groups in Remedy), depending on the symptom selected.
� A problem is an underlying cause of one or more incidents - Becomes a ‘known error’ when the root cause is known and may
then have a workaround.
� Auto alerts generated from hosts into Netcool are also automatically cut into incident tickets and sent to the appropriate assignment group.
Service Desk, Incident and Problem ManagementProblem
ManagementIncident
ManagementService Desk
Logical Host
Physical Server
Network SwitchLocation
Database
Database Server
Services
Management Area
Service Group
Manually Assigned Configuration Mgrs
Assignment Group
Centrally Set Service Owners
21
Database
Services
Service Desk, Incident and Problem ManagementProblem
ManagementIncident
ManagementService Desk
Logical Host
Physical Server
Network SwitchLocation
Database Server
Management Area
Service Group
Manually Assigned Configuration Mgrs
Assignment Group
Centrally Set Service Owners
Phil – Support Lead
Ali – Central IPC
One of the support teams calls me to request a Major Incident Handling
scenario (MIH).
I set up MIH Bridge 8773 9000 11# (or 22#) and invite all affected service owners by looking up the related services and their owners in the
CMDB.
I swiftly allocate resources to help restore the service and everything is
coordinated using preset, clearly predefined roles and management
accountability.
The incident ticket is automatically routed to one of
my support teams (assignment group).
Bobby – Service Desk
A client calls in to complain about the performance of an application they
are using.
I create a tickets look up the service and selects the symptom.
8
22
Summer – Project Mgr
Database
Services
Change and Release ManagementRelease
ManagementChange
Management
Logical Host
Physical Server
Network SwitchLocation
Database Server
Management Area
Service Group
Manually Assigned Configuration Mgrs
Assignment Group
Centrally Set Service Owners
Ali – Central IPC
Phil – Support Lead
I wish to release an update to one of my services. The central IPC team work with me to inform all effected
services and their owners to set a time for the release.
IT Production wish to make a change to the OS of a server and raise a change
request.
I look up the services effected and inform all the service owners of the upcoming change so they can approve / reject it.
The central IPC team inform me of the upcoming change.
I check to see if it effects any critical services, at a critical time and if it will
effect the delivery of my service. I then approve or reject it.
23
Phil – Support Lead
Service Continuity
I field calls from business users during major DR tests
and work with IPC and IT Service Continuity to ensure all problems are tracked and
resolved.
I’ve made certain all of my applications have adequate DR provision and get tested in DR within the 12-month
rolling test window.
Service Continuity
Bobby – Service Desk
Ali – Central IPC
I verify that changes made to production are replicated to
DR within the Barclays standard: 10 days. I also
report on Post Mortem Actions from DR tests.
Logical Host
Physical Server
Network SwitchLocation
Database
Database Server
Services
Management Area
Service Group
Centrally Set Service Owners
Services
24
Phil – Support Lead
Service Level ManagementService Level Management
Logical Host
Physical Server
Network SwitchLocation
Database
Database Server
Services
Management Area
Service Group
Centrally Set Service Owners
Services
OLA
Ali – Central IPC
I am able to use the information to assess impact
when an OLA fails and potential issue arises.
I’ve defined all my OLAs and SLA and can now keep track of all my services and when an error can potentially impact my customer.
Jim – Central Config
I have defined how OLAsfit into the CMDB.

9
25
Availability ManagementAvailability
Management
Logical Host
Physical Server
Network SwitchLocation
Database
Database Server
Services
Management Area
Service Group
Centrally Set Service Owners
Phil – Support Lead
I can use “MyMO” to visualize all the alarms
associated to the IT Components making up
the services I am responsible for delivering.
All alarms that meet policy are automatically passed to incident management.
I can get a visualisation of the entire IT Estate and see when an underlying incident is causing issues for multiple
areas.
This allows me to co-ordinate efforts.
Bobby – Service Desk
26
Capacity ManagementCapacity
Management
Logical Host
Physical Server
Network SwitchLocation
Database
Database Server
Services
Management Area
Service Group
Centrally Set Service Owners
Phil – Support Lead
I can use the reports on http://capmanto answer questions such as:
What is the utilization of all my servers?
How much storage capacity do I have available?
27
Angie – COO
Summer – Project Mgr
Financial ManagementFinancial
Management
Phil – Support Lead
I worked with my COO to get my new service and service group set-up and now my development team all book
their time against the dev codes setup for the project.
Logical Host
Physical Server
Network SwitchLocation
Database Server
Management Area
Service Group
Development
Centrally Set Service Owners
Support
Services
Database
I can see the breakdown of all time and SPs booked against the services I own.
Activity based cost reports give me a good insight into my world.
All my support staff book their time against the appropriate service
groups and what specific tasks (i.e. Incident or Problem Management.).
End of month reports help me understand the full cost of my service
(T&M and infrastructure costs).
I can see which services need more support than others. This helps me with my budget and headcount
planning, understanding my Production usage and can be correlated to the number of MIH in my area too.
I can also see how much development time is being spent per project, and from which area.
10
28
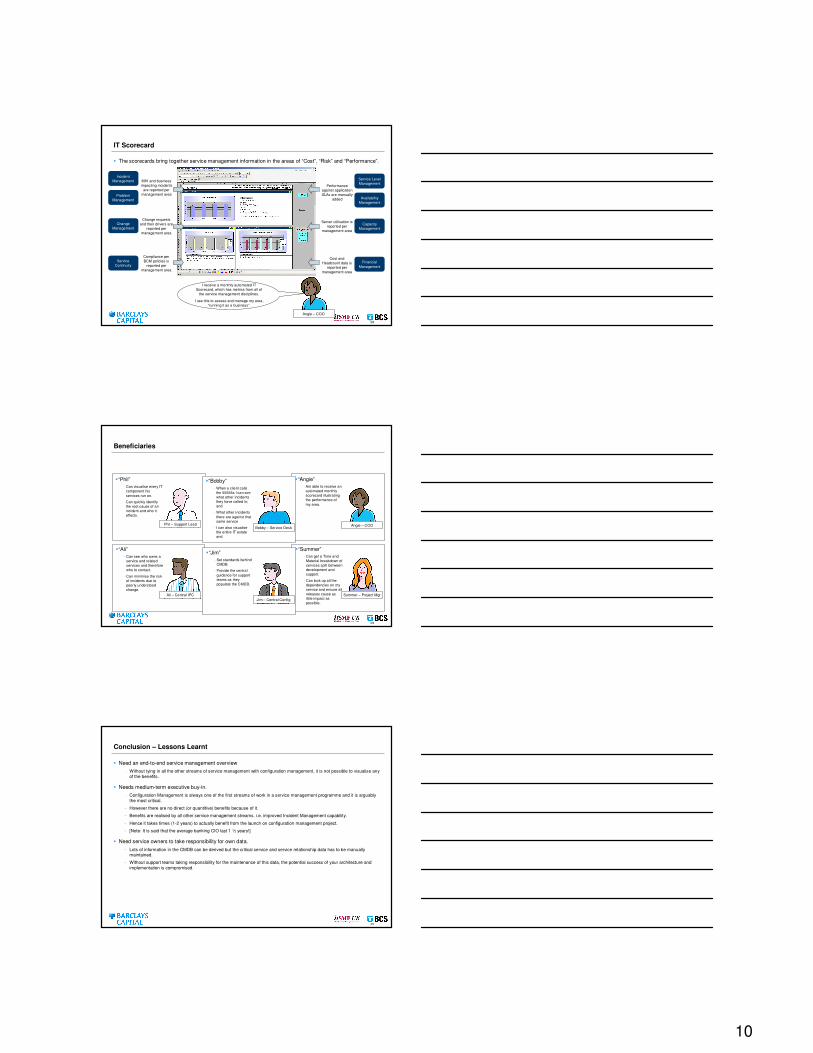
IT Scorecard
Angie – COO
I receive a monthly automated IT Scorecard, which has metrics from all of
the service management disciplines.
I use this to assess and manage my area, “running it as a business”.
Problem Management
Change Management
Financial Management
Capacity Management
Availability Management
Service Level Management
Service Continuity
Incident Management MIH and business
impacting incidents are reported per
management area
Change requests and their drivers are
reported per management area
Compliance per BCM policies is
reported per management area
Performance against application SLAs are manually
added
Server utilisation is reported per
management area
Cost and Headcount data is
reported per management area
� The scorecards bring together service management information in the areas of “Cost”, “Risk” and “Performance”.
29
Angie – COO
Beneficiaries
Summer – Project Mgr
Bobby – Service Desk
Jim – Central Config
Phil – Support Lead
Ali – Central IPC
�“Angie”-Am able to receive an
automated monthly scorecard illustrating the performance of my area.
�“Phil”-Can visualise every IT
component his services run on.
-Can quickly identify the root cause of an incident and who it effects.
�“Ali”-Can see who owns a
service and related services and therefore who to contact.
-Can minimise the risk of incidents due to poorly understood change.
�“Summer”-Can get a Time and
Material breakdown of services split between development and support.
-Can look up all the dependencies on my service and ensure all releases cause as little impact as possible.
�“Bobby”-When a client calls
the 55555s I can see what other incidents they have called in; and
-What other incidents there are against that same service
- I can also visualise the entire IT estate and
�“Jim”-Set standards behind
CMDB.
-Provide the central guidance for support teams as they populate the CMDB.
30
Conclusion – Lessons Learnt
� Need an end-to-end service management overview- Without tying in all the other streams of service management with configuration management, it is not possible to visualise any
of the benefits.
� Needs medium-term executive buy-in.- Configuration Management is always one of the first streams of work in a service management programme and it is arguably
the most critical.
- However there are no direct (or quantitive) benefits because of it.
- Benefits are realised by all other service management streams. i.e. improved Incident Management capability.
- Hence it takes times (1-2 years) to actually benefit from the launch on configuration management project.
- [Note: It is said that the average banking CIO last 1 ½ years!]
� Need service owners to take responsibility for own data.- Lots of information in the CMDB can be derived but the critical service and service relationship data has to be manually
maintained.
- Without support teams taking responsibility for the maintenance of this data, the potential success of your architecture and implementation is compromised.