Embed Size (px)
Citation preview
Metastable phenomena on calcite {I 0 I4} surfaces growing from Sr2+ -Ca2+ -CO�- aqueous solutions
J.M. Astilleros a,*, C.M. Pina a,b, L. Femandez-Diaz b, A. Putnis a
aJnstitutfur Mineralogie. Universitiit Munster, Corrensstraj3e 24. D-48149 Munste7; Germany hDpto. Cristalograjia y Mineralogia, Universidad Complutense, 28040 Madrid, Spain
Abstract
In situ atomic force microscopy (AFM) experiments, scanning electron microscopy (SEM) imaging and composition analysis, and X-ray diffraction have provided information about the growth, dissolution and transformation processes promoted by SI.2+ -Ca2+ -CO�- aqueous solutions in contact with calcite {1014} surfaces. Experiments have shown a wide variety of surface phenomena, such as the influence of the Sr-bearing newly-formed surface on the subsequent growth (template effect), the growth and subsequent dissolution of surfaces and the nucleation of secondary three-dimensional nuclei on calcite surfaces. These phenomena reveal the metastability of the crystallisation system and are a consequence of the interplay between thermodynamics (the relative stability of the two calcite and aragonite structure solid solutions that can be fOlmed), supersaturation of the aqueous solution with respect to the two possible solid solutions, and the crystallographic control of the surfaces on cation incorporation.
Keywordl': Solid solution-aqueous solution; Atomic force microscopy; Crystal growth; Calcite; Strontium carbonates
1. Introduction
The crystallisation of solid solutions from aqueous solutions provides a large number of interesting questions related to many fields in basic and applied science. Among them, for example, is the problem of the determination of distribution coefficient in solid solution-aqueous solution (SS-AS) systems, which could allow us to infer with precision the physicochemical conditions of natural crystallisation environ-
* Corresponding author. Fax: +49-251-83383-97. E-mail address:[email protected] (J.M. Astilleros).
ments, the incorporation of metals from contaminated waters into mineral structures (which act as geochemical barriers) or the influence of the composition of solid solutions on crystal morphology. Although efforts have been made to improve the knowledge of the thermodynamics and kinetics of solid solution precipitation from a macroscopic point of view (Glynn et aI., 1990; Prieto et aI., 1997; Rimstidt et aI., 1998; Pina and Putnis, 2002), the microscopic processes of solid solution crystallisation remain essentially unknown. Of special relevance to understanding the formation of crystals with a range of compositions is the study of the molecular scale mechanisms of the incorporation of growth units from
multicomponent aqueous solutions on crystalline surfaces. It is clear that changes in growth mechanisms and growth rates due to incorpomtion of growth units with different compositions result in changes in the micro topography of the growing surfaces. Surface features, such as the development of particular growth steps and two-dimensional nuclei shapes, growth anisotropy, etc., can now be studied using a number of surface science techniques (atomic force microscopy (AFM), microprobe analysis, X-ray photospectroscopy). By studying in detail the characteristics and deviations of the growing surfaces of solid solutions from the "normal growth" exhibited by surfuces of pure substances (end-members), it is possible to obtain relevant information about the nanometric phenomena which lead to the growth of crystals with compositional variability (pina et aI., 2000).
When considering crystallisation in SS-AS systems, particularly interesting is the case when two or more polymorphic modifications can crystallise in the same physicochemical environment, incorporating different amoWlts of a common cation. This is the case for many carbonates that coexist in nature and can form either rhombohedral (calcite-type) or orthorhombic (aragonite-type) structures. Large cations, such as Ba2 +, Sr2 + , Pb2 + , etc., are mainly accommodated in carbonates with aragonite-type structures, although small amoWlts of these cations can be also incorporated into calcite-type structures (Reeder, 1996). Since calcite is the stable form of CaC03 at room temperature and 1 atm, the structural control of cationic incorporation frequently leads to the formation of calcites with anomalous cation contents. Therefore, the interplay of structural, thermodynamic and kinetic factors will determine the crystallisation behaviourinM2+ _Ca2+ -C�--H
20(M2+ =Ba2+,
Sr2 + , Pb2 + , etc.) systems and will be partially responsible for the complexity that carbonate mineralogy exhibits in nature. A good example of such a complexity is the ability of many organisms to construct their shells and internal structures by influencing the physicochemical microenvironment and, therefore, controlling polymorphic crystallisation, composition and shape of crystals. The control of crystallisation conditions by organisms is basically an interfacial phenomenon and it constitutes one of the key problems in Wlderstanding biomineralisation mechanisms, i.e., the so-called vectorial control of
crystallisation (Mann, 2000). All the processes mentioned (metastable crystallisation, changes in growth rates, growth anisotropy, polymorphic crystallisation, etc.) will lead to the development of micro topographic changes on surfaces. Therefore, in situ observations at a molecular scale of growing surfaces of solid solutions, which potentially can grow with two alternative structures and a correlation with experimental conditions, will provide valuable information about crystallisation in SS-AS systems.
In this paper, we present a study of calcite {l 0 I 4) surfaces growing from carbonate solutions containing Sr + . In situ AFM observations, combined with scanning electron microscopy (SEM) imaging and composition analysis, indicate a complex behaviour of surfaces, where changes in growing steps, dissolution -reprecipitation and formation of secondary orthorhombic phases are common. These phenomena are indicative of the high metastability of the crystallisation system investigated. They have been analysed using supersaturation calculations for the possible solid solutions which can be formed, as well as by taking into acCOWlt the nucleation kinetics of the solid solutions and the crystallographic control of the surfaces on the cation incorporation.
2. The thermodynamics of the Sr-Ca-C03-H20
system, supersaturation evaluation and solvent
mediated transformation mechanism
2.1. Thennodynamic background
The intetpretation of growth phenomena in a SSAS system always requires a thermodynamic model which defmes not only the stability of the different phases involved in the crystallisation process but also the degree of ideality of the solid solutions that can be formed. In the Sr-Ca-C03-H
20 system, the ionic
radii of Ca2+ (0.99 A) and sl+ (1.13 A) result in different structures for CaC03 and SrC03 at 25 0 C and 1 atrn (rhombohedral and orthorhombic, respectively). Nevertheless, at equilibrium, a limited amoWlt of Ca can be incorporated into the orthorhombic structure and, conversely, some Sr can substitute in the Ca sites in the rhombohedral structure.
In SS-AS systems, the equilibrium relationships between the solid and aqueous phase can be described
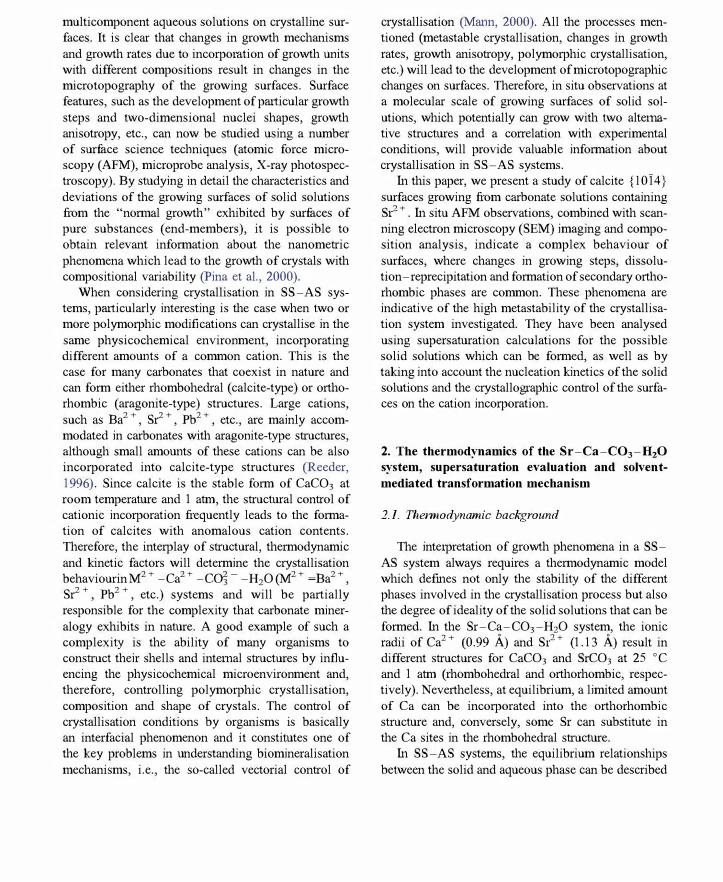
by means of the so-called "solidus" and "solutus" equations (Lippmann, 1980), which express the total solubility product variable, 'L;II, as a function of the solid and solution compositions, respectively. Lippmann's solidus and solutus curves can be represented in an equilibrium phase diagram, termed a Lippmann diagram (Glynn and Reardon, 1990; Glynn, 2000), where 'L;IIeq is plotted on the ordinate against two superimposed scales: one for the solid phase mole fractions of the solid solution end-members, and the other for the activity fractions of the cations in the aqueous solution. Equilibrium composition pairs are defined by horizontal tie lines between the solutus and solidus curves.
Fig. 1 a shows the Lippmann diagram for the (Sr,Ca)C03,orthorhombic-H20 system at 25°C and 1 bar. The solubility product for aragonite is Karagonite = 10- 8.34
(Plummer and Busenberg, 1982) and for strontianite is Kstrontianite = 10 - 9.
27 (Busenberg et aI., 1984). The solid
solution is subregular with the dimensionless RedlichKister coefficients ao = 3.43 and aj = - 1.82 (Plummer and Busemberg, 1987). The effect of non-ideality of the solid solutions results ina "eutectic" point on the solutus curve (left side of the diagram). The intersections of horizontal lines through the "eutectic" point with the solidus curve determine the miscibility gap of the solid solution. Such a miscibility gap can be found for 0.0058 <XSrC03 < 0.875 (Plummer and Busemberg, 1987).
In contrast to the orthorhombic system, the thermodynamic properties of (Sr,Ca)C03,rhombohedral-H20 system must be partially determined by a theoretical approach. This is because of the difficulty in obtaining experimentally the KSrC03.dwmboh,dml value. However, both the solubility product of KSrCOJChOmhohcdml and the ideality of such solid solution can be theoretically calculated following the method proposed by Svetjensky and Molling (1992) and the protocol presented by Bottcher (1997), respectively.
Sverjensky and Molling (1992) give an empirically linear free energy equation, applicable to cations of any charge, radius and chemical type, which allows one to estimate standard Gibbs free energies of formation at 25°C and 1 bar of some crystalline solid phases that are difficult or impossible to measure experimentally. They reported calculations for a number of hypothetical carbonates with the calcite structure, including SrC03. The solubility product of the
-7.00 -7.25 a -7.50 -7.75
Solidus c:: -8.00 "" H Cl -8.25 .................................................................... 0
...J -8.50 Solutus -8.75 / -9.00 -9.25 -9.50
0 0.1 0.2 0.3 0.4 0.5 0.6 0.7 0.8 0.9 1 X(SrC03) or X(Sr2+,aq)
-7.00 -7.25 b -7.50 ,---------
-7.75
c:: -8.00 H Cl -8.25 0
....J -8.50 -8.75 -9.00 -9.25 -9.50
0 0.1 0.2 0.3 0.4 0.5 0.6 0.7 0.8 0.9 1 X(SrC03) or X(Sr2+,aq)
Fig. I. Lippmann phase diagrams for the (a) (Ca,Sr)C03,ortho,hombicH20 and (b) (Ca,Sr)C03"hombohedml-H20 systems at 25' C. Dashed
line: diagram considering a hypothetical regular solid solution
model, and using the Madelung-Vegard approach of Lippmann
(1980), B6ttcher (1997) estimated a value of Go=2.6. Solid line:
diagram constructed from experimental data (Tesoriero and
Pankow, 1996), Go was estimated to be 1. 7.
hypothetical rhombohedral carbonates can be calculated from the expression:
10 K . = (aGo . - aGo g MeC03,lhom f:\1eC03xhom Cs) fMe21 (aq)
- aG[, )/RTlnlQ (1) co, (eq)

where T is the absolute temperature, R is the gas constant (8.314 J K - 1 mol- I ) and aGf are the standard Gibbs free energies of formation of the aqueous ions and the solid phase. By substituting the standard free energies reported by Sverjensky and Molling (1992) and Berg and Vanderzee (1978) into Eq. (l) for the case of the SrC03,rhombohedrah we obtain Ksrco"rhombohedral = 1 0 - 7.55. By assuming a regular behaviour and based on the cation radii reported by Shannon (1976), Bi:ittcher (1997) estimated a value of ao = 2.6, following the MadelungVegard approach of Lippmann (1980). From experimental works (Lorens, 1981; Apitz, 1981; Tesoriero and Pankow, 1996), a distribution coefficient for S? + into calcite, Dsr, eq=0.021-0.027, has been determined. The use of these data for characterising the regular behaviour of the (Sr,Ca)C03,rhombohedral solid solution gives an alternative ao parameter of - 1.7. This means that the (Sr,Ca)C03,rhombohedral solid solution is fully miscible.
Fig. 1 b shows the Lippmann diagrams proposed by Bi:ittcher (1997) for the (Sr,Ca)C03,rhombohedral-H20 system (dashed line, ao = 2.6) and constructed using the parameter ao= 1.7 (solid line), estimated from experimental data reported by Tesoriero and Pankow (1996). The solubility product of calcite is Kcalcite = 10 - 8.48 (Ball et aI., 1981).
It is worth noting that it is possible to determine the stability field of both solid solutions by superposing the Lippmann diagrams of both rhombohedral and orthorhombic (Sr,Ca)C03. The intersection of the solutus curves (XSr2+ ,aq "" 0 .125) defines the composition for which an aqueous solution is at equilibrium with respect to both solid solutions. Therefore, (Sr,Ca)C03,rhombohedral solid solution will be the most stable phase crystallising from aqueous solutions projected to the left of the intersection point (labelled as P). Conversely, (Sr,Ca)C03,orthorhombic will be the most stable phase forming from aqueous solutions projected to the right of the intersection point. Fig. 2 shows the unified Lippmann phase diagram for the (Sr,Ca)COrH20 system. New solidus and solutus curves (solid lines) were plotted after comparing the solidus and solutus curves of both orthorhombic and rhombohedral systems and choosing the segment of the curves with a minimum value of 10g'I:,II in a similar way to the G-P -T diagrams. A very similar unified Lippmann diagram is obtained by considering
-7.00 -7.25 -7.50 -7.75
� -8.00 IN 0> -8.25 0
...J -8.50 -8.75 -9.00 -9.25 -9.50
0
- - ---------I
�"""" --,----------:'/---
/ Solidus /' " \ ' ��
orthorhombic
0.1 0.2 0.3 0.4 0.5 0.6 0.7 0.8 0.9 1
X(SrC03) or X(Sr2+,aq)
Fig. 2. Lippmann phase diagram for the (Ca,Sr)C03-H20 resulting
from the superposition of Fig. lea) and (b). Solid lines were plotted
after comparing the solid and solutus curves of both systems and
choosing the segment of the curves with a minimum value of
logL:IT. This lines define, therefore, the thermodynamic equilibrium
condition. The intersection point (P) of the solutus curves of both
systems separate the regions where the rhombohedral and
orthorhombic solid solution are stable (see text).
the (Sr,Ca)C03,rhombohedral-H20 Lippmann diagram constructed using ao = 1.7.
2.2. Supersaturation with respect to a solid solution: the () junction
Although the analysis of thermodynamic equilibrium is a necessary starting point for understanding crystallisation and dissolution processes, the actual behaviour of the system is determined by kinetics. Therefore, supersaturation has a strong influence on crystallisation, affecting nucleation, growth mechanisms, crystal morphologies and distribution coefficients. Supersaturation is the fundamental parameter used in this work for interpreting AFM and SEM observations. When two solid solutions are involved in the crystallisation process, as is the case here, supersaturation evaluation is not a trivial task. Firstly, it is necessary to take into account that the supersaturation state of a given aqueous solution with respect to a solid solution is not described by a single value, but is a function of the solid composition.
Prieto et al. (1993) defmed the so-caned P(x) fimction to evaluate the supersaturation of an aqueous solution with respect to a solid solution. Although P(X) provides a general description of the distribution of supersamrations as a function of the solid composition, it is based on the pseudoequilihriwn condition of
stoichiometric satmation, whose validity for precipitation processes has been widely questioned (Glynn and Reardon, 1990). Recently, we have proposed a new function, J(x), for evaluating supersaturations in SS-AS systems, directly derived from the two conditions of thermodynamic equilibrium for such systems (Astilleros et aI., in press(b)). In the general case of a SS-AS system, (B,C)A-H20, the supersatmation is given by the expressions:
(2)
(3)
for X� � XeA> where XBA and XeA are the molar fractions of CA and BA in the solid solution; l'BA and
YeA are tile activity coefficients of CA and BA in the solid solution; XCA eq is the molar fraction of the solid at equilibriwn with respect to an aqueous solution of reference that has the same activity fraction as the given aqueous solution, and a(A -), a(B +) and a(C + ) are tile activities of the ions in solution. Finally, KSA and KCA are the solubility products of the endmembers of tile solid solution.
A fwther complication arises when there exist alternative snuctmes, which can fann solid solution with different compositional ranges and solubilities. It requires the calculation of two J(x) fimctions for the same aqueous solution. For evaluating the superstaturation state of the aqueous solutions, we have considered that Sr"+ and Ca2+ can be incorporated into bOtll rhombohedral (calcite) and orthorhombic (aragonite) structures. The supersaturation expressions used for tlle Sr"+ _Ca
2+ -C03-H20 system were,
according to Astilleros et a1. (in press(a,b)): (1) Olthorhombic phase:
b0rthochombio _
a(Ca2+)a(CO�-) XCi� - K arngonite aaragonite (4)
for Xs;bo S XSrCO , and , ,
borthorlwmbio _ a(S?+)a(CO�-) xSrC°3 - Kstrontimiteastrontianite
for Xs':6 ;;, Xs.co . , ,
(2) rhornbohedral phase:
b1:,ombObedrnJ = a(Ca2+)a(COj-) � Kcruciteacrucite
(5)
(6)
(7)
for Xs':bo,;;'Xs,co
" where a(Sr"+), a(Ca2+) and
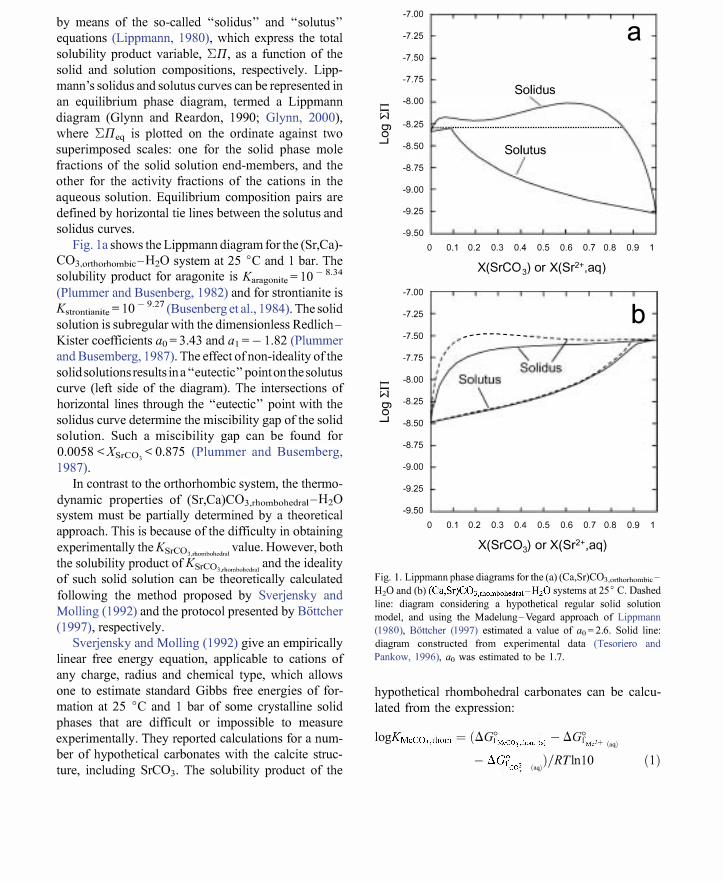
a(Cd, - ) are the activities of the free ions in the solution, and aSrC03,!'homboMd<al' acalcite, astrontianite and aaragonite are the activities of the components in the solid phase. Fig. 3 shows, as an example, Il,e supersaturation distribution as a ftmction of the solid composition corresponding to an aqueous solution of composition a(Sr"+)=5XlO-5, a(Ca2+)=2xlO-4 and a(COj -) = I x 10-4 (note that, since the definition of activity a standard state of 1 molll is assumed, activities are dimensioniess). As can be observed, the maximum supersaturation (P= 10.1) is reached for an orthorhombic solid with molar fraction Xs,c
o, = 0.931.
This is a direct consequence of the shape and relative positions of the solutus curves on the Lippmalm diagram (see Fig. 1). Because Xs,' •. " of tlle solution is higher than the XS,H � at the intersection point P (Fig. 2), the supersaturation function maximwn cOlTesponds to an Olthorhombic phase. In addition, the extension of the solid solution is limited, and, therefore, such a maximum is located near the endmember position. It is also worth noting that, for the compositional ranges for which there are miscibility gaps, aqueous solutionsolid solution thermodyuamic equilibrium CarInot be
defined. Therefore, for such composition ranges, supersaturation cannot be calculated.
2.3. Solvent mediated polymorphic transformations
When a metastable crystalline solid is in contact with all aqueous solution, the solvent Call actively take prut in a phase transformation process by allowing the simultaneous dissolution of the metastable phase and the recrystallisation of new crystals of Ille stable

8 r-
6
� 4
SrC03 orthorhombic SrC03 rllOmbohcdral
I I I I
6. 0 ···
� . .
I I
I XSr,aq = 0.20 I
-
-
-
4.00L,c-'LO-:-'O,o.L--,O'"'.O ()(iC-· L-JO , O l
2 � • .. ,; io
+---- miscibility gaps -
:-•••• , I I I I O �--��L-------L-----�L-------L-��� 0.0 0.2 0.4 0.6 0.8 1
XSrC03
Fig. 3. Supersaturation functions, c5(x) for a hypothetical aqueous solution of composition a(Sr2 + ) = 5 X 10⁻⁵, a(Ca2 + ) = 2 X 10⁻⁴ and
a(CO� - ) = 1 x 10⁻⁴ with respect to both orthorhombic and rhombohedral solid solutions. Supersaturation functions have not been drawn for the
solid compositions in the miscibility gaps, i.e., for those aqueous solution-solid solution pairs for which thermodynamic equilibrium cannot be
defined.
phase. This is common in reconstructive transformations where the structures are so different that the transition between them can only occur by breaking and formation of chemical bonds. The aqueous solution acts as catalyst and such a process is called solvent-mediated transformation (Cardew and Davey, 1985; Davey and Garside, 2000).
Such a process has been experimentally studied and theoretically modelled for the case of polymorphic transformations of pure substances. Several studies on the solvent-mediated transformation of the unstable orthorhombic phase (aragonite) to the rhombohedral stable phase (calcite) in pure water or in presence of different ions have been reported (Bischoff and Fyfe, 1968; Carlson, 1983; Ogino et al., 1987; 1990). However, solvent-mediated polymorphic transformation processes can also take place in systems where parent and final phases do not necessarily have the same chemical composition but can be considered as members of a solid solution. In such a case, the most important property that determines the
relative solubility (and, therefore, the stability and metastability of the polymorphs) of the different phases involved in the transformation process is not the temperature but the composition of the aqueous phase. In the system (Sr,Ca)COrH20 at 25°C, the polymorphic solvent-mediated transformation process can be expressed as:
(Sr, Ca)C03,rhombohedral + Sr2+ + H20 f-7(Sr, Ca)C03,orthorhombic + Ca2+ + H20
From the thermodynamic properties discussed in Section 2.1, we can conclude that the rhombohedral to orthorhombic solvent-mediated transformation is thermodynamically possible if during the evolution of the system the conditions XSr2 , ,"q>0.125 and 10g�II of the solution >log�IIeq (solutus curve in orthorhombic system-Fig. la) are reached. The inverse reaction will, therefore, be possible when XSr2 ,"q < 0.l25 and 10g�II of the solution >log�IIeq (solutus curve in rhombohedral system-Fig. 1 b).
3. Experimental procedure
3.1. In situ AFM observations
Experiments to study the effect of si' + ions on the growth of carbonates were made by in situ observations on calcite {1 0 f 4) surfaces during growth, using a Digital Multimode AFM, equipped with a fluid cell. Calcite surfaces used as substrates were obtained by cleaving optically clear Iceland Spar. Before each growth experiment, deionised water was passed over the crystal in order to clean surfaces, as well as to adjust the AFM parameters. This led to a slight dissolution of the calcite {I 0 f 4) surface both by retreating cleavage steps and the formation and spread of etch pits. The etch pits on the calcite {I 0 f 4) surface usually show a typical rhombohedral shape limited by [441] and [48 f] steps. Parallel steps with opposite senses of advancement are not related to each other by any symmetry element, and, therefore, they are not equivalent (Staudt and Reeder, 1994). From direct observation of the development of such etch pits, it is possible to determine Wlequivocally the crystallographic directions on calcite {1 0 f 4) surfaces before each growth experiment.
Aqueous solutions for promoting growth were prepared by mixing Na2C03, Sr(N03h and CaCl2 (SIGMA 99+%). The pH of the solutions (10.20 ± 0.05 in all cases) was measured using a TESTO 230 pH meter with a pH meter electrode (type 05 pH) calibrated using 7.00 and 10.00 buffers (Sholt Gerate). Table I shows the composition of the solutions used. Two different series of AFM growth experiments were conducted for each aqueous solution composition: (a) runs where solutions were injected at intervals of about I min between each AFM scan in order to maintain the same degree of supersaturation during
Table 1 Concentrations, activity fractions and ionic strength of the solutions used in the AFM grO\vth experiments
Solution [CaCI2] [S«NO;hl [Na2C03] XSr,aq Ionic munber (mmoVl) (mmoVl) (mmoUl) Strength
0.225 0.2 0.3 0.475 1.89 x I Q 2 0.245 0.4 0.3 0.625 2.52 x I Q- 3
3 0.350 1.6 0.3 0.820 6.29 x I Q- 3
4 0.538 4.0 0.3 0.875 1.39XIQ- 2
the observation time; (b) runs with static solutions in the fluid cell with no flow through the system. With the later procedure, the crystallisation system is allowed to evolve towards equilibrium.
Because supersaturation states of the solutions have been evaluated using Eqs. (2) and (3), it is necessary to calculate the activities of the ions in solution. The activity coefficients for Ca2 + , Sr2 + and Ccn - were computed using the extended DebyeHiickel formula (Stomm and Morgan, 1981) for ionic strength in the range of 1.89 x 10 -3
-1.39 x 10 -2 (see Table 1, last column). The aqueous speciation program used considered the following species: H + , OH-, Ca2+, S?+, Cl-, Na+, CO�-, HCOi', H2C030, CaOH+, SrOH+, NaOHo, CaCOg, SrCOg, NaCO" NaClo, CaHCO;, SrHCO;, Na2COg and NaHC03o. Ion size parameters required to apply the extended Debye-Hiickel formula were taken from Truesdell and Jones (1974).
For all solutions, the supersaturation with respect to the end-member calcite or aragonite was kept constant. The supersaturation with respect to strontianite or SrC03,rhombohedral was increased in each experiment by increasing the concentration of Sr. In order to maintain the supersaturation at a constant value with respect to calcite, Ca concentmtions in the solutions were adjusted. In all the experiments, the carbonate concentration was maintained constant. Experiments were conducted at 25 0 C and I atm.
3.2. SEM images and composition suiface analysis
After growth experiments, crystals were taken from the AFM fluid cell, dried with pressurised air to remove the solution from the surfaces and observed using a scanning electron microscope (JEOL GSM-6300F). The chemical composition was analysed using a Link-analytical EDX system (Oxford Instruments). These ex situ observations allowed us to obtain information about the composition and spatial distribution of the different phases fonned on calcite surfaces.
3.3. X-ray diffraction
Crystals formed on calcite surfaces were analysed by X-ray diffraction using a Phillips PW-I050 diffractometer (Cu Ko radiation). Calcite crystals were

1
t = 0':00"
1
t = 2':05"
5 4
I' 3 2 ,1 ,
r
2
immersed in Sr-bearing solutions with the same concentration of those used for the AFM experiments. After some minutes, crystals were removed from the solution and rapidly dried with compressed air. Then surfaces were carefully scratched in order to remove enough amount of newly formed crystallites for powder diffraction analysis. X-ray diffraction patterns were compared with the available files of Sr-carbonates published by JCPDS-lnternational Centre for Diffraction Data.
4. AFM observations of the growing surfaces
4.1. Calcite {IOl4} faces growing from Sr-bearing solutions
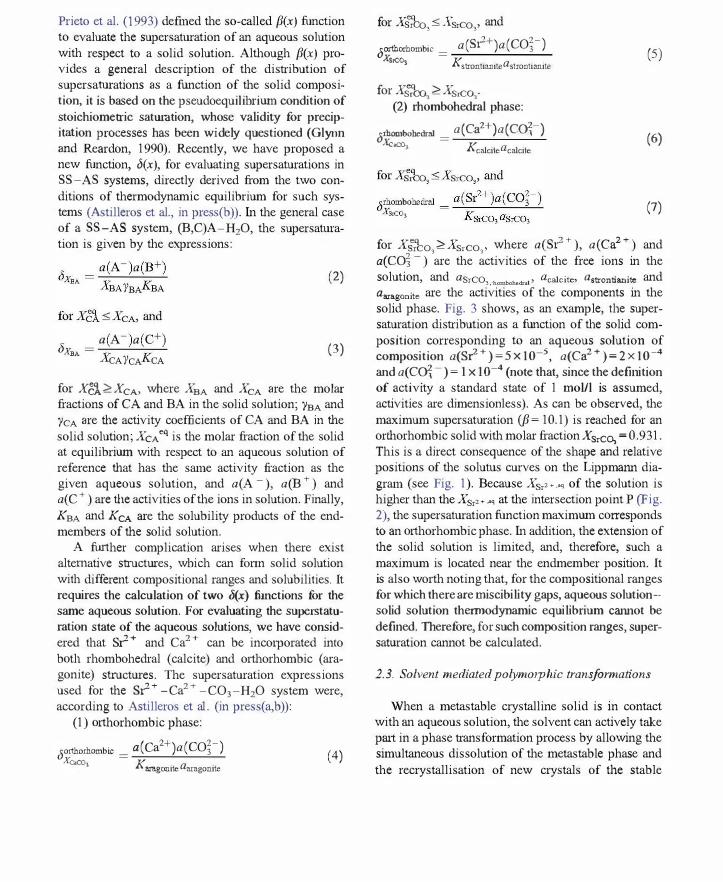
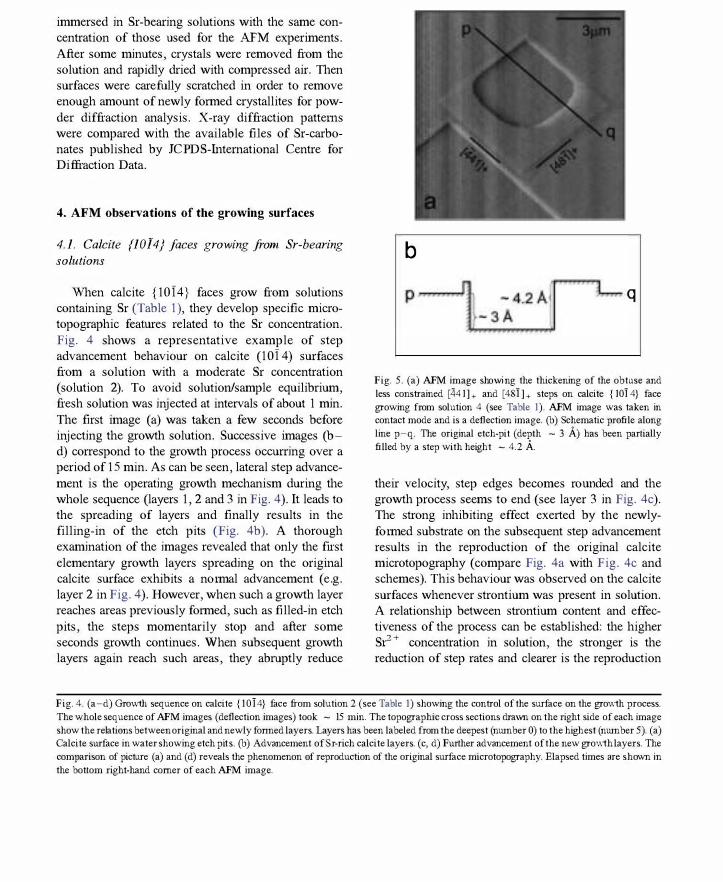
When calcite {I 0 r 4) faces grow from solutions containing Sr (Table I), they develop specific microtopographic features related to the Sr concentration. Fig. 4 shows a representative example of step advancement behaviour on calcite (1014) surfaces from a solution with a moderate Sr concentration (solution 2). To avoid solution/sample equilibrium, fresh solution was injected at intervals of about 1 min. The first image (a) was taken a few seconds before injecting the growth solution. Successive images (b
d) correspond to the growth process occurring over a period of 15 min. As can be seen, lateral step advancement is the operating growth mechanism during the whole sequence (layers I, 2 and 3 in Fig. 4). It leads to the spreading of layers and finally results in the filling-in of the etch pits (Fig. 4b). A thorough examination of the images revealed that only the first elementary growth layers spreading on the original calcite surface exhibits a normal advancement (e.g. layer 2 in Fig. 4). However, when such a growth layer reaches areas previously formed, such as filled-in etch pits, the steps momentarily stop and after some seconds growth continues. 'When subsequent growth layers again reach such areas, they abruptly reduce
b
"""'L, q
Fig. 5. (a) AFM image shO\ving the thickening of the obtuse and less constrained [44 1 ]+ and [481]+ steps on calcite {1014} face growing from solution 4 (see Table 1). AFM image was taken in contact mode and is a deflection image. (b) Schematic profile along line p-q. The original etch-pit (depth - 3 A.) has been partially filled by a step with height - 4.2 A.
their velocity, step edges becomes roWlded and the growth process seems to end (see layer 3 in Fig. 4c). The strong inhibiting effect exerted by the newlyformed substrate on the subsequent step advancement results in the reproduction of the original calcite microtopography (compare Fig. 4a with Fig. 4c and schemes). This behaviour was observed on the calcite surfaces whenever strontium was present in solution. A relationship between strontium content and effectiveness of the process can be established: the higher Sr + concentration in solution, the stronger is the reduction of step rates and clearer is the reproduction
Fig. 4. (a -d) GrO\vth sequence on calcite {I 0 I 4} face from solution 2 (see Table 1) showing the control of the surface on the grov.rth process. The whole sequence of AFM images (deflection images) took - 15 min. The topographic cross sections dravro on the right side of each image show the relations between original and newly fonned layers. Layers has been labeled from the deepest (munber 0) to the highest (munber 5). (a) Calcite surface in water showing etch pits. (b) Advancement ofSr-rich calcite layers. (c, d) Further advancement of the new grov.rth layers. The comparison of picture (a) and (d) reveals the phenomenon of reproduction of the original surface microtopography. Elapsed times are shovro in the bottom right-hand corner of each AFM image.
of the original microtopography. This phenomenon has been also observed in growth experiments earned out on calcite (1014) surfaces from Mn-bearing aqueous solutions (Astilleros et aI., 2002a).
For the solution with the highest Sr-content (solution 4) as well as the phenomenon of reproduction of the original surface features described above, faster growth of thicker steps is observed. Fig. Sa shows a calcite etch pit partially closed after some minutes of growth from solution 4. In this figure, the thickening of the obtuse and less constrained [441]+, [481]+ steps (notation according to Staudt and Reeder, 1994) is evident. Measurements indicate that the newly formed steps are - 4.2 A in height, - 1.2 A higher than the normal calcite growth steps. Fig. Sb shows a schematic profile along line p-q. A similar increase in the height of growth steps also occurs in calcite (1014) surfaces growing in the presence of barium (Astilleros et aI., 2000).
a
c
5,um
4.2. Nucleation of (Sr,Ca)C03,orthorhombic calcite {IOI4) faces: dissolution-crystallisation phenomena
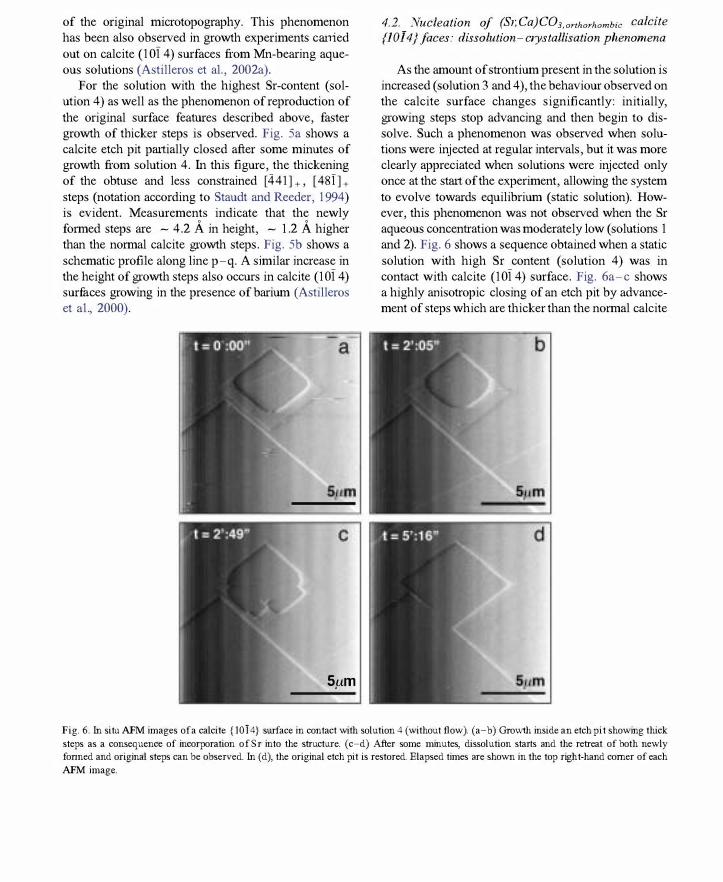
As the amoWlt of strontium present in the solution is increased (solution 3 and 4), the behaviour observed on the calcite surface changes significantly: initially, growing steps stop advancing and then begin to dissolve. Such a phenomenon was observed when solutions were injected at regular intervals, but it was more clearly appreciated when solutions were injected only once at the start of the experiment, allowing the system to evolve towards equilibrium (static solution). However, this phenomenon was not observed when the Sr aqueous concentration was moderately low (solutions 1 and 2). Fig. 6 shows a sequence obtained when a static solution with high Sr content (solution 4) was in contact with calcite (1014) surface. Fig. 6a-c shows a highly anisotropic closing of an etch pit by advancement of steps which are thicker than the normal calcite
Fig. 6. In situ AFM images ofa calcite {IOI4} surface in contact with solution 4 (without flow). (a-b) GrO\vth inside an etch pit showing thick steps as a consequence of incorporation ofSr into the structure. (c-d) After some minutes, dissolution starts and the retreat of both newly fonned and original steps can be observed. In (d), the original etch pit is restored. Elapsed times are shown in the top right-hand corner of each AFM image.
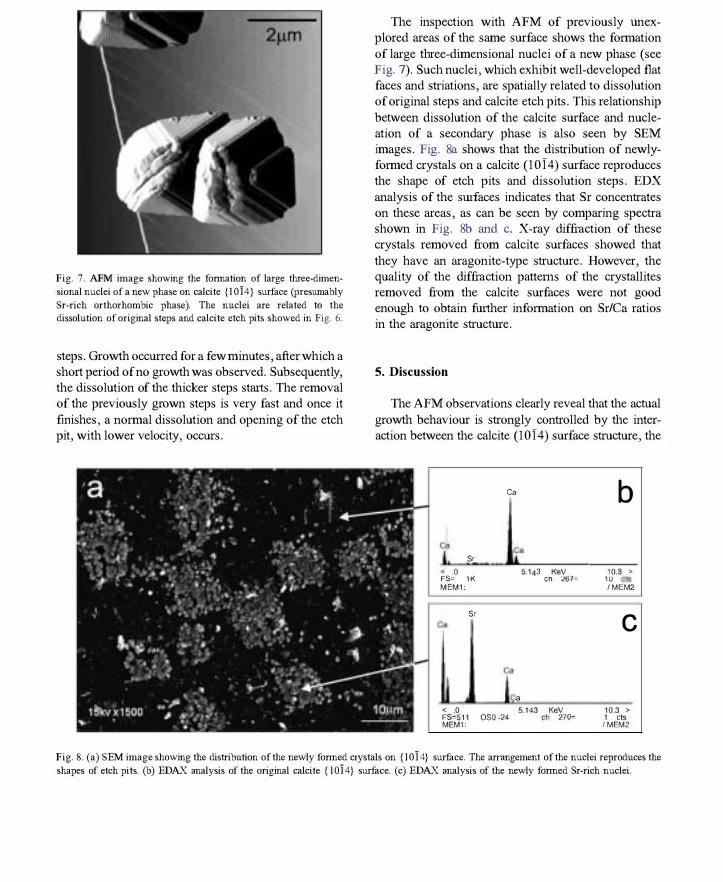
Fig. 7. AFM image showing the fonnation of large three-dimensional nuclei of a new phase on calcite {I 0 I 4 } surface (preslUllably Sr-rich orthorhombic phase). The nuclei are related to the dissolution of original steps and calcite etch pits showed in Fig. 6.
steps. Growth occurred for a few minutes, after which a short period of no growth was observed. Subsequently, the dissolution of the thicker steps starts. The removal of the previously grO\vn steps is very fast and once it finishes, a normal dissolution and opening of the etch pit, with lower velocity, occurs.
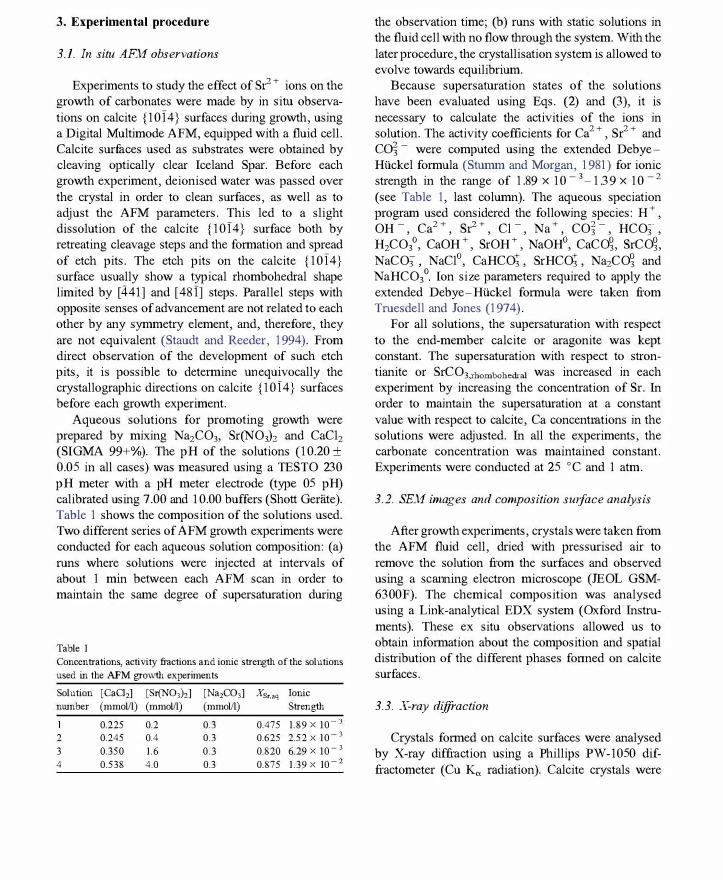
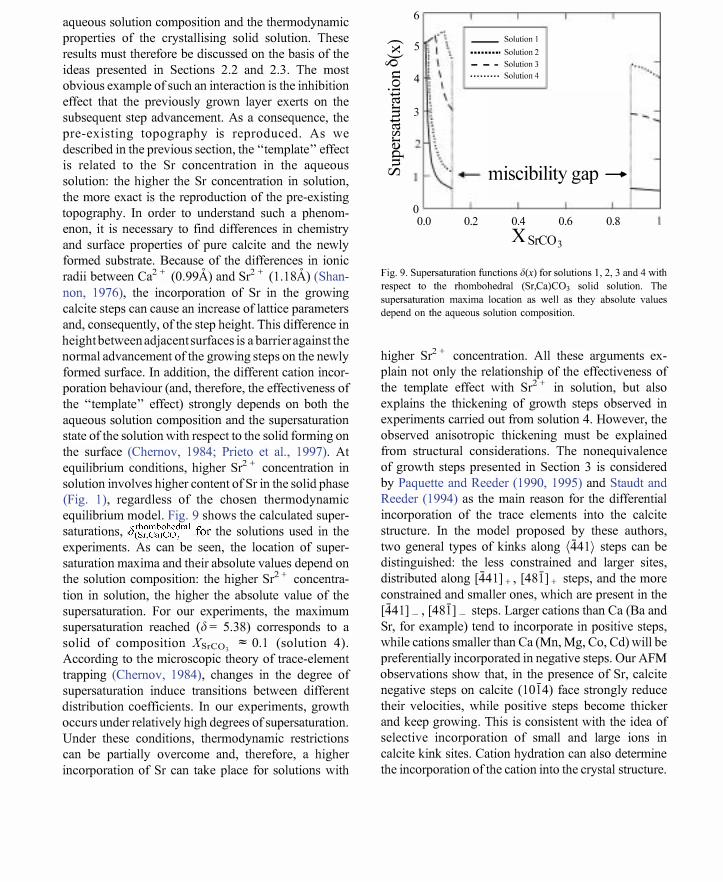
The inspection with AFM of previously Wlexplored areas of the same surface shows the formation of large three-dimensional nuclei of a new phase (see Fig. 7). Such nuclei, which exhibit well-developed flat faces and striations, are spatially related to dissolution of original steps and calcite etch pits. This relationship between dissolution of the calcite surface and nucleation of a secondary phase is also seen by SEM images. Fig. 8a shows that the distribution of newlyformed crystals on a calcite (10 r 4) surface reproduces the shape of etch pits and dissolution steps. EDX analysis of the smfaces indicates that Sr concentrates on these areas, as can be seen by comparing spectra shown in Fig. 8b and c. X-ray diffraction of these crystals removed from calcite surfaces showed that they have an aragonite-type structure. However, the quality of the diffraction patterns of the crystallites removed from the calcite surfaces were not good enough to obtain further information on Sr/Ca ratios in the aragonite structure.
5. Discussion
The AFM observations clearly reveal that the actoal growth behaviour is strongly controlled by the interaction between the calcite (10 r 4) surface structure, the
c,
k c,
I, s, < .0 5.143 K,V FS" '" co 21j7" MEM1:
s, c,
, < .0 5.143 KeV FS"511 OSO -24 ch 270" MEM1:
b
10.3 :-W '" IMEM2
e
10.3 :-1 cts /MEM2
Fig. 8. (a) SEM image showing the distribution of the newly fonned crystals on {I 0 I 4} surface. The arrangement of the nuclei reproduces the shapes of etch pits. (b) EDAX analysis of the original calcite {lOI4} surface. (c) EDAX analysis of the newly fonned Sr-rich nuclei.
aqueous solution composition and the thermodynamic properties of the crystallising solid solution. These results must therefore be discussed on the basis of the ideas presented in Sections 2.2 and 2.3. The most obvious example of such an interaction is the inhibition effect that the previously grown layer exerts on the subsequent step advancement. As a consequence, the pre-existing topography is reproduced. As we described in the previous section, the "template" effect is related to the Sr concentration in the aqueous solution: the higher the Sr concentration in solution, the more exact is the reproduction of the pre-existing topography. In order to understand such a phenomenon, it is necessary to find differences in chemistry and surface properties of pure calcite and the newly formed substrate. Because of the differences in ionic radii between Ca2 + (0.99A) and Sr2 + (1.18A) (Shannon, 1976), the incorporation of Sr in the growing calcite steps can cause an increase of lattice parameters and, consequently, of the step height. This difference in height between adjacent surfaces is a barrier against the normal advancement of the growing steps on the newly formed surface. In addition, the different cation incorporation behaviour (and, therefore, the effectiveness of the "template" effect) strongly depends on both the aqueous solution composition and the supersaturation state of the solution with respect to the solid forming on the surface (Chemov, 1984; Prieto et aI., 1997). At equilibrium conditions, higher Sr2 + concentration in solution involves higher content of Sr in the solid phase (Fig. 1), regardless of the chosen thermodynamic equilibrium model. Fig. 9 shows the calculated super-
. s: rhombohedral.c: h l ' d' h saturatlOns, U(Sr,Ca)C03 lor t e so utlOns use m t e experiments. As can be seen, the location of supersaturation maxima and their absolute values depend on the solution composition: the higher S? + concentration in solution, the higher the absolute value of the supersaturation. For our experiments, the maximum supersaturation reached (6 = 5.38) corresponds to a solid of composition XSrCO, ;:::; 0.1 (solution 4). According to the microscopic theory of trace-element trapping (Chemov, 1984), changes in the degree of supersaturation induce transitions between different distribution coefficients. In our experiments, growth occurs under relatively high degrees of supersaturation. Under these conditions, thermodynamic restrictions can be partially overcome and, therefore, a higher incorporation of Sr can take place for solutions with
6
-- 5 � '-" <>0 :::: 4 0 ....... � B ro
3 [/) l-< V §" r:FJ.
0 0.0
__ Solution 1 ••••••••• Solution2 - - - Solution 3 ......... Solution4
miscibility gap ---+
0.2 0.4 0.6
XSrC03 0.8
Fig. 9. Supersaturation functions .l(x) for solutions 1, 2, 3 and 4 with
respect to the rhombohedral (Sr,Ca)C03 solid solution. The
supersaturation maxima location as well as they absolute values
depend on the aqueous solution composition.
higher Sr2 + concentration. All these arguments explain not only the relationship of the effectiveness of the template effect with S? + in solution, but also explains the thickening of growth steps observed in experiments carried out from solution 4. However, the observed anisotropic thickening must be explained from structural considerations. The nonequivalence of growth steps presented in Section 3 is considered by Paquette and Reeder (1990, 1995) and Staudt and Reeder (1994) as the main reason for the differential incorporation of the trace elements into the calcite structure. In the model proposed by these authors, two general types of kinks along (441) steps can be distinguished: the less constrained and larger sites, distributed along [441] + , [481] + steps, and the more constrained and smaller ones, which are present in the [441] _ , [481] _ steps. Larger cations than Ca (Ba and Sr, for example) tend to incorporate in positive steps, while cations smaller than Ca (Mn, Mg, Co, Cd) will be preferentially incorporated in negative steps. Our AFM observations show that, in the presence of Sr, calcite negative steps on calcite (1014) face strongly reduce their velocities, while positive steps become thicker and keep growing. This is consistent with the idea of selective incorporation of small and large ions in calcite kink sites. Cation hydration can also determine the incorporation of the cation into the crystal structure.

However, because the enthalpy of hydration of Sr2 + is only about 10% lower than Ca2 + (Lippmann, 1973), this property does not seem to play a decisive role in the crystallization process occurring in our system.
In order to understand the growth and dissolution phenomena described in Section 4.2 and shown in Fig. 6, it is necessary to take into account the calculated supersaturations, b(���:)�'8�al and ()�����)t�bi", for the solutions used in the experiments (Fig. 10). As was expected, higher Sr concentrations of the solutions
40 ,-----.-----,-----,-----,-----�
50U ••••• \ •• -
40 \.-
12 :;:���ility gaps--
O �-=��----�------L------L��� 0.0
150
0.2 0.4 0.6 0.8 XSrC03
I XS"q = 0.820 I
5.0
•••
".
140
4.0 ••••••
� 3.0 ; 135
() 0.02 0.04 0.06 0,08 () (J,995 1
1_ miscibility gaps--
O ����----�------L------L�==� 0.0 0.2 0.4 0.6 0.8
XSrC03
result in higher supersaturations with respect to both the calcite and aragonite structures. For Ca-rich solids, supersaturation is not strongly dependent on the solid structure, and, therefore, similar supersaturation values with respect to both calcite and aragonite were obtained. However, because of the high difference between Kstrontianite and KSrCO"rhombohedral ( � 10 - 1 .7) , the supersaturation for Sr-rich solid solutions with respect to an aragonite structure is clearly higher than the supersaturation for a calcite structure. What
60 ,-----,-----,-----,----,,----,
� 50 I>< '--' CiO I=i 0 40
....... � ;...; 30 B ro rfJ
- SrC030rthorhumbil.: I XSr,aq= 0.625 I " ':.
:0
'
'.:�'��O"�_
"[d �
40 ... . l .. .
3.0 ' SO ;...; 30 (\) §"
VJ 10 ;: " miSCibili� �ap�--0 0.0
250 � I>< ;:;0' 200 I=i o
rO
� lOO(\) §"
VJ 50
0.2 0.4 0.6 XSrC03
j. •••••
0.8
- SrC030rthorhumbic I XSr,aq = 0.875 I •••••• STeol 'homboh,d,,' �_
5,() . ...... .. _ 0 ........
210w
213
4.0
3.0 : 210
1),05
! _ miscibility gaps--o -=�L-� ____ � ______ L-____ -L�==�
0.0 0.2 0.4 0.6
XSrC03 0.8
Fig. 10. Supersaturation functions (l(x) for solutions I, 2, 3 and 4 with respect to both orthorhombic and rhombohedral (Sr,Ca)C03 solid
solutions. By increasing Sr content in the aqueous solution, a higher supersaturation with respect to the aragonite-type phase is obtained (note
the different scale of the ordinates). As can be seen, supersaturation functions are not defined for the ranges of solid composition for which
miscibility gaps exist.

emerges from our calculations is that the formation of a Sr-rich solid solution (Sr,Ca)C03 (orthorhombic) is in all experiments favoured.
However, the layer growth mechanism observed in the initial growth on the calcite surface, specially in solutions 1 and 2, suggests that the new growth is of a rhombohedral phase. This occurs because the calcite substrate allows the system to reduce its free energy by the metastable growth of Sr-rich calcite structure. For solutions 1 and 2, the supersaturation with respect to the orthorhombic phase is not high enough to promote its nucleation (at least, during the time of the experiments). Therefore, only the growth of met astable Sr-rich calcite is observed.
Conversely, in experiments 3 and 4, the supersaturation with respect to the orthorhombic phase is higher and, after an induction period, nuclei formation takes place. As the growth of these nuclei of the orthorhombic phase proceeds, the solution becomes undersaturated with respect to the rhombohedral phase and it begins to dissolve. This results, in turn, in an increase of supersaturation with respect to the orthorhombic phase, which will continue growing. In the case of static solution, such a coupled dissolutiongrowth process will proceed Wltil the system reaches equilibrium. However, when the solution is flowing over the crystal surface the equilibrium never will be reached and, in principle, the dissolution-growth transformation will finish once the rhombohedral phase completely dissolves.
All the phenomena sho\Vll and discussed in this paper revealed the high complexity of surface processes that can be observed when supersaturated S?+ _Ca2+ -CO� - aqueous solutions are in contact with calcite (1014) surmces. Atomic force microscopy has been demonstrated to be a very suitable technique for the observation and study of microscopic solid solutions formation and solvent-mediated phase transformations. The template effect, which results in the reproduction of the original surface features, has been also observed in Mn-Ca-C03-H20 system (Astilleros, 2001). It demonstrates that the growing surfaces (and the growing phase) are chemically heterogeneous and the surface itself plays an important role on the whole growth process. Our work suggests that in the study of phenomena such as the development of zoning in carbonates (usually explained in terms of the difference between the solubility product of the
pure end-members, the ideality of the solid solution, the incorporation of growth units into the growing crystal, etc.), one must pay attention to the nanometric features of growing surfaces. Moreover, our observations indicate that processes occurring on calcite surfaces on a molecular scale can control some macroscopic mineral phenomena fOWld in nature. Among them, it is worth mentioning the recrystallisation of metastable phases during early diagenesis (Sayles and Manheim, 1975) and the spatial association of strontian calcites and aragonites in deep sea sediments (Baker et aI., 1982).
Acknowledgements
The authors thank C. Putnis for assistance with scanning electron microscopy and A. Breit for carrying out X-ray diffraction measurements. We also thank the Deutsche Forschungsgemeinschaft (DFG) for fmancial support of this work. I.M. Astilleros acknowledges the receipt of a Marie Curie Fellowship from the European Commission. Carlos M. Pina acknowledges fmancial support from Spanish Ministry of Science and TecItnology ("Ramon y Cajal" program). The authors appreciate the careful reviews by Drs. Pat Brady, Roy Wogelius, and comments by Dr. Eric Oelkers. [EO]
References
Apitz, S.E., 198 1 . The lithification of ridge flank basal carbonates: characterization and implications for Sr/Ca and MglCa in marine chalks and limestones. PhD dissertation, University of California.
Astilleros, 1.M., Pina, C.M., Fernandez-Diaz, L., Pumis, A., 2000. The effect of barilUll on calcite (1014) surfaces during growth. Geochim. Cosmochim. Acta 64, 2965-2972.
Astilleros, 1.M., Pina, C.M., Fernandez-Diaz, L., Putnis, A., 2002a. Molecular scale surface processes during the growth of calcite in the presence of manganese. Geochim. Cosmochim. Acta 66, 3 177-3189.
Astilleros, 1.M., Pina, C.M., Fernandez-Diaz, L., Pumis, A., 2002b. Supersaturation fimctions in binary solid solution-aqueous solution systems. Geochim. Cosmochim. Acta (in press).
Baker, P.A., Gieskes, 1.M., Elderfield, H., 1982. Diagenesis of carbonates in deep-sea sediments-evidence from Sr/Ca ratios and interstitial dissolved s1 + data. 1. Sediment. Petrol. 52, 7 1 - 82.
Ball, 1.W., Nordstrom, D.M., lelllle, EA., 1981. Additional and revised thennochemical data and computer code for WATEQ2-a computerized chemical model for trace and major element speciation and mineral equilibria of natural waters. \\!RI 78-116. US Geological Survey, Menlo Park, CA.
Berg, L.B., Vanderzee, C.E., 1978. Thennodynamics of carbon dioxide and carbonic acid: (a) the standard enthalpies of solution ofNa2C03 (s), y CO2 (g) in water at 298.15 K; (b) the standard enthalpies of fonnation, standard Gibbs energies of fonnation, and standard entropies of CO2 (aq), HC03" (aq), C� - (aq), NHC03 (s), Na2C03 (s), Na2C03·H20, and Na2C03· lOH20 (s). 1. Chem. Thennodyn. lO, 1 1 1 3 - 1136.
Bischoff, 1.L., Fyfe, W.S., 1968. Catalysis, inhibition, and the calcite-aragonite problem: I. The aragonite-calcite transfonnation. Am. 1. Sci. 266, 65-79.
B6ttcher, M.E., 1997. Comment "Solid solution partitioning of S?+ , Ba
2+ , and Cd2+ to calcite" by A.l. Tesoriero and 1.F.
PankOw. Geochim. Cosmochim. Acta 61, 661-662. Busenberg, E., Phunmer, L.N., Parker, V.B., 1984. The solubility
of strontianite (srCo3) in CO2-H20 solutions between 2 and 9 1 "C, the association constants of SrHCO� (aq) and srCo� (aq) between 5 and 80 "C, and an evaluation of the thennodynamic properties ofBa2+ (aq). Geochim. Cosmochim. Acta 48, 2021-2035.
Cardew, P.T., Davey, R.J., 1985. The kinetics of solvent-mediated phase transfonnations. Proc. R Soc. Land. A 298, 415-428.
Carlson, W.D., 1983. The polymorphs of CaC03 and the aragonite-calcite transfonnation. In: Reeder, R.J. (Bd.), Carbonates: Mineralogy and Chemistry. Reviews in Mineralogy, vol. 1 1 , pp. 191 -225.
Chernov, AA., 1984. Modern Crystallography: Ill. Crystal Grov.rth. Springer Verlag, Berlin, 5 17 pp.
Davey, R, Garside, 1., 2000. From molecules to crystallizers. An Introduction to Crystallization. Oxford Chemistry Primers, vol. 86. Oxford Univ. Press, Oxford, 81 pp.
Glynn, P.D., 2000. Solid-solution solubilities and thennodynamics: sulfates, carbonates and halides. Sulfate Minerals: Crystallography, Geochemistry and Environmental Significance. Reviews in Mineralogy, vol. 40, pp. 481 -5 1 1 .
Glynn, P.D., Reardon, E.l., 1990. Solid-solution aqueous-solution equilibria: thennodynamic theory and representation. Amer. 1. Sci. 290, 164-201.
Glynn, P.D., Reardon, E.J., Phunmer, L.N., Busenberg, E., 1990. Reaction parths and equilibrilUll end-points in solid-solutions aqueous solution systems. Geochim. Cosmochim. Acta 54, 267-282.
Lippmann, F., 1973. Sedimentary Carbonate Minerals. Springer-Verlag, New York.
Lippmann, F., 1980. Phase diagrams depicting the aqueous solubility of mineral systems. Neues lahrb. Mineral. Abh. 139 (1), 1 -25.
Lorens, RB., 198 1 . Sr, Cd, 11n Y Co distribution coefficients in calcite as a function of calcite precipitation rate. Geochim. Cosmochim. Acta 45, 553-56 1 .
Mann, S., 2000. The chemistry offonn. Angew. Chem., Int. Ed. 39, 3392-3406.
Ogino, T, Suzuki, T, Sawada, K., 1987. The fonnation and transfonnation mechanisms of calcilUll carbonate in water. Geochim. Cosmochim. Acta 51 , 2757-2767.
Ogino, T, Suzuki, T, Sawada, K., 1990. The rate and mechanism of polymorphic transfonnation of calcium carbonate in water. 1. Cryst. Grov.rth 100, 159 - 1 67.
Paquette, 1., Reeder, Rl., 1990. New type of compositional zoning
in calcite: insights into crystal grov.rth mechanisms. Geology 18, 1244- 1247.
Paquette, 1., Reeder, R.J., 1995. Relationship between surface structure, grov.rth mechanism, and trace element incorporation in calcite. Geochim. Cosmochim. Acta 59, 735 -749.
Pina, C.M., Putrlis, A, 2002. The kinetics of nucleation of solid solution from aqueous solution: a new model for calculating non-equilibrilUll distribution coefficients. Geochim. Cosmochim. Acta 66, 185- 192.
Pina, C.M., Enders, M., Pu1nis, A., 2000. The composition of solid solutions crystallising from aqueous solutions: the influence of supersaturation and grov.rth mechanisms. Chem. Geol. 168, 195-210.
Phunmer, L.N., Busenberg, E., 1982. The solubilities of calcite, aragonite and vaterite in CO2-H20 solutions between 0 and 90 bC, and an evaluation of the aqueous model for the system CaC03-CO2-H20. Geochim. Cosmochim. Acta 46, 1 0 1 1 - 1040.
Phunmer, L.N., Busemberg, E., 1987. Thennodynamics of aragonite-strontianite solid solutions: results from stoichiometric solubility at 25 and 76 "c. Geochim. Cosmochim. Acta 51 , 1393 - 14 1 1 .
Prieto, M., Putrlis, A , Fernandez-Diaz, L., 1993. Crystallization of solid solutions from aqueous solutions in a porous medium: zoning in (Ba,Sr)S04. Geol. Mag. 130, 289-299.
Prieto, M., Fernandez-Gonzalez, A., Putrlis, A., Fernandez-Diaz, L., 1997. Nucleation, grov.rth, and zoning phenomena in crystallizing (Ba,Sr)C03, Ba(S04,Cr04), (Ba,Sr)S04, y (Cd,Ca)C03 solid solutions from aqueous solutions. Geochim. Cosmochim. Acta 61 , 3383-3397.
Reeder, Rl., 1996. Interaction of divalent cobalt, zinc, cadmilUll, and barilUll with the calcite surface during layer grov.rth. Geochim. Cosmochim. Acta 60, 1543 - 1 552.
Rimstidt, 1.D., Balog, A., Webb, 1., 1998. Distribution of trace elements between carbonate minerals aqueous solutions. Geochim. Cosmochim. Acta 62, 1851 - 1863.
Sayles, F.L., Manheim, F.T, 1975. Interstitial solution and diagenesis in deeply buried marine sediments: results fonn the Deep Sea Drilling Project. Geochim. Cosmochim. Acta 39, 103- 127.
Shannon, RD., 1976. Revised effective ionic radii and systematic studies of interatomic distances in halides and chalcogenides. Acta Crystallogr., A 32, 751 -767.
Staudt, W.J., Reeder, R.l., 1994. Surface structural controls on compositional zoning of SO� - and SeO� - in synthetic calcite crystals. Geochim. Cosmochim. Acta 58, 2087 -2098.
Shunm, W., Morgan, 1.1., 1981. Aquatic Chemistry. An Introduction Emphasizing Chemical Equilibria in Natural Waters. Wiley-Interscience, New York.
SveIjensky, D.A., Molling, PA., 1992. A linear free energy relationship for crystalline solids and aqueous ions. Nature 356, 231 -234.
Tesoriero, A.l., Pankow, 1.F., 1996. Solid solution partitioning of S?+ , Ba
2+ , and Cd2+ to calcite. Geochim. Cosmochim. Acta
60, 1053 - 1 063. Truesdell, HA., 10nes, B.F., 1974. WATEQ, a computer program
for calculating chemical equilibria of natural waters. U.S. Geol. Surv. 1. Res. 2, 233 -248.