Embed Size (px)
Citation preview

NBER WORKING PAPER SERIES
ESTIMATING THE ASSOCIATIONS BETWEEN SNAP AND FOOD INSECURITY, OBESITY, AND FOOD PURCHASES WITH IMPERFECT ADMINISTRATIVE MEASURES
OF PARTICIPATION
Charles J. CourtemancheAugustine Denteh
Rusty Tchernis
Working Paper 24412http://www.nber.org/papers/w24412
NATIONAL BUREAU OF ECONOMIC RESEARCH1050 Massachusetts Avenue
Cambridge, MA 02138March 2018
This research was supported by USDA grant no. 59-5000-5-0115 to the National Bureau of Economic Research, entitled, “Using FoodAPS for Research in Diet, Health, Nutrition, and Food Security.” The views expressed are those of the authors and not necessarily those of the Economic Research Service, Food and Nutrition Service, the U.S. Department of Agriculture, or the National Bureau of Economic Research. We thank Marianne Bitler, Janet Currie, Christian Gregory, John Kirlin, Diane Schanzenbach, and participants at the Association for Public Policy Analysis and Management Fall Research Conference and National Bureau of Economic Research Conferences on Using FoodAPS for Research in Diet, Health, Nutrition, and Food Security for helpful comments.
NBER working papers are circulated for discussion and comment purposes. They have not been peer-reviewed or been subject to the review by the NBER Board of Directors that accompanies official NBER publications.
© 2018 by Charles J. Courtemanche, Augustine Denteh, and Rusty Tchernis. All rights reserved. Short sections of text, not to exceed two paragraphs, may be quoted without explicit permission provided that full credit, including © notice, is given to the source.
Estimating the Associations between SNAP and Food Insecurity, Obesity, and Food Purchaseswith Imperfect Administrative Measures of ParticipationCharles J. Courtemanche, Augustine Denteh, and Rusty TchernisNBER Working Paper No. 24412March 2018JEL No. C81,H51,I12,I18
ABSTRACT
Administrative data are considered the “gold standard” when measuring program participation, but little evidence exists on the potential problems with administrative records or their implications for econometric estimates. We explore issues with administrative data using the FoodAPS, a unique dataset that contains two different administrative measures of Supplemental Nutrition Assistance Program (SNAP) participation as well as a survey-based measure. We first document substantial ambiguity in the two administrative participation variables and show that they disagree with each other almost as often as they disagree with self-reported participation. Estimated participation and misreporting rates can be meaningfully sensitive to choices made to resolve this ambiguity and disagreement. We then document similar sensitivity in regression estimates of the associations between SNAP and food insecurity, obesity, and the Healthy Eating Index. These results serve as a cautionary tale about uncritically relying on linked administrative records when conducting program evaluation research.
Charles J. CourtemancheGeorgia State UniversityAndrew Young School of Policy StudiesDepartment of EconomicsP.O. Box 3992Atlanta, GA 30302-3992and [email protected]
Augustine DentehDepartment of EconomicsAndrew Young School of Policy StudiesP.O. Box 3992Atlanta, GA [email protected]
Rusty TchernisDepartment of EconomicsAndrew Young School of Policy StudiesGeorgia State UniversityP.O. Box 3992Atlanta, GA 30302-3992and [email protected]
2
I. Introduction
A growing literature documents the problems with relying on survey measures of program
participation, which suffer from significant reporting error, when conducting impact evaluations
(Meyer, Mok, and Sullivan, 2015; Mittag, 2016; Nguimkeu et al., 2017). Administrative data are
ordinarily assumed to be the “gold standard” to overcoming these econometric challenges, but
relatively little evidence exists on the potential problems with administrative records or
econometric strategies to address them. We investigate these issues using data from the FoodAPS,
which combines a panel of household purchases with a survey and linked administrative data on
Supplemental Nutrition Assistance Program (SNAP) participation from both state enrollment
records and Electronic Benefit Transfer (EBT) card expenditures. The data, therefore, provide the
unique opportunity to evaluate the reliability of administrative records by comparing the two
different administrative measures to each other as well as to self-reported participation. Moreover,
the data also allow us to examine the sensitivity of participation and misreporting rates and
estimated associations between SNAP and food insecurity, obesity, and diet healthfulness to
different approaches to cleaning and combining the administrative participation variables.
SNAP is the largest means-tested nutrition assistance program in the U.S., serving millions
of low-income individuals and households. It is administered by the U.S. Department of
Agriculture (USDA) with the objectives of increasing food security, reducing hunger, and
improving health and well-being of low-income individuals and households by expanding access
to food, nutritious diets, and nutrition education (Mabli et al., 2013). The number of Americans
receiving SNAP benefits tripled from about 17 million to 46 million between 2000 and 2014, while
total spending on SNAP has more than quadrupled from about $17 billion to almost $75 billion.3
3 Statistics are from http://www.fns.usda.gov/pd/supplemental-nutrition-assistance-program-snap.
3
Proponents assert that SNAP participation reduces food insecurity, lifts millions from
poverty, and provides a fiscal boost to the economy during downturns (U.S. Department of
Agriculture, 2012). However, the empirical literature on the impacts of SNAP has produced mixed
results. Several studies have documented the expected negative relationship between SNAP and
food insecurity (Van Hook & Ballistreri, 2006; Nord & Prell, 2011; Schmidt et al., 2016), but
others have found statistically insignificant or even positive associations (Gundersen & Oliveira,
2001; Hofferth, 2004; Huffman & Jensen, 2003; Wilde et al., 2005; Hoynes & Schanzenbach,
2015). SNAP is also often found to be positively correlated with obesity, but some studies find
insignificant or negative effects (Meyerhoefer and Pylypchuk, 2008; Gundersen, 2015; Almada et
al., 2016; Almada & Tchernis, 2016; Nguimkeu et al., 2017; Denteh, 2017).
These mixed results reflect two main methodological challenges in evaluating the causal
effects of SNAP. The first is non-random selection. SNAP participation is endogenous, so there is
a strong likelihood that specific unobservable characteristics are correlated with both SNAP
participation and nutrition-related outcomes. Such factors might include current or expected future
health, human capital, financial stability, and attitudes toward work (Currie, 2003; Kreider et al.,
2012).
The second identification problem, and the focus of our paper, is measurement error in
SNAP participation, which occurs when SNAP participants are coded as receiving no benefits
when they truly did (false negatives) or vice versa (false positives). Misreporting of SNAP
participation in national surveys has been documented with false negatives being much more
prevalent than false positives.4 For instance, the estimated false negative rates for SNAP in various
surveys range from 20% to almost 50% (Mittag, 2013; Meyer, George, and Mittag, 2015). There
4 See Bound, Brown, and Mathiowetz (2001) for a comprehensive review of measurement error in survey data.
4
is a growing literature suggesting that the estimated effect of a misclassified binary explanatory
variable (such as SNAP participation) may be substantially biased and may even yield “wrong
signs” (Kreider, 2010; Kreider et al., 2012; Nguimkeu et al., 2017). Within a one-sided model of
endogenous misreporting, Nguimkeu et al. (2017) provide sign-switching results for the ordinary
least squares (OLS) estimator even when participation is exogenous. In this case, they show that
the OLS estimator yields the wrong sign if misreporting is endogenous, with the size of the sign-
switching region increasing with the rate of false negatives and decreasing with the true
participation rate.5 Meyer and Mittag (2018) show that the likelihood of misreporting is
syetematically related to observable characteristics such as income, employment, and geography,
suggesting that is likely related to unobservable characteristics as well. Most researchers using
survey data to study SNAP do not account for the possibility of non-classical measurement error
and the few that do so make assumptions akin to random misreporting.
A fundamental difficulty in dealing with misreporting is that true participation status is
unobserved in almost all surveys, and validation datasets that link survey responses to
administrative records are scarce. Even when administrative data are available, their usefulness
depends crucially on the quality of the linkage. While administrative data are usually considered
the "gold standard," they can still be missing, incorrectly entered, or outdated. Some measurement
error may therefore remain. By linking survey responses to administrative data on SNAP
participation from two different sources, FoodAPS provides a unique opportunity to investigate
issues related to measurement error in both self-reported and administrative measures.
Specifically, we use data from the FoodAPS to offer some novel insights related to the
reliability of linked administrative SNAP measures. First, we document substantial ambiguity in
5 Similar severe consequences of reporting errors also occur within an instrumental variables framework (Almada et al., 2016).
5
both of the administrative measures and show that they are only slightly more strongly correlated
with each other than with self-reported participation. Estimated SNAP participation and
misreporting rates vary with the coding rules used to resolve this ambiguity and disagreement. We
then examine the relationships between SNAP and food insecurity, obesity, and the Healthy Eating
Index. While the signs of regression estimates are not sensitive to different coding rules, their
magnitudes and levels of statistical significance exhibit meaningful variability. In sum, these
results serve as a cautionary tale about uncritically relying on linked administrative records when
conducting program evaluation research.
II. Data
The FoodAPS survey is the first nationally representative survey of U.S. households to
collect comprehensive data about household food purchases as well as health and nutrition
outcomes. FoodAPS is sponsored by the Economic Research Service (ERS) and the Food and
Nutrition Service (FNS) of the USDA to support critical research that informs policymaking on
health and obesity, food insecurity, and nutrition assistance policy.
The FoodAPS surveyed 4,826 households through a multistage sampling design with a
target population roughly equally divided into SNAP households, non-participating low income
households with income less than the poverty guideline, non-participating households with income
between 100 percent and 185 percent of the poverty guideline, and non-participating households
with income at least equal to 185 percent of the poverty guideline.6 Survey questions relate to
demographic characteristics, income, program participation, food insecurity, health, weight, and
6 The FoodAPS field operations were conducted from April 2012 through January 2013, during which each participating household provided information on all acquisitions of all household members during a 7-day interview period.
6
height. Also, FoodAPS contains detailed information about individual food purchases and
acquisitions (merged with nutrition information), along with variables related to local food
availability and prices. A unique feature of FoodAPS that makes it well-suited for our study is the
linked administrative records on SNAP participation for consenting respondents. This presents an
opportunity to study SNAP misreporting more thoroughly than past research.
Participants were interviewed before they were given a survey to record their food
purchases for one week. Self-reported SNAP participation comes from this initial interview. The
primary respondent (PR) was asked about SNAP receipt, including information on the date of last
receipt and the amount of benefits received. The PR was the designated “main food shopper” for
the household. The specific question asking about SNAP participation states, “(Do you/Does
anyone in your household) receive benefits from the SNAP program? This program used to be
called food stamps. It puts money on a SNAP EBT card that you can use to buy food.” This
question (named SNAPNOWREPORT on the FoodAPS data files) does not specify a reference
period, and only respondents who answered "yes" were further asked to provide dates of the last
receipt as well as benefit amounts received. Respondents who answered “no” were then asked,
“Have (you/anyone in your household) ever received benefits from the SNAP program?”
Households who responded in the affirmative to this follow-up question were further asked, “Did
(you/anyone in your household) receive SNAP benefits in the last 12 months?” Respondents who
answered "yes" to both follow-up questions were also asked to provide a date of the last receipt.7
For our indicator of reported SNAP participation (hereinafter “REPORT”), we consider all
7 66 out of the 1461 people who answered "yes" to the first participation question subsequently reported date of the last receipt outside of the previous 31 days. Also, 8 out of 171 people who answered "no" to the first participation question but "yes" to both follow-up participation questions reported date of the last receipt within the previous 31 days. These reported dates of last receipt reflect the ambiguity about whether the initial participation question indicated current or recent receipt of SNAP. Our conclusions remain similar if we code these individuals as non-participants.
7
respondents who answered “yes” to be self-reported participators (including those who answered
“no” to the first participation question but “yes” to both follow-up questions), and consider the
time-frame to reflect either current or recent participation.8 In our view, a flexible time-frame is
reasonable, as our outcomes (particularly BMI, which is a capital stock) may not respond
immediately to changes in benefit receipt, while people who have recently become non-
participants may still spend down previously accrued benefits during the reference period.
The FoodAPS contains two distinct administrative measures of SNAP participation. The
first is from state caseload files covering March 2012 to November 2012 (“ADMIN”). The second
is from the electronic benefit transfer (EBT) ALERT database (“ALERT”).9 The ALERT
transaction data contain one recorded swipe of an EBT Card per user from April through December
2012. FoodAPS is the only nationally representative survey that links reported SNAP participation
to two administrative sources, thus making it particularly suitable for our purposes.
While such administrative records sound appealing, they have several limitations that
likely lead to measurement error. ADMIN and ALERT contain various levels of missing data and
do not always agree either with each other. The quality and availability of the administrative data
vary considerably across states. Households can fall into one of four (4) state groups: (a) Group 1:
one-to-one match was possible between ADMIN and ALERT data because they both contain the
same case identifiers (13 states); (b) Group 2: either the CASEIDs in the ALERT data are
scrambled or they are different in the ALERT and caseload data (8 states); (c) Group 3: CASEIDs
are different in the caseload and ALERT data, and the former does not include benefit
8 We thank John Kirlin for suggesting this modification to the original SNAPNOWREPORT via email correspondence. 9 The EBT ALERT database is Anti-Fraud Locator EBT Retailer Transactions (ALERT) system of the Food and Nutrition Service (FNS) of the USDA designed to help detect signs of abuse, fraud, and waste in the SNAP program. Each record of the EBT ALERT data represents one swipe of the EBT card and includes such variables as information on the state, store ID, EBT account number, date/time of the event, and purchase amount.
8
disbursement dates (2 states); and (d) Group 4: the state did not provide SNAP enrollment data (5
states).
Another source of measurement error is that matching from the FoodAPS to administrative
SNAP records was probabilistic. All the matches to ADMIN data were based on first name, last
name, phone number, and house address (including apartment number) and links were considered
“certain matches” if the associated matching score exceeded a pre-determined threshold.10 The
linkage to the ALERT data was similarly probabilistic, except in the state Group 1 described above.
In state Group 1, if a household first matched probabilistically to caseload data, then a one-to-one
match was possible to the ALERT data using CASEIDs. Thus, it is reasonable to presume that the
quality of the administrative linkage would be highest in the 13 states in state Group 1.
Nonetheless, the quirks of probabilistic matching would suggest unknown degrees of error in the
administrative measures of participation in all states.
Additionally, the ADMIN and ALERT data may contradict each other because of
discrepancies in timing. In the ADMIN data, participation is in most cases defined based on current
enrollment status during the interview week. However, in the two states in Group 3 mentioned
above, exact dates are not available; thus, their current participation status was conditional on the
results of the EBT ALERT linkage. For instance, in a few cases, an individual is considered a
current participant if they matched at any point during the nine-month data availability window
and also matched to the EBT ALERT, with the date of the last receipt (per ALERT) within 36 days
of the end of the survey week.11 Some former and future participants will therefore incorrectly be
10 The probabilistic matching was implemented using LinkageWIZ record linkage software and resulted in a Cartesian join of each surveyed household with all SNAP enrolment record (or EBT ALERT). The contractors determined a pre-specified score above which to classify a match as "certain." FoodAPS does not contain the raw matching scores. 11 FoodAPS’s measure of current SNAP participation based on the two administrative linkages is summarized in the SNAPNOWADMIN variable, which combines the results of the two administrative matches into a single variable and also imputes missing data using the self-report.
9
coded as current participants. The same logic applies to the EBT ALERT data. In the ALERT data,
an individual is coded as a participant if she had an EBT card transaction during the survey week
and matched to the EBT ALERT data. SNAP participants who did not use the EBT card that week
– for instance, because they stocked up on groceries the previous week, or because their monthly
benefits already ran out (food stamp cycling) – were coded as non-participants if they were also
current non-participants per ADMIN.12
Another source of discrepancy regarding timing is that, while the ADMIN variable
considers matches to represent current participation if the date of the last receipt is within 32 days
of the end of the survey week, the ALERT variable uses 36 days of the end of the survey week.
This may be related to the fact that the ALERT data do not have variables indicating the exact
timing of deposits into the SNAP accounts. The ALERT issuance dates are approximate because
issuance dates are determined by noting increments in the last SNAP balance between swipes.
Thus, households classified as current recipients per ALERT may show up as current nonrecipients
per the ADMIN variable due to the shorter window used by the latter.13
Finally, another issue with the ALERT data is that matches were not always attempted. For
instance, no match was attempted if the respondent did not self-report SNAP receipt or any EBT-
type payments. While most such individuals are likely true non-participants, this might not be the
case for all of them. The high prevalence of false negatives reported in the literature tells us that
some people incorrectly report not receiving SNAP, and it seems plausible that some of these same
people would also not voluntarily disclose using an EBT card for any of their purchases. A match
12 In the remainder (majority) of cases in the two states whose current SNAP participation cannot be determined based on EBT ALERT matching (conditional on ADMIN) or ADMIN (conditional on ALERT) due to missing information or non-matches, their current SNAP participation is coded as “no match” in SNAPNOWADMIN. 13 This issue ceases to be relevant if we ignore the dates of the last receipt in classifying matches to the administrative sources, as we do in our baseline classifications discussed below.
10
to EBT records was also not attempted if the individual reported SNAP participation but did not
make a purchase at a SNAP-eligible store during the survey week. While some of these individuals
may be genuine false positives, others might have simply not gone to the grocery store that week.
These issues create substantial ambiguity about the “correct” ways to code the
administrative variables that we will explore in more detail in the following section. For now, we
define the baseline versions of these two measures as follows. We set ADMIN=1 if there is a
successful match to caseload records, even if the date of the match is outside of the previous month
or missing. The rationale for the flexible timing mirrors that discussed above for the self-reported
measure. We set ADMIN=0 for individuals who did not match to the caseload records, and leave
the variable missing for those in states that did not provide caseload records. For ALERT, we
assign a value of 1 if there is a confirmed match (again, regardless of whether the match occurs
during the survey month) and 0 if a match was attempted but unsuccessful. If no match was
attempted, we set ALERT to missing.
Turning to a discussion of the other variables used in our analyses, our first two dependent
variables relate to food insecurity. These come from the ten-question household food security
questionnaire included in FoodAPS based on USDA’s 30-day Food Security Scale.14 The specific
outcomes are a dummy for whether the household has low food security (defined as having
affirmative responses to three to five questions) and a dummy for whether the household has very
low food security (six or more affirmative responses).
The next several dependent variables relate to body weight. The FoodAPS contains self-
reported height and weight for the household responder. We use this information to create three
outcomes: body mass index (BMI) and indicators for obese (BMI≥30) and severely obese
14 Please see the Appendix for the list of question on the ten-question household food security question.

11
(BMI≥35).15 Dichotomous variables are often used in addition to continuous BMI in the obesity
literature since health is not monotonically decreasing in weight. Weight gain generally improves
health at low levels of BMI, and the large increase in mortality risk from excess weight does not
begin until around the severe obesity threshold (Courtemanche et al., 2016). The health
implications of any impacts of SNAP would depend on the portion of the BMI distribution in
which the effects are strongest (i.e., the health implications of SNAP’s effects would potentially
be more substantial if they are stronger on severe obesity).
The final dependent variable relates to food purchases. Following prior studies such as
Volpe, Okrent, & Leibtag (2013), we use a summary measure of the healthfulness of food
purchases called the Healthy Eating Index (HEI). The HEI-2010, designed by the USDA, aims to
capture the degree of adherence to dietary guidelines. We use the total HEI-2010 scores for all
items for all the entire survey week for each household.16 The HEI score is made up of 12
components which sum up to a maximum score of 100. This HEI variable is computed by
FoodAPS staff and available as a linkable auxiliary dataset.
The FoodAPS also contains a number of variables that we use as controls. These include
dummy variables for gender, educational attainment (dummy variables for having less than high
school diploma, high school diploma but no college education, and some college education, with
college degree or higher being the omitted base category), race/ethnicity (non-Hispanic black and
non-Hispanic white, with other being the base category), marital status (married and formerly
married, with never married as the base category), whether any individuals under 5 years old or at
least 65 years old are present in the household, whether the respondent worked last week, whether
the household lives in rural census tract, and whether the household’s primary food store is SNAP-
15 Body mass index is defined as weight in kilograms divided by height in square meters. 16 Further information on HEI scores can be found at http://epi.grants.cancer.gov/hei.
12
authorized. Continuous controls include respondent’s age, household size, number of children,
household monthly gross total income, and straight-line distance from household’s residence to its
primary food store (in miles).
Our “main sample” is subject to four restrictions. First, we include only households in
which the primary respondent is at least 18 years old. Second, we drop households with missing
values of any variables. Next, we follow Mykerezi and Mills (2010) and Almada et al. (2016) and
drop those with incomes over 250% FPL. The final step is to exclude 122 households who did not
provide consent for administrative verification. The resulting sample contains 2,108 households.
The sample sizes in some of the sensitivity checks will vary, though, as we will experiment with
different ways to handle ambiguous cases in the administrative SNAP variables.
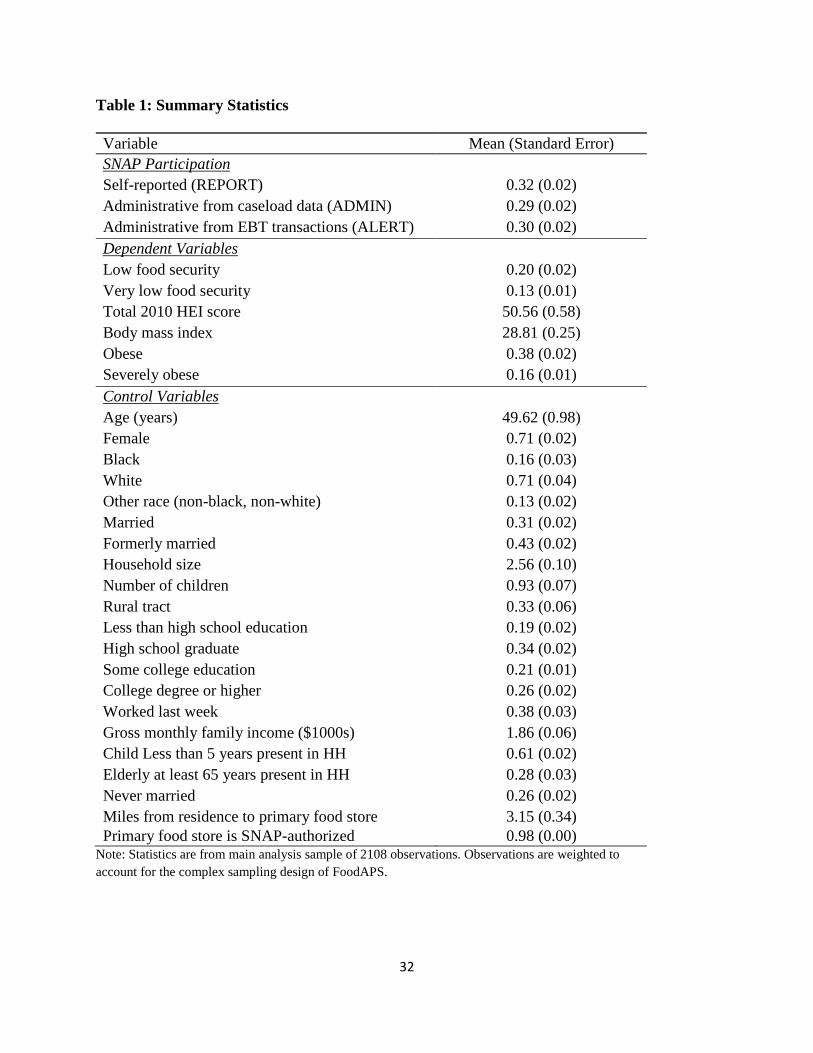
Table 1 presents means and standard deviations for our main sample. The SNAP
participation rate is 32 percent using the self-report compared to 29 percent with ADMIN and 30
percent with ALERT. The correlations between the three measures are 0.782 for REPORT and
ADMIN, 0.792 for REPORT and ALERT, and 0.847 for ADMIN and ALERT. In other words,
the two administrative measures exhibit almost as much disagreement with each other as either of
them do with the self-reported measure. FoodAPS’s primary respondents have an average BMI of
28.81, while 38 percent are obese and 16 percent are severely obese. About 20 percent of FoodAPS
households are food insecure (low food security) while 13 percent experience very low food
security. In terms of compliance with the U.S. Dietary Guidelines for Americans, FoodAPS
households have an average HEI score of 50.56 out of a maximum score of 100; higher HEI scores
indicate greater conformity with recommended dietary guidelines.
The primary respondents are on average, about 49 years old with a household size of about
2.56. Also, almost 71 percent of the primary respondents are female, 31 percent are married, 16
13
percent are black, 71 percent are white, and about 38 percent report having worked last week.
FoodAPS primary respondents have a gross monthly income of about $1,860 and live in
households with 26 percent holding college degrees or higher, 21 percent with some college
education, 34 percent with a high school diploma, and 19 percent with less than high school
diploma. Finally, 33 percent of FoodAPS household live in a rural census tract, 61 percent have
children at most five years of age, and 28 percent have elderly at least 65 years present.
III. Sensitivity of Participation and Misreporting Rates
This section examines the sensitivity of SNAP participation and misreporting rates along
two dimensions. The first type of sensitivity concerns different classification choices for the
potentially ambiguous cases when continuing to use ADMIN and ALERT separately. The second
is with respect to different approaches to combining ADMIN and ALERT into a single, "true"
participation measure.
A. Different Classification Choices for ADMIN and ALERT Separately
The discussion of the SNAP variables in Section II revealed several challenges when
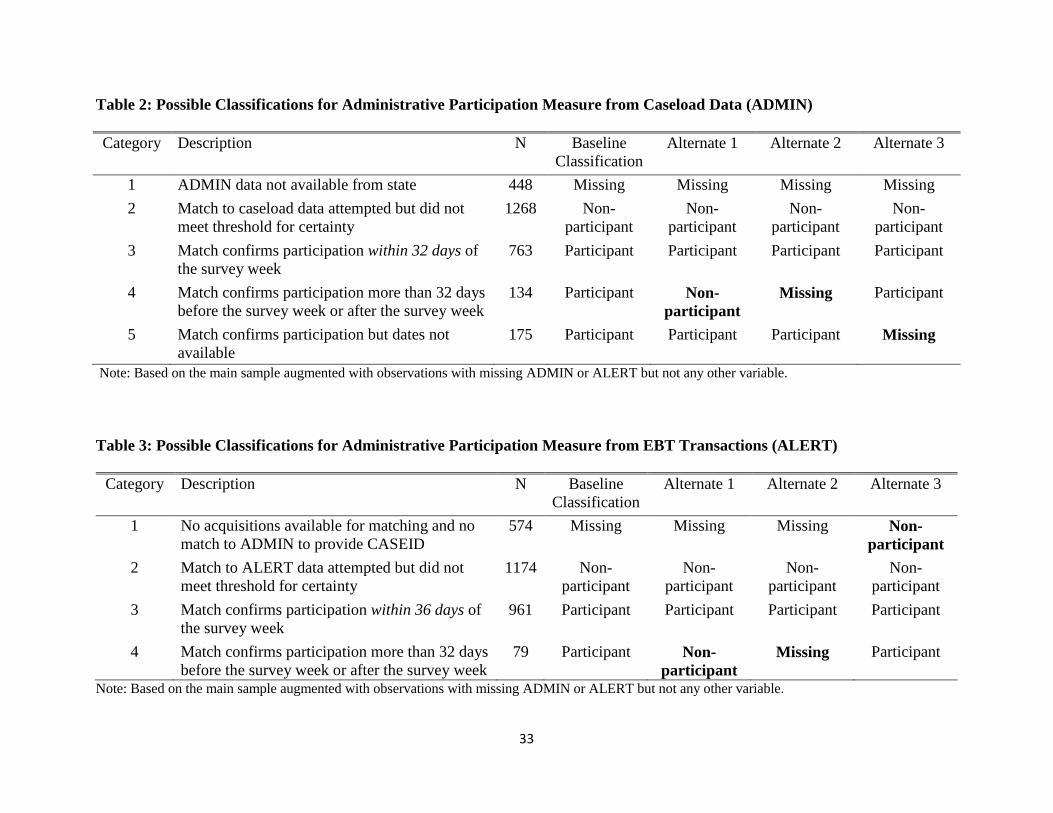
coding ADMIN and ALERT. Tables 2 and 3 categorize the potential values of these variables to
elucidate the specific sources of ambiguity. The tables also report the number of households in
each category, how they are classified in the “baseline” classification used in Section II, and other
reasonable ways in which they could be classified. The latter is given in the column names
"Alternate 1" through "Alternate 3," wherein each column the specific categorization that differs
from the baseline choice is in bold.
Focusing first on the ADMIN variable in Table 2, we see that there are five different broad
categories a household can fall into. First is the straightforward case where the state did not make
14
caseload records available, and therefore the ADMIN variable is clearly missing. The second
category contains the most definitive non-participants: households who did not match to caseload
records. Conceivably, someone could be a true participant but not match due to, for instance, name
misspellings, or changes in household identifying information such as addresses and phone
numbers. We expect such cases to be infrequent enough that exploring an alternate classification
is not warranted, especially considering that some matches to the caseload data not deemed to be
automatically “certain” were manually reviewed to address such concerns. Category 3 consists of
the clearest participants: those who matched to caseload records within the 32 days before and
including the survey week.
The final two categories are the most ambiguous. Category 4 contains households that
matched to caseload records but with a date outside the 32-day window. As discussed in Section
II, the intention of our baseline classifications is to measure either current or recent participation,
in which case the most natural classification of these households is as participators. Moreover, a
sizeable number of households show matches in both the months immediately before and after the
survey month, but not in the survey month. In these cases, the lack of a match in the survey month
is likely an error, and a determination of “current participant” seems reasonable.17 Nonetheless,
the lack of an exact match on timing creates sufficient ambiguity to warrant sensitivity analyses.
Alternate Classification 1, therefore, considers households in Category 4 to be non-participants,
while Alternate Classification 2 treats them as missing. Category 5 consists of those who matched
to caseload records, but the dates of SNAP receipt are not available. Again, since our goal with the
baseline classifications is to capture current or recent participation, the lack of an exact date is not
especially problematic, so we consider these households to be participators. However, if the
17 We are grateful to Bruce Meyer and Nikolas Mittag for this observation.
15
objective was to measure current participation, strictly speaking, the lack of an exact date would
prevent any determination from being made, so Alternate Classification 3 treats these households
as missing.
Turning to the ALERT variable in Table 3, households can fall into four different
categories. Category 1 contains those for whom no match was attempted, or who did not match to
the ADMIN data to provide a CASEID that would permit a deterministic match to the EBT ALERT
database. We code these individuals as missing in our baseline classification. However, since most
individuals for whom no match was attempted are likely true non-participants (as discussed in
Section II), we code households in Category 1 as non-participants in Alternative Classification 3.
ALERT Categories 2 and 3 parallel those same numbered categories from the ADMIN
data. Category 2 contains those for whom a match was attempted but not successful, indicating
non-participation. Category 3 indicates a match to the EBT ALERT database was successful with
date of last receipt within the 36-day window. Since the ALERT matches were probabilistic based
on STOREID, amount, and date, it is conceivable that some of the Category 2 households may
have failed to match due to reasons such as mistakes in the reported amounts and dates.
Analogously, some of the Category 3 households may have been determined manually when a
single FoodAPS transaction matched to multiple ALERT transactions. Thus, the final account
number assigned to the FoodAPS transaction may result in an erroneous Category 3 determination.
However, in our judgment such misclassification is unlikely to happen in more than a few cases,
so we do not consider alternative classifications of ALERT Categories 2 and 3.
ALERT Category 4 households are similar to ADMIN Category 4 above; they matched to
the EBT ALERT database, but the associated date of the last receipt is outside of the 36-day
window. For similar reasons as mentioned above, we initially consider these households to be true
16
participants, but Alternate Classification 1 considers them to be non-participants while Alternate
Classification 2 treats them as missing.
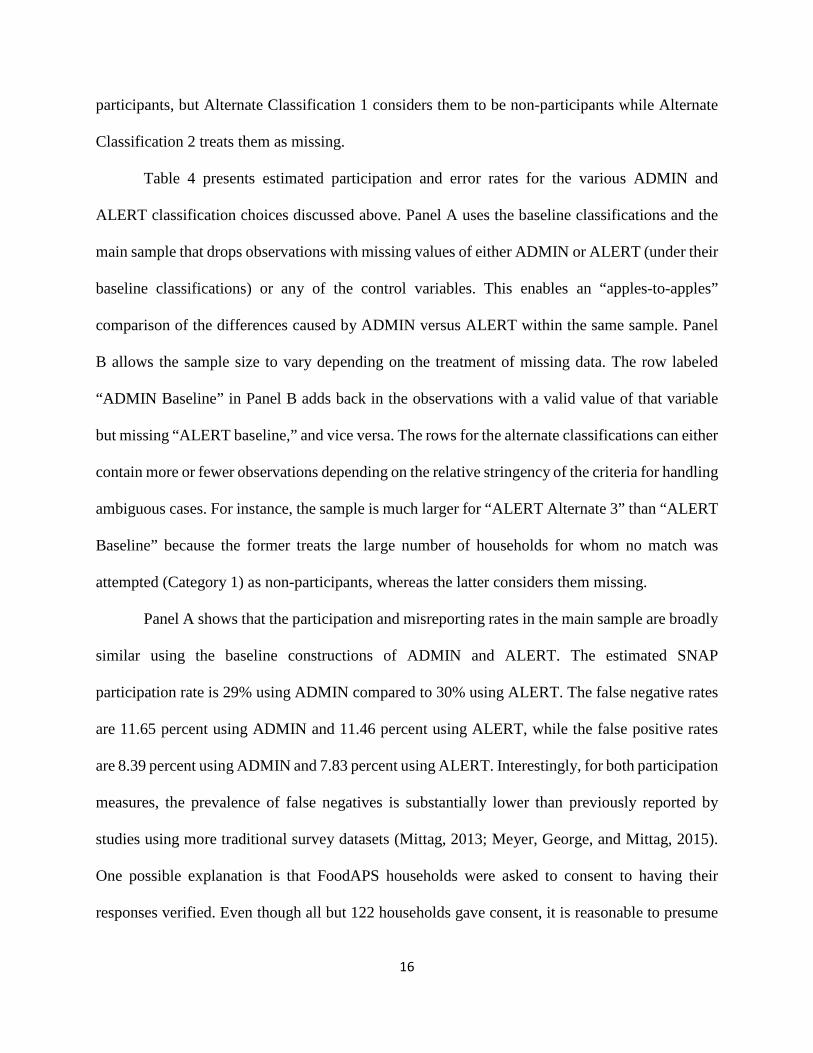
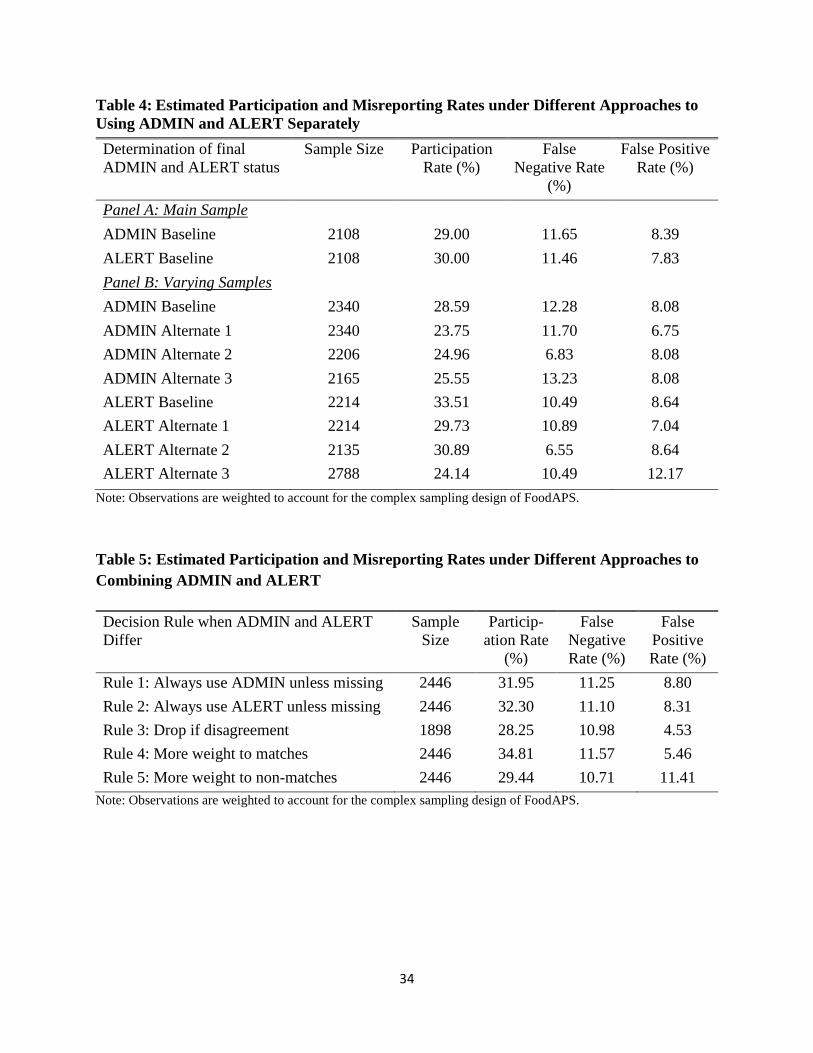
Table 4 presents estimated participation and error rates for the various ADMIN and
ALERT classification choices discussed above. Panel A uses the baseline classifications and the
main sample that drops observations with missing values of either ADMIN or ALERT (under their
baseline classifications) or any of the control variables. This enables an “apples-to-apples”
comparison of the differences caused by ADMIN versus ALERT within the same sample. Panel
B allows the sample size to vary depending on the treatment of missing data. The row labeled
“ADMIN Baseline” in Panel B adds back in the observations with a valid value of that variable
but missing “ALERT baseline,” and vice versa. The rows for the alternate classifications can either
contain more or fewer observations depending on the relative stringency of the criteria for handling
ambiguous cases. For instance, the sample is much larger for “ALERT Alternate 3” than “ALERT
Baseline” because the former treats the large number of households for whom no match was
attempted (Category 1) as non-participants, whereas the latter considers them missing.
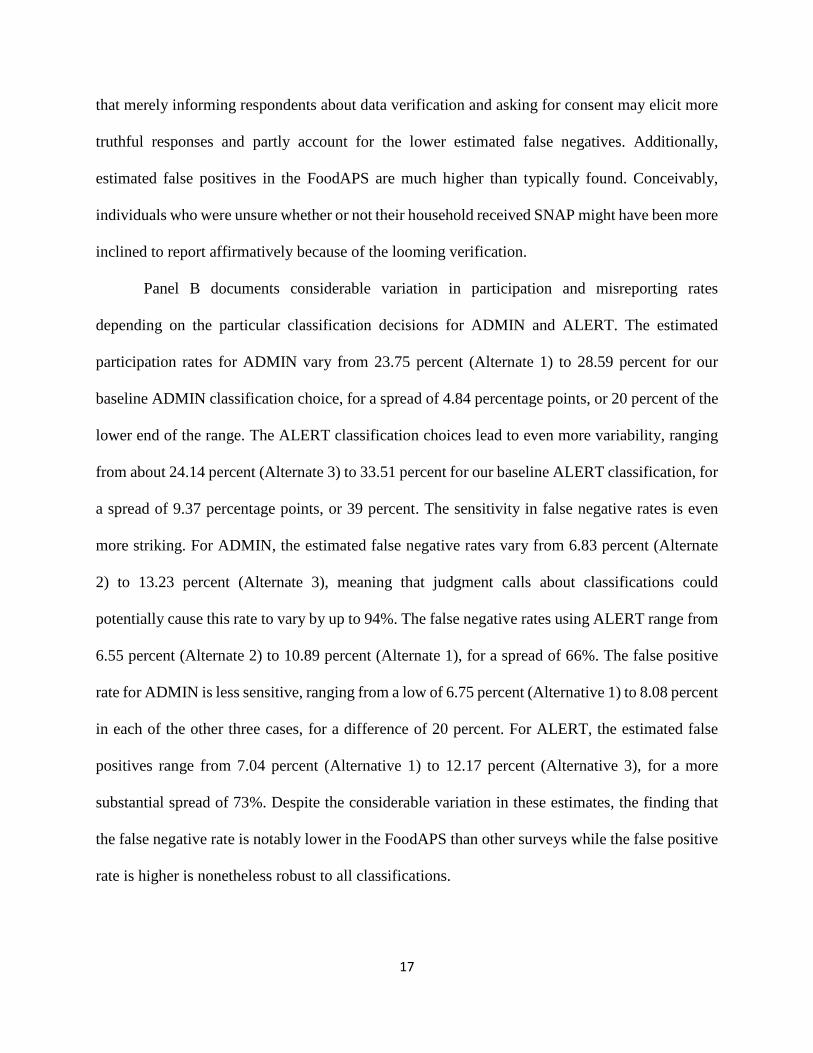
Panel A shows that the participation and misreporting rates in the main sample are broadly
similar using the baseline constructions of ADMIN and ALERT. The estimated SNAP
participation rate is 29% using ADMIN compared to 30% using ALERT. The false negative rates
are 11.65 percent using ADMIN and 11.46 percent using ALERT, while the false positive rates
are 8.39 percent using ADMIN and 7.83 percent using ALERT. Interestingly, for both participation
measures, the prevalence of false negatives is substantially lower than previously reported by
studies using more traditional survey datasets (Mittag, 2013; Meyer, George, and Mittag, 2015).
One possible explanation is that FoodAPS households were asked to consent to having their
responses verified. Even though all but 122 households gave consent, it is reasonable to presume
17
that merely informing respondents about data verification and asking for consent may elicit more
truthful responses and partly account for the lower estimated false negatives. Additionally,
estimated false positives in the FoodAPS are much higher than typically found. Conceivably,
individuals who were unsure whether or not their household received SNAP might have been more
inclined to report affirmatively because of the looming verification.
Panel B documents considerable variation in participation and misreporting rates
depending on the particular classification decisions for ADMIN and ALERT. The estimated
participation rates for ADMIN vary from 23.75 percent (Alternate 1) to 28.59 percent for our
baseline ADMIN classification choice, for a spread of 4.84 percentage points, or 20 percent of the
lower end of the range. The ALERT classification choices lead to even more variability, ranging
from about 24.14 percent (Alternate 3) to 33.51 percent for our baseline ALERT classification, for
a spread of 9.37 percentage points, or 39 percent. The sensitivity in false negative rates is even
more striking. For ADMIN, the estimated false negative rates vary from 6.83 percent (Alternate
2) to 13.23 percent (Alternate 3), meaning that judgment calls about classifications could
potentially cause this rate to vary by up to 94%. The false negative rates using ALERT range from
6.55 percent (Alternate 2) to 10.89 percent (Alternate 1), for a spread of 66%. The false positive
rate for ADMIN is less sensitive, ranging from a low of 6.75 percent (Alternative 1) to 8.08 percent
in each of the other three cases, for a difference of 20 percent. For ALERT, the estimated false
positives range from 7.04 percent (Alternative 1) to 12.17 percent (Alternative 3), for a more
substantial spread of 73%. Despite the considerable variation in these estimates, the finding that
the false negative rate is notably lower in the FoodAPS than other surveys while the false positive
rate is higher is nonetheless robust to all classifications.
18
B. Different Classification Choices for Combining ADMIN and ALERT
This section introduces several approaches or ad hoc rules to consolidate the two
administrative participation measures into a single "true" participation variable and then evaluates
how these rules influence the estimated rates of SNAP participation and misreporting. For the rest
of this section, ADMIN and ALERT refer to the baseline classification choices as described in
Tables 2 and 3, respectively. We develop five decision rules to combine the administrative
participation variables as follows:
1) Always use ADMIN unless missing. For households missing ADMIN data, their
participation status is set to ALERT.
2) Always use ALERT unless missing. For households missing ALERT data, their
participation status is set to ADMIN.
3) Drop if Disagreement: This rule sets the “true” participation variable to equal to both
ADMIN and ALERT, only if they agree (i.e., if ADMIN=ALERT=i, i=0, 1). When
they disagree or if either of them is missing, the “true” variable is set to missing. This
conservative approach will minimize errant classification but at a substantial cost to
sample size.
4) More weight to matches: This rule is similar to (3) as it uses both ADMIN and ALERT
if they agree. However, when they disagree, we set the "true" status to participation
(“1”), unless either is missing in which case the “true” status is set to the value of the
non-missing variable. In other words, this rule treats households as “true” participants
if at least ADMIN or ALERT confirms participation. Otherwise, the household is
considered a non-participant unless both are missing.
19
5) More weight to non-matches: This rule is the reverse of (4). When ADMIN and ALERT
disagree, we set the “true” status to non-participation (“0”), unless either is missing in
which case the “true” status is set to the value of the non-missing variable. In other
words, this rule treats households as “true” non-participants if at least ADMIN or
ALERT confirms non-participation. Otherwise, the household is considered a
participant unless both are missing.
Table 5 presents estimates of participation, false negative, and false positive rates under
each of the above decision rules. The estimated participation rates range from 28.25 percent (Rule
3) to 34.81 percent (Rule 5). This is a spread of 6.56, which represents 23% of the low end of the
range. The estimated false negative rates range from 10.71 percent (Rule 5) to 12.28 percent (Rule
1), for a spread of 1.57 percentage points, or 15%. The false positive rates vary quite substantially,
from 4.53 (Rule 3) to 11.41 percent (Rule 5), for a spread of over 150%. While our decision rules
are by no means exhaustive, this exercise illustrates that how one chooses to resolve the ambiguity
in the administrative variables has nontrivial consequences for estimated participation and
reporting errors.
Some patterns also emerge. First, as expected, giving the benefit of the doubt to matches
(Rule 4) leads to a relatively high estimated participation rate, and keeps the rate of false positives
low but at the expense of a high rate of false negatives. The reverse is true when we give the benefit
of the doubt to non-matches (Rule 5). Perhaps more surprising is that dropping cases where there
is any ambiguity (ADMIN and ALERT disagree or either are missing; Rule 3) results in the lowest
estimated participation rate, lowest rate of false positives, and second-lowest rate of false
negatives. In other words, once we restrict the sample to households for whom the administrative
measures are likely quite accurate, we see less disagreement with self-reported participation. There
20
is a particularly large reduction in the number of cases in which the respondent reports participation
but the administrative data disagree. This implies that some of the estimated misreporting observed
under other decision rules is not actually misreporting at all, but instead reflective of flaws in the
administrative variables. It is also noteworthy that the sample shrinks so much – 2,446 to 1,898,
or 29% – under Rule 3, underscoring that the amount of ambiguity, and therefore scope for error,
in the administrative measures is substantial.
C. Preferred Approach to combining REPORT, ADMIN, and ALERT
Given the ambiguity and sensitivity documented above, it is reasonable to ask whether
linked administrative data can still be used to obtain insights beyond what could be done with self-
reported information alone. The conservative Rule 3 should lead to a very accurate participation
measure but at the cost of discarding nearly a third of the sample, which creates concerns about
endogenous sample selection and external validity. The other decision rules avoid such a large
reduction in same size but at the expense of accuracy. The goal of this section is to implement a
more detailed strategy for combining ADMIN and ALERT that utilizes self-reports to help resolve
ambiguous cases, with the goal of leveraging insights from all three measures to produce reliable
estimates while preserving sample size.18
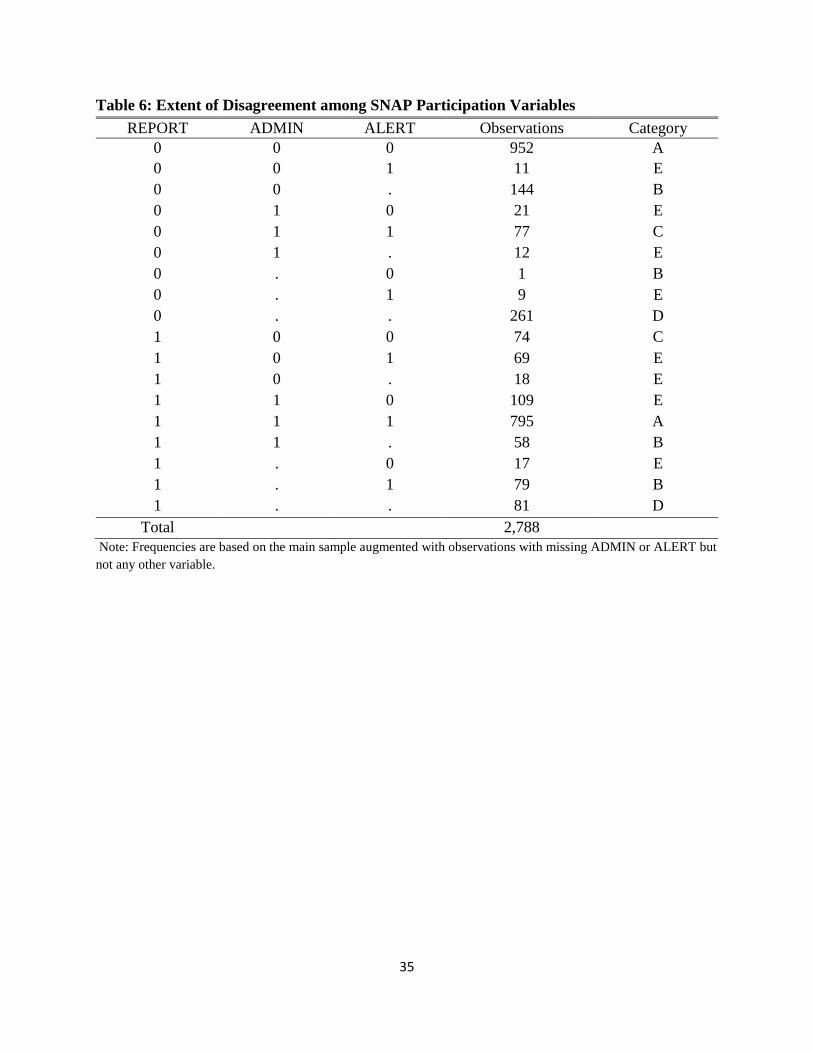
To motivate this approach, Table 6 presents information about the extent of disagreement
among the three measures as well as the extent of missing data in each variable.19 Also, the last
column reports how we classify disagreements into various categories for the purpose of
18 This approach is similar in spirit to the FoodAPS’ SNAPNOWADMIN variable discussed previously in footnotes 11 and 12. However, our method is more conservative in that it demands a higher level of agreement across the SNAP measures before considering the “true” value of participation non-missing. 19 Note that there is essentially no missing data for self-reported participation: only out of 4,704 consenting households in the FoodAPS are missing this variable.
21
developing our SNAP new participation variable, which we refer to as our “preferred” measure.
There is about 63 percent agreement among all three measures (i.e., all three variables either
indicate participation or non-participation), which we label as Category A. In Category B, making
up about 10 percent of households, any two of the three measures agree while the third is missing.
Category C respondents, which account for 5 percent, have both administrative measures agreeing
but in conflict with the self-report. Households with only the self-reported participation variable
who are missing both administrative measures (Category D) make up 12 percent, while the
remaining 10 percent of respondents are lumped into miscellaneous types of disagreement in
Category E.
The new, “preferred” measure of SNAP participation combines information from
Categories A, B, and C and sets to missing observations in Categories D and E. For Category A,
all three variables are in agreement, so we are comfortable setting the “true” participation variable
equal to the associated value. For Category B, we are also comfortable making a determination
since, although one variable is missing, the other two agree. For Category C, we consider the self-
reported participation value to be erroneous since it opposes both administrative measures, and
there is no particular reason to expect errors in the administrative variables to be correlated with
each other. This maintains the preference for administrative records if the information from those
records appears to be reliable. Next, those in Category D have non-missing self-reported
participation but are missing both administrative measures. We code their participation as missing
given the established concerns in the literature about relying only on self-reports. Finally, we also
set the participation status of respondents in Category E to missing. There are three types of
Category E households: ADMIN and ALERT are non-missing but disagree, ADMIN and
REPORT disagree while ALERT is missing, and ALERT and REPORT disagree with ADMIN

22
missing. In such cases of explicit disagreement, a determination cannot be reached without
establishing a rank ordering among the measures.
Ultimately, our preferred measure is non-missing for the entire main sample of 2,108
respondents. Relative to the sample sizes using the various decision rules in Table 5, this is less
than the 2,446 observations obtained using decision rules that force an outcome even in ambiguous
cases, but significantly larger than the 1,898 observations obtained under the conservative Rule 3.
The estimated participation rate using the preferred measure is 30.92 percent, which is slightly
higher than those obtained using ADMIN and ALERT separately (Panel A in Table 4) but well
within the ranges established by the various sensitivity checks in Tables 4 and 5.20
IV. Econometric Analyses and Results
We next turn to our regression estimates of the associations of SNAP with food insecurity,
weight outcomes, and dietary healthfulness. This section’s goal is to illustrate the sensitivity of
these estimates to the assumptions, introduced in the previous section, about how to code ADMIN
and ALERT separately as well as how to assign “true” participation in cases of disagreement
between them. We do not attempt to address the endogeneity of participation because doing so
with a single cross-section of data such as the FoodAPS is daunting, and our focus here is to
examine measurement issues rather than identify causal effects.21 Negative selection into SNAP
20 The preferred SNAP participation measure leads to relatively low estimated rates of false negatives (8.53 percent) and false positives (3.99 percent), but this is by construction since the self-reported value is factored into the coding process. 21 One approach to addressing the non-random selection into SNAP is relying on instrumental variables. Unfortunately, the usual state-level administrative policies used to study programs such as SNAP and WIC are not likely to be valid instruments with cross-sectional data as one would have to rely on variation across states. These program rules may be correlated with other state-level characteristics unrelated to participation decisions (see, e.g., Bitler, Currie, and Scholz, 2003; Bitler and Currie, 2005). As shown by Almada et al. (2016), non-classical measurement error can substantially alter IV estimates and cause them to fall outside of non-parametric upper bounds. Measuring SNAP participation as accurately as possible, therefore, would arguably be even more critical in in an IV context than in the OLS context shown here.
23
is well-documented in the literature, so our OLS estimates will likely be biased toward unfavorable
outcomes (greater food insecurity, higher BMI and obesity rates, and less healthy diets),
measurement issues aside.
Our regressions take the form
𝑦𝑦𝑖𝑖𝑖𝑖 = 𝛽𝛽0 + 𝛽𝛽1𝑆𝑆𝑆𝑆𝑆𝑆𝑆𝑆𝑖𝑖𝑖𝑖 + 𝜷𝜷𝟐𝟐𝑿𝑿𝒊𝒊𝒊𝒊 + 𝜀𝜀𝑖𝑖𝑖𝑖 (1)
where 𝑦𝑦𝑖𝑖 is the outcome variable for individual/household i (separate regressions for each of the
outcomes discussed in Section II), 𝑆𝑆𝑆𝑆𝑆𝑆𝑆𝑆𝑖𝑖 is an indicator of SNAP participation (separate
regressions for each decision rule from Section III), 𝑿𝑿𝒊𝒊 is a vector of the control variables from
Section II, and 𝜀𝜀𝑖𝑖𝑖𝑖 is the error term.
Measurement error in a binary variable is necessarily non-classical, so one cannot simply
assume �̂�𝛽1 to be biased toward zero (Kreider, 2010; Kreider et al., 2012; Nguimkeu et al., 2017).
Measurement error in SNAP participation could potentially even lead the OLS estimator to be
wrongly signed (Nguimkeu et al., 2017). It might be reasonable to suspect that some of the
inconsistencies among the administrative measures, such as the inability to match names with
sufficient certainty, are as good as random. However, other inconsistencies, such as appearing in
the caseload records but not using an EBT card in the past 30 days, arise from personal choices
and may, therefore, be correlated with the error term, hence leading to endogenous
misclassification.22
We begin our presentation of the regression results with Table 7, which uses the main
sample and compares OLS estimates (linear probability model if the outcome is binary) using
REPORT, the baseline version of ADMIN (as described in Table 2), and the baseline version of
22 Moreover, Bound, Brown, and Mathiowetz (2001) discuss the possibility that the measurement error may not be nondifferential, where measurement error is not independent of the outcomes of interest.

24
ALERT (as described in Table 3). Similarly to Panel A of Table 4, the purpose here is to use a
common sample to provide an apples-to-apples comparison of the results across the three
measures. The first key result is that the results are qualitatively similar regardless of the SNAP
participation measure used. As expected, SNAP participation is consistently associated with worse
values of all six outcomes. Estimates for food insecurity and body mass index are significant at
the 1% level for all three SNAP measures, while those for very low food security are never
significant. Mild discrepancies are observed for HEI and obesity, as two of the estimates are
significant at the 1% level while the third (using ALERT for HEI, ADMIN for obesity) is
significant at the 5% level. For severe obesity, the estimates for REPORT and ADMIN are
significant at the 5% level and 1% level, respectively, while the estimate for ALERT is
insignificant.
The magnitudes, however, are more sensitive to the choice of SNAP measure. The
associations between SNAP and food insecurity range from 6 to 7 percentage points, for a 16.67
percent spread. The estimates for very low food security vary between 2 and 2.7 percentage points,
or 35 percent. SNAP reduces HEI by between 1.3 and 2 units, for a sizeable 54 percent difference.
The results for BMI only vary from 1.05 to 1.17 units, or 11%, but greater sensitivity is observed
for the dichotomous weight outcomes. The estimates for Pr(Obese) and Pr(Severely Obese) range
from 5.7 to 7.9 and 2.1 to 3.9 percentage points, respectively, for spreads of 39% and 86%. Note
also that the pattern of results is inconsistent with simple attenuation bias, in which case we would
expect the magnitudes to be larger using the administrative SNAP measures than the self-report.
For three of the outcomes the magnitudes are actually largest using self-reported participation, and
in only one case is the magnitude using self-reported participation the smallest. This is consistent
with the reporting error being non-classical (which can yield an expansion bias), but is also

25
consistent with the administrative measures not being any more reliable than the self-report (i.e.
there is some attenuation bias regardless of the measure used).
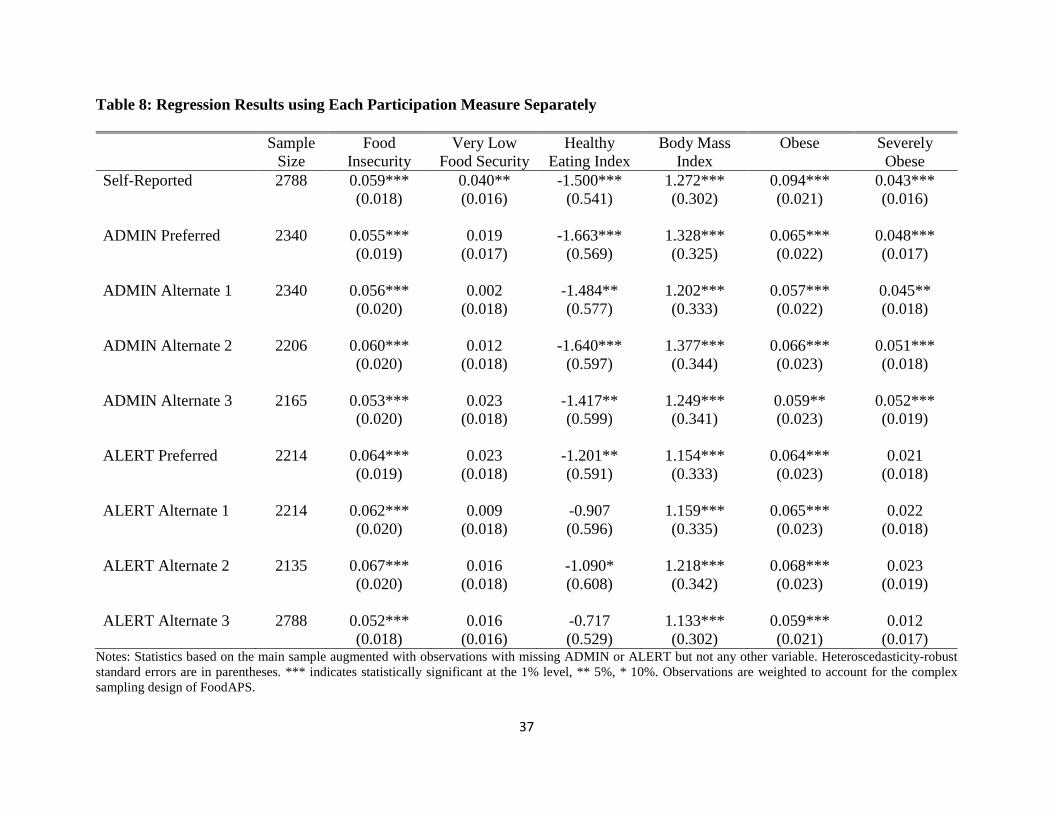
Table 8 presents similar OLS results using the self-reported participation and the eight
classification choices described in Tables 2 and 3. The first row reports the estimates using the
self-reported participation variable. The next eight rows use the different classification rules for
coding ADMIN and ALERT separately. As in Table 7, for all outcomes the signs are robust across
SNAP measures. However, there are some noteworthy differences in terms of significance levels
and magnitudes. For instance, the association between self-reported SNAP participation and very
low food security is a sizeable and statistically significant 4 percentage points. In contrast, the
same association is never significant using any classification scheme for the administrative
measures, and the magnitudes are much smaller: 0.2 to 2.3 percentage points. Recall from Table 7
that using the self-report also led to an insignificant result for very low food security for the
common sample, meaning that much of the sensitivity observed here is actually from the difference
in sample (i.e. adding back in 27 to 680 observations with non-missing self-reports but a missing
value of one or both administrative measures depending on the administrative classification). This
underscores the external validity concerns raised by the large amounts of missing data for the
administrative variables.
The results for HEI and severe obesity are also quite sensitive. For HEI, the estimates using
REPORT and ADMIN are large (-1.42 to -1.66 units) and significant, but they shrink considerably
(-0.72 to -1.2) using ALERT and are only significant in two of the four cases. Accordingly, the
spread between the smallest and largest magnitude for HEI is over 130%. For severe obesity, the
estimates range from 4.5 to 5.2 percentage points using REPORT and ADMIN, but shrink to 1.2
26
to 2.3 percentage points using ALERT and are always insignificant. The spread for severe obesity
is therefore an enormous 333%.
Finally, Table 9 presents regression results using the five decision rules discussed in
Section III, Subsection B, as well as our preferred consolidation rule from Subsection C of Section
III. Additionally, we consider a version of our preferred measure that imputes the missing values
from Categories D and E. We perform multiple imputations under the assumption that the
likelihood of missing data is correlated with observables but conditionally independent of
unobservables, usually referred to as a “Missing at Random (MAR)” assumption.23
The first five rows show the results using the ad hoc decision rules, while the last two rows
use our preferred measure both with and without imputation. Again, the signs are robust to the
different SNAP measures, but there are important differences in significance levels and
magnitudes. For instance, the association between SNAP and very low food security is significant
and large (3.4 percentage points) using Rule 3 but insignificant in the other cases with a magnitude
as small as 0.9. The difference between the largest and smallest estimates is therefore 280%. The
estimate for HEI is usually significant and reaches as large as -1.69 units, but it is an insignificant
-0.9 units under Rule 1, for a spread of 88%. For severe obesity, significance levels are again
mixed, with the estimates ranging from 2.1 to 4.7 percentage points (spread of 124%).
Using the preferred measure, the results are very similar both with and without imputation.
SNAP is predicted to increase the probabilities of being food insecure, having very low food
security, being obese, and being severely obese by 6.7, 2.7, 7.2, and 4.5 percentage points,
respectively. SNAP also increases BMI by 1.45 units and reduces HEI by 1.4 units. SNAP is
significant at the 5% level or better for all outcomes except very low food security.
23 We implement the multiple imputation procedures using Stata's mi impute and mi estimate commands, with 50 multiply imputed samples.
27
Summarizing, we find that the classification choices one makes with FoodAPS’s three
participation measures (REPORT, ADMIN, and ALERT) have important consequences not only
for estimated participation and reporting error rates but also for the estimated associations between
SNAP and food security, diet healthfulness, and weight outcomes.24 However, the different
classification choices do not seem to matter for the signs of the estimated associations since they
line up with our expectations if we suppose that participants are negatively selected.
V. Conclusion
This paper leverages the availability of self-reported and two different administrative
measures of SNAP participation in the FoodAPS to investigate several issues related to SNAP and
measurement error. We first present evidence that the two administrative SNAP variables suffer
from considerable ambiguity and disagree with each other almost as much as they disagree with
self-reported participation. We then demonstrate that different methods of coding the two
administrative variables separately as well as various approaches to combining their resulting
preferred versions into a single “true” participation measure can lead to meaningfully different
estimated participation and misreporting rates. Next, we document similar sensitivity to
assumptions about the administrative variables across ordinary least squares estimates of the
associations of SNAP with food insecurity, body weight, and healthfulness of food purchases.
24 In unreported results, we perform similar analyses by further restricting the sample to only primary respondents in State Group 1 as described in Section II. Recall that State Group 1 comprises 13 states where a one-to-one match was possible between ADMIN and ALERT data because they both contain the same case identifiers, thus, may be presumed to be more accurate. Overall, our main conclusions are unchanged. First, estimated participation and reporting error rates vary based on the classification choices. However, estimated false positives tend to be slightly smaller while false negatives tend to be slightly larger than those reported in Tables 4 and 5. Also, the pattern of results in Tables 7, 8, and 9 is similar when using only State Group 1 with a few differences. First, for Tables 8 and 9, the estimated associations using State Group 1 remain negative but are no longer statistically significant for diet healthfulness. Second, unlike in Table 7, the estimated associations for the probability of severely obese using ALERT are still positive but now statistically significant.
28
Our work serves as a cautionary tale for using administrative records uncritically under the
assumption that they represent the “gold standard” with regard to measurement. While some of
the difficulties we observed with the linked administrative variables may be unique to FoodAPS,
others likely generalize to other settings. For instance, challenges with obtaining data from all
states and differences in data quality across states are hardly unique to SNAP caseload files, as
many programs (such as Medicaid and public schools) are operated at the state or local levels and
standards for data collection may differ across different geographic areas. Additionally,
probabilistic matching between survey respondents and verified program participants would be
necessary for other contexts as well since it is unlikely that both sources include universal
identifiers such as social security numbers. Moreover, the fact that matches to EBT transaction
data were not attempted for individuals who (perhaps erroneously) reported not participating in
SNAP points to the broader tradeoff between rigor and budgetary/practical constraints during data
collection. When faced with a choice between nationwide surveys and administrative records that
are only available for certain areas or individuals and potentially flawed for others, it is not obvious
that the administrative data are preferable.
With all that said, we do not stop at pointing out the flaws in administrative data. Instead,
we propose a strategy to construct a single, “true” participation variable based on all available
information from both administrative and self-reported measures. This allows us to obtain
“preferred” results, both for participation rates and regression estimates. Similar strategies could
potentially be utilized in other contexts as well.
Nonetheless, our study suffers from several limitations that should be addressed in future
work. For instance, while we propose a method that intuitively should minimize measurement
error, there is no way to directly test whether it indeed accomplishes that objective or whether
29
other strategies could be superior. Additionally, we purposefully do not address endogenous SNAP
participation because of inherent difficulties in pursuing standard IV methods with a single cross-
section data with a relatively small sample size. Much is therefore left to be learned about both the
impacts of SNAP and best practices for measurement when multiple flawed indicators of program
participation are available.
References Aigner, D. J. (1973). “Regression with a binary independent variable subject to errors of
observation.” Journal of Econometrics, 1(1), 49-59. Almada, L., McCarthy, I., & Tchernis, R. (2016). What can we learn about the effects of food
stamps on obesity in the presence of misreporting? American Journal of Agricultural Economics, 98(4), 997-1017.
Almada, L. & Tchernis, R. (2016). Measuring effects of SNAP on obesity at the intensive margin.
National Bureau of Economic Research Working Paper No. 22681. Bitler, M. P., & Currie, J. (2005). Does WIC work? The effects of WIC on pregnancy and birth
outcomes. Journal of Policy Analysis and Management, 24(1), 73-91. Bitler, M. P., Currie, J., & Scholz, J. K. (2003). WIC eligibility and participation. Journal of
Human resources, 38, 1139-1179. Bound, J., Brown, C., & Mathiowetz, N. (2001). Measurement error in survey data. Handbook of
Econometrics, 5, 3705-3843. Courtemanche, C., Carden, A., Zhou, X., and Ndirangu, M. (2015). Do big box grocers improve
food security? Unpublished manuscript. Courtemanche, C., Pinkston, J., Ruhm, C., and Wehby, G. (2016). Can changing economic factors
explain the rise in obesity? Southern Economic Journal, 82(4), 1266-1310. Currie, J. (2003). US food and nutrition programs, Means-tested transfer programs in the United
States, pp. 199-290. Denteh, A. (2017). The effect of SNAP on obesity in the presence of endogenous misreporting.
Unpublished manuscript.

30
Gundersen, C. & Oliveira, V. (2001). The food stamp program and food insufficiency. American Journal of Agricultural Economics, 83, 875-887.
Gundersen, C. (2015). SNAP and Obesity, SNAP Matters: How Food Stamps Affect Health and
Well Being. Gregory, C., Ver Ploeg, M., Andrews, M., and Coleman-Jensen, M. (2013). Supplemental
Nutrition Assistant Program participation leads to modest changes in diet quality. United States Department of Agriculture Economic Research Service Report No. 147.
Hofferth, S. L. (2004). Persistence and change in the food security of families with children, 1997-
1999. E-FAN-04-001. Economic Research Service, U.S. Department of Agriculture. Available www.ers.usda.gov/publications/efan04001/
Hoynes, H. W., & Schanzenbach, D. W. (2015). U.S. Food and Nutrition Programs. National
Bureau of Economic Research Working Paper No. 21057. Huffman, S. K. & Jensen, H. H. (2003). Do food assistance programs improve household food
security? Recent evidence from the United States. Working Paper 03-WP 335, Center for Agricultural and Rural Development, Iowa State University.
Kabbani, N. & Wilde, E. (2003). Short Recertification Periods in the U.S. Food Stamp Program.
Journal of Human Resources, 83, 1112–1138. Kreider, B. (2010). Regression coefficient identification decay in the presence of infrequent
classification errors. The Review of Economics and Statistics, 92(4), 1017-1023. Kreider, B., Pepper, J. V., Gundersen, C., & Jolliffe, D. (2012). Identifying the effects of SNAP
(Food Stamps) on child health outcomes when participation is endogenous and misreported. Journal of the American Statistical Association, 107(499), 958-975.
Lewbel, A. (2007). "Estimation of average treatment effects with misclassification." Econometrica
75(2), 537-551. Mabli, J., Ohls, J., Dragoset, L., Castner, L., & Santos, B. (2013). Measuring the effect of
Supplemental Nutrition Assistance Program (SNAP) participation on food security: Mathematica Policy Research.
Marquis, K. H., & Moore, J. C. (2010). Measurement errors in SIPP program reports. Survey
Methodology, 1. Meyer, B. D., Mok, W. K., & Sullivan, J. X. (2015). Household surveys in crisis. Journal of
Economic Perspectives, American Economic Association, 29(4), 199-266. Meyer, B. D., Goerge, R. & Mittag, N. (2015). Errors in survey reporting and imputation and their
effects on estimates of food stamp program participation. Unpublished Manuscript.

31
Meyer, B.D. & Mittag, N. (2018). Misreporting of government transfers: How important are
survey design and geography? Unpublished manuscript. Meyerhoefer, C. D. & Pylypchuk, Y. (2008). Does participation in the food stamp program
increase the prevalence of obesity and health care spending? American Journal of Agricultural Economics, 90(2), 287–305
Mittag, N. (2013). A method of correcting for misreporting applied to the food stamp program. US
Census Bureau Center for Economic Studies Paper No. CES-WP-13-28. Mittag, N. (2016). Correcting for misreporting of government benefits. IZA Discussion Paper No.
10266. Nord, M. & Prell., M. (2011). Food security improved following the 2009 ARRA increase in
SNAP benefits. USDA, Economic Research Service, Economic Research Report No. 116. Nguimkeu, P., Denteh, A., & Tchernis, R. (2017). On the estimation of treatment effects with
endogenous misreporting. National Bureau of Economic Research. No. w24117.
Schmidt, L., Shore-Shephard, L., & Watson, T. (2016). The effect of safety net programs on food insecurity. Journal of Human Resources, 51(3), 589-614.
U.S. Department of Agriculture. (2012). Building a healthy America: A profile of the
Supplemental Nutrition Assistance Program. Office of Research and Analysis, Food and Nutrition Service, U.S. Department of Agriculture.
Volpe, R., Okrent, A., & Leibtag, E. (2013). The effect of supercenter-format stores on the
healthfulness of consumers’ grocery purchases. American Journal of Agricultural Economics, 95(3), 568-589.
Van Hook, J. & Ballistreri, K.S. (2006). Ineligible parents, eligible children: Food stamps receipt,
allotments and food insecurity among children of immigrants. Social Science Research, 35(1), 228-251.
Wilde, P. & Nord, M. (2005). The effect of food stamps on food security: A panel data approach.
Review of Agricultural Economics, 27(3), 425-432.
32
Table 1: Summary Statistics Variable Mean (Standard Error) SNAP Participation Self-reported (REPORT) 0.32 (0.02) Administrative from caseload data (ADMIN) 0.29 (0.02) Administrative from EBT transactions (ALERT) 0.30 (0.02) Dependent Variables Low food security 0.20 (0.02) Very low food security 0.13 (0.01) Total 2010 HEI score 50.56 (0.58) Body mass index 28.81 (0.25) Obese 0.38 (0.02) Severely obese 0.16 (0.01) Control Variables Age (years) 49.62 (0.98) Female 0.71 (0.02) Black 0.16 (0.03) White 0.71 (0.04) Other race (non-black, non-white) 0.13 (0.02) Married 0.31 (0.02) Formerly married 0.43 (0.02) Household size 2.56 (0.10) Number of children 0.93 (0.07) Rural tract 0.33 (0.06) Less than high school education 0.19 (0.02) High school graduate 0.34 (0.02) Some college education 0.21 (0.01) College degree or higher 0.26 (0.02) Worked last week 0.38 (0.03) Gross monthly family income ($1000s) 1.86 (0.06) Child Less than 5 years present in HH 0.61 (0.02) Elderly at least 65 years present in HH 0.28 (0.03) Never married 0.26 (0.02) Miles from residence to primary food store 3.15 (0.34) Primary food store is SNAP-authorized 0.98 (0.00)
Note: Statistics are from main analysis sample of 2108 observations. Observations are weighted to account for the complex sampling design of FoodAPS.
33
Table 2: Possible Classifications for Administrative Participation Measure from Caseload Data (ADMIN) Category Description N Baseline
Classification Alternate 1 Alternate 2 Alternate 3
1 ADMIN data not available from state 448 Missing Missing Missing Missing 2 Match to caseload data attempted but did not
meet threshold for certainty 1268 Non-
participant Non-
participant Non-
participant Non-
participant 3 Match confirms participation within 32 days of
the survey week 763 Participant Participant Participant Participant
4 Match confirms participation more than 32 days before the survey week or after the survey week
134 Participant Non-participant
Missing Participant
5 Match confirms participation but dates not available
175 Participant Participant Participant Missing
Note: Based on the main sample augmented with observations with missing ADMIN or ALERT but not any other variable. Table 3: Possible Classifications for Administrative Participation Measure from EBT Transactions (ALERT)
Category Description N Baseline Classification
Alternate 1 Alternate 2 Alternate 3
1 No acquisitions available for matching and no match to ADMIN to provide CASEID
574 Missing Missing Missing Non-participant
2 Match to ALERT data attempted but did not meet threshold for certainty
1174 Non-participant
Non-participant
Non-participant
Non-participant
3 Match confirms participation within 36 days of the survey week
961 Participant Participant Participant Participant
4 Match confirms participation more than 32 days before the survey week or after the survey week
79 Participant Non-participant
Missing Participant
Note: Based on the main sample augmented with observations with missing ADMIN or ALERT but not any other variable.
34
Table 4: Estimated Participation and Misreporting Rates under Different Approaches to Using ADMIN and ALERT Separately
Determination of final ADMIN and ALERT status
Sample Size Participation Rate (%)
False Negative Rate
(%)
False Positive Rate (%)
Panel A: Main Sample ADMIN Baseline 2108 29.00 11.65 8.39 ALERT Baseline 2108 30.00 11.46 7.83 Panel B: Varying Samples ADMIN Baseline 2340 28.59 12.28 8.08 ADMIN Alternate 1 2340 23.75 11.70 6.75 ADMIN Alternate 2 2206 24.96 6.83 8.08 ADMIN Alternate 3 2165 25.55 13.23 8.08 ALERT Baseline 2214 33.51 10.49 8.64 ALERT Alternate 1 2214 29.73 10.89 7.04 ALERT Alternate 2 2135 30.89 6.55 8.64 ALERT Alternate 3 2788 24.14 10.49 12.17
Note: Observations are weighted to account for the complex sampling design of FoodAPS. Table 5: Estimated Participation and Misreporting Rates under Different Approaches to Combining ADMIN and ALERT Decision Rule when ADMIN and ALERT Differ
Sample Size
Particip-ation Rate
(%)
False Negative Rate (%)
False Positive Rate (%)
Rule 1: Always use ADMIN unless missing 2446 31.95 11.25 8.80 Rule 2: Always use ALERT unless missing 2446 32.30 11.10 8.31 Rule 3: Drop if disagreement 1898 28.25 10.98 4.53 Rule 4: More weight to matches 2446 34.81 11.57 5.46 Rule 5: More weight to non-matches 2446 29.44 10.71 11.41
Note: Observations are weighted to account for the complex sampling design of FoodAPS.
35
Table 6: Extent of Disagreement among SNAP Participation Variables
Note: Frequencies are based on the main sample augmented with observations with missing ADMIN or ALERT but not any other variable.
REPORT ADMIN ALERT Observations Category 0 0 0 952 A 0 0 1 11 E 0 0 . 144 B 0 1 0 21 E 0 1 1 77 C 0 1 . 12 E 0 . 0 1 B 0 . 1 9 E 0 . . 261 D 1 0 0 74 C 1 0 1 69 E 1 0 . 18 E 1 1 0 109 E 1 1 1 795 A 1 1 . 58 B 1 . 0 17 E 1 . 1 79 B 1 . . 81 D
Total 2,788

36
Table 7: Regression Results using Each Participation Measure Separately
Food Insecurity
Very Low Food Security
Healthy Eating Index
Body Mass Index
Obese Severely Obese
Self-Reported 0.066*** (0.020)
0.027 (0.018)
-1.680*** (0.615)
1.045*** (0.343)
0.079*** (0.024)
0.039** (0.018)
ADMIN Preferred 0.060*** (0.020)
0.022 (0.018)
-2.071*** (0.601)
1.166*** (0.344)
0.057** (0.023)
0.035* (0.018)
ALERT Preferred 0.070*** (0.020)
0.020 (0.018)
-1.292** (0.605)
1.114*** (0.340)
0.061*** (0.023)
0.021 (0.019)
Note: Statistics are from main sample of 2108 observations. Heteroscedasticity-robust standard errors are in parentheses. *** indicates statistically significant at the 1% level, ** 5%, * 10%. Observations are weighted to account for the complex sampling design of FoodAPS.
37
Table 8: Regression Results using Each Participation Measure Separately
Sample Size
Food Insecurity
Very Low Food Security
Healthy Eating Index
Body Mass Index
Obese Severely Obese
Self-Reported 2788 0.059*** (0.018)
0.040** (0.016)
-1.500*** (0.541)
1.272*** (0.302)
0.094*** (0.021)
0.043*** (0.016)
ADMIN Preferred 2340 0.055*** (0.019)
0.019 (0.017)
-1.663*** (0.569)
1.328*** (0.325)
0.065*** (0.022)
0.048*** (0.017)
ADMIN Alternate 1 2340 0.056*** (0.020)
0.002 (0.018)
-1.484** (0.577)
1.202*** (0.333)
0.057*** (0.022)
0.045** (0.018)
ADMIN Alternate 2 2206 0.060*** (0.020)
0.012 (0.018)
-1.640*** (0.597)
1.377*** (0.344)
0.066*** (0.023)
0.051*** (0.018)
ADMIN Alternate 3 2165 0.053*** (0.020)
0.023 (0.018)
-1.417** (0.599)
1.249*** (0.341)
0.059** (0.023)
0.052*** (0.019)
ALERT Preferred 2214 0.064*** (0.019)
0.023 (0.018)
-1.201** (0.591)
1.154*** (0.333)
0.064*** (0.023)
0.021 (0.018)
ALERT Alternate 1 2214 0.062*** (0.020)
0.009 (0.018)
-0.907 (0.596)
1.159*** (0.335)
0.065*** (0.023)
0.022 (0.018)
ALERT Alternate 2 2135 0.067*** (0.020)
0.016 (0.018)
-1.090* (0.608)
1.218*** (0.342)
0.068*** (0.023)
0.023 (0.019)
ALERT Alternate 3 2788 0.052*** (0.018)
0.016 (0.016)
-0.717 (0.529)
1.133*** (0.302)
0.059*** (0.021)
0.012 (0.017)
Notes: Statistics based on the main sample augmented with observations with missing ADMIN or ALERT but not any other variable. Heteroscedasticity-robust standard errors are in parentheses. *** indicates statistically significant at the 1% level, ** 5%, * 10%. Observations are weighted to account for the complex sampling design of FoodAPS.

38
Table 9: Regression Results Combining Participation Measures through Various Rules
Sample Size
Food Insecurity
Very Low Food
Security
Healthy Eating Index
Body Mass Index
Obese Severely Obese
Rule 1: Always use ADMIN unless missing
2446 0.050*** (0.019)
0.022 (0.017)
-1.538*** (0.558)
1.352*** (0.320)
0.068*** (0.021)
0.047*** (0.017)
Rule 2: Always use ALERT unless missing
2446 0.060*** (0.019)
0.02 (0.017)
-0.901 (0.561)
1.308*** (0.316)
0.070*** (0.022)
0.035** (0.017)
Rule 3: Drop if disagreement
1898 0.075*** (0.021)
0.028 (0.019)
-1.689*** (0.652)
1.297*** (0.363)
0.063** (0.025)
0.032 (0.020)
Rule 4: More weight to matches
2446 0.061*** (0.019)
0.034** (0.017)
-1.482*** (0.567)
1.410*** (0.316)
0.071*** (0.022)
0.045*** (0.017)
Rule 5: More weight to non-matches
2446 0.050*** (0.019)
0.009 (0.017)
-0.989* (0.558)
1.276*** (0.321)
0.069*** (0.021)
0.038** (0.017)
Combined (SNAP-ABC)
2108 0.069*** (0.020)
0.026 (0.018)
-1.298** (0.607)
1.475*** (0.337)
0.073*** (0.023)
0.043** (0.018)
Combined (SNAP-ABC) with imputation
2788 0.067*** (0.020)
0.027 (0.017)
-1.401** (0.626)
1.447*** (0.328)
0.072*** (0.023)
0.045** (0.018)
Notes: Statistics based on the main sample augmented with observations with missing ADMIN or ALERT but not any other variable. Heteroscedasticity-robust standard errors are in parentheses. *** indicates statistically significant at the 1% level, ** 5%, * 10%. Observations are weighted to account for the complex sampling design of FoodAPS.

39
Appendix Table A1: 10-Question Food Security Question in FoodAPS Question Description
E2 In last 30 days, worried food would run out before we got more money E3 Food ran out and had no money to buy more, in last 30 days E4 Couldn't afford to eat balanced meals, in last 30 days E5 Adults skipped or cut size of meals b/c not enough money, in last 30 days (Y/N)
Universe: Answered “Sometimes not enough to eat” or “Often not enough to eat” description of food sufficiency question within last 30 days, OR answered “Often true” or “Sometimes true” to E2, E3 or E4.
E5a Number of days adults skipped/cut meal size b/c not enough money, last 30 days Universe: Answered “Yes” to E5
E6 Eat less than felt you should b/c not enough money, in last 30 days (Y/N) Universe: Answered “Sometimes not enough to eat” or “Often not enough to eat” description of food sufficiency question within last 30 days, OR answered “Often true” or “Sometimes true” to E2, E3 or E4.
E7 Ever hungry but didn't eat b/c not enough money, in last 30 days (Y/N) Universe: Answered “Sometimes not enough to eat” or “Often not enough to eat” description of food sufficiency question within last 30 days, OR answered “Often true” or “Sometimes true” to E2, E3 or E4.
E8 Lose weight b/c not enough money for food, in last 30 days (Y/N) Universe: Answered “Sometimes not enough to eat” or “Often not enough to eat” description of food sufficiency question within last 30 days, OR answered “Often true” or “Sometimes true” to E2, E3 or E4.
E9 Skip food all day b/c not enough money for food, in last 30 days (Y/N) Universe: Answered “Yes” to E5, E5a, E6, E7, or E8.
E9a How often adults skipped food all day b/c not enough money, in last 30 days Universe: Answered “Yes” to E9