Embed Size (px)
Citation preview

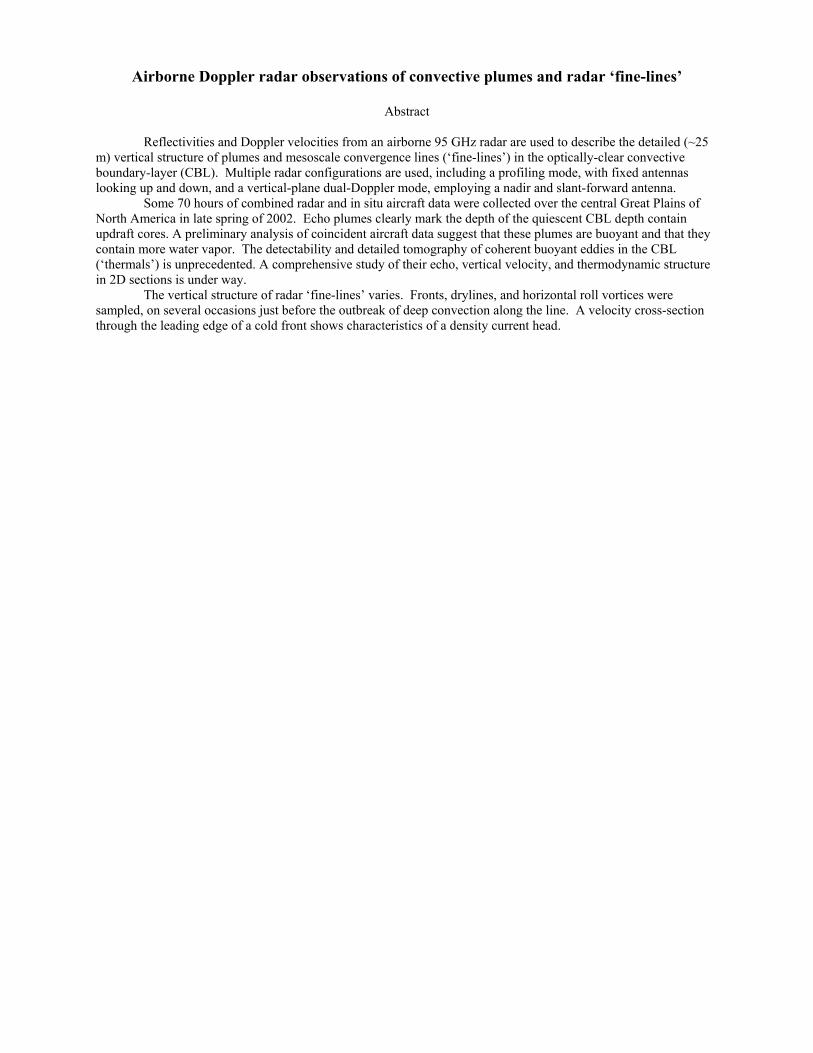
Airborne Doppler radar observations of convective plumes and radar ‘fine-lines’
ERAD02-A-00007
Bart Geerts1, David Leon, Samuel Haimov and Riccardo Damiani
University of Wyoming
1 Corresponding author address: Dr. Bart Geerts, Department of Atmospheric Sciences, University of Wyoming, Laramie WY 82071, USA; email: [email protected]
Airborne Doppler radar observations of convective plumes and radar ‘fine-lines’
Abstract
Reflectivities and Doppler velocities from an airborne 95 GHz radar are used to describe the detailed (~25 m) vertical structure of plumes and mesoscale convergence lines (‘fine-lines’) in the optically-clear convective boundary-layer (CBL). Multiple radar configurations are used, including a profiling mode, with fixed antennas looking up and down, and a vertical-plane dual-Doppler mode, employing a nadir and slant-forward antenna.
Some 70 hours of combined radar and in situ aircraft data were collected over the central Great Plains of North America in late spring of 2002. Echo plumes clearly mark the depth of the quiescent CBL depth contain updraft cores. A preliminary analysis of coincident aircraft data suggest that these plumes are buoyant and that they contain more water vapor. The detectability and detailed tomography of coherent buoyant eddies in the CBL (‘thermals’) is unprecedented. A comprehensive study of their echo, vertical velocity, and thermodynamic structure in 2D sections is under way.
The vertical structure of radar ‘fine-lines’ varies. Fronts, drylines, and horizontal roll vortices were sampled, on several occasions just before the outbreak of deep convection along the line. A velocity cross-section through the leading edge of a cold front shows characteristics of a density current head.
1. Introduction
For decades the large-eddy-scale kinematic structure of the optically-clear convective boundary-layer (BL) has been inferred from high-frequency, one-dimensional, in situ measurements, but has not been measured directly. Ground-based radar and lidar systems have been used to profile the BL, but their usefulness has been limited variously by long averaging times, lack of resolution and inadequate sensitivity. We use an airborne 95 GHz (3 mm) Doppler radar, to document the detailed two-dimensional structure of plumes in the convective BL, including that of ‘fine-lines’.
Clear-air echoes at W- through S-band are largely due to small insects or other relatively large, low-
concentration scatterers rather than being due to Bragg scattering (Wilson et al, 1994). Longer wavelength (S-band) radars also see Bragg scattering due to index of refraction variations on the scale of the radar wavelength. However, Bragg scattering is unlikely to contribute significantly to returns at W-band due to the smaller index of refraction variations present on the millimeter scale (see Knight and Miller, 1998). The presumed nature of the clear-air scatterers (non-spherical, and at least partly outside the Rayleigh regime at 3mm) makes the interpretation of the absolute reflectivity values meaningless. Rather, it is the reflectivity variations that shed light on the structure of the convective BL.
In this paper we present data from the 95 GHz Wyoming Cloud Radar (WCR,
http://www.atmos.uwyo.edu/wcr/projects/ihop02/) taken during the International Water Vapor Project (IHOP), conducted in May-June 2002 in the central Great Plains of North America. The WCR -- along with a suite of instruments for making high-frequency measurements of temperature, pressure, winds, and humidity – was mounted onboard the University of Wyoming King Air aircraft. The WCR generally transmitted a 225 ns pulse (i.e., a gate spacing of 32 m) at a pulse repetition frequency of 20 kHz (corresponding to an unambiguous velocity width of 31.6 ms-1). The return power and velocity are output by the WCR at ~25 Hz, and were usually further averaged (post-flight) to a rate of 3-4 Hz, corresponding to an along-track sampling rate of 20-30 m, given an aircraft speed of ~80 ms-1. The WCR records data from a first useable gate at 75-125 m up to 3 km or more. Generally the King Air was within 2 km of the region of interest for the WCR. The two-dimensional WCR images, shown below, result from the combination of radar range sampling (vertical dimension) and the motion of the aircraft (horizontal dimension).
During IHOP the WCR utilized any two of three non-scanning antennas, one pointing to the side or zenith,
one to the nadir, and one slant down. The two most commonly used configurations were the profile mode (nadir plus zenith) and the vertical plane dual-Doppler (VPDD) mode. The profile mode yields echo structure as well as near-vertical Doppler velocity. The VPDD mode uses the nadir and slant down antennas, the latter looking about 30º forward of nadir. The minimum detectable signal at a range of 1 km is about –28 dB for the nadir and zenith antennas, and –25 dB for the slant down antenna. All antennas have beamwidths less than 1°.
During straight flight the nadir and leading beams sample the same region (separated by time lag of ~14 s
at a vertical range of 2 km). Re-sampling of the same volume from two different angles allows the horizontal (along track) velocity to be separated from the vertical velocity (Leon et al, 1999). The synthesis of the two velocity vectors, corrected for aircraft motion, is performed after redistributing the radar profiles onto a Cartesian grid with a spacing of about 20x20 m. The nadir & zenith beams measure vertical velocity directly, thus this component can be retrieved without the difficulties and uncertainties associated with the dual-Doppler analysis. The WCR measured vertical velocity, corrected for aircraft motion, is the sum of the vertical air motion and the ‘fallspeed’ of the scatterers. Small insects, which we believe dominate the WCR signal in IHOP, may actively oppose uplift, which would explain the dramatic variations (> 30 dB) in reflectivity within the convective BL. Increased concentrations, and hence higher reflectivities, are observed in regions of convergence near the surface and in plumes corresponding to active or just-subsided updrafts.
The WCR observations from IHOP can be grouped into two broad categories: convective plumes in the
synoptically ‘quiescent’ convective BL, and ‘fine-line’ echoes corresponding to mesoscale features (such as fronts and drylines). Fine-line echoes in the convective BL are frequently observed on clear-air surveillance weather radar reflectivity displays, mainly in the warm season, and they are believed to present BL convergence zones. In fact forecasters have come to monitor the position and evolution of fine-lines, as thunderstorms may break out along them (e.g. Wilson et al, 1992; Koch and Ray, 1997), yet without knowledge of the vertical velocity structure of these lines, it is difficult to nowcast the initiation of deep convection. The echo and vertical velocity characteristics of plumes in the quiescent BL are discussed first, before illustrating the vertical structure of radar fine-lines.
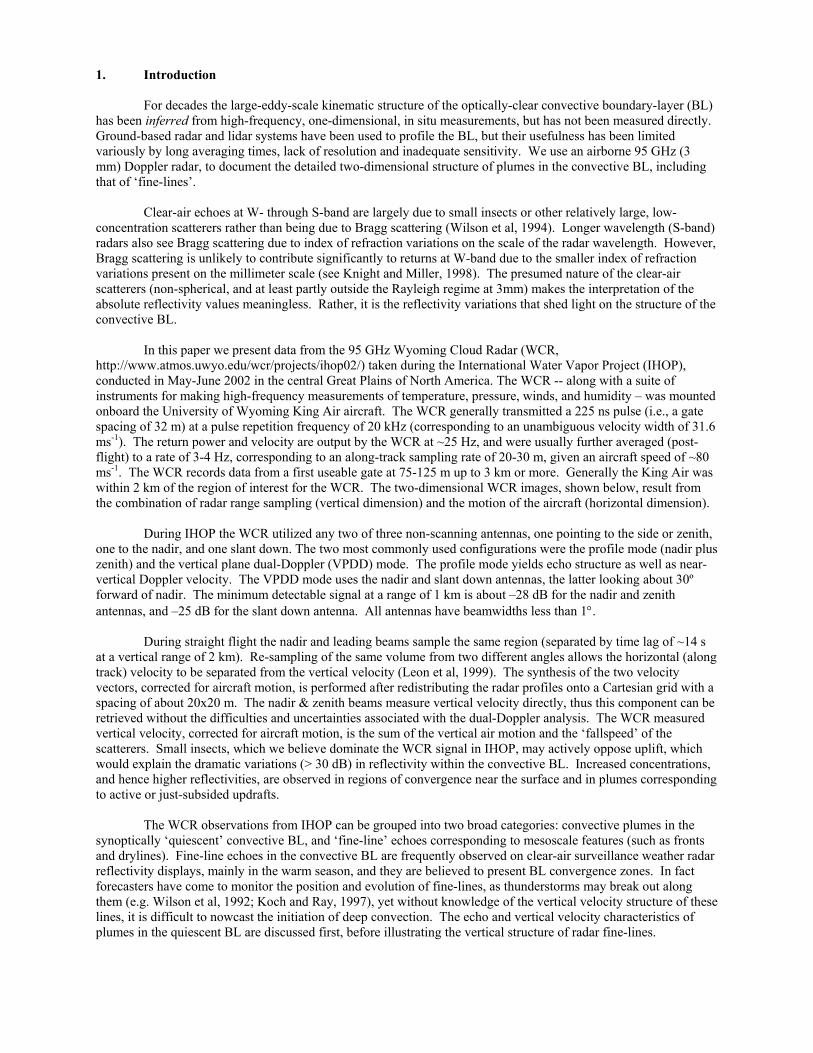
2. Quiescent boundary layer echo structure An example of echo plumes in the ‘undisturbed’ convective BL is shown in Fig 1. The BL was
undisturbed in the sense that the area sampled did not contain mesoscale convergence zones evident as well-defined radar fine-lines. The 38 km transect shown in Fig 1 contains several irregularly-spaced plumes. The plumes have a peak reflectivity at least 25 dB greater than the background reflectivity between plumes (which generally fell below the detectability threshold). An aircraft sounding just before this flight leg reveals a well-mixed BL, 1100 m deep (Zi), capped by a thin stable layer with a potential temperature increase (∆θ) of 6 K and a mixing ratio decrease (∆q) from 11 to less than 4 g/kg. The wind shear across the BL top was about 8 m s-1 km-1 from 200°, i.e. almost normal to this east-west oriented transect. Most plumes reach the top of the BL and do not appear sheared in the cross section.
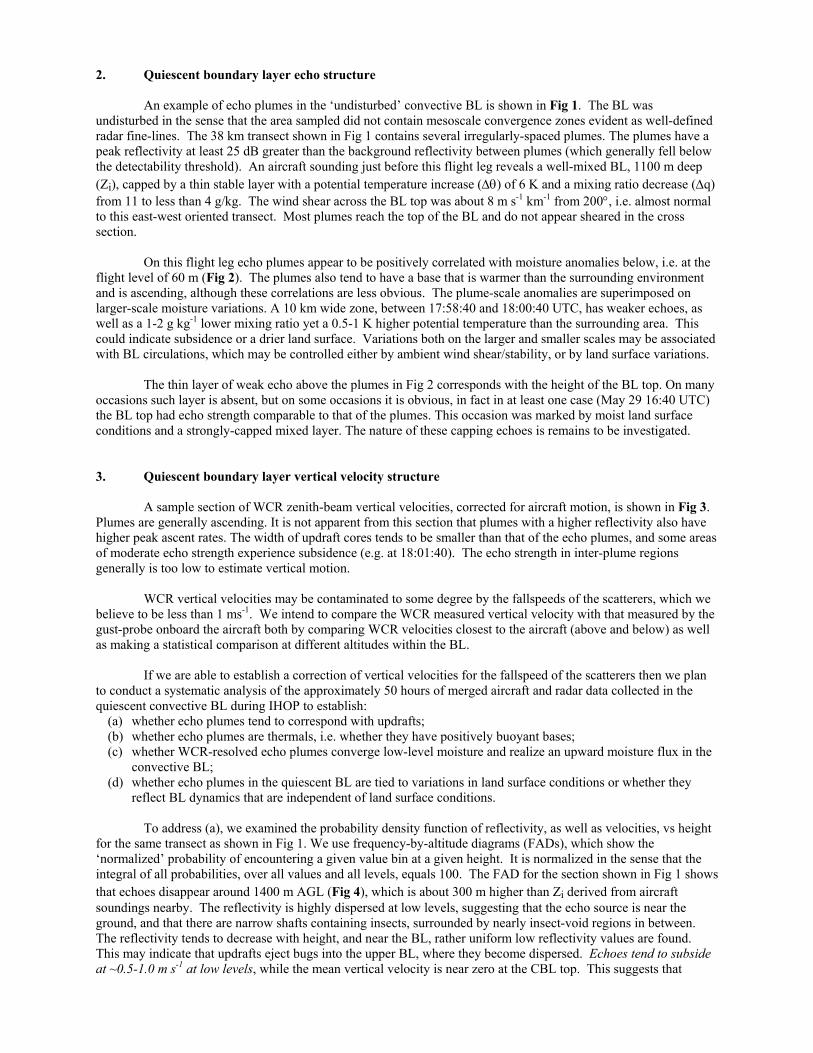
On this flight leg echo plumes appear to be positively correlated with moisture anomalies below, i.e. at the flight level of 60 m (Fig 2). The plumes also tend to have a base that is warmer than the surrounding environment and is ascending, although these correlations are less obvious. The plume-scale anomalies are superimposed on larger-scale moisture variations. A 10 km wide zone, between 17:58:40 and 18:00:40 UTC, has weaker echoes, as well as a 1-2 g kg-1 lower mixing ratio yet a 0.5-1 K higher potential temperature than the surrounding area. This could indicate subsidence or a drier land surface. Variations both on the larger and smaller scales may be associated with BL circulations, which may be controlled either by ambient wind shear/stability, or by land surface variations.
The thin layer of weak echo above the plumes in Fig 2 corresponds with the height of the BL top. On many
occasions such layer is absent, but on some occasions it is obvious, in fact in at least one case (May 29 16:40 UTC) the BL top had echo strength comparable to that of the plumes. This occasion was marked by moist land surface conditions and a strongly-capped mixed layer. The nature of these capping echoes is remains to be investigated.
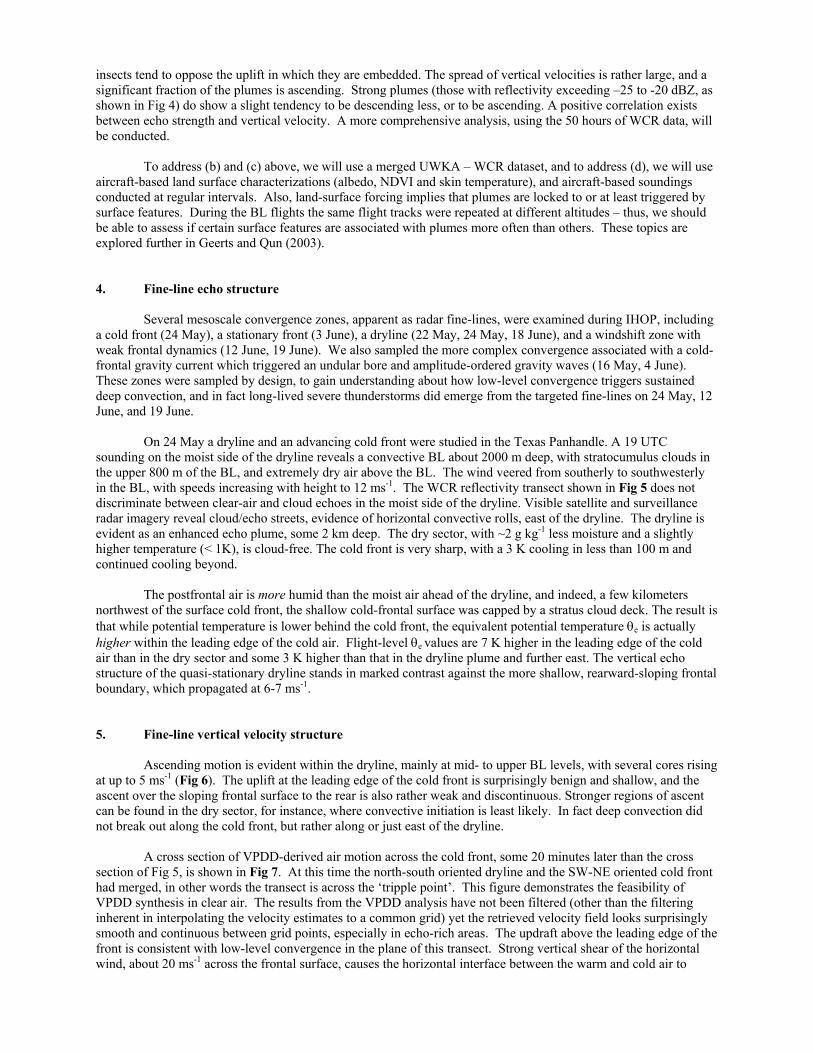
3. Quiescent boundary layer vertical velocity structure A sample section of WCR zenith-beam vertical velocities, corrected for aircraft motion, is shown in Fig 3.
Plumes are generally ascending. It is not apparent from this section that plumes with a higher reflectivity also have higher peak ascent rates. The width of updraft cores tends to be smaller than that of the echo plumes, and some areas of moderate echo strength experience subsidence (e.g. at 18:01:40). The echo strength in inter-plume regions generally is too low to estimate vertical motion.
WCR vertical velocities may be contaminated to some degree by the fallspeeds of the scatterers, which we
believe to be less than 1 ms-1. We intend to compare the WCR measured vertical velocity with that measured by the gust-probe onboard the aircraft both by comparing WCR velocities closest to the aircraft (above and below) as well as making a statistical comparison at different altitudes within the BL.
If we are able to establish a correction of vertical velocities for the fallspeed of the scatterers then we plan
to conduct a systematic analysis of the approximately 50 hours of merged aircraft and radar data collected in the quiescent convective BL during IHOP to establish:
(a) whether echo plumes tend to correspond with updrafts; (b) whether echo plumes are thermals, i.e. whether they have positively buoyant bases; (c) whether WCR-resolved echo plumes converge low-level moisture and realize an upward moisture flux in the
convective BL; (d) whether echo plumes in the quiescent BL are tied to variations in land surface conditions or whether they
reflect BL dynamics that are independent of land surface conditions.
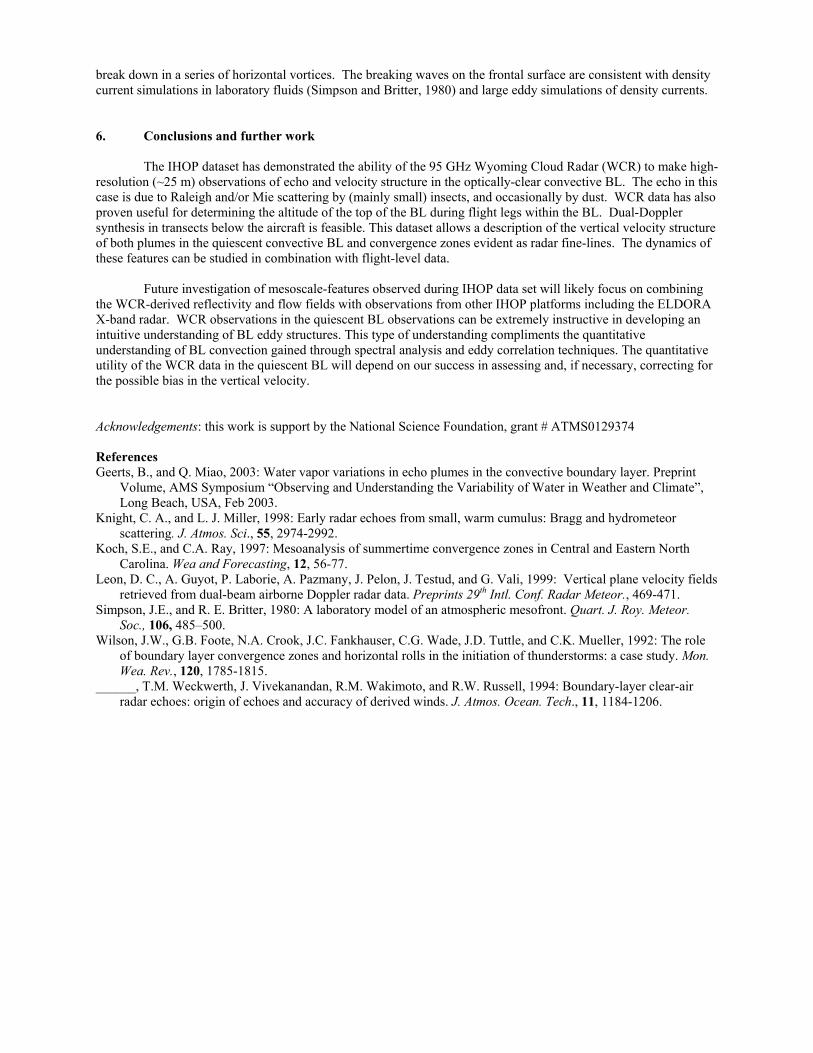
To address (a), we examined the probability density function of reflectivity, as well as velocities, vs height for the same transect as shown in Fig 1. We use frequency-by-altitude diagrams (FADs), which show the ‘normalized’ probability of encountering a given value bin at a given height. It is normalized in the sense that the integral of all probabilities, over all values and all levels, equals 100. The FAD for the section shown in Fig 1 shows that echoes disappear around 1400 m AGL (Fig 4), which is about 300 m higher than Zi derived from aircraft soundings nearby. The reflectivity is highly dispersed at low levels, suggesting that the echo source is near the ground, and that there are narrow shafts containing insects, surrounded by nearly insect-void regions in between. The reflectivity tends to decrease with height, and near the BL, rather uniform low reflectivity values are found. This may indicate that updrafts eject bugs into the upper BL, where they become dispersed. Echoes tend to subside at ~0.5-1.0 m s-1 at low levels, while the mean vertical velocity is near zero at the CBL top. This suggests that
insects tend to oppose the uplift in which they are embedded. The spread of vertical velocities is rather large, and a significant fraction of the plumes is ascending. Strong plumes (those with reflectivity exceeding –25 to -20 dBZ, as shown in Fig 4) do show a slight tendency to be descending less, or to be ascending. A positive correlation exists between echo strength and vertical velocity. A more comprehensive analysis, using the 50 hours of WCR data, will be conducted.
To address (b) and (c) above, we will use a merged UWKA – WCR dataset, and to address (d), we will use
aircraft-based land surface characterizations (albedo, NDVI and skin temperature), and aircraft-based soundings conducted at regular intervals. Also, land-surface forcing implies that plumes are locked to or at least triggered by surface features. During the BL flights the same flight tracks were repeated at different altitudes – thus, we should be able to assess if certain surface features are associated with plumes more often than others. These topics are explored further in Geerts and Qun (2003). 4. Fine-line echo structure
Several mesoscale convergence zones, apparent as radar fine-lines, were examined during IHOP, including
a cold front (24 May), a stationary front (3 June), a dryline (22 May, 24 May, 18 June), and a windshift zone with weak frontal dynamics (12 June, 19 June). We also sampled the more complex convergence associated with a cold-frontal gravity current which triggered an undular bore and amplitude-ordered gravity waves (16 May, 4 June). These zones were sampled by design, to gain understanding about how low-level convergence triggers sustained deep convection, and in fact long-lived severe thunderstorms did emerge from the targeted fine-lines on 24 May, 12 June, and 19 June.
On 24 May a dryline and an advancing cold front were studied in the Texas Panhandle. A 19 UTC
sounding on the moist side of the dryline reveals a convective BL about 2000 m deep, with stratocumulus clouds in the upper 800 m of the BL, and extremely dry air above the BL. The wind veered from southerly to southwesterly in the BL, with speeds increasing with height to 12 ms-1. The WCR reflectivity transect shown in Fig 5 does not discriminate between clear-air and cloud echoes in the moist side of the dryline. Visible satellite and surveillance radar imagery reveal cloud/echo streets, evidence of horizontal convective rolls, east of the dryline. The dryline is evident as an enhanced echo plume, some 2 km deep. The dry sector, with ~2 g kg-1 less moisture and a slightly higher temperature (< 1K), is cloud-free. The cold front is very sharp, with a 3 K cooling in less than 100 m and continued cooling beyond.
The postfrontal air is more humid than the moist air ahead of the dryline, and indeed, a few kilometers
northwest of the surface cold front, the shallow cold-frontal surface was capped by a stratus cloud deck. The result is that while potential temperature is lower behind the cold front, the equivalent potential temperature θe is actually higher within the leading edge of the cold air. Flight-level θe values are 7 K higher in the leading edge of the cold air than in the dry sector and some 3 K higher than that in the dryline plume and further east. The vertical echo structure of the quasi-stationary dryline stands in marked contrast against the more shallow, rearward-sloping frontal boundary, which propagated at 6-7 ms-1.
5. Fine-line vertical velocity structure
Ascending motion is evident within the dryline, mainly at mid- to upper BL levels, with several cores rising at up to 5 ms-1 (Fig 6). The uplift at the leading edge of the cold front is surprisingly benign and shallow, and the ascent over the sloping frontal surface to the rear is also rather weak and discontinuous. Stronger regions of ascent can be found in the dry sector, for instance, where convective initiation is least likely. In fact deep convection did not break out along the cold front, but rather along or just east of the dryline.
A cross section of VPDD-derived air motion across the cold front, some 20 minutes later than the cross
section of Fig 5, is shown in Fig 7. At this time the north-south oriented dryline and the SW-NE oriented cold front had merged, in other words the transect is across the ‘tripple point’. This figure demonstrates the feasibility of VPDD synthesis in clear air. The results from the VPDD analysis have not been filtered (other than the filtering inherent in interpolating the velocity estimates to a common grid) yet the retrieved velocity field looks surprisingly smooth and continuous between grid points, especially in echo-rich areas. The updraft above the leading edge of the front is consistent with low-level convergence in the plane of this transect. Strong vertical shear of the horizontal wind, about 20 ms-1 across the frontal surface, causes the horizontal interface between the warm and cold air to
break down in a series of horizontal vortices. The breaking waves on the frontal surface are consistent with density current simulations in laboratory fluids (Simpson and Britter, 1980) and large eddy simulations of density currents.
6. Conclusions and further work
The IHOP dataset has demonstrated the ability of the 95 GHz Wyoming Cloud Radar (WCR) to make high-resolution (~25 m) observations of echo and velocity structure in the optically-clear convective BL. The echo in this case is due to Raleigh and/or Mie scattering by (mainly small) insects, and occasionally by dust. WCR data has also proven useful for determining the altitude of the top of the BL during flight legs within the BL. Dual-Doppler synthesis in transects below the aircraft is feasible. This dataset allows a description of the vertical velocity structure of both plumes in the quiescent convective BL and convergence zones evident as radar fine-lines. The dynamics of these features can be studied in combination with flight-level data.
Future investigation of mesoscale-features observed during IHOP data set will likely focus on combining
the WCR-derived reflectivity and flow fields with observations from other IHOP platforms including the ELDORA X-band radar. WCR observations in the quiescent BL observations can be extremely instructive in developing an intuitive understanding of BL eddy structures. This type of understanding compliments the quantitative understanding of BL convection gained through spectral analysis and eddy correlation techniques. The quantitative utility of the WCR data in the quiescent BL will depend on our success in assessing and, if necessary, correcting for the possible bias in the vertical velocity.
Acknowledgements: this work is support by the National Science Foundation, grant # ATMS0129374 References Geerts, B., and Q. Miao, 2003: Water vapor variations in echo plumes in the convective boundary layer. Preprint
Volume, AMS Symposium “Observing and Understanding the Variability of Water in Weather and Climate”, Long Beach, USA, Feb 2003.
Knight, C. A., and L. J. Miller, 1998: Early radar echoes from small, warm cumulus: Bragg and hydrometeor scattering. J. Atmos. Sci., 55, 2974-2992.
Koch, S.E., and C.A. Ray, 1997: Mesoanalysis of summertime convergence zones in Central and Eastern North Carolina. Wea and Forecasting, 12, 56-77.
Leon, D. C., A. Guyot, P. Laborie, A. Pazmany, J. Pelon, J. Testud, and G. Vali, 1999: Vertical plane velocity fields retrieved from dual-beam airborne Doppler radar data. Preprints 29th Intl. Conf. Radar Meteor., 469-471.
Simpson, J.E., and R. E. Britter, 1980: A laboratory model of an atmospheric mesofront. Quart. J. Roy. Meteor. Soc., 106, 485–500.
Wilson, J.W., G.B. Foote, N.A. Crook, J.C. Fankhauser, C.G. Wade, J.D. Tuttle, and C.K. Mueller, 1992: The role of boundary layer convergence zones and horizontal rolls in the initiation of thunderstorms: a case study. Mon. Wea. Rev., 120, 1785-1815.
______, T.M. Weckwerth, J. Vivekanandan, R.M. Wakimoto, and R.W. Russell, 1994: Boundary-layer clear-air radar echoes: origin of echoes and accuracy of derived winds. J. Atmos. Ocean. Tech., 11, 1184-1206.
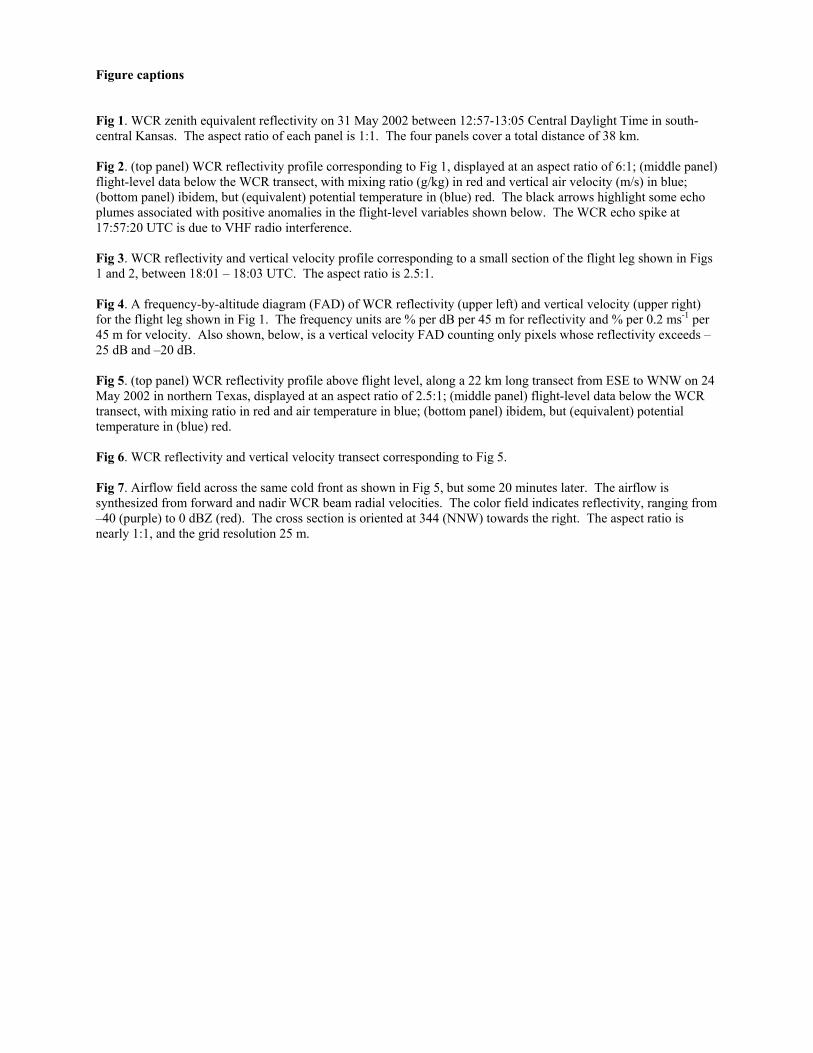
Figure captions Fig 1. WCR zenith equivalent reflectivity on 31 May 2002 between 12:57-13:05 Central Daylight Time in south-central Kansas. The aspect ratio of each panel is 1:1. The four panels cover a total distance of 38 km. Fig 2. (top panel) WCR reflectivity profile corresponding to Fig 1, displayed at an aspect ratio of 6:1; (middle panel) flight-level data below the WCR transect, with mixing ratio (g/kg) in red and vertical air velocity (m/s) in blue; (bottom panel) ibidem, but (equivalent) potential temperature in (blue) red. The black arrows highlight some echo plumes associated with positive anomalies in the flight-level variables shown below. The WCR echo spike at 17:57:20 UTC is due to VHF radio interference. Fig 3. WCR reflectivity and vertical velocity profile corresponding to a small section of the flight leg shown in Figs 1 and 2, between 18:01 – 18:03 UTC. The aspect ratio is 2.5:1. Fig 4. A frequency-by-altitude diagram (FAD) of WCR reflectivity (upper left) and vertical velocity (upper right) for the flight leg shown in Fig 1. The frequency units are % per dB per 45 m for reflectivity and % per 0.2 ms-1 per 45 m for velocity. Also shown, below, is a vertical velocity FAD counting only pixels whose reflectivity exceeds –25 dB and –20 dB. Fig 5. (top panel) WCR reflectivity profile above flight level, along a 22 km long transect from ESE to WNW on 24 May 2002 in northern Texas, displayed at an aspect ratio of 2.5:1; (middle panel) flight-level data below the WCR transect, with mixing ratio in red and air temperature in blue; (bottom panel) ibidem, but (equivalent) potential temperature in (blue) red. Fig 6. WCR reflectivity and vertical velocity transect corresponding to Fig 5. Fig 7. Airflow field across the same cold front as shown in Fig 5, but some 20 minutes later. The airflow is synthesized from forward and nadir WCR beam radial velocities. The color field indicates reflectivity, ranging from –40 (purple) to 0 dBZ (red). The cross section is oriented at 344 (NNW) towards the right. The aspect ratio is nearly 1:1, and the grid resolution 25 m.
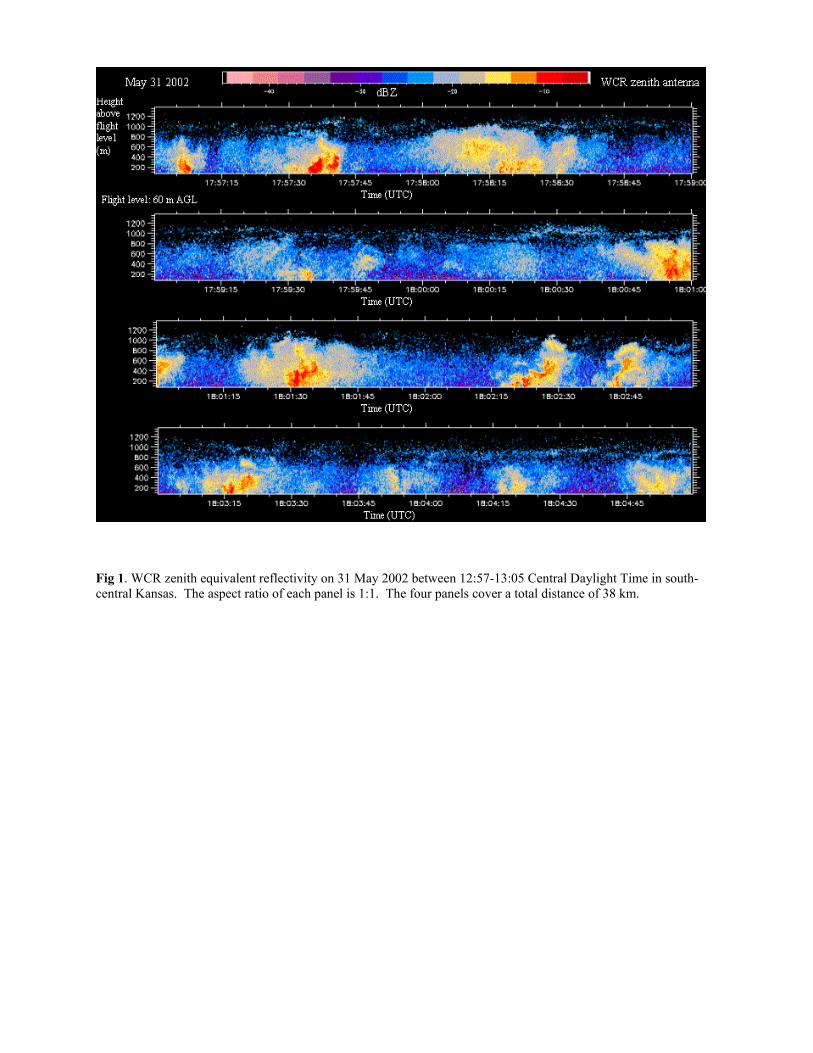
Fig 1. WCR zenith equivalent reflectivity on 31 May 2002 between 12:57-13:05 Central Daylight Time in south-central Kansas. The aspect ratio of each panel is 1:1. The four panels cover a total distance of 38 km.
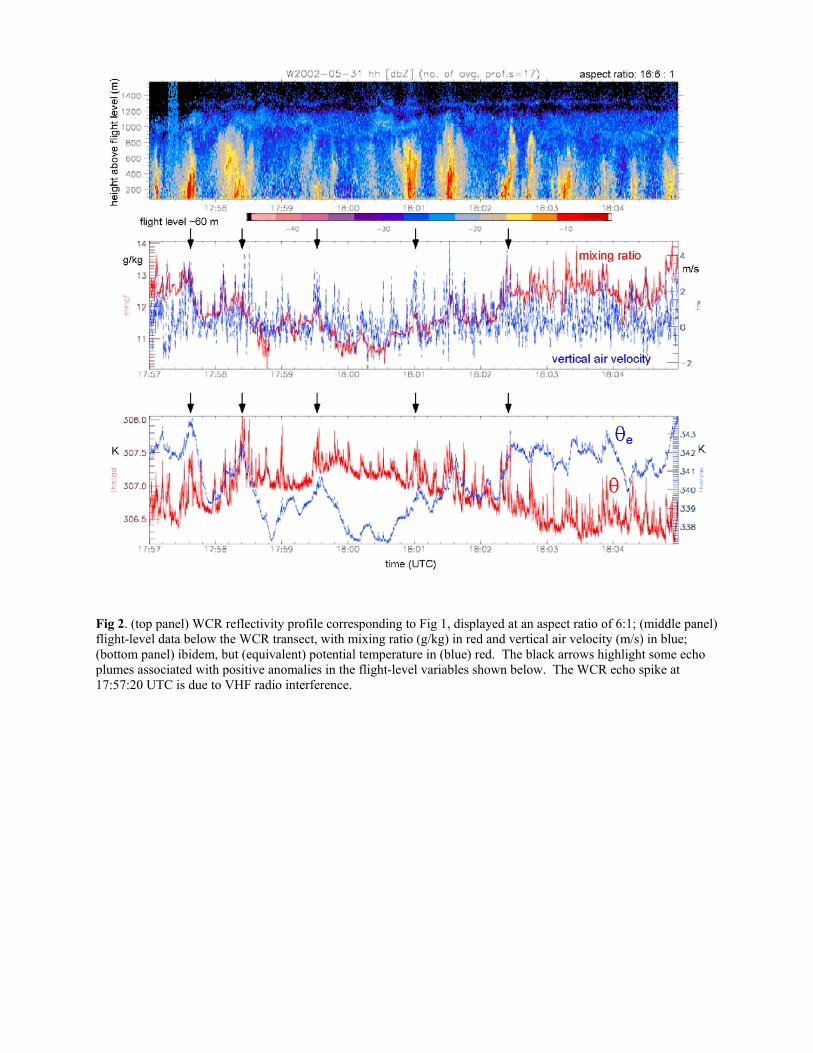
Fig 2. (top panel) WCR reflectivity profile corresponding to Fig 1, displayed at an aspect ratio of 6:1; (middle panel) flight-level data below the WCR transect, with mixing ratio (g/kg) in red and vertical air velocity (m/s) in blue; (bottom panel) ibidem, but (equivalent) potential temperature in (blue) red. The black arrows highlight some echo plumes associated with positive anomalies in the flight-level variables shown below. The WCR echo spike at 17:57:20 UTC is due to VHF radio interference.
Fig 3. WCR reflectivity and vertical velocity profile corresponding to a section of the flight leg shown in Figs 1 and 2, between 18:01 – 18:03 UTC. The aspect ratio is 2.5:1.
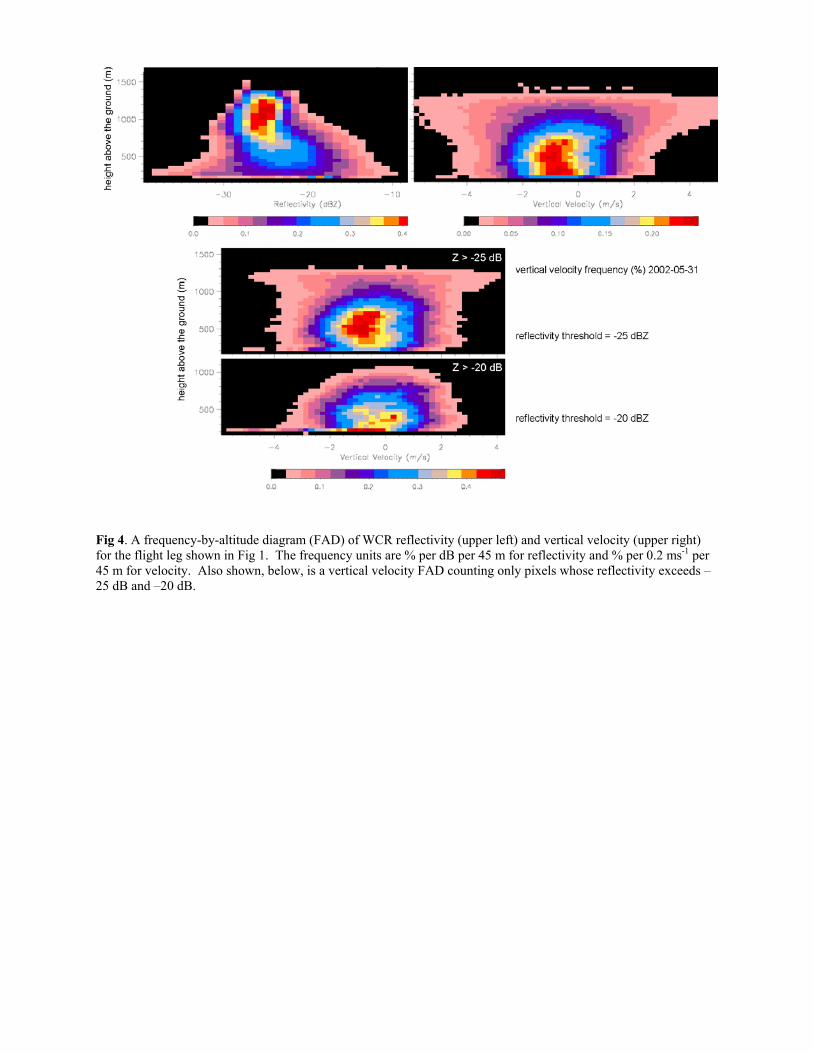
Fig 4. A frequency-by-altitude diagram (FAD) of WCR reflectivity (upper left) and vertical velocity (upper right) for the flight leg shown in Fig 1. The frequency units are % per dB per 45 m for reflectivity and % per 0.2 ms-1 per 45 m for velocity. Also shown, below, is a vertical velocity FAD counting only pixels whose reflectivity exceeds –25 dB and –20 dB.
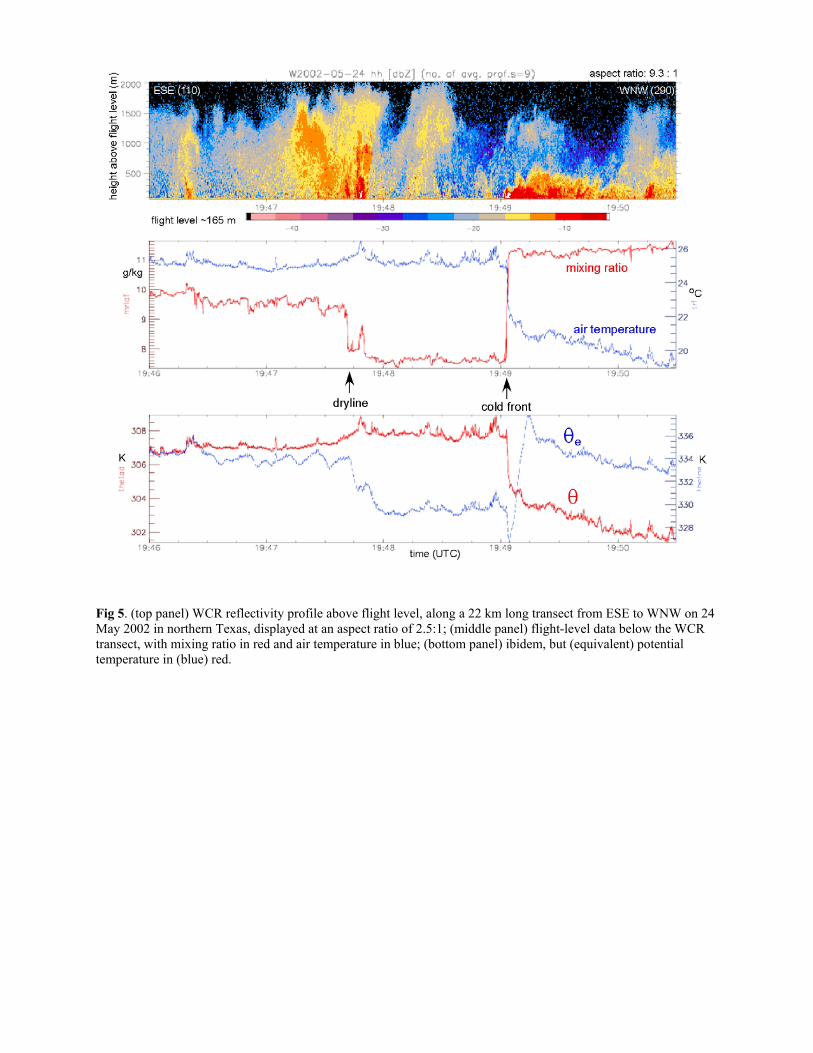
Fig 5. (top panel) WCR reflectivity profile above flight level, along a 22 km long transect from ESE to WNW on 24 May 2002 in northern Texas, displayed at an aspect ratio of 2.5:1; (middle panel) flight-level data below the WCR transect, with mixing ratio in red and air temperature in blue; (bottom panel) ibidem, but (equivalent) potential temperature in (blue) red.
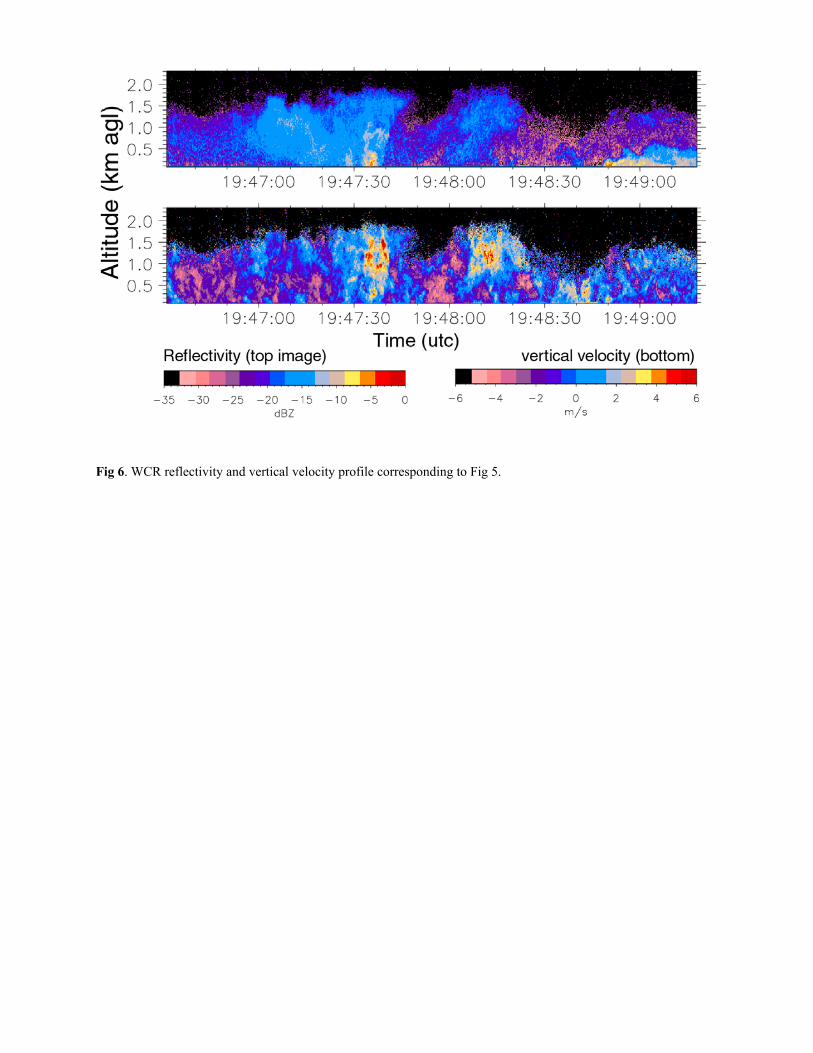
Fig 6. WCR reflectivity and vertical velocity profile corresponding to Fig 5.
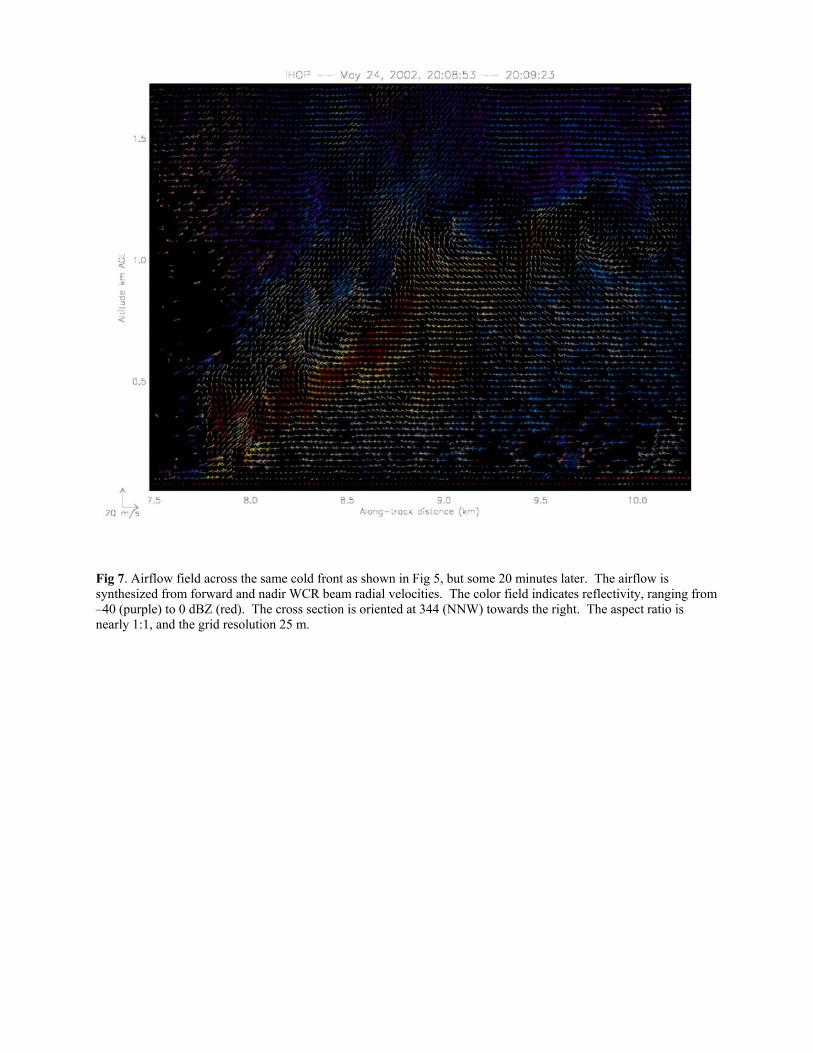
Fig 7. Airflow field across the same cold front as shown in Fig 5, but some 20 minutes later. The airflow is synthesized from forward and nadir WCR beam radial velocities. The color field indicates reflectivity, ranging from –40 (purple) to 0 dBZ (red). The cross section is oriented at 344 (NNW) towards the right. The aspect ratio is nearly 1:1, and the grid resolution 25 m.