Embed Size (px)
Citation preview
Cloud Computing and Spatial CyberinfrastructureMarlon E. Pierce1*, Geoffrey C. Fox1,2, Yu Ma1, Jun Wang1,
1Community Grids Laboratory, Pervasive Technology InstituteIndiana University
501 North Morton StreetBloomington, IN 47404
2School of Informatics901 E. 10th St.
Bloomington, IN 47408
* Corresponding AuthorEmail: [email protected]
Phone: 812-856-1212Fax: 812-856-7972
Classification: Physical Sciences, Computer Sciences

Abstract: Cyberinfrastructure has closely tracked commercial best practices for over a decade. However, we believe there is still much to learn about correct strategies for building distributed systems to support collaborating scientists and related communities. In this perspectives paper, we review the current state of Cyberinfrastructure and illustrate opportunities that we see if Cloud Computing strategies are adopted. In summary, Cloud Computing is the use of Web Services to control the life cycle of virtual machines and virtual data stores to create a flexible, user-controlled infrastructure. Huge commercial investments in Cloud infrastructure make it likely that these systems will dominate large-scale computing hardware and software in the next decade. Furthermore, open source Cloud software is making it possible for universities and research laboratories to build open-architecture clouds for scientific computing and other uses. We illustrate the applicability and potential advantages of Cloud Computing to Spatial Cyberinfrastructure through two case studies (flood modeling and radar image processing), mapping these projects’ requirements to both infrastructure and runtime capabilities typically provided by Clouds. Our preliminary conclusion from this review is that Spatial Cyberinfrastructure’s requirements are a good match for many common capabilities of Clouds, warranting a larger scale investigation.
IntroductionThis perspectives piece summarizes our views on the next generation of
Cyberinfrastructure (CI) generally and Spatial Cyberinfrastructure specifically. We base these views on experiences from number of relevant projects, including the NASA-funded QuakeSim project (1,2), the USGS-funded FloodGrid project (described here), and the NSF-funded PolarGrid project (www.polargrid.org). Our lab has developed Cyberinfrastructure software to support these distributed spatial applications, building on our general investigations of Cyberinfrastructure architectures (3). Applications include Geospatial Information System (GIS) Grid services based on Open Geospatial Consortium standards (4) and real-time streaming Global Positioning System processing infrastructure (5,6).
We take a broad view of the problems that Cyberinfrastructure (CI) must support. High performance computing and data storage are just two aspects; we also need to manage real-time data streams, integrate third party capabilities (such as geographic map and data providers), and build interactive user interfaces that act as Science Gateways (7). As we discuss in this paper, we believe the next generation of major CI deployments (such as the NSF TeraGrid (8)) need to provide a broader scope of infrastructure capabilities to their user communities. Cloud Computing approaches discussed here are good candidates for offering the infrastructure and services needed for both deep (computationally intense) science, such as is discussed by Wang in this special issue; and wide (non-traditional) usage, such the wide area GIS service networks discussed by Yang et al. and the GIS field worker case studies discussed by Poore, also both in this special issue. Spatial CI thus provides a subset of capabilities that spans many of the requirements of CI in general, and so is a good test case for evaluating general CI architectures.
Cyberinfrastructure (CI) is the hardware, software, and networking that enables regionally, nationally, and globally scalable distributed computing, data and information management, and collaboration. Grid computing is an important subset of CI. In the US, the NSF-funded TeraGrid and the NSF/DOE Open Science Grid (9) are examples of national-scale infrastructure. Internationally, the European Grid Initiative (http://www.egi.eu/) is a prominent example, and the Open Grid Forum (http://ogf.org/) provides international community leadership and standards. An important characteristic of Grid deployments is that they provide network-accessible programming interfaces that

allow remote, programmatic access for executing science applications on large clusters and supercomputers, managing files and archives, and getting information about the states of the system components. These interfaces are typically built as Web services. Prominent examples of software (middleware) used to provide these services include the Globus Toolkit (10), Condor (11), and gLite (glite.web.cern.ch). Higher-level capabilities can be built on these basic services. Examples include workflow composing tools (12,13), which compose basic services into higher order applications; and science gateways (7), which provide Web interfaces to services and workflows that are suitable for a broad range of users (researchers, students, and the general public). This service-oriented approach is generally compatible with, for example, the Open Geospatial Consortium’s suite of service specifications, particularly the Web Feature Service and Web Map Service, as discussed by Yang et al. in this issue. Ideally, one may build higher-level applications out of a toolbox of third party services backed up by persistent Cyberinfrastructure; we formerly termed this the “Grid of Grids” approach (3).
The problem that we see is that there is no national scale real infrastructure to provide the foundation for the comprehensive cyberinfrastructure vision of the well-known Atkins report (14); that is, as we will elaborate, there is no "infrastructure as a service" in today's CI. The current flagship deployments of Cyberinfrastructure in the US are dominated by the requirements of batch-oriented computing and high-end, high performance computing. Arguably the NSF DataNet funded projects such as DataONE (https://dataone.org/) may address the data-centric needs of Cyberinfrastructure that are crucial to much of Spatial CI, such as long-term storage and preservation of observational and experimental data and their processing pipelines, but this NSF program is still new. In this paper, we argue for the adoption of Cloud Computing approaches to CI, which offer a broader approach to infrastructure than today’s Grids. Cloud Computing-like infrastructure is of particular interest to Spatial CI applications, so there is an opportunity for Spatial CI to provide important use cases that help clarify what capabilities that a general-purpose, end-to-end CI deployment should provide. We illustrate these requirements through two small projects, FloodGrid and the PolarGrid. First, however, we will review Cloud Computing.
Cyberinfrastructure and Cloud ComputingThere is an ongoing debate about the precise definitions of Cloud Computing and
how it can be differentiated from Grids. Following (15), clouds are notable for their elasticity (ability for users to scale resources up and down) and for new platform features like distributed table data storage and the map-reduce programming model. These are not inconsistent with goals of Grid Computing, but in practice most Grid work focused on areas like virtual organizations that arise when one links resources and people across administrative domains. Large commercial clouds are geographically distributed but federate systems that have similar processes and management and so do not face many issues tackled by Grids. Some concepts, including service oriented architectures and workflow for scientific computing, were pioneered by grids and are equally important for clouds.
Academic surveys and initial investigations of clouds are available from (16,17, 18), and Clouds from a Grid perspective are discussed in (19). A key distinguishing feature of Grids is the “virtual organization” (20). Grids are designed to support virtual organizations that federate multiple real, independent organizations with heterogeneous resources. In contrast, commercial Clouds are controlled by single entities (corporations such as Amazon, Google, or Microsoft), and the virtual organization problem is not central. This may change as more resource-limited organizations (such as universities) stand up campus Clouds. Instead, Clouds expose a more user-centric view of their infrastructure: service agreements are between the user and the cloud provider, rather

than between two resource providers attempting to federate themselves. We will focus on two specific aspects of these user-centric capabilities of Cloud services: Infrastructure as a Service and runtime Software as a Service.
Infrastructure: At the lowest and simplest level, clouds may be defined as Web services that control the life cycles of virtual machines and virtual storage. A virtual machine is a software implementation of a computer than runs on a real computer; it can have a different operating system, software stack, and network address from its host. Clouds providers use virtual machines to provide "Infrastructure as a Service". Through Web services and virtualization, users create and control their own computing resources on remote cloud centers. A simple but powerful extension of this idea is for the virtual machines to come with software packages preconfigured. For example, one may imagine checking out a virtual machine or cluster that comes pre-configured with geospatial software (Web Map and Feature services, collections of data sets such as demographic and environmental data, and analysis software) needed for a particular investigation or to provide a particular service to a community.
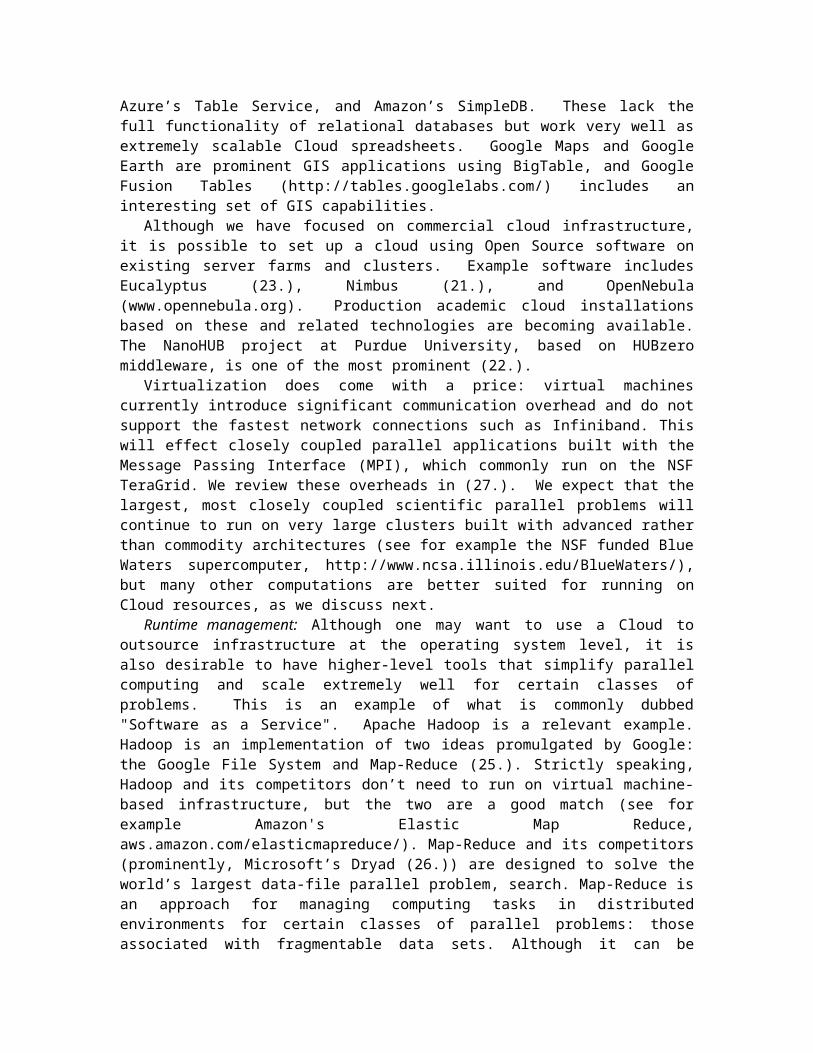
Less well known than the virtual machine but at least as important for Spatial CI is the virtual block storage device. The best example of this is Amazon’s Elastic Block Store, which can be attached to a virtual machine to provide additional file space. These attached file systems do not need to be empty. As Amazon’s public data sets illustrate (aws.amazon.com/publicdatasets/), users can create libraries of public and community data sets (files or databases) that can be checked out from the Cloud by individual users. The applicability of these services for hosting distributed GIS data sets and services (see again for example Yang et al in this issue) is apparent. Additionally, the major Cloud vendors all have very scalable but flat data management capabilities as part of their infrastructure. Examples include Google’s BigTable, Microsoft Azure’s Table Service, and Amazon’s SimpleDB. These lack the full functionality of relational databases but work very well as extremely scalable Cloud spreadsheets. Google Maps and Google Earth are prominent GIS applications using BigTable, and Google Fusion Tables (http://tables.googlelabs.com/) includes an interesting set of GIS capabilities.
Although we have focused on commercial cloud infrastructure, it is possible to set up a cloud using Open Source software on existing server farms and clusters. Example software includes Eucalyptus (23), Nimbus (21), and OpenNebula (www.opennebula.org). Production academic cloud installations based on these and related technologies are becoming available. The NanoHUB project at Purdue University, based on HUBzero middleware, is one of the most prominent (22).
Virtualization does come with a price: virtual machines currently introduce significant communication overhead and do not support the fastest network connections such as Infiniband. This will effect closely coupled parallel applications built with the Message Passing Interface (MPI), which commonly run on the NSF TeraGrid. We review these overheads in (27). We expect that the largest, most closely coupled scientific parallel problems will continue to run on very large clusters built with advanced rather than commodity architectures (see for example the NSF funded Blue Waters supercomputer, http://www.ncsa.illinois.edu/BlueWaters/), but many other computations are better suited for running on Cloud resources, as we discuss next.
Runtime management: Although one may want to use a Cloud to outsource infrastructure at the operating system level, it is also desirable to have higher-level tools that simplify parallel computing and scale extremely well for certain classes of problems. This is an example of what is commonly dubbed "Software as a Service". Apache Hadoop is a relevant example. Hadoop is an implementation of two ideas promulgated by Google: the Google File System and Map-Reduce (25). Strictly speaking, Hadoop and its competitors don’t need to run on virtual machine-based infrastructure, but the two

are a good match (see for example Amazon's Elastic Map Reduce, aws.amazon.com/elasticmapreduce/). Map-Reduce and its competitors (prominently, Microsoft’s Dryad (26)) are designed to solve the world’s largest data-file parallel problem, search. Map-Reduce is an approach for managing computing tasks in distributed environments for certain classes of parallel problems: those associated with fragmentable data sets. Although it can be applied to a wide range of problems (24), it generally is designed to support data-file parallelism; that is, we need to apply an operation or a sequence of operations to huge input files that can be split into smaller fragments on distributed file systems. The individual operations need little or no communication with each other. In contrast, traditional parallel programming, based around the Message Passing Interface (MPI) is better suited for tightly coupled applications with significant inter-process communication. The notion of file parallelism can be generalized to network streams and other standard input/output mechanisms. Processing and mining sensor streams in a large sensor Web are obvious applications for stream data parallelism in Spatial CI. Although not supported by Hadoop, this is an intended feature of Dryad and has been explored by research groups (27, 28). The relevance of both Cloud infrastructure and runtimes to Spatial CI should be clear, and we will next look at relevant examples.
Case Study #1: Flood GridTo facilitate and improve flood planning, forecasting, damage assessments, and
emergency responses, the USGS-funded FloodGrid project (a collaboration between the Polis Center, www.polis.iupui.edu and the authors) has prototyped an integrated platform for inundation modeling, property loss estimation, and visual presentation. Rather than centralizing all capabilities onto a specific platform, we have developed this system following open service architecture principles, packaging functionalities as Web Services and pipelining them as an end-to-end workflow. Integration is achieved via a Web interface that manages user interactions with services. This is an example of a relatively simple Science Gateway. As we review here, even this simple system combines real-time data services, computational services, and GIS information and data services. We build some of these services and leverage third party providers for others. For a similar system, see (29).
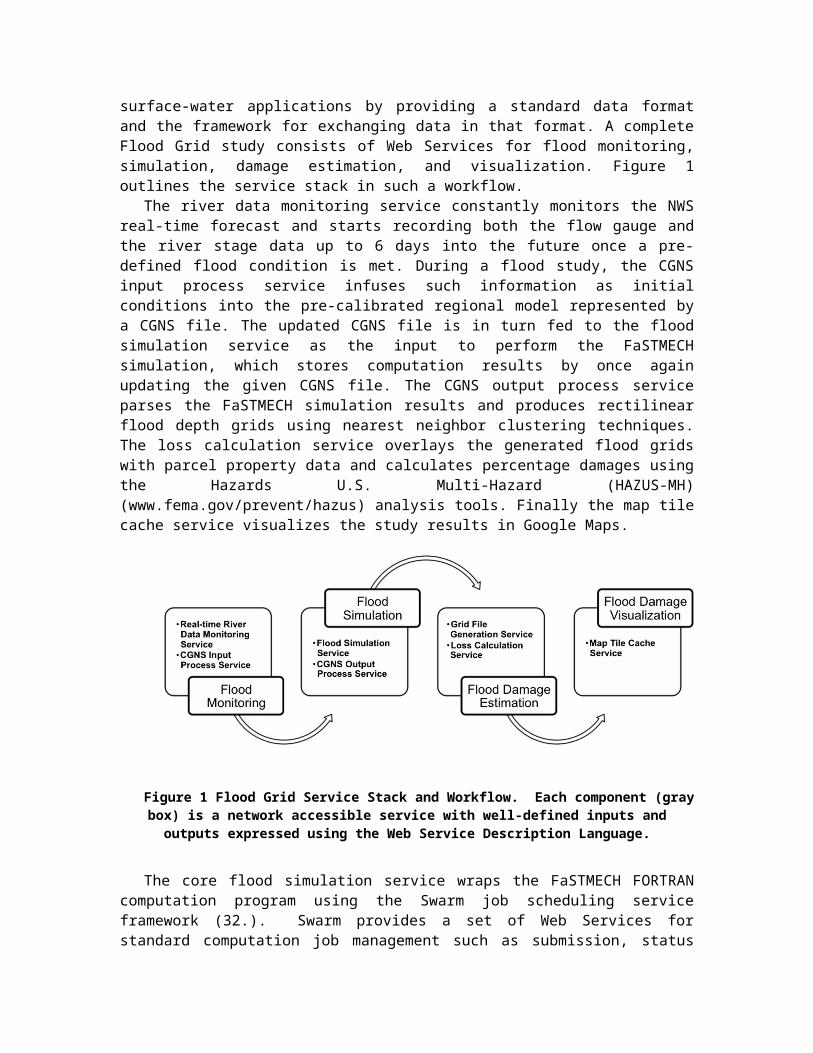
The Flood Grid pilot study focuses on inundations of the White River at Ravenswood area in Indianapolis, using the 2D hydraulic model, FaSTMECH (30), calibrated for the region. Real-time forecast data from the National Weather Service's Advanced Hydrologic Predication Service (http://water.weather.gov/ahps2/hydrograph.php?wfo=ind&gage=nori3) provide initial conditions of the simulation. The Computational Fluid Dynamics General Notation System (CGNS) (31) bridges the computation model and its environmental surface-water applications by providing a standard data format and the framework for exchanging data in that format. A complete Flood Grid study consists of Web Services for flood monitoring, simulation, damage estimation, and visualization. Figure 1 outlines the service stack in such a workflow.
The river data monitoring service constantly monitors the NWS real-time forecast and starts recording both the flow gauge and the river stage data up to 6 days into the future once a pre-defined flood condition is met. During a flood study, the CGNS input process service infuses such information as initial conditions into the pre-calibrated regional model represented by a CGNS file. The updated CGNS file is in turn fed to the flood simulation service as the input to perform the FaSTMECH simulation, which stores computation results by once again updating the given CGNS file. The CGNS output process service parses the FaSTMECH simulation results and produces rectilinear flood depth grids using nearest neighbor clustering techniques. The loss calculation service overlays the generated flood grids with parcel property data and calculates percentage
damages using the Hazards U.S. Multi-Hazard (HAZUS-MH) (www.fema.gov/prevent/hazus) analysis tools. Finally the map tile cache service visualizes the study results in Google Maps.
Figure 1 Flood Grid Service Stack and Workflow. Each component (gray box) is a network accessible service with well-defined inputs and outputs expressed using the Web
Service Description Language.
The core flood simulation service wraps the FaSTMECH FORTRAN computation program using the Swarm job scheduling service framework (32). Swarm provides a set of Web Services for standard computation job management such as submission, status query, and output retrieval. The simulation service is deployed on the Gateway Hosting Service at Indiana University (33), a virtual machine-based hosting infrastructure. Flood damage estimation and visualization services are developed with Visual Basic .NET, and deployed under Internet Information Services (IIS) by the Polis Center.
Figure 2 depicts the layout of the user interface on the left, with the corresponding screenshot on the right. Upon registration, a user can run new studies or review an earlier one in the flood studies control center. The execution status of each service in the study workflow is also displayed under this section. For a completed study, simulation results are visualized with Google Maps displaying flooded regions and damaged parcel properties that are obtained from regional Web Feature Services. The map overlay section enables mash-ups with other online geospatial services such as county parcel maps and demographic maps from Social Assets and Vulnerabilities Indicators (SAVI) Community Information System (www.savi.org).
FloodGrid, as described above, is an example of a "Grid of Grids" federation of several services, rather than a cloud. However, we use FloodGrid to illustrate the advantages of using both Infrastructure and Software as a Service. We map the Flood Grid infrastructure requirements to Cloud Computing infrastructure in Table 1. An important requirement for FloodGrid’s infrastructure is reliable service hosting to make sure that the services illustrated in Figure 1 are persistently available, with redundancy and load balancing. It is certainly possible to have these capabilities without using Cloud-based virtualization, but virtualization can be used to build redundancy into the fabric of the infrastructure rather than placing this burden on the developers. This is the key design feature of the Gateway Hosting Service, an in-house Infrastructure as a Service system. In two years of operation (from July 2008), FloodGrid's hosted service has experienced 6 outages totaling just under 16 hours.

Figure 2 Flood Grid User Interface Layout and Screenshot (courtesy of Neil Devadasan, IUPUI Polis Center).
Clouds would also be useful as providers of standard data libraries (CGNS files of hydrological models) through virtual block stores. For FloodGrid, the central piece is a validated CGNS input mesh that models a particular section of a river. Although only one such model was available to us for the study, one may envision a library of calibrated models for different geographic areas available for checkout from virtual block storage services. Similarly, standard GIS data sets (parcel and demographic information) can also be delivered in this fashion, coupled to the Web Feature Service that provides them. That is, one would not need to rely upon a third party Web service with its own reliability concerns. Instead, GIS data providers could provide virtual images of their data and software that can be instantiated by other developers on a Cloud as needed. Finally, we note that the system could use pre-configured virtual machines that include FasTMECH, Swarm, and all supporting software to distribute the system to other groups wanting to run their own versions of FloodGrid.
Table 1 Mapping Flood Grid infrastructure requirements to Cloud Computing.
Flood Grid Requirement Cloud Computing CapabilityWeb Service hosting Virtual machine infrastructure CGNS mesh model data Virtual block storageGIS data (WFS parcel information,
HAZUS-MH)Virtual block storage
FaSTMECH Hosting Virtual machine infrastructure; Map-Reduce style computation management (optional)
Case Study Example: Map-Reduce and the FloodGrid Imaging Service. We consider here a use case for applying map-reduce techniques to image rendering of outputs. This is an example of a data-file parallel (or pleasingly parallel) application. The goal is to evaluate the use of these tools to provide a parallel runtime environment rather than modifying the application. The FloodGrid Imaging Service is designed to generate hourly flood depth images, which can be further processed to produce a movie to show continuous changes of flood stages. The CGNS output process service produces hourly flood computation results in a text format. All hourly flood images need to be rendered in a unified color-map to guarantee the visual continuity among images. The result text files are hence scanned to select data points of interested areas and find out the minimum and maximum depth for the unified color-map.
The imaging service is developed in python, and Apache Hadoop streaming is used to run map-reduce tasks within the service in a small, multi-core and multi-node testbed,
described below. Potentially this testbed could be provided as Virtual Machine images for complete reducibility of our test results. Testing environment: Hardware: three-node cluster, one master node with 2 Dual-Core 3.0GHz Intel Xeon 5160 CPU, 3GB memory, and two slave nodes with 2 Dual-Core 2.33 GHz Intel Xeon E5345 CPU, 2 GB memory. Operating System: Fedora release 7. Software: Python 2.5, Hadoop 0.20.1 Test Dataset: Hourly outputs from White River flood simulation, 120 text files total, each file contains more than 100k depth data points. Testing procedure: The imaging service runs with Hadoop streaming using different number of mappers and reducers on each node by specifying mapred.tasktracker.map.tasks.maximum and mapred.tasktracker.reduce.tasks.maximum (see Figure 5).
M1R1 M2R2 M3R3 M4R4 M5R5 M6R6 M7R7 M8R8200
220
240
260
280
300
320
340
FloodGrid Imaging Service Performance
Maxmimum mumber of mappers/reducers per node
Exe
cuti
on t
ime
(sec
ond
s)
Figure 3 FloodGrid Imagtaing Service performance on a small cluster managed by Apache Hadoop.
Testing results are depicted in Figure 3. In Hadoop, map task and map reduce maximums are the two parameters to control the number of maps/reduces spawned simultaneously on a TaskTracker (i.e. computing node). The default value is 2; that is, a maximum of 2 maps and 2 reduces at a given instance on a TaskTracker. However, there is no way to precisely control the actual number of mappers/reducers running on each node. In this test, we can see the best performance is gained at M5R5; it shows 15% performance gain against the Hadoop default setting M2R2. Without Hadoop, the imaging service takes 583 seconds to process the given dataset on the master node, 750 seconds on a single slave node, and does not have any capability of utilizing any cluster or multi-core resources. The best performance gained with Hadoop adaptation in the three-node multi-core cluster environment is 270 seconds, roughly 2.16 times speedup over the best available single node (i.e. the master node). We conclude that Hadoop streaming is an easy way to deploy existing scientific computing applications (compiled Fortran binaries in this case) into the cluster environment, and dynamically allocate computing resources. To gain the best performance in the multi-core environment, Hadoop should be further tailored on a per-tasktracker basis to accurately reflect the hardware on each computing node.
Case Study #2: Polar Grid: Online SAR Image Post-ProcessingIn this case study, we examine the cloud computing requirements of a common
Spatial CI problem: image processing. We are motivated by the need to determine the

depth and shape of underlying rock beds beneath the Greenland and Antarctic glaciers (34). Detailed knowledge of the rock beds is needed to develop new models to replace the inadequate current models of glacial motion. From the point of view of Spatial CI, these are examples also of data-parallel computing.
The sub-glacial terrain images acquired from Synthetic Aperture Radar (SAR) reveal ice sheet thickness and the details of internal ice layers over vast areas beneath the 3 KM-thick Greenland ice sheet (35). Approximately 25 TB of raw SAR data are available for processing Polar Grid resources from the 2008-2009 campaigns. A single research group can manage initial data processing as a one-time exercise since there are generally no optional processing steps that need to be explored. However, higher-level data products, such as improving the SAR image qualities in post-processing, require human interaction. One main image quality issue is speckle noise. The speckle noise usually appears as random granular patterns, which can reduce the image resolution and give the image a fuzzy appearance. Applying proper filters enhances the image quality and improves the interpretation of sub-glacial structures. SAR image processing is computationally intensive; it is desirable to use a scalable approach for parallel SAR image post-processing. In this pilot project, we have evaluated both the use of map-reduce methods to initial data processing and the service-based infrastructure requirements needed to support the user-driven filtering. Filters are shown in Table 2.
Table 2 Testing dataset and filters
Data and Filters Parameters
Helheim dataset Size: 17023 (w) x 970 (h), ground track: 67 km
Medium filter Horizontal and vertical length (h, v)
Wiener filter Horizontal and vertical length (h, v)
Fir1 filter Cut off frequency (f)
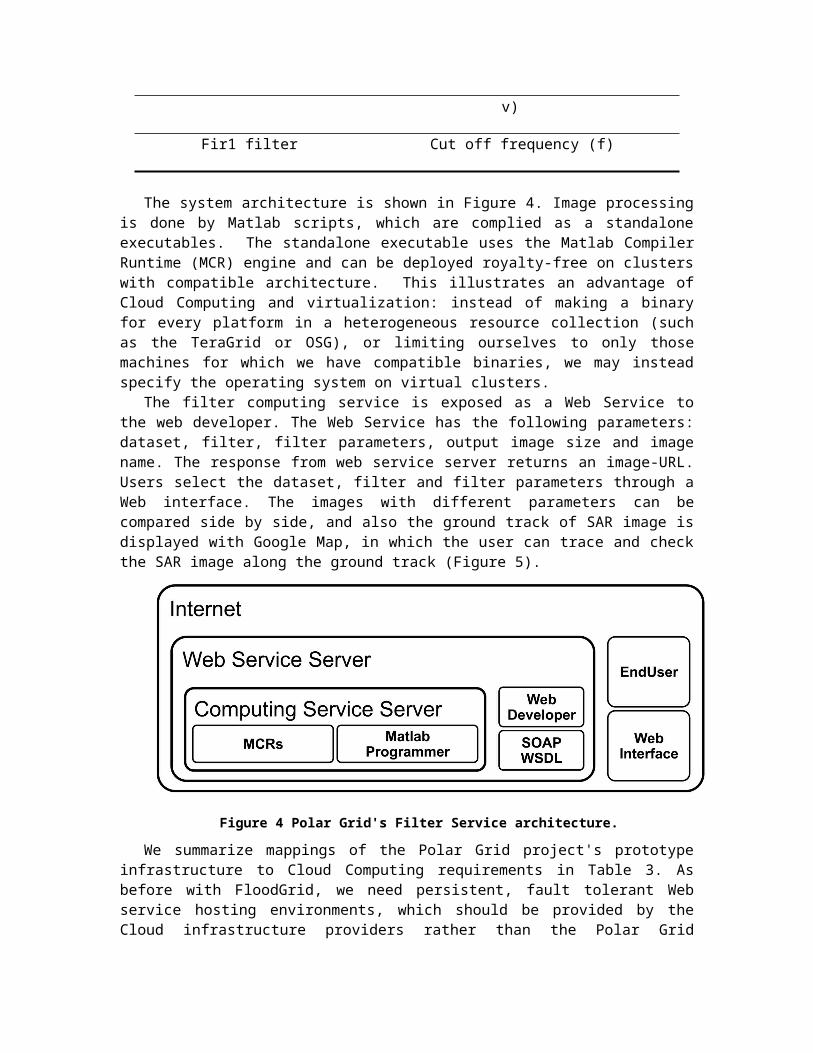
The system architecture is shown in Figure 4. Image processing is done by Matlab scripts, which are complied as a standalone executables. The standalone executable uses the Matlab Compiler Runtime (MCR) engine and can be deployed royalty-free on clusters with compatible architecture. This illustrates an advantage of Cloud Computing and virtualization: instead of making a binary for every platform in a heterogeneous resource collection (such as the TeraGrid or OSG), or limiting ourselves to only those machines for which we have compatible binaries, we may instead specify the operating system on virtual clusters.
The filter computing service is exposed as a Web Service to the web developer. The Web Service has the following parameters: dataset, filter, filter parameters, output image size and image name. The response from web service server returns an image-URL. Users select the dataset, filter and filter parameters through a Web interface. The images with different parameters can be compared side by side, and also the ground track of SAR image is displayed with Google Map, in which the user can trace and check the SAR image along the ground track (Figure 5).

Figure 4 Polar Grid's Filter Service architecture.
We summarize mappings of the Polar Grid project's prototype infrastructure to Cloud Computing requirements in Table 3. As before with FloodGrid, we need persistent, fault tolerant Web service hosting environments, which should be provided by the Cloud infrastructure providers rather than the Polar Grid developers. We likewise need to make standard SAR data sets available. The particular problem to note here is the size of the data: it is prohibitive (unlike FloodGrid) to move the SAR data for image processing on some remote cluster, so we must instead keep the computing power near the data. On the other hand, the SAR files are data-file parallel and so are good candidates for Cloud runtime tools. We need to extend the runtime engine (Hadoop, et al) to manage the filters shown in Table 3. These filters are compiled binaries that must be run on a compatible operating system (that is, one with a specific version of the Linux kernel), so virtualization can greatly expand the amount of resources available to us, compared to conventional systems. Virtualization also is useful for ensuring that the filter images have exactly the right dependencies (particularly the correct version of the MCR).
Figure 5 Trace SAR image along the ground track. The user interface is courtesy of Jeff Wood, Elizabeth City State University.
Case Study Example: Hadoop and SAR Image Post-Processing. SAR image processing is a data-parallel problem and so well-suited for map-reduce in principal. Matlab is a common development environment in many fields, including signal image processing, so it is important to determine if it can feasibly be combined with Hadoop. We perform our evaluation on the same testbed described above. Matlab and MCR have some special properties that influence the performance in Hadoop. First, we must
overcome a mismatch between Matlab's standard input/output mechanisms and the Hadoop Distributed File System (HDFS). Matlab standard input (stdin) and standard output (stdout) are associated with a shell or command window. This means Matlab scripts can’t interact directly with HDFS. As a workaround, we developed a python wrapper to load the SAR input file from Hadoop into the local file system. After the file is processed, the output images are sent back to HDFS by the same python script. Second, MCR includes support for multi-cores; however, it will only take advantage of multi-cores in certain computations, such as the FIR filtering operation used in this application. Finally, MCR makes use of thread locking and only one thread is allowed to access the MCR at a time. Consequently the numbers of mappers and reducers on a computing node do not influence the performance of MCR on Hadoop, which processes threaded computing jobs in the sequential order.
Table 3 Polar Grid gateway infrastructure mapped to Cloud infratructure.
Polar Grid Portal Requirement Cloud Computing Capability
Service hosting Virtual machines
SAR data set hosting Virtual block storage
Individual filter processing Virtual machines
Large scale data processing Map-reduce runtime parallelization
In this example, the complied Matlab script works as the mapper, and there is no “reduce” phase. 100 random chosen pairs of filter and parameter are used for the performance test. It takes 1353 seconds for the master node to finish these 100 image-processing jobs. On a slave node, it takes 2553 seconds. In the Hadoop streaming environment, Hadoop distributes computing jobs equally among three computing nodes, and takes 901 seconds to finish, roughly 1.5 times speed up over the best node. Since each node has been assigned an equal number of image processing jobs, slower slave machines impact the performance more. It is possible to develop a customized input splitter that distributes more jobs to the faster master node. We conclude from this example that Hadoop streaming is an easy way to deploy a data-parallel application built from a Matlab binary. However, a custom wrapper is necessary to stage stdin/stdout data between HDFS and the Matlab application. To improve the performance, frequent file operation should be avoided in Matlab applications. A major drawback is that the total number of computing nodes, instead of computing cores, determines Hadoop streaming performance in this case.
Conclusions In this paper, we discussed requirements of Spatial Cyberinfrastructure and how
these correspond to Cloud Computing. We illustrated these requirements using two small projects developed in a pre-Cloud fashion: the Flood Grid and Polar Grid projects. Our key observation is that Clouds grant more control over the environment to developers through virtualization. This allows, for example, developers to install and control their own software without worrying about version conflicts with developers on unrelated projects.
Spatial CI is an important subset of a more general CI, spanning the both "deep" and "wide" usage requirements. We have shown the a number of Spatial CI requirements, such as service hosting, virtual clusters, and virtual data sets, map well to Cloud

Computing's "Infrastructure as a Service" model. This important requirement (see for examples the service-oriented Spatial CI (Yang et al), human-centered CI (Siebar et al and Poore), and data management CI described by companion articles) is unmet by current CI deployments such as the TeraGrid. We also examined modeling and processing services with data-file parallelism (such as image processing pipelines), which are examples of common Cloud Computing "Software as a Service" models such as map-reduce. Cloud computing models still need to be applied to a broader class of Spatial CI problems, such as those discussed by Wang and by Helly et al.
Large commercial vendors dominate Clouds, but there is a growing collection of open source software that can be used to build research clouds. A challenge for core Cyberinfrastructure research will be to investigate and document open architecture Cloud systems. Spatial CI can and should provide a wide range of important test cases.
AcknowledgmentsThe FloodGrid project is funded by the Federal Geographic Data Committee's
National Spatial Data Infrastructure, Cooperative Agreements Program Category 2: Best Practices in Geospatial Service Oriented Architecture (SOA), Agreement #08HQAG0026. PolarGrid is funded by NSF through the award, "MRI: Acquisition of PolarGrid: Cyberinfrastructure for Polar Science", award # 0723054.
References1. Atkas, M., et al. (2006), iSERVO: Implementing the International Solid Earth Virtual
Observatory by Integrating Computational Grid and Geographical Information Web Services, Pure and Applied Geophysics, Volume 163, Numbers 11-12, 2281-2296.
2. Donnellan, A., et al (2006) QuakeSim and the Solid Earth Research Virtual Observatory, Pure and Applied Geophysics, Volume 163, Numbers 11-12, 2263-2279.
3. Fox, G., Lim, S., Pallickara, S., Pierce, M. (2005) Message-based Cellular Peer-to-Peer Grids: Foundations for Secure Federation and Autonomic Services, Journal of Future Generation Computer Systems, 21(3), 401–415. (2005).
4. Aydin, G., et al., (2008) Building and applying geographical information system Grids. Concurrency and Computation: Practice and Experience 20(14): 1653-1695.
5. Aydin, G., Qi, Z., Pierce, M.E., Fox, G.C., and Bock, Y., Architecture, Performance, and Scalability of a Real-Time Global Positioning System Data, Grid 17 January 2007, Special issue on Computational Challenges in Geosciences in PEPI (Physics of the Earth and Planetary Interiors) 163: 347-359 (2007).
6. Granat, R., Aydin, A., Pierce, M.E., Qi, Z., and Bock, Y. (2007) Analysis of streaming GPS measurements of surface displacement through a web services environment, CIDM: 750-757 (2007).
7. Wilkins-Diehr, N., Gannon, D., Klimeck, G., Oster, S., Pamidighantam, S. (2008): TeraGrid Science Gateways and Their Impact on Science. IEEE Computer 41(11): 32-41.
8. Catlett, C., et al. (2004) TeraGrid: Analysis of Organization, System Architecture, and Middleware Enabling New Types of Applications, HPC and Grids in Action, Ed. Lucio Grandinetti, IOS Press 'Advances in Parallel Computing' series, Amsterdam.
9. Foster, I. et al., (2004) The Grid2003 Production Grid: Principles and Practice, HPDC: 236-245.
10. Foster, I. (2006) Globus Toolkit Version 4: Software for Service-Oriented Systems. J. Comput. Sci. Technol. 21(4): 513-520.
11. Thain, D., Tannenbaum, T., Livny, M. (2005) Distributed computing in practice: the Condor experience. Concurrency - Practice and Experience 17(2-4): 323-356.

12. Gil, Y., et al (2007) Examining the Challenges of Scientific Workflows. IEEE Computer 40(12): 24-32.
13. Fox, G., Gannon, D. (2006) Special Issue: Workflow in Grid Systems. Concurrency and Computation: Practice and Experience 18(10): 1009-1019.
14. Atkins DE, et al. (2003) Revolutionizing Science and Engineering through Cyber-infrastructure: Report of the National Science Foundation Blue-Ribbon Advisory Panel on Cyberinfrastructure, National Science Foundation Publication NSF0728 (National Science Foundation, Washington, DC), 84 pp. s/TechRpts/2009/EECS-2009-28.pdf
15. Fox, Geoffrey (2010) Clouds and Map Reduce for Scientific Applications. Technical Report. Available from http://grids.ucs.indiana.edu/ptliupages/publications/CloudsandMR.pdf
16. Michael Armbrust, Armando Fox, Rean Griffith, Anthony D. Joseph, Randy H. Katz, Andy Konwinski, Gunho Lee, David A. Patterson, Ariel Rabkin, Ion Stoica, Matei Zaharia: A view of cloud computing. Commun. ACM 53(4): 50-58 (2010)
17. Youseff, L.; Butrico, M.; Da Silva, D (2008) Toward a Unified Ontology of Cloud Computing. Page(s): 1-10 Digital Object Identifier 10.1109/GCE.2008.4738443.
18. Jha, S., Merzky, A., Fox, G (2009) Using clouds to provide grids with higher levels of abstraction and explicit support for usage modes. Concurrency and Computation: Practice and Experience 21(8): 1087-1108.
19. Foster, I. T., Zhao, Y., Raicu, I., Lu, S.: Cloud Computing and Grid Computing 360-Degree Compared CoRR abs/0901.0131: (2009).
20. Ian T. Foster, Carl Kesselman, Steven Tuecke: The Anatomy of the Grid: Enabling Scalable Virtual Organizations. IJHPCA 15(3): 200-222 (2001)
21. Foster, I., et al. (2006) Virtual Clusters for Grid Communities, CCGRID: 513-520. 22. Klimeck, G., et al (2008), nanoHUB.org: Advancing Education and Research in
Nanotechnology, IEEE Computers in Engineering and Science (CISE), Vol. 10, 17-23 (2008).
23. Nurmi, D., et al (2008) The Eucalyptus Open-source Cloud-computing System, in Proceedings of Cloud Computing and Its Applications, Chicago, IL (October 2008).
24. Chu C-T, et al (2006). Olukotun, Map-Reduce for Machine Learning on Multicore, NIPS: 281-288.
25. Dean, J., Ghemawat, S. (2008) MapReduce, Simplified Data Processing on Large Clusters. Commun, ACM 51(1): 107-113.
26. Isard, M., Budiu, M., Yu Y., Birrell, A., Fetterly, D. (2007) Dryad, Distributed Data-Parallel Programs from Sequential Building Blocks, EuroSys: 59-72.
27. Ekanayake, J.; Pallickara, S.; Fox, G. (2008) MapReduce for Data Intensive Scientific Analyses. IEEE Fourth International Conference on eScience '087-12 Dec. 2008 Page(s):277 - 284 Digital Object Identifier 10.1109/eScience.2008.59
28. Pallickara, S.; Ekanayake, J.; Fox, G. (2008) An Overview of the Granules Runtime for Cloud Computing. IEEE Fourth International Conference on eScience '08, 7-12 Dec. 2008 Page(s): 412 - 413 Digital Object Identifier 10.1109/eScience.2008.101.
29. Nadine Alameh: Chaining Geographic Information Web Services. IEEE Internet Computing 7(5): 22-29 (2003)
30. Nelson, J.M., Bennett, J.P., and Wiele, S.M., 2003, Flow and Sediment Transport Modeling, Chapter 18, p.539-576. In: Tools in Geomorphology, eds. M. Kondolph and H. Piegay, Wiley and Sons, Chichester, 688 pp.
31. CGNS: Legensky, S.M., Edwards, D.E., Bush, R.H., Poirier, D.M.A., Rumsey, C.L., Cosner, R.R., and Towne, C.E. (2002), CFD General Notation System
(CGNS)—Status and future directions: American Institute of Aeronautics and Astronautics , 2002-0752.
32. Pallickara, S.L.; Pierce, M. (2008) SWARM: Scheduling Large-Scale Jobs over the Loosely-Coupled HPC Clusters. IEEE Fourth International Conference on eScience '08. 7-12 Dec. 2008 Page(s):285 - 292 Digital Object Identifier 10.1109/eScience.2008.64.
33. Lowe, J. M., et al (2009) Gateway Hosting at Indiana University. Online Proceedings of TeraGrid 2009 June 22-25, Arlington, VA. Available from http://archive.teragrid.org/tg09/files/tg09_submission_47.pdf
34. Paden, J., et al (2010), Ice-Sheet Bed 3-D Tomography, Journal of Glaciology, Vol. 56, No. 195.
35. Allen, C., and J. Paden (2007), Synthetic-Aperture Radar Images Polar Ice-Sheet Bed, SPIE Newsroom [DOI: 10.1117/2.1200706.0780].
36. Jaliya Ekanayake, Hui Li, Bingjing Zhang, Thilina Gunarathne, Seung-Hee Bae, Judy Qiu, Geoffrey Fox Twister: A Runtime for Iterative MapReduce Proceedings of the First International Workshop on MapReduce and its Applications of ACM HPDC 2010 conference, Chicago, Illinois, June 20-25, 2010.
37. Judy Qiu, Thilina Gunarathne, Jaliya Ekanayake, Jong Youl Choi, Seung-Hee Bae, Hui Li, Bingjing Zhang, Yang Ryan, Saliya Ekanayake, Tak-Lon Wu, Scott Beason, Adam Hughes, Geoffrey Fox Hybrid Cloud and Cluster Computing Paradigms for Life Science Applications Technical Report April 17 2010 submitted to the 11th Annual Bioinformatics Open Source Conference BOSC 2010
Figure Legends
Figure 2 Flood Grid Service Stack and Workflow. Each component (gray box) is a network accessible service with well-defined inputs and outputs expressed using the Web
Service Description Language.Figure 2 Flood Grid User Interface Layout and Screenshot (courtesy of Neil
Devadasan, IUPUI Polis Center).Figure 3 Polar Grid's Filter Service architecture.
Figure 4 Trace SAR image along the ground track. The user interface is courtesy of Jeff Wood, Elizabeth City State University.
Figure 5 FloodGrid Imaging Service performance on a small Apache-Hadoop cluster.
Table LegendsTable 2 Mapping Flood Grid infrastructure requirements to Cloud Computing.
Table 2 Testing dataset and filtersTable 3 Polar Grid gateway infrastructure mapped to Cloud infratructure.