Embed Size (px)
Citation preview
48 AUSTRALIAN AND NEW ZEALAND JOURNAL OF PUBLIC HEALTH 2012 vol. 36 no. 1© 2012 The Authors. ANZJPH © 2012 Public Health Association of Australia
There is considerable evidence that
alcohol consumption makes a
significant contribution to the global
burden of disease and to economic and social
costs. It is estimated that 3-8% of all global
deaths and 4-6% of global disability-adjusted
life-years are attributable to alcohol.1 For the
consumer, alcohol consumption poses an
increased risk of serious short-term harms
such as death and injury; in the longer-term
excessive alcohol consumption is associated
with an increased risk of more than 60 types
of diseases and conditions, including diabetes,
gastro-intestinal conditions, heart and liver
disease, a range of cancers, and mental and
fetal disorders.2 For broader society, excessive
alcohol consumption contributes to a variety
of harms such as crime, antisocial behaviour
and victimisation as well as unemployment,
absenteeism and relationship breakdowns.3-5
In New Zealand (NZ), the adverse effects
of excessive alcohol consumption place
a considerable burden on the health care
system and society. There are an estimated
1,000 deaths per year that are alcohol-related,
with more than half due to injuries from road
trauma, accidents and self-inflicted harm.6
A high number of deaths are also evident in
young people and Māori; almost 15% of all
deaths in young people and 8% of all deaths
among Māori are attributed to alcohol.6
Between 2002 and 2006 nationally there were
5,413 alcohol-related hospital admissions of
young people aged 15-24 years, with 35% of
these admissions being for alcohol-related
injuries.7 As in many other countries, alcohol
is recognised in NZ as a contributor to a range
of societal harms such as crime and antisocial
behaviour. It is estimated that almost one-
third of all recorded crime in NZ involved an
offender who had consumed alcohol prior to
offending.8
A large number of studies over the past 20
years have examined the relationship between
area-level crime and access to alcohol outlets.
Researchers have typically applied cross-
sectional study designs and found positive and
statistically significant relationships between
crime rates and alcohol availability.9-16
Other studies using longitudinal data and
employing time-series designs have found
positive associations.17-22 In most of these
studies, alcohol outlet density (the number
of alcohol outlets per square kilometre (km2),
square metre (m2) or per population) is used
as a surrogate for alcohol availability. Several
studies have measured alcohol access as the
number of alcohol outlets within a certain
radius of a study respondent’s home;23,24 others
have used the number of alcohol outlets per
roadway mile.12,25 Distance-based measures
have also been employed by using the closest
distance from a respondent’s home to an
alcohol outlet as their access measure.23 In
one study using a multilevel analysis, both
individual distance to the closest alcohol
outlet and the aggregated mean distance of
respondents to outlets was used as the measure
of alcohol availability.26 Individual distance to
the closest alcohol outlet was found to be
unrelated with alcohol consumption, but the
higher the mean distance to the closest alcohol
outlet, the lower the mean level of alcohol
consumption.26 Studies measuring alcohol
Abstract
Objective: To examine the association
between geographic access to alcohol
outlets and serious violent crime in New
Zealand.
Methods: A national study of alcohol outlet
access and serious violent crime used a
cross-sectional ecological analysis. Serious
violence offences recorded between
2005 and 2007 were aggregated for 286
police station areas. Using Geographical
Information Systems (GIS), 9,320 licensed
premises were geocoded and road travel
distances to the closest alcohol outlet
type/category were calculated for each
area. Negative binomial regression models
measured the association between the
distance to the closest alcohol outlet and
the number of serious violent offences in
each police station area, controlling for
area-level measures of social deprivation,
Māori population, young males 15-29 years
and population density.
Results: There were significant negative
associations between distance (access)
to licensed outlets and the incidence of
serious violent offences with greater levels
of violent offending recorded in areas with
close access to any licensed premises
compared to those areas with least access
(IRR 1.5, 95% CI 1.10-2.03); with on-
licensed premises (IRR 1.6, 95% CI 1.16-
2.08); and off-licensed premises (IRR 1.4,
95% CI 1.05-1.93).
Conclusion: Having greater geographic
access to alcohol outlets was associated
with increased levels of serious violent
offending across study areas.
Implications: Alcohol availability and
access promoted under the current
liberalised licensing regime are important
contextual determinants of alcohol-related
harm within New Zealand communities.
Key words: alcohol availability, crime,
violence, Geographical Information
Systems, New Zealand
Aust NZ J Public Health. 2012; 36:48-54
doi: 10.1111/j.1753-6405.2012.00827.x
Submitted: May 2011 Revision requested: October 2011 Accepted: December 2011Correspondence to: Peter Day, GeoHealth Laboratory, Department of Geography, University of Canterbury, Private Bag 4800, Christchurch 8140, New Zealand; e-mail: [email protected]
Close proximity to alcohol outlets is associated with
increased serious violent crime in New Zealand
Peter Day, Gregory Breetzke, Simon Kingham, Malcolm CampbellGeoHealth Laboratory, Department of Geography, University of Canterbury, New Zealand
Alcohol Article
2012 vol. 36 no. 1 AUSTRALIAN AND NEW ZEALAND JOURNAL OF PUBLIC HEALTH 49© 2012 The Authors. ANZJPH © 2012 Public Health Association of Australia
outlet density have also stratified alcohol outlets by licence type
(i.e. on-site and off-site).12,15,17,24,27 For example, Gruenewald and
colleagues12 examined the influence of alcohol consumption at bars,
restaurants and at the homes of drinkers and their friends on drinking
and driving rates; while Treno and colleagues examined how both
on-premise alcohol establishments such as bars and restaurants
and off-premise establishments such as liquor and grocery stores
affected individuals’ self-reported injuries.24 Other work has
examined whether higher alcohol outlet densities influence health
outcomes such as suicide rates,28 sexually transmitted diseases,25
motor vehicle accidents20 and pedestrian injury collisions.29 Almost
without exception, the increased availability of alcohol using various
measures of alcohol outlet density is associated with an increase
in alcohol-related harm such as crime or adverse health outcomes.
A number of studies have emerged from NZ investigating the
relationship between the density of alcohol outlets, and alcohol
consumption and related harms. One study examined the relationship
between physical, socio-economic and social environments and
alcohol consumption patterns of drinkers aged 12-17 years.30 Using
multilevel modelling, they found alcohol outlet density in Auckland
to be associated with greater amounts of alcohol consumption
among teenage drinkers, as was neighbourhood deprivation. A
cross-sectional study found positive associations between alcohol
outlet density and individual drinking and related problems across
six university campuses throughout NZ, and these associations
remained after they controlled for various demographic variables
and pre-university drinking.31 One recent study found statistically
significant associations between the density of off-licences, bars and
clubs and the prevalence of binge drinking.32 After controlling for
demographic and socio-economic variables, the association between
binge drinking and off-licences remained. The authors reported “a
4% increase in binge drinking associated with each extra off-licence
within 1 km of home”.32 Other studies relating access to alcohol
outlets and neighbourhood deprivation have found greater access
to alcohol outlets in more socially deprived neighbourhoods.33,34
Studies examining the relationship between alcohol outlet density
and injury and criminal offending in NZ are less forthcoming,
with only two previous ecological studies known. One investigated
the association between single-vehicle night-time motor vehicle
accidents and alcohol outlet density in Auckland.35 It found positive
and significant associations between restaurant and club density
and vehicular accidents in certain District Health Boards in the
city. The other study found that off-licence alcohol outlet density
was significantly associated with higher levels of anti-social
behaviour, drug and alcohol offences, family violence, and motor
vehicle accidents in Manukau City, while on-licence densities of
certain types of outlets such as clubs and bars were also associated
with a number of criminal offences and motor vehicle accidents.36
Other anecdotal evidence suggests an association between alcohol
outlet density and alcohol-related offending in Queenstown and
Tauranga.8,37 Such has been the concern in NZ about the impact
of excessive alcohol consumption on individuals and society as a
whole that, in 2009, the National Government mandated the New
Zealand Law Commission (an independent crown entity) to review
the country’s liquor laws. Among the Commission’s focus areas
was an examination of the adequacy of the current criteria used
for granting a liquor licence as well as the impact of the density of
alcohol outlets on alcohol-related harms. Relying on predominantly
international evidence, the Commission found that geographical
access to alcohol outlets could have an impact on levels of alcohol-
related harm in NZ, although it recommended that further research
be undertaken to tease out the exact nature of this relationship.37
In this national level study, we begin to address this gap in NZ
literature by examining the association between geographic access
to alcohol outlets and serious violent offending. We use a novel
measure for access to alcohol outlets – median road travel distances
to closest alcohol outlet − as a measure of alcohol availability as we
believe this measure accurately represents both access to alcohol
outlets and alcohol outlet density. Recently, researchers have
proposed that the effect of alcohol outlet densities can be separated
conceptually into a proximity effect (how easily one can access
alcohol) and an amenity effect (how outlets influence the quality
and characteristics of surrounds within the local community).38 In
terms of the former, there is a concept that increasing the alcohol
outlet density makes alcohol more accessible (each new store makes
someone closer to an alcohol outlet).38 While this may be true, the
real effect on the overall access to alcohol in that area is likely to be
negligible, especially if the new alcohol outlet is near other outlets;
which is often the case (i.e. spatial clustering of outlets). The use of
a geographic measure to measure access to alcohol outlets is more
suitable for this purpose since the road travel distance from each unit
area to the new alcohol outlet will be calculated and incorporated
into the new measure.
In the study we also examine the association between access to
alcohol outlets by licence type and category and levels of violent
offending. In particular, we examine whether areas with better
geographic access to alcohol outlets exhibit higher rates of violent
offending compared to areas with poorer access, after controlling
for important area-level influences on violent crime such as social
deprivation.
While national policing authorities perennially identify the
availability of alcohol as a contributor towards higher crime rates
and alcohol-related harm in our communities, this relationship
has rarely been empirically assessed in NZ, and certainly not at a
national level.
Methods We examined the association between distance to nearest alcohol
outlet, grouped by licence category/type, and serious violent
offences recorded between 2005 and 2007 for all 286 police
station areas across NZ. These areas ranged in size from 1 km2 to
12,199 km2 with a median of 566 km2. The relationship between
geographic access to alcohol outlets and area-level violent offending
was tested using negative binomial regression models. A number
of area-level socio-demographic predictors of violent crime were
Alcohol Alcohol availability and violent crime
50 AUSTRALIAN AND NEW ZEALAND JOURNAL OF PUBLIC HEALTH 2012 vol. 36 no. 1© 2012 The Authors. ANZJPH © 2012 Public Health Association of Australia
also controlled for in the models. These predictors have been shown
to be potential area-level predictors of crime in previous studies
in New Zealand and include social deprivation,39 the proportion
of Māori population,40 the proportion of young males 15-29 years
and population density.37
DataThe trading names and addresses of premises licensed (as at July
2006) to sell liquor across the 74 District Licensing Agencies of New
Zealand were provided by the Liquor Licensing Authority which
has statutory authority to collect licensing information. Licensed
premises with on, off, and club licence types and supermarket,
grocery store, bottle store, hotel, tavern, chartered club, and
restaurant licence categories were included in the analysis. Overall,
9,320 of these licensed premises (97% total: 96% on-licensed,
and 99% off-licensed) were successfully geocoded. Data on the
number of violent offences recorded in the calendar years 2005-
07 at police station area level (n=286) were provided by the New
Zealand Police (the data were not available at a smaller geographic
scale). Serious violent offences included homicide (completed and
attempted), robbery, grievous assault and serious assault. There
was an average of 23,119 serious violent offences (5.7 per 1,000
population) recorded over the study period.
The 286 police station areas comprised 41,393 census meshblocks
(the smallest geographic census unit with an average population
of 100 people). Census meshblocks were used for calculating
geographic access to alcohol outlets at the smallest scale available
to determine each police station area’s overall median geographic
distance (access) to a range of alcohol outlet types, and for
aggregating socio-demographic data to police station areas. Census
demographic data for 2006 were sourced from Statistics New
Zealand on the number of Māori aged 15 years and over, the number
of young males 15-29 years, total usual resident population, and
the New Zealand Index of Deprivation score (NZDep2006) which
comprises of nine weighted demographic measures of material
deprivation.41
AnalysisGeographic access using road travel distance to the closest alcohol
outlet for on, off, and for either licence type, and hotel, tavern and
club, supermarket, bottle store, convenience store, and restaurant
licence categories were calculated for each census meshblock
using a Geographic Information System (GIS). A meshblock
was represented by its population-weighted centroid, the centre
of population based on address points (rather than its geometric
centroid) and the travel distance (in metres) to the nearest alcohol
outlet along the road network was calculated using GIS road network
functionality. The median distance meshblock to the closest alcohol
outlet for each licensed premise type and category was calculated
from the meshblocks in each police station area and these median
distances were categorised into quartiles, with 1 being the closest
median distance through to 4 being the furthest distances. Similar
GIS methods have been used in previous New Zealand studies
measuring geographic access to health-related community resources
and the contextual effects on health of access to gambling venues.42,43
To control for important population-level influences (confounders)
on serious violent crime, the proportion of the total population who
were Māori (15+ years), young males (15-29 years), population
density (usual resident population per km2), and the NZ Deprivation
index (NZDep2006) scores were derived for each police station
area by aggregating meshblock level data. The Māori and young
male population measures for each area were then categorised
into quartiles, population density into tertiles, and NZDep2006
categorised into quintiles.
To account for over-dispersion in the crime data (i.e. greater
variance than expected) negative binomial regression models were
used to model the relationship between serious violent offending
and access to alcohol outlets. The analysis was grouped by outlet
type and category. We adjusted for the area-level confounders to
more clearly determine the relationship between serious violent
offending and alcohol outlet access. Because police station areas
can be contiguous, the crime data can be expected to exhibit
spatial autocorrelation, producing spatially correlated errors in
the normal negative binomial regression. However, calculations of
Moran’s I statistics indicated a lack of statistically significant spatial
autocorrelation, indicating that the inclusion of a spatially lagged
variable in the models was not warranted. The first stage baseline model measured the relationship between
serious violent crime and alcohol outlet access. The model at stage 2
controlled for area deprivation (NZDep2006), while stages 3, 4 and
5 controlled for the proportion of young males, the proportion of
Māori population (15+ years), and population density respectively.
The incidence rate ratios (IRRs) and 95% confidence intervals (CIs)
for serious violent offending were calculated for quartile measures
of alcohol outlet access for each type and category of licensed outlet
with the furthest distance quartile being the comparator with an
IRR of 1. The IRRs were obtained by exponentiating the regression
coefficients, i.e. exponentiating the relative change in the incidence
rate brought by a one-unit change in an independent variable holding
other independent variables constant. For the GIS analysis we used
the software package ArcGIS and for the statistical analysis we used
SPSS and STATA 10.
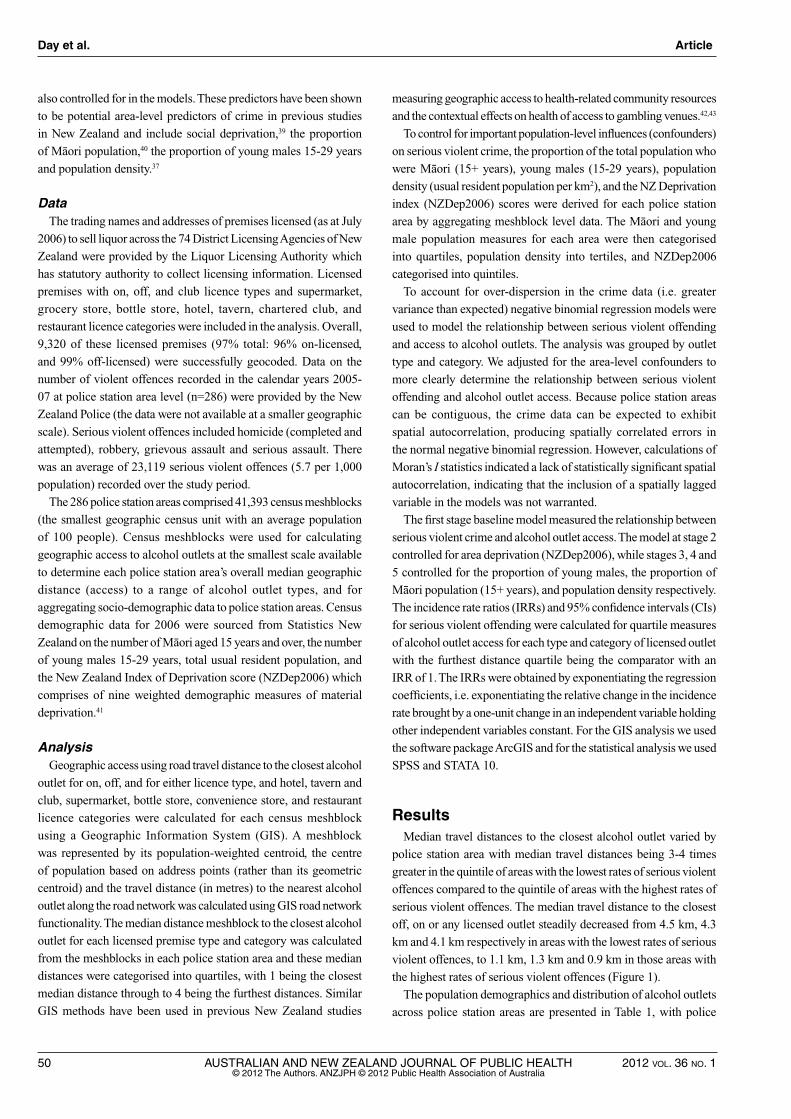
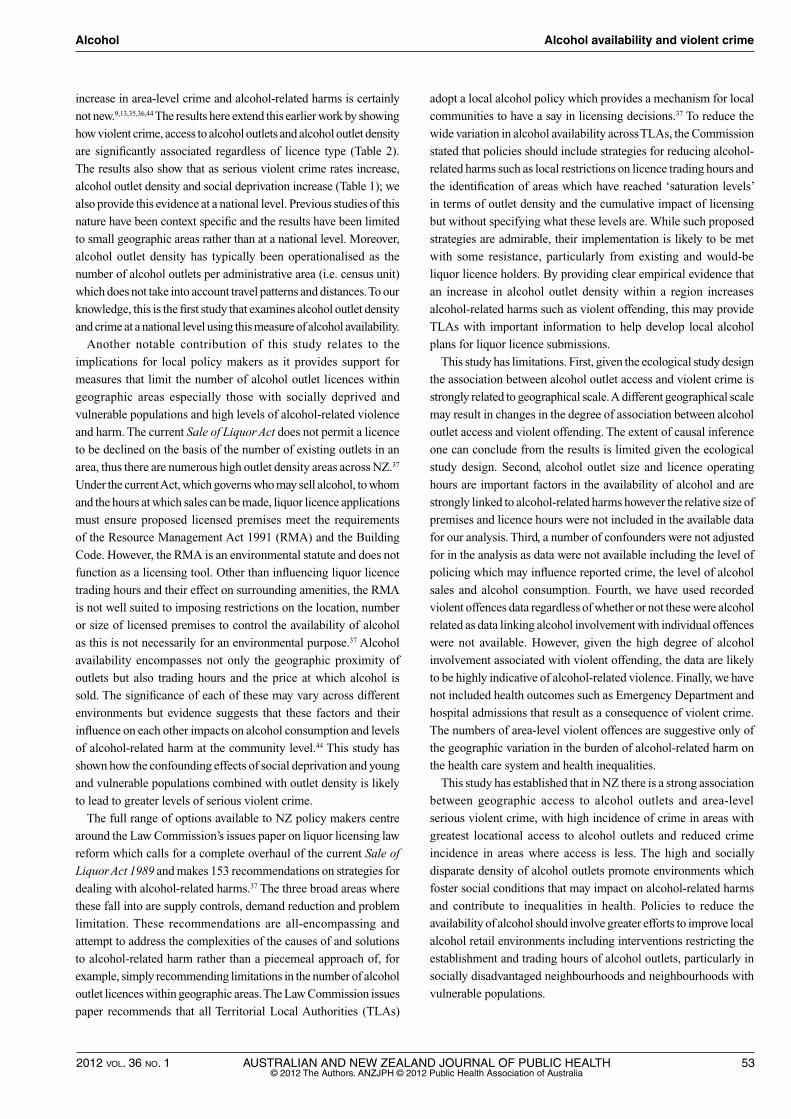
ResultsMedian travel distances to the closest alcohol outlet varied by
police station area with median travel distances being 3-4 times
greater in the quintile of areas with the lowest rates of serious violent
offences compared to the quintile of areas with the highest rates of
serious violent offences. The median travel distance to the closest
off, on or any licensed outlet steadily decreased from 4.5 km, 4.3
km and 4.1 km respectively in areas with the lowest rates of serious
violent offences, to 1.1 km, 1.3 km and 0.9 km in those areas with
the highest rates of serious violent offences (Figure 1).
The population demographics and distribution of alcohol outlets
across police station areas are presented in Table 1, with police
Day et al. Article
2012 vol. 36 no. 1 AUSTRALIAN AND NEW ZEALAND JOURNAL OF PUBLIC HEALTH 51© 2012 The Authors. ANZJPH © 2012 Public Health Association of Australia
station areas grouped into quintiles based on rates of serious
violent offences. Those areas in the highest quintile had the highest
proportions of Māori population (15+ years), percentage of young
males, and greatest population density, and were predominantly
urban areas (75.4%) compared to other police station areas. Police
station area rates of serious violent offences were also strongly
patterned with quintiles of area level social deprivation. The quintile
of areas having the greatest rates of violent offences also had the
highest level of deprivation with the opposite being true for those
areas with the lowest violent offence rates. The number of alcohol
outlets located in police station areas consistently increased with
increasing quintiles of serious violent offence rates. This was evident
for all types and categories of outlets, with 2.2-5.5 times more
outlets in the quintile of areas with the highest violent offence rates
compared to the quintile of areas with the lowest rates (Table 1).
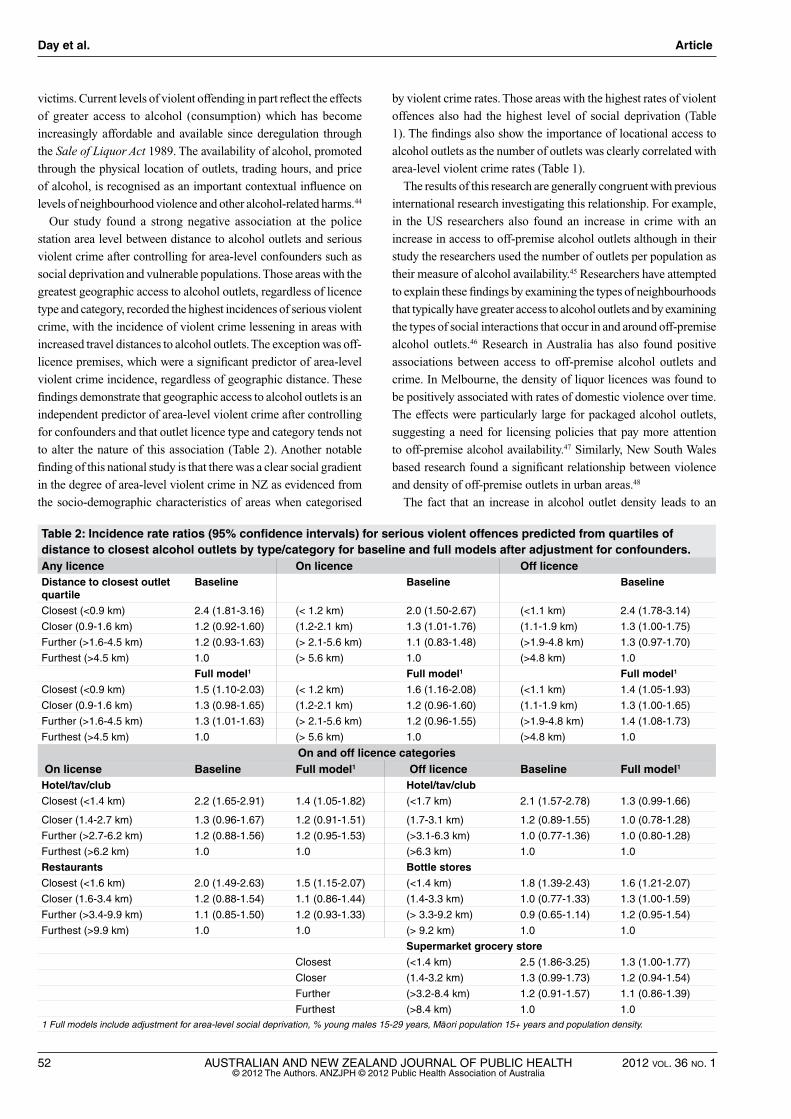
Table 2 presents the results of our investigation into the
relationship between access to alcohol outlets and serious violent
offending. The IRRs and 95% CIs for serious violent offending
predicted from quartiles of distances to the closest alcohol outlet
and adjusted for confounders are shown for each outlet type/
category. The results from the full models including the IRRs and
95% CIs of the confounder variables are not shown due to space
constraints. We found strong evidence of a negative relationship
between distance to closest outlets and serious violent offending
after controlling for area-level confounders. The IRRs in the closest
distance quartile were consistently significantly greater than 1 and
gradually decreased to non-significance with quartiles of increasing
distance. The exception here was off-licence premises which
consistently had significant IRRs over 1 for all distance quartiles.
These findings suggest that geographic access to alcohol outlets is
a significant predictor of serious violent offending and that there is
a negative gradient in the relationship between distance (access) to
alcohol outlets and levels of serious violence.
DiscussionAlcohol is a major contributor to crime, anti-social behaviour and
victimisation in NZ and is responsible for a range of social problems
directly affecting the health and well-being of both offenders and
Table 1: Population demographics and alcohol outlets for Police Station areas (n=286) stratified by quintiles of serious violence offence rates per 1000 population 2005-07.
Serious violence offence rates per 1000 population quintile Category 1
(0- 2.3)
2
(2.4- 3.6)
3
(3.7- 4.8)
4
(4.9- 6.9)
5
(7.0- 31.6)
Total
Population 2006Usual resident (n) 526,125 612,612 760,842 930,489 1,197,459 4,027,527
% Maori 7.7 8.6 11.3 15.5 21.6 14.4
% young males 9.2 9.2 9.5 9.1 10.8 9.7
Population density per km2 7 13 16 17 30 15
% Urban police station areasa 36.2 49.1 66.7 73.7 75.4
NZDEP quintile score for police station areasb 1 2 3 4 5
Alcohol outlets (n) Total 1,053 1,238 1,528 1,897 3,604 9,320
On-licencesc 637 755 948 1,228 2,615 6,183
Restaurants 300 415 540 618 1,333 3,206
Hotel/Tavern/Club 337 340 408 610 1,282 2,977
Off-licences 416 483 580 669 989 3,137
Supermarkets 138 151 188 221 341 1,039
Bottle Stores 93 158 187 199 364 1,001
Hotel/Tavern/Club 185 174 205 249 284 1,097
a Based on Statistics New Zealand urban and rural area classification where 50% or more of the population were living in urban classified areas.b Composite NZDep2006 estimate using meshblock level data (1 low; 5 high deprivation)c Includes Club licence category
Figure 1: Median distance to closest alcohol outlet by license type for Police station areas by quintiles of serious violence offence rates per 1,000 population.
Alcohol Alcohol availability and violent crime
O�-licence
On-licence
All outlets
Police station area serious violence o�ence rate quintile(Low) (High)
1 2 3 4 5
5000
4500
4000
3500
3000
2500
2000
1500
1000
500
0
Dis
tanc
e to
clo
sest
alc
ohol
out
let (
m)
O�-licence
On-licence
All outlets
Police station area serious violence o�ence rate quintile(Low) (High)
1 2 3 4 5
5000
4500
4000
3500
3000
2500
2000
1500
1000
500
0
Dis
tanc
e to
clo
sest
alc
ohol
out
let (
m)
52 AUSTRALIAN AND NEW ZEALAND JOURNAL OF PUBLIC HEALTH 2012 vol. 36 no. 1© 2012 The Authors. ANZJPH © 2012 Public Health Association of Australia
victims. Current levels of violent offending in part reflect the effects
of greater access to alcohol (consumption) which has become
increasingly affordable and available since deregulation through
the Sale of Liquor Act 1989. The availability of alcohol, promoted
through the physical location of outlets, trading hours, and price
of alcohol, is recognised as an important contextual influence on
levels of neighbourhood violence and other alcohol-related harms.44
Our study found a strong negative association at the police
station area level between distance to alcohol outlets and serious
violent crime after controlling for area-level confounders such as
social deprivation and vulnerable populations. Those areas with the
greatest geographic access to alcohol outlets, regardless of licence
type and category, recorded the highest incidences of serious violent
crime, with the incidence of violent crime lessening in areas with
increased travel distances to alcohol outlets. The exception was off-
licence premises, which were a significant predictor of area-level
violent crime incidence, regardless of geographic distance. These
findings demonstrate that geographic access to alcohol outlets is an
independent predictor of area-level violent crime after controlling
for confounders and that outlet licence type and category tends not
to alter the nature of this association (Table 2). Another notable
finding of this national study is that there was a clear social gradient
in the degree of area-level violent crime in NZ as evidenced from
the socio-demographic characteristics of areas when categorised
by violent crime rates. Those areas with the highest rates of violent
offences also had the highest level of social deprivation (Table
1). The findings also show the importance of locational access to
alcohol outlets as the number of outlets was clearly correlated with
area-level violent crime rates (Table 1).
The results of this research are generally congruent with previous
international research investigating this relationship. For example,
in the US researchers also found an increase in crime with an
increase in access to off-premise alcohol outlets although in their
study the researchers used the number of outlets per population as
their measure of alcohol availability.45 Researchers have attempted
to explain these findings by examining the types of neighbourhoods
that typically have greater access to alcohol outlets and by examining
the types of social interactions that occur in and around off-premise
alcohol outlets.46 Research in Australia has also found positive
associations between access to off-premise alcohol outlets and
crime. In Melbourne, the density of liquor licences was found to
be positively associated with rates of domestic violence over time.
The effects were particularly large for packaged alcohol outlets,
suggesting a need for licensing policies that pay more attention
to off-premise alcohol availability.47 Similarly, New South Wales
based research found a significant relationship between violence
and density of off-premise outlets in urban areas.48
The fact that an increase in alcohol outlet density leads to an
Day et al. Article
Table 2: Incidence rate ratios (95% confidence intervals) for serious violent offences predicted from quartiles of distance to closest alcohol outlets by type/category for baseline and full models after adjustment for confounders. Any licence On licence Off licenceDistance to closest outlet quartile
Baseline Baseline Baseline
Closest (<0.9 km) 2.4 (1.81-3.16) (< 1.2 km) 2.0 (1.50-2.67) (<1.1 km) 2.4 (1.78-3.14)
Closer (0.9-1.6 km) 1.2 (0.92-1.60) (1.2-2.1 km) 1.3 (1.01-1.76) (1.1-1.9 km) 1.3 (1.00-1.75)
Further (>1.6-4.5 km) 1.2 (0.93-1.63) (> 2.1-5.6 km) 1.1 (0.83-1.48) (>1.9-4.8 km) 1.3 (0.97-1.70)
Furthest (>4.5 km) 1.0 (> 5.6 km) 1.0 (>4.8 km) 1.0
Full model1 Full model1 Full model1
Closest (<0.9 km) 1.5 (1.10-2.03) (< 1.2 km) 1.6 (1.16-2.08) (<1.1 km) 1.4 (1.05-1.93)
Closer (0.9-1.6 km) 1.3 (0.98-1.65) (1.2-2.1 km) 1.2 (0.96-1.60) (1.1-1.9 km) 1.3 (1.00-1.65)
Further (>1.6-4.5 km) 1.3 (1.01-1.63) (> 2.1-5.6 km) 1.2 (0.96-1.55) (>1.9-4.8 km) 1.4 (1.08-1.73)
Furthest (>4.5 km) 1.0 (> 5.6 km) 1.0 (>4.8 km) 1.0
On and off licence categories On license Baseline Full model1 Off licence Baseline Full model1
Hotel/tav/club Hotel/tav/clubClosest (<1.4 km) 2.2 (1.65-2.91) 1.4 (1.05-1.82) (<1.7 km) 2.1 (1.57-2.78) 1.3 (0.99-1.66)
Closer (1.4-2.7 km) 1.3 (0.96-1.67) 1.2 (0.91-1.51) (1.7-3.1 km) 1.2 (0.89-1.55) 1.0 (0.78-1.28)
Further (>2.7-6.2 km) 1.2 (0.88-1.56) 1.2 (0.95-1.53) (>3.1-6.3 km) 1.0 (0.77-1.36) 1.0 (0.80-1.28)
Furthest (>6.2 km) 1.0 1.0 (>6.3 km) 1.0 1.0
Restaurants Bottle storesClosest (<1.6 km) 2.0 (1.49-2.63) 1.5 (1.15-2.07) (<1.4 km) 1.8 (1.39-2.43) 1.6 (1.21-2.07)
Closer (1.6-3.4 km) 1.2 (0.88-1.54) 1.1 (0.86-1.44) (1.4-3.3 km) 1.0 (0.77-1.33) 1.3 (1.00-1.59)
Further (>3.4-9.9 km) 1.1 (0.85-1.50) 1.2 (0.93-1.33) (> 3.3-9.2 km) 0.9 (0.65-1.14) 1.2 (0.95-1.54)
Furthest (>9.9 km) 1.0 1.0 (> 9.2 km) 1.0 1.0
Supermarket grocery storeClosest (<1.4 km) 2.5 (1.86-3.25) 1.3 (1.00-1.77)
Closer (1.4-3.2 km) 1.3 (0.99-1.73) 1.2 (0.94-1.54)
Further (>3.2-8.4 km) 1.2 (0.91-1.57) 1.1 (0.86-1.39)
Furthest (>8.4 km) 1.0 1.01 Full models include adjustment for area-level social deprivation, % young males 15-29 years, Māori population 15+ years and population density.
2012 vol. 36 no. 1 AUSTRALIAN AND NEW ZEALAND JOURNAL OF PUBLIC HEALTH 53© 2012 The Authors. ANZJPH © 2012 Public Health Association of Australia
increase in area-level crime and alcohol-related harms is certainly
not new.9,13,35,36,44 The results here extend this earlier work by showing
how violent crime, access to alcohol outlets and alcohol outlet density
are significantly associated regardless of licence type (Table 2).
The results also show that as serious violent crime rates increase,
alcohol outlet density and social deprivation increase (Table 1); we
also provide this evidence at a national level. Previous studies of this
nature have been context specific and the results have been limited
to small geographic areas rather than at a national level. Moreover,
alcohol outlet density has typically been operationalised as the
number of alcohol outlets per administrative area (i.e. census unit)
which does not take into account travel patterns and distances. To our
knowledge, this is the first study that examines alcohol outlet density
and crime at a national level using this measure of alcohol availability.
Another notable contribution of this study relates to the
implications for local policy makers as it provides support for
measures that limit the number of alcohol outlet licences within
geographic areas especially those with socially deprived and
vulnerable populations and high levels of alcohol-related violence
and harm. The current Sale of Liquor Act does not permit a licence
to be declined on the basis of the number of existing outlets in an
area, thus there are numerous high outlet density areas across NZ.37
Under the current Act, which governs who may sell alcohol, to whom
and the hours at which sales can be made, liquor licence applications
must ensure proposed licensed premises meet the requirements
of the Resource Management Act 1991 (RMA) and the Building
Code. However, the RMA is an environmental statute and does not
function as a licensing tool. Other than influencing liquor licence
trading hours and their effect on surrounding amenities, the RMA
is not well suited to imposing restrictions on the location, number
or size of licensed premises to control the availability of alcohol
as this is not necessarily for an environmental purpose.37 Alcohol
availability encompasses not only the geographic proximity of
outlets but also trading hours and the price at which alcohol is
sold. The significance of each of these may vary across different
environments but evidence suggests that these factors and their
influence on each other impacts on alcohol consumption and levels
of alcohol-related harm at the community level.44 This study has
shown how the confounding effects of social deprivation and young
and vulnerable populations combined with outlet density is likely
to lead to greater levels of serious violent crime.
The full range of options available to NZ policy makers centre
around the Law Commission’s issues paper on liquor licensing law
reform which calls for a complete overhaul of the current Sale of
Liquor Act 1989 and makes 153 recommendations on strategies for
dealing with alcohol-related harms.37 The three broad areas where
these fall into are supply controls, demand reduction and problem
limitation. These recommendations are all-encompassing and
attempt to address the complexities of the causes of and solutions
to alcohol-related harm rather than a piecemeal approach of, for
example, simply recommending limitations in the number of alcohol
outlet licences within geographic areas. The Law Commission issues
paper recommends that all Territorial Local Authorities (TLAs)
adopt a local alcohol policy which provides a mechanism for local
communities to have a say in licensing decisions.37 To reduce the
wide variation in alcohol availability across TLAs, the Commission
stated that policies should include strategies for reducing alcohol-
related harms such as local restrictions on licence trading hours and
the identification of areas which have reached ‘saturation levels’
in terms of outlet density and the cumulative impact of licensing
but without specifying what these levels are. While such proposed
strategies are admirable, their implementation is likely to be met
with some resistance, particularly from existing and would-be
liquor licence holders. By providing clear empirical evidence that
an increase in alcohol outlet density within a region increases
alcohol-related harms such as violent offending, this may provide
TLAs with important information to help develop local alcohol
plans for liquor licence submissions.
This study has limitations. First, given the ecological study design
the association between alcohol outlet access and violent crime is
strongly related to geographical scale. A different geographical scale
may result in changes in the degree of association between alcohol
outlet access and violent offending. The extent of causal inference
one can conclude from the results is limited given the ecological
study design. Second, alcohol outlet size and licence operating
hours are important factors in the availability of alcohol and are
strongly linked to alcohol-related harms however the relative size of
premises and licence hours were not included in the available data
for our analysis. Third, a number of confounders were not adjusted
for in the analysis as data were not available including the level of
policing which may influence reported crime, the level of alcohol
sales and alcohol consumption. Fourth, we have used recorded
violent offences data regardless of whether or not these were alcohol
related as data linking alcohol involvement with individual offences
were not available. However, given the high degree of alcohol
involvement associated with violent offending, the data are likely
to be highly indicative of alcohol-related violence. Finally, we have
not included health outcomes such as Emergency Department and
hospital admissions that result as a consequence of violent crime.
The numbers of area-level violent offences are suggestive only of
the geographic variation in the burden of alcohol-related harm on
the health care system and health inequalities.
This study has established that in NZ there is a strong association
between geographic access to alcohol outlets and area-level
serious violent crime, with high incidence of crime in areas with
greatest locational access to alcohol outlets and reduced crime
incidence in areas where access is less. The high and socially
disparate density of alcohol outlets promote environments which
foster social conditions that may impact on alcohol-related harms
and contribute to inequalities in health. Policies to reduce the
availability of alcohol should involve greater efforts to improve local
alcohol retail environments including interventions restricting the
establishment and trading hours of alcohol outlets, particularly in
socially disadvantaged neighbourhoods and neighbourhoods with
vulnerable populations.
Alcohol Alcohol availability and violent crime
54 AUSTRALIAN AND NEW ZEALAND JOURNAL OF PUBLIC HEALTH 2012 vol. 36 no. 1© 2012 The Authors. ANZJPH © 2012 Public Health Association of Australia
AcknowledgementsWe are grateful to Bruce Holmes with the Liquor Licensing
Authority for the alcohol licence data and Gavin Knight and Obert
Cinco from the Statistics Section, New Zealand Police for the
provision of crime data. Peter Day is funded through the GeoHealth
Laboratory, a collaboration between the University of Canterbury
and the New Zealand Ministry of Health.
References1. Rehm J, Mathers C, Popova S, Thavorncharoensap M, Teerawattananon Y,
Patra J. Global burden of disease and injury and economic cost attributable to alcohol use and alcohol-use disorders. Lancet. 2009;373(9682):2223-33.
2. World Health Organization. Expert Committee on Problems Related to Alcohol Consumption. Second Report. WHO Technical Report Series No.: 944 [Internet]. Geneva (CHE): WHO; 2007 [cited 2010 Dec]. Available from: http://www.who.int/substance_abuse/expert_committee_alcohol_trs944.pdf
3. Dale C, Livingstone M. The burden of alcohol drinking on co-workers in the Australian workplace. Med J Aust. 2010;193(3):138-40.
4. Karvonen S, Rimpela A. Urban small area variation in adolescent’s health behavior. Soc Sci Med. 1997;45(7):1089-98.
5. Pridemore W. Vodka and violence: alcohol consumption and homicide rates in Russia. Public Health Matters. 2002;92(12):1921-30.
6. Connor J, Broad J, Jackson R, Vander Hoorn S, Rehm J. The Burden of Death, Disease and Disability due to Alcohol in New Zealand. Wellington (NZ): Alcohol Liquor Advisory Council; 2005.
7. Craig E, Jackson C, Han D, NZCYES Committee. Monitoring the Health of New Zealand Children and Young People: Literature Review and Framework Development. Auckland (NZ): Paediatric Society of New Zealand, New Zealand Child and Youth Epidemiology Service; 2007.
8. Rebecca Stevenson. Police National Alcohol Assessment [Internet]. Wellington (NZ): New Zealand Police; 2009 April [cited 2010 Dec]. Available from: http://www.police.govt.nz/sites/default/files/Police-National-Alcohol-Assessment.pdf
9. Britt H, Carlin B, Toomey T. Neighborhood level spatial analysis of the relationship between alcohol outlet density and criminal violence. Environ Ecol Stat. 2005;12:411-26.
10. Freisthler B, Midanik L, Gruenewald P. Alcohol outlets and child physical abuse and neglect: applying routine activities theory to the study of child maltreatment. J Stud Alcohol Drugs. 2004;65(5):586-92.
11. Freisthler B, Needell B, Gruenewald P. Is the physical availability of alcohol and illicit drugs related to neighbourhood rates of child maltreatment? Child Abuse Negl. 2005;29(9):1049-60.
12. Gruenewald P, Johnson F, Treno A. Outlets, drinking and driving: a multilevel analysis of availability. J Stud Alcohol Drugs. 2002;63(4):460-8.
13. Gyimah-Brempong K. Alcohol availability and crime: evidence from census tract data. South Econ J. 2001;68(1):2-21.
14. Gyimah-Brempong K, Racine J. Alcohol availability and crime: a robust approach. Appl Econ. 2006;38(11):1293-307.
15. Lipton R, Gruenewald P. Spatial dynamics of violence and alcohol outlets. J Stud Alcohol Drugs. 2002;63(2):187-95.
16. Livingston M. Alcohol outlet density and assault: a spatial analysis. Addiction. 2008;103(4):619-28.
17. Gruenewald P, Remer L. Changes in outlet densities affect violence rates. Alcohol Clin Exp Res. 2006;30(7):1184-93.
18. Norström T. Outlet density and criminal violence in Norway1960-1995. J Stud Alcohol Drugs. 2000;61(6):907-11.
19. Scribner R, Theall K, Ghosh-Dastidar B, Mason K, Cohen D, Simonsen N. Determinants of social capital indicators at the neighborhood level: a longitudinal analysis of loss of off-sale alcohol outlets and voting. J Stud Alcohol Drugs. 2007;68(6):934-43.
20. Treno A, Johnson F, Remer L, Gruenewald P. The impact of outlet densities on alcohol-related crashes: a spatial panel approach. Accid Anal Prev. 2007;39(5):894-901.
21. Trolldal B. An investigation of the effect of privatization of retail sales of alcohol on consumption and traffic accidents in Alberta Canada. Addiction. 2005;100(5):662-71.
22. Yu Q, Scribner R, Carlin B, Theall K, Simonsen N, Ghosh-Dastidar B, et al. Multilevel spatio-temporal dual changepoint models for relating alcohol outlet destruction and changes in neighbourhood rates of assaultive violence. Geospat Health. 2008;2(2):161-72.
23. Pollack C, Cubbin C, Ahn D, Winkleby M. Neighbourhood deprivation and alcohol consumption: does the availability of alcohol play a role? Int J Epidemiol. 2005;34(4):772-80.
24. Treno A, Gruenewald P, Johnson F. Alcohol availability and injury: the role of local outlet densities. Alcohol Clin Exp Res. 2001;25(10):1467-71.
25. Cohen DA, Ghosh-Dastidar B, Scribner R, Miu A, Scott M, Robinson P, et al. Alcohol outlets, gonorrhoea, and the Los Angeles civil unrest: a longitudinal analysis. Soc Sci Med. 2006;62(12):3062-71.
26. Scribner R, Cohen D, Fisher W. Evidence of a structural effect for alcohol outlet density: a multilevel analysis. Alcohol Clin Exp Res. 2000;24(2):188-95.
27. Treno A, Grube J, Martin S. Alcohol availability as a predictor of youth drinking and driving: a hierarchical analysis of survey and archival data. Alcohol Clin Exp Res. 2003;27(5):835-40.
28. Escobedo L, Oritz M. The relationship between liquor outlet density and injury and violence in New Mexico. Accid Anal Prev. 2002;34(5):689-94.
29. LaScala E, Johnson F, Gruenewald P. Neighborhood characteristics of alcohol-related pedestrian injury collisions: a geostatistical analysis. Prev Sci. 2001;2(2):123-34.
30. Huckle T, Huakau J, Sweetsur P, Huisman O, Casswell S. Density of alcohol outlets and teenage drinking: living in an alcogenic environment is associated with higher consumption in a metropolitan setting. Addiction. 2008;103(10):1614-21.
31. Kypri K, Bell M, Hay G, Baxter J. Alcohol outlet density and university student drinking: a national study. Addiction. 2008;103(7):1131-8.
32. Connor J, Kypri K, Bell M. Alcohol outlet density and alcohol-related harm. Proceedings of the Australasian Epidemiological Association; August 31-September 1, 2009. The Australasian Epidemiologist. 2009;16(2):25.
33. Hay G, Whigham P, Kypri K, Langley J. Neighbourhood deprivation and access to alcohol outlets: a national study. Health Place. 2009;15(4):1086-93.
34. Pearce J, Day P, Witten K. Neighbourhood provision of food and alcohol retailing and social deprivation in Urban New Zealand. Urban Policy Res. 2008;26(2):213-27.
35. Mathieson A. Alcohol in Auckland − Reducing Associated Harm. Auckland (NZ): Auckland Regional Public Health Service; 2005.
36. Cochrane W, Cameron M, McNeill K, Melbourne P, Morrison S, Robertson N. A Spatial Econometric Analysis of Selected Impacts of Liquor Outlet Density in Manukau City. Hamilton (NZ): Population Studies Centre, University of Waikato; 2010.
37. New Zealand Law Commission. Alcohol in Our Lives: An Issues Paper on the Reform of New Zealand’s Liquor Laws (NZLC IP15, 2009) [Internet]. Wellington (NZ); Government of New Zealand; 2009 [cited 2010 Dec]. Available from: http://www.lawcom.govt.nz/
38. Livingston M, Chikritzhs T, Room R. Changing the density of alcohol outlets to reduce alcohol-related problems. Drug Alcohol Rev. 2007;26:557-66.
39. Maynard K, Coebergh B, Anstiss B, Bakker L, Huriwai T. Toward a new assessment: The identification of cultural factors which may pre-dispose Mäori to crime. Soc Policy J N Z. 1999;13:43-58.
40. Newbold G. Crime in New Zealand. Wellington (NZ): Dunmore Press; 2000.41. Salmond C, Crampton P, Atkinson J. N Z Dep2006 Index of Deprivation.
Wellington (NZ): Department of Public Health, University of Otago; 2007.42. Pearce J, Mason K, Hiscock R, Day P. A national study of neighbourhood access
to gambling opportunities and individual gambling behaviour. J Epidemiol Community Health. 2008;62(10):862-8.
43. Pearce J, Witten K, Bartie P. Neighbourhoods and health: a GIS approach to measuring community resource accessibility. J Epidemiol Community Health. 2006;60(5):389-95.
44. Popova S, Giesbrecht N, Bekmuradov D, Patra, J. Hours and days of sale and density of alcohol outlets: impacts on alcohol consumption and damage: a systematic review. Alcohol Alcohol. 2009;44:500-16.
45. Graham K. Isn’t it time we found out more about what the heck happens around American liquor stores? Addiction. 2006;101:619-20.
46. Freisthler B, Midanik L, Gruenewald PJ. (2004). Alcohol outlets and child physical abuse and neglect: Applying routine activities theory to the study of child maltreatment. J Stud Alcohol Drugs. 2004;65:586-92.
47. Livingston M. A longitudinal analysis of alcohol outlet density and domestic violence. Addiction. 2011;106:919-26.
48. Stevenson RJ, Lind B, Weatherburn D. The relationship between alcohol sales and assault in New South Wales, Australia. Addiction. 1999;94:397–410.
Day et al. Article