Embed Size (px)
Citation preview
Cloning and Characterization of a Functional Human�-Aminobutyric Acid (GABA) Transporter, Human GAT-2*
Received for publication, March 12, 2007, and in revised form, May 10, 2007 Published, JBC Papers in Press, May 14, 2007, DOI 10.1074/jbc.M702111200
Bolette Christiansen‡, Anne-Kristine Meinild§, Anders A. Jensen‡, and Hans Brauner-Osborne‡1
From the ‡Department of Medicinal Chemistry, Faculty of Pharmaceutical Sciences and §Department of Molecular Biology,Faculty of Sciences, University of Copenhagen, DK-2100 Copenhagen, Denmark
Plasmamembrane �-aminobutyric acid (GABA) transportersact to terminate GABA neurotransmission in the mammalianbrain. Intriguingly four distinct GABA transporters have beencloned from rat and mouse, whereas only three functionalhomologs of these transporters have been cloned from human.The aim of this study therefore was to search for this fourthmissing human transporter. Using a bioinformatics approach,we successfully identified and cloned the full-length cDNA of aso far uncharacterized human GABA transporter (GAT). Thepredicted protein displays high sequence similarity to ratGAT-2 and mouse GAT3, and in accordance with the nomen-clature for rat GABA transporters, we therefore refer to thetransporter as humanGAT-2.Weused electrophysiological andcell-based methods to demonstrate that this protein is a func-tional transporter of GABA. The transport was saturable anddependent on both Na� and Cl�. Pharmacologically the trans-porter is distinct from the other humanGABA transporters andsimilar to rat GAT-2 and mouse GAT3 with high sensitivitytowardGABA and �-alanine. Furthermore the GABA transportinhibitor (S)-SNAP-5114 displayed some inhibitory activity atthe transporter. Expression analysis by reverse transcription-PCR showed that GAT-2mRNA is present in human brain, kid-ney, lung, and testis. The finding of the human GAT-2 demon-strates for the first time that the four plasma membrane GABAtransporters identified in several mammalian species are allconserved in human. Furthermore the availability of humanGAT-2 enables the use of all human clones of the GABA trans-porters in drug development programs and functional charac-terization of novel inhibitors of GABA transport.
�-Aminobutyric acid (GABA)2 is the major inhibitory neu-rotransmitter in the mammalian central nervous system (1, 2).
In the GABAergic synapse, GABA is released from presynapticnerve terminals, and it exerts its physiological effects throughionotropic GABAA and GABAC receptors and metabotropicGABAB receptors (3, 4). The GABAergic neurotransmission isterminated by rapid uptake of the neurotransmitter from thesynaptic cleft into neurons and glial cells by specific high affin-ity GABA transporters (5–7). To date, four different plasmamembrane GABA transporter subtypes have been identified inthe central nervous system of several mammalian species(8–17). Unless otherwise specified, we will use the nomencla-ture introduced by Guastella et al. (8) and Borden et al. (11) forrat and humanGABA transporters and refer to the transportersas GABA transporter (GAT)-1, betaine/GABA transporter-1(BGT-1), GAT-2, and GAT-3. A different nomenclature, orig-inally suggested by Liu et al. (13), names the correspondinghomologous transporters in mouse GAT1–GAT4 (withouthyphen), respectively.TheGABA transporters belong to the family ofNa�/Cl�-de-
pendent transporters (SLC6 gene family) that also includestransporters for the neurotransmitters dopamine, serotonin,norepinephrine, and glycine (7, 18). The transport process ofthese transporters is electrogenic because Na� (and Cl�) istranslocated across the membrane together with the respectivesubstrates (7, 19). As an example, the co-transport of oneGABA, two Na�, and one Cl� has been reported for human (h)GAT-1 (20). The topologies of these membrane-bound pro-teins are composed of 12 transmembrane domains connectedby interchanging extracellular and intracellular loops and intra-cellular amino and carboxyl termini (8, 9, 21). Recently the crys-tal structure of a bacterial homolog of the transporters has beenresolved, and the structure has brought significant insight intothe structure and function of the Na�/Cl�-dependent trans-porters (22).Neurotransmitter transporters are drug targets for several
neurological and psychiatric disorders (19, 23). Diseases such asepilepsy, anxiety disorders, schizophrenia, drug addiction, andvarious pain states are related to the GABA system (24–26),and pharmacological inhibition of GABA transport constitutesan attractive approach to increase overall GABA neurotrans-mission (27, 28). So far, this concept has been exploited for thetreatment of epilepsy where the GAT-1-selective inhibitortiagabine is administered clinically as adjunctive therapy forpartial seizures (29, 30). Furthermore inhibition of GABA
* This work was supported by the Lundbeck Foundation, the Novo NordiskFoundation, the Carlsberg Foundation, and the Danish Medical ResearchCouncil. The costs of publication of this article were defrayed in part by thepayment of page charges. This article must therefore be hereby marked“advertisement” in accordance with 18 U.S.C. Section 1734 solely to indi-cate this fact.
1 To whom correspondence should be addressed: Dept. of Medicinal Chem-istry, Faculty of Pharmaceutical Sciences, University of Copenhagen, Uni-versitetsparken 2, DK-2100 Copenhagen, Denmark. Tel.: 45-3533-6518;Fax: 45-3533-6040; E-mail: [email protected].
2 The abbreviations used are: GABA, �-aminobutyric acid; BGT-1, betaine/GABA transporter-1; L-DABA, L-2,4-diamino-n-butyric acid; DAPA, DL-2,3-diaminopropionic acid; EF1502, N-[4,4-bis(3-methyl-2-thienyl)-3-bute-nyl]-3-hydroxy-4-(methylamino)-4,5,6,7-tetrahydrobenzo[d]isoxazol-3-ol; FMP, FLIPR membrane potential; GAT, GABA transporter; MTC,multiple tissue cDNA; NCBI, National Center for Biotechnology Informa-
tion; SLC6A13, solute carrier family 6 (neurotransmitter transporter, GABA),member 13; THPO, 4,5,6,7-tetrahydroisoxazolo(4,5-c)pyridin-3-ol; m,mouse; h, human; r, rat; MES, 4-morpholineethanesulfonic acid.
THE JOURNAL OF BIOLOGICAL CHEMISTRY VOL. 282, NO. 27, pp. 19331–19341, July 6, 2007© 2007 by The American Society for Biochemistry and Molecular Biology, Inc. Printed in the U.S.A.
JULY 6, 2007 • VOLUME 282 • NUMBER 27 JOURNAL OF BIOLOGICAL CHEMISTRY 19331
by guest on April 28, 2018
http://ww
w.jbc.org/
Dow
nloaded from

transport in general and tiagabine in particular has been sug-gested for the treatment of clinical conditions such as ischemia,anxiety, sleep disorders in the elderly, and neuropathic pain(31–34).GAT-1 andGAT-3 are abundantly expressed throughout the
rat, mouse, and human central nervous system and absent fromthe periphery (11–13, 28, 35–39), and thus these two subtypeshave attracted considerable attention as potential drug targets(30, 35, 40). Mouse, rat, and human BGT-1 is expressed in boththe brain and periphery (10, 14, 16, 17) and believed to beinvolved in osmoregulation (18) but has recently also been sug-gested to play a role in the control of epilepsy (41–43). Rat (r)GAT-2 and mouse (m) GAT3 is similarly found in the brain aswell as in the periphery where it is abundantly expressed inkidney and liver (11, 13, 36, 39, 44).In contrast to the four identified plasma membrane GABA
transporter subtypes in mouse and rat, only three have beencharacterized in human. These include hGAT-1, hBGT-1, andhGAT-3, whereas the human ortholog of mGAT3 and rGAT-2has remained enigmatic and typically is referred to as “notcloned” in the literature (35, 45). However, in 2001, the cDNAsupposedly encoding for the hGAT-2 was reported to havebeen cloned, although functional uptake of [3H]GABA inmam-malian cells transiently transfected with this cDNA could notbe demonstrated (46). Bioinformatics analysis of this putativehGAT-2 sequence revealed that it was likely to be an incom-plete cDNA sequence with several truncations. In the presentstudy, we cloned the full-length hGAT-2 and characterized thepharmacology of the transporter in several functional assays.
EXPERIMENTAL PROCEDURES
Materials—GlutaMAX-I Dulbecco’s modified Eagle’s me-dium, dialyzed fetal bovine serum, penicillin, streptomycin,Hanks’ balanced salt solution, and bovine serum albumin werepurchased from Invitrogen. All buffer reagents were obtainedfrom Sigma-Aldrich. [2,3-3H]GABA (specific radioactivity,27.6 Ci/mmol) and D-[2,3-3H]Asp (specific radioactivity, 40.0Ci/mmol) were purchased from GE Healthcare.
�-Alanine, taurine, L-2,4-diamino-n-butyric acid (L-DABA),quinidine,NNC-711, and (S)-SNAP-5114were purchased fromSigma-Aldrich. GABA was obtained from Fluka Chemie AG,Buchs SG, (Dubendorf, Switzerland), betaine was from B.A.S.Synteselaboratorium, nipecotic acid was from Aldrich, andDL-2,3-diaminopropionic acid (DAPA) was from TCI Europenv (Zwijndrecht, Belgium). The following compounds weresynthesized in house: 4,5,6,7-tetrahydroisoxazolo(4,5-c)pyri-din-3-ol (THPO) (47), guvacine (48), and N-[4,4-bis(3-methyl-2-thienyl)-3-butenyl]-3-hydroxy-4-(methylamino)-4,5,6,7-tet-rahydrobenzo[d]isoxazol-3-ol (EF1502) (49).Cloning of hGAT-2—The I.M.A.G.E. cDNA clone 4612245
was purchased, and subsequent sequencing revealed the pres-ence of the full-length nucleotide sequence encoding for theopen reading frame of hGAT-2. The cDNA of hGAT-2 wasamplified by PCR using the forward primer 5�-gggatggatagcag-ggtctc-3� and the reverse primer 5�-ctagcagtgagactctagctc-3�and subcloned into the mammalian pcDNA5 vector accordingto the protocol of the manufacturer (pcDNA5/FRT/V5-HisTOPO� TA Expression kit, Invitrogen). The sequence of the
cDNA and the absence of mutations were confirmed by auto-mated DNA sequencing.Bioinformatics Analysis of the Protein Sequence of hGAT-2—
An alignment of hGAT-2 with the previously reportedsequences of hGAT-2 (46), mGAT3 (13), and rGAT-2 (11) wasperformed using the ClustalW alignment program available atthe home page maintained by The European BioinformaticsInstitute. Transmembrane segments in the hGAT-2 proteinwere identified by the hidden Markov model for prediction oftransmembrane helices (50). The algorithm is publicly accessi-ble at the Center for Biological Sequence Analysis, TechnicalUniversity of Denmark through internet services. Furthermorea hydrophobicity analysis using the TMpred program was per-formed. This algorithm is based on the statistical analysis ofTMbase, a data base of naturally occurring transmembraneproteins (51) and is available at the home page maintained bySwiss EMBnet. The overall sequence identity of the predictedamino acid sequence of hGAT-2 to other related GABA trans-porters was examined by searching the protein data base at theNational Center for Biotechnology Information (NCBI) usingthe BLASTp algorithm.Expression Analysis—The expression pattern of hGAT-2
mRNA was examined by reverse transcription-PCR usinghuman multiple tissue cDNA (MTCTM) panels according tothe protocol of the manufacturer (Clontech). The cDNA wasamplified by PCR using the forward primer 5�-atggatagcagggt-ctcaggcacaaccagtaatgg-3� and the reverse primer 5�-attctcaga-ggtaccattcagggagccgttgg-3�. The primers are complementaryto exons 1 and 4, respectively, and PCR with the two primersresulted in a specific band of 533 nucleotides.PCR was performed using Taq polymerase as described by
the manufacturer (Promega, Madison, WI) and a PTC-100thermal cycler (MJ Research, Waltham, MA). The reactionswere heated to 95 °C for 2min and then cycled 35 times at 95 °Cfor 1 min, 65 °C for 30 s, and 72 °C for 1 min. All reactions werecarried out in parallel and were run on a 1% agarose gel con-taining SYBR SafeTM (Invitrogen). Amplification of a 983-basepair fragment from human glyceraldehyde-3-phosphate dehy-drogenase was used as a control.Expression of hGAT-2 in Xenopus laevis Oocytes—The
hGAT-2 and the mGAT3 cDNAs were subcloned by PCR intoan expression vector (pEXP-SML) containing 5�- and 3�-un-translated regions of the Xenopus �-globin gene and a poly(A)signal for optimal expression in oocytes using theGATEWAY�technology (Invitrogen). The cDNA was linearized down-streamof the poly(A) signal and in vitro transcribedwith theT7RNA polymerase using the T7-Message Machine� kit fromAmbion (Ambion, Inc., Austin, TX). 50 ng of cRNA wasinjected into defolliculated stage 5-6X. laevis oocytes, preparedas described in Meinild et al. (52). The oocytes were incubatedin Kulori medium (90 mM NaCl, 1 mM KCl, 1 mM CaCl2, 1 mMMgCl2, 5 mM HEPES, pH 7.4) at 19 °C for 3–5 days beforeexperiments were performed.Electrophysiology—The two-electrode voltage clampmethod
was used to control the membrane potential and monitor thewhole cell current in oocytes expressing hGAT-2. The record-ings were performed at room temperature with a Dagan Clam-pator (Dagan Corp., Minneapolis, MN) interfaced to a personal
The Human GAT-2
19332 JOURNAL OF BIOLOGICAL CHEMISTRY VOLUME 282 • NUMBER 27 • JULY 6, 2007
by guest on April 28, 2018
http://ww
w.jbc.org/
Dow
nloaded from

computer using a DigiData 1320 analog/digital converter andpCLAMP 9 (Axon Instruments at Molecular Devices, Sunny-vale, CA). For continuous current measurements, the mem-brane potential was held at�50mV, and the currents were lowpass-filtered at 1 Hz and sampled at 10 Hz. To obtain steady-state current/voltage relationships themembrane potential washeld at �50 mV and jumped to test potentials ranging from�50 to �150 mV in 20-mV increments for 200 ms. Currentswere low pass-filtered at 500 Hz and sampled at 2 kHz. In gen-eral, the experimental chamber was continuously perfused by aNaCl solution (100 mM NaCl, 2 mM KCl, 1 mM MgCl2, 1 mM
CaCl2, 10 mM HEPES, pH 7.4). In Na� substitution experi-ments, Na� was equimolarly replaced with choline ions, and inexperiments with low concentrations of Cl� (6 mM), NaMESwas used instead of NaCl. In experiments with lowCl� concen-trations, the reference electrode was connected to the experi-mental chamber via an agar bridge (3% agar in 3 M KCl).Cell Culture and Transfections—tsA201 cells (a transformed
human embryonic kidney 293 cell line) (53) were cultured inGlutaMAX-I Dulbecco’s modified Eagle’s medium supple-mented with 10% dialyzed fetal bovine serum, penicillin (100units/ml), and streptomycin (100 �g/ml) at 37 °C in a humidi-fied atmosphere of 95% air and 5% CO2. The constructs encod-ing the hGAT-2 and the human excitatory amino acid trans-porter hEAAT3 were transiently transfected into cells usingPolyFect according to the protocol of the manufacturer (Qia-gen, West Sussex, UK), and the functional assays were per-formed 36–48 h later.[3H]GABA and D-[3H]Asp Uptake Assays—tsA201 cells
transfected with hGAT-2-pcDNA5 or hEAAT3-pcDNA3 weresplit into poly-D-lysine-coated white 96-well plates (BD Bio-sciences). The next day, the medium was removed, and cellswere washed with 100 �l of assay buffer (Hanks’ balanced saltsolution supplemented with 20 mM HEPES, 1 mM CaCl2, and 1mM MgCl2, pH 7.4). Then 75 �l of assay buffer supplementedwith [3H]GABA or D-[3H]Asp and various concentrations ofthe test compounds was added to each well, and the plate wasincubated at 37 °C for 3 min. Then the cells were washed with3 � 100 �l of ice-cold assay buffer, and 150 �l ofMicroscintTM20 scintillation fluid (PerkinElmer Life Sciences)was added to eachwell. The plate was shaken for at least 1 h andcounted in a Packard TopCount microplate scintillationcounter.In the saturation experiments, a [3H]GABA concentration
up to 100 nM was used, and to measure transport at higherconcentrations the radioligands were diluted with the corre-sponding “cold” ligand (GABA). Nonspecific transport wasdetermined in the presence of 3 mMGABA. In the competitiontransport experiments, either 30 nM [3H]GABA (in the experi-ments with hGAT-2) or 30 nM D-[3H]Asp (in the experimentswith hEAAT3) was used as tracer concentration. The[3H]GABA competition curves were constructed based onmeasurements obtained typically for eight different concentra-tions of the test compounds. The following maximal concen-trations of the test compounds were applied: GABA, 3 mM;DAPA, 1 mM; �-alanine, 3 mM; (S)-SNAP-5114, 500 �M;EF1502, 250 �M; nipecotic acid, 10 mM; L-DABA, 3 mM; quini-
dine, 1mM; guvacine, 10mM;NNC-711, 1.6mM; THPO, 10mM;taurine, 10 mM; and betaine, 10 mM.The FLIPR� Membrane Potential (FMP) Assay—The test
compounds were characterized functionally in the FMP assay(Molecular Devices, Crawley, UK) essentially as described pre-viously (54). Briefly tsA201 cells transfected withhGAT-2-pcDNA5 were split into poly-D-lysine-coated blackclear bottom 96-well plates (BD Biosciences). The next day, theculture medium was removed, and the cells were washed with100 �l of assay buffer (same buffer as used in the [3H]GABAuptake assay). In the substrate experiments, 100 �l of assaybuffer supplemented with FMP assay dye was added to eachwell, and the plate was incubated at 37 °C for 30 min. The platewas assayed at 37 °C in a NOVOstarTM plate reader (BMGLabtechnologies, Offenburg, Germany) measuring emission at560 nm caused by excitation at 530 nm before and up to 1 minafter addition of 25 �l of substrate solution (the substrate wasdissolved in assay buffer). Inhibition experiments were per-formed similarly except that amixture of 50�l of FMPassay dyesolution (2� final concentration in assay buffer) and 50 �l ofinhibitor solution (2� final concentration in assay buffer) wasincubated at 37 °C for 30 min, and the plate was assayed byaddition of 25 �l of GABA solution (assay concentration ofGABA, 50 �M). The experiments were performed in triplicateat least three times for each test compound. The concentration-response curves for the substrates and the concentration-inhi-bition curves for the inhibitors were constructed based on themaximal responses obtained for the various concentrations ofthe respective compounds. For generation of concentration-response curves the following maximal concentrations of thetest compounds were applied: GABA, 3 mM; �-alanine, 3 mM;L-DABA, 1mM; nipecotic acid, 10 mM; guvacine, 3 mM; taurine,10 mM; betaine, 3 mM; and THPO, 3 mM.Data Analysis—All data were analyzed using Prism 4.0b
(GraphPad Software, San Diego, CA). For experiments with X.laevis oocytes, the transporter-specific substrate-induced cur-rent (Isubstrate) was obtained from the difference between thecurrents in NaCl � substrate. For steady-state kinetic analysis,the Isubstrate was measured at various membrane potentialsand external substrate concentrations, and at each voltagethe Isubstrate versus concentration of substrate relations werefitted to theMichaelis-Menten equation I� (Imax � [S])/([S]�K0.5) where [S] is the substrate concentration, Imax is the max-imal current for saturating [S], and the half-maximal concen-tration,K0.5, is the substrate concentration giving rise to 50% ofImax. TheK0.5 for GABA and �-alanine was obtained at 100mMexternal Na�, varying the GABA or �-alanine concentrations,andNa� activationwas obtained at a saturatingGABA concen-tration (100 �M) and varying external Na� concentrations.The saturation curves from the [3H]GABAuptake assaywere
fitted by nonlinear regression using the equation Y � Bmax �X/(Kd � X) where X is the concentration of the ligand, Y is thespecific binding, Bmax is the maximal binding, and the equilib-rium dissociation constant, Kd, is the concentration of ligandrequired to reach half-maximal binding. The inhibition curvesfrom the [3H]GABAandD-[3H]Asp uptake assayswere fitted bynonlinear regression using the equation Y � Bottom � (Top �Bottom)/(1 � 10 ((log Km � X) � Hill slope)), where X is the
The Human GAT-2
JULY 6, 2007 • VOLUME 282 • NUMBER 27 JOURNAL OF BIOLOGICAL CHEMISTRY 19333
by guest on April 28, 2018
http://ww
w.jbc.org/
Dow
nloaded from

logarithm of the concentration, Y isthe response, Top is the Y value atthe top plateau, Bottom is the Yvalue at the bottom plateau, log Kmis the X value when the response ishalfway between Bottom and Top,and the Hill slope describes thesteepness of the curve.The concentration-response curves
from the FMP assay were fittedusing the same equation as de-scribed above for the inhibitioncurves in the uptake assay. The Kivalue of THPO was determinedbased on the following equation:Ki� IC50/(1� [S]/Km) where IC50 isthe concentration of compoundthat produces 50% of the maximuminhibitory response, [S] is the con-centration of substrate (GABA)used for the inhibition experiment,and Km is the concentration of sub-strate required to reach half-maxi-mal activation. Determination ofKm forGABAwas always performedon the same day as the inhibitionexperiment.
RESULTS
Cloning of the hGAT-2—Initiallywe performed a multiple alignmentof the amino acid sequence of thepreviously cloned non-functionalhGAT-2 (GenBankTM accessionnumber U76343 (46)) with themouse and rat orthologs. This com-parison revealed that the previouslyreported hGAT-2 cDNA clone con-tained four truncations and afairly different carboxyl-terminalsequence compared with the mouseand rat sequences. Due to these dif-ferences we next performed atBLASTn search of the humangenome and expressed sequence tagdata bases at the NCBI websiteusing the mGAT3 amino acidsequence as query. Results fromboth of these data bases suggestedthat the truncations and deviatingcarboxyl-terminal sequence of thepreviously reported hGAT-2 cDNAclone was erroneous and that a full-length human ortholog does exist.Further searches of GenBank atNCBI revealed a full-length cDNAclone identified by the MammalianGene Collection Program Team
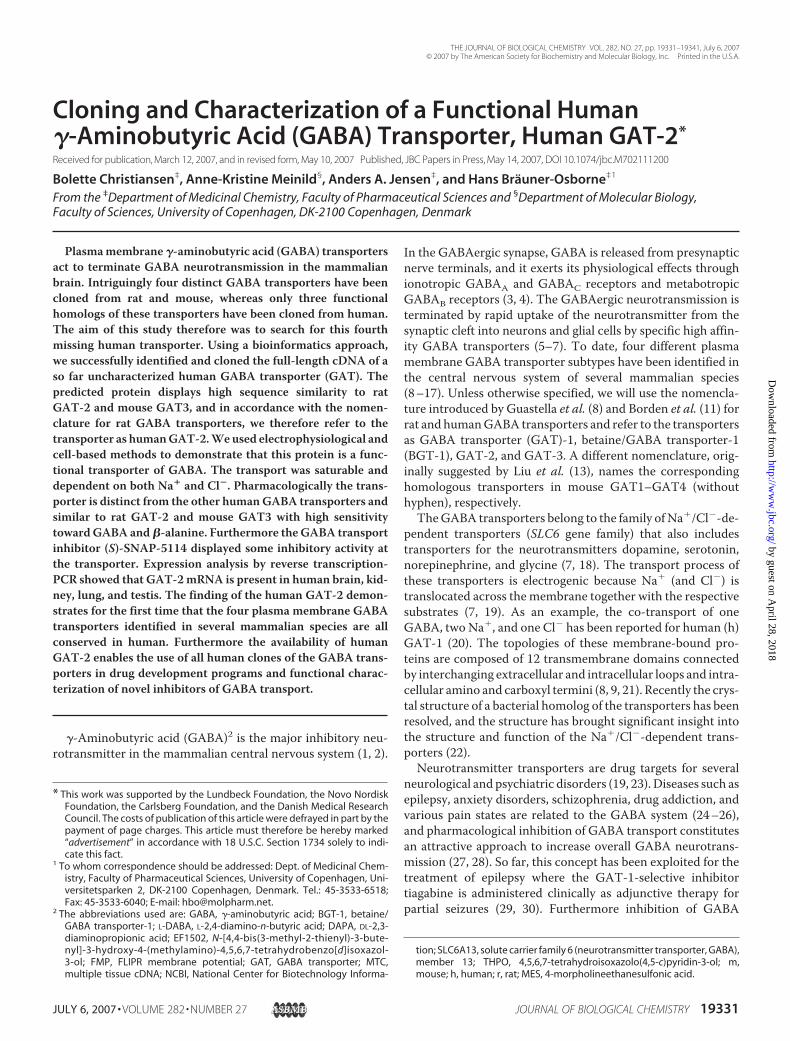
FIGURE 1. Deduced amino acid sequence of the hGAT-2. Shown are the hGAT-2 cloned and characterized inthis study (GenBank accession number NP_057699) and the previously reported amino acid sequence ofhGAT-2 (GenBank accession number U76343) (46). The sequences of mGAT3 (GenBank accession numberNP_653095) and rGAT-2 (GenBank accession number NP_598307) are shown for comparison. The alignmentfile was generated by use of the ClustalW alignment tool provided by the European Molecular Biology Labo-ratory. A star (*) indicates that the residues in the given column are identical in all sequences in the alignment;a colon (:) indicates a conserved substitution; a period (.) indicates a semiconserved substitution.
The Human GAT-2
19334 JOURNAL OF BIOLOGICAL CHEMISTRY VOLUME 282 • NUMBER 27 • JULY 6, 2007
by guest on April 28, 2018
http://ww
w.jbc.org/
Dow
nloaded from

(accession number BC022392 (55)) that could be obtained fromthe I.M.A.G.E. Consortium (56). We then used PCR to amplifya nucleotide sequence from the I.M.A.G.E. clone that is identi-cal to GenBank accession number BC022392. The cDNA has apredicted amino acid sequence containing an open readingframe of 602 amino acids, which is in good agreement with thelengths of the rat andmouse orthologs (11, 13). Alignment anal-ysis demonstrates that the sequence is different from the trun-cated hGAT-2 of 569 amino acids previously reported by Gonget al. (46) and that the amino acid sequence of the full-lengthhGAT-2, reported here, displays high similarity tomGAT3 andrGAT-2 including the carboxyl-terminal sequence (Fig. 1).Analysis of Sequence—A search in the gene data base main-
tained by NCBI demonstrated that the gene for hGAT-2(SLC6A13) is localized to human chromosome 12p13.3. Thepresence of 14 exons in the gene was found by comparisonbetween the amino acid sequence of hGAT-2 and the genomicDNA (Fig. 2A). These findings are similar to what has recentlybeen reported in a description of the complete repertoire of theSLC6 family (57).The topology of the predicted protein was analyzed using
two different analysis tools for prediction of transmembranehelices. Analysis by the hidden Markov model predicted thepresence of 12 transmembrane �-helices (Fig. 2B). Hydropho-bicity analysis using the TMpred program identified two possi-ble models for transmembrane topology with 11 and 12 trans-membrane �-helices, respectively, depending on the predictedorientation of the membrane spanning segments (Fig. 2C). Asimilar result was obtained when the TMpred programwas runusing the amino acid sequences of both mGAT3 and rGAT-2(data not shown). Collectively the two algorithms demonstratethat hGAT-2 contains 12 putative transmembrane �-helices,which is expected for a member of the Na�/Cl�-dependentneurotransmitter transporter superfamily (7).The similarity of the predicted amino acid sequence of
hGAT-2 to other GABA transporters was examined. Align-ment analysis demonstrated thatGAT-2 displays 51–74%over-all amino acid identity to the other human GABA transportersand 91% identity to the mouse and rat orthologs mGAT3 andrGAT-2 (Fig. 2D).Expression Pattern of hGAT-2mRNA inHumanTissues—To
examine the expression pattern of the transporter in humantissues we performed reverse transcription-PCR of commer-cially available human tissue panels. TheseMTC panels consistof first strand cDNA generated using poly(A)� RNA derivedfrom normal adult human tissues. The cDNA in the appliedMTC panels has been normalized using the housekeeping geneglyceraldehyde-3-phosphate dehydrogenase. The reverse tran-scription-PCR experiment revealed a high mRNA level ofhGAT-2 in kidney and low levels in brain and lung. Further-more we were able to detect a very low level of mRNA of thetransporter in testis, whereas it was absent from the othertested peripheral tissues (Fig. 3).Pharmacological Characterization of hGAT-2Expressed inX.
laevis Oocytes—To determine whether the cloned hGAT-2cDNA encodes for a functional GABA transporter, weexpressed the hGAT-2 construct in X. laevis oocytes. For thecharacterization of hGAT-2 in this and subsequent assays, we
used a number of different compounds (depicted in Fig. 4).Addition of GABA (500 �M) induced an inwardly directed cur-rent in voltage-clamped oocytes injected with hGAT-2 cRNA.�-Alanine (500 �M) similarly induced an inward current,whereas betaine (500 �M) did not. The magnitudes of the
FIGURE 2. Bioinformatics analysis of hGAT-2. A, schematic organization ofthe human SLC6A13 gene. Exons are shown by boxes, and introns are shownby horizontal lines. The structure of the gene and the chromosomal locationwas found in the gene data base (Entrez Gene) maintained by NCBI (GeneID6540). B, prediction of transmembrane �-helices of hGAT-2 by the hiddenMarkov model. C, prediction of transmembrane-spanning domains of hGAT-2based on analysis of hydrophobicity. D, amino acid sequence identitybetween hGAT-2 and related GABA transporters.
FIGURE 3. Expression pattern of hGAT-2 and the housekeeping controlgene glyceraldehyde-3-phosphate dehydrogenase (G3PDH) in varioushuman tissues as determined by agarose gel electrophoresis with SYBRSafe staining. PCR products were amplified from multiple tissue cDNA pan-els that contain normalized adult human cDNA preparations. The bandsshown correspond to the predicted size of 533 nucleotides for hGAT-2 (upperpanel) and 983 nucleotides for glyceraldehyde-3-phosphate dehydrogenase(lower panel).
The Human GAT-2
JULY 6, 2007 • VOLUME 282 • NUMBER 27 JOURNAL OF BIOLOGICAL CHEMISTRY 19335
by guest on April 28, 2018
http://ww
w.jbc.org/
Dow
nloaded from

GABA- and �-alanine-induced currents were not the samewhen measured in the same oocyte: I�-Ala � IGABA (Fig. 5A). Inthe presence of either GABA or �-alanine there was an almostlinear relationship between current and voltage, and the sub-strate-induced current did not saturate with hyperpolarizingmembrane potentials (Fig. 5B).The kinetics of substrate transport through hGAT-2 was
determined by measuring the steady-state substrate-inducedcurrents at different substrate concentrations and constantNa� and Cl� concentrations. The substrate-induced currentsreached saturation levels with increasing concentrations of
substrate, and the currents could befitted to the Michaelis-Mentenequation. The K0.5 was 3.7 � 0.7 �Mfor GABA (n � 4) and 20.2 � 0.3�M (n � 5) for �-alanine at a mem-brane potential of �90 mV (Fig. 5,C and D). The K0.5 values were notsignificantly different at mem-brane potentials ranging from�150 to �30 mV (Fig. 5E). ThisK0.5 for GABA was similar to theK0.5 for GABA in oocytes injectedwith the mouse ortholog trans-porter mGAT3 (data not shownand Ref. 58).It was also investigated whether
the GABA-induced currents inhGAT-2-expressing oocytes couldbe inhibited by a GABA transporterinhibitor.We used oocytes clampedat �50 mV, and the results showthat inward current induced by 50�M GABA was partly inhibited byaddition of 100 �M (S)-SNAP-5114to the superfusing solution, whereasaddition of 500 �M (S)-SNAP-5114blocked the GABA-induced currentto 8.5 � 9.0% of the initial inwardcurrent (n � 4) (Fig. 5F).In the studies of hGAT-2
expressed in oocytes the substratetransport through the transporterwas found to be highly dependenton the external ions. Replacementof 100 mM Cl� with NaMES in theperfusing solution caused a reduc-tion in the GABA transport,whereas removal of Na� abolishedthe GABA-induced current as dem-onstrated by the replacement ofNa� with choline ions (Fig. 5G).When measured in the sameoocyte, a reduction in Cl� from106 to 6 mM resulted in a reduc-tion in IGABA from 100 to 54.4 �3.9% (n � 6). When Na� wasremoved from the external solu-
tion, IGABA decreased to 0.4 � 4.5% (n � 5).To further investigate the Na� dependence of the substrate
transport we measured the GABA-induced current at differentNa� concentrations and a constant GABA concentration of100 �M. The GABA-induced current plotted as a function ofthe external Na� concentration was fitted to the Michaelis-Menten equation to obtain values for the half-maximal Na�
concentration. For Na� the K0.5 was highly voltage-dependentwith a value of 25.6 � 4.1 mM at �150 mV and 93.3 � 11.1mM at �90 mV. It was not possible to fit the data at mem-brane holding potentials more positive than �90 mV (data
FIGURE 4. Chemical structures of the compounds characterized pharmacologically at the hGAT-2.
The Human GAT-2
19336 JOURNAL OF BIOLOGICAL CHEMISTRY VOLUME 282 • NUMBER 27 • JULY 6, 2007
by guest on April 28, 2018
http://ww
w.jbc.org/
Dow
nloaded from

not shown). In mGAT3 the K0.5was also highly voltage-dependent(data not shown) but 3–4-foldlower than for hGAT-2 (data notshown and Ref. 58).Pharmacological Characteriza-
tion of hGAT-2 in the [3H]GABAUptake Assay—Next we character-ized the pharmacology of hGAT-2transiently expressed in tsA201 cellsin a [3H]GABA uptake assay. Initialexperiments demonstrated a time-dependent uptake of GABA in cellstransiently expressing hGAT-2. Theuptake was linear up to �10 min,and thus it was decided to use anuptake period of 3 min for pharma-cological analysis as this gave rise toan uptake of less than 10% of thetotal amount of [3H]GABA in theassay buffer (data not shown).In the saturation experiments
with hGAT-2-expressing tsA201cells, a dose-dependent increase in[3H]GABA uptake reaching satura-tion levels at higher concentrationswas observed. The saturable trans-port of GABA was characterized byaKm value of 8.24� 0.38�M (n� 4)(Fig. 6A).The pharmacological properties
of 13 standard GABA transporterligands (Fig. 4) were characterizedat the hGAT-2 in the [3H]GABAuptake assay using a tracer concen-tration of 30 nM [3H]GABA. In thisassay, all test compounds displayeddose-dependent inhibition curveswith the exception of betaine, whichonly displayed minor inhibitoryactivity at concentrations up to 10mM. GABA, DAPA, and �-alaninedisplayed the most potent competi-tion of GABA transport at hGAT-2(IC50 values in the range of 10–100�M). The compounds (S)-SNAP-5114, EF1502, nipecotic acid,L-DABA, and quinidine were mod-erate in the competition of[3H]GABA transport (IC50 values of100–800 �M), whereas guvacine,NNC-711, THPO, taurine, andbetaine displayed only low or verylow competition of the transporteractivity (IC50 � 1000 �M) (Table 1and Fig. 6B). As a control for non-specific inhibition of [3H]GABAuptake, the test compounds were
FIGURE 5. Functional characterization of hGAT-2 expressed in X. laevis oocytes. A, substrate-inducedcurrents. The current trace was detected upon addition of the following putative substrates to the NaClbuffer: GABA (500 �M), �-alanine (500 �M), and betaine (500 �M). In this oocyte GABA induced an inwardcurrent of 40 nA, �-alanine induced an inward current of 50 nA, whereas betaine did not induce anycurrent. B, voltage dependence of substrate-induced currents. The substrate-induced currents (Isubstrate)were examined at test voltages (Vt) from �50 mV to �150 mV with 20-mV increments. The magnitude ofthe GABA-induced currents varied from �50 to �125 nA in different oocytes. C, the GABA-induced current(�I) plotted as a function of the external GABA concentration at a membrane potential of �90 mV andconstant extracellular Na� (100 mM) and Cl� (106 mM). The K0.5 for GABA was determined to be 3.7 � 0.7�M (n � 4). D, the �-alanine-induced current (�I) plotted as a function of the extracellular �-alanineconcentration at the same conditions as in C. The K0.5 for �-alanine was determined to be 20.2 � 0.3 �M
(n � 5). E, voltage dependence of the K0.5 for GABA (squares) and �-alanine (triangles). The K0.5 was plottedas a function of the membrane holding potential. F, current trace showing the inhibiting effect of (S)-SNAP-5114 on the GABA-induced current. Addition of 50 �M GABA induced an inward current. This currentwas partly blocked by addition of 100 �M (S)-SNAP-5114 and fully blocked by addition of 500 �M (S)-SNAP-5114. G, current trace showing the ion dependence of the substrate-induced current. The oocyte wasperfused with external buffers of different ion composition (NaCl, NaMES, and choline chloride (CholCl))and in the absence or presence of 100 �M GABA. The addition of 100 �M GABA is indicated by arrows. In thisoocyte IGABA �35 nA in NaCl, IGABA �26 nA in NaMES, and IGABA � 0 nA in choline chloride.
The Human GAT-2
JULY 6, 2007 • VOLUME 282 • NUMBER 27 JOURNAL OF BIOLOGICAL CHEMISTRY 19337
by guest on April 28, 2018
http://ww
w.jbc.org/
Dow
nloaded from

also characterized at hEAAT3-expressing tsA201 cells. None ofthe compounds inhibited the uptake of D-[3H]Asp at hEAAT3in the concentrations used for hGAT-2 (data not shown).Pharmacological Characterization of hGAT-2 in the FMP
Assay—We characterized the functional properties of the 13test compounds in the fluorescence-based high throughputmembrane potential assay. The basis of this assay is the distri-bution of an assay dye across the cell membrane that is depend-ent on the membrane potential of the cells. One particularadvantage of using this test system is the ability to distinguishbetween substrates and inhibitors of electrogenic transporters(54).In the FMP assay exposure of hGAT-2-transfected tsA201
cells to known GABA transporter substrates gave rise to solidconcentration-dependent increases in fluorescence intensity(Fig. 7). The increase in the fluorescence intensity in this assayreflects cell depolarization, which again is a reflection of theco-transport of Na� and Cl� ions through the transporter elic-ited by the transport of the substrate. GABA, �-alanine,L-DABA, nipecotic acid, guvacine, taurine, and betaine were
identified as substrates for the hGAT-2, whereas THPO wasfound to be aweak inhibitor (Table 2). The remaining test com-pounds gave rise to nonspecific responses at the hGAT-2 in theFMP assay because they exhibited similar responses in cellstransfected with the glutamate transporter hEAAT3 (data notshown). Hence these compounds were not tested further in theFMP assay. The Hill slopes for betaine and THPO could not be
FIGURE 6. Pharmacological characterization of hGAT-2 in the [3H]GABAuptake assay using tsA201 cells transiently transfected with hGAT-2.A, saturation curve for GABA transport where specific uptake of increasingconcentrations of GABA was measured. The maximum concentration of[3H]GABA used was 100 nM, and the uptake assay was performed asdescribed under “Experimental Procedures.” Data are given as pmol/welland are means � S.D. of triplicate determinations of a single representa-tive experiment. The KD for GABA was determined to be 8.24 � 0.38 �M
(n � 4). B, representative concentration-inhibition curves of GABA (f), DAPA(E), (S)-SNAP-5114 (�), guvacine (✖), THPO (�), and taurine (F). Competitionfor transport of 30 nM [3H]GABA by the indicated standard ligands was per-formed as described under “Experimental Procedures.” Results are given ascpm and are means � S.D. of triplicate determinations of single representa-tive experiments. At least two additional experiments performed on differentdays gave similar results.
FIGURE 7. Pharmacological characterization of hGAT-2 in the FMP assayusing tsA201 cells transiently transfected with hGAT-2. Shown are repre-sentative concentration-response curves of GABA (f), �-alanine (E), L-DABA(�), nipecotic acid (✖), guvacine (�), taurine (F), and betaine (�). The FMPassay was performed as described under “Experimental Procedures.” Theresponses are given as fluorescence units (FU) and are means of triplicatedeterminations of single representative experiments. Error bars have beenomitted for clarity. At least two additional experiments performed on differ-ent days gave similar results.
TABLE 1IC50 values for inhibition of �3H�GABA uptake in tsA201 cellstransiently transfected with hGAT-2The test compounds were examined for their ability to inhibit uptake of 30 nM�3H�GABA as described under “Experimental Procedures.” All experiments wereperformed in triplicate in at least three independent experiments. The correspond-ing IC50 values for mGAT3 and rGAT-2 reported in other studies are given forcomparison. ND, not determined.
Compound hGAT-2 IC50(pIC50 � S.E.)
IC50
mGAT3 rGAT-2�M �M
GABA 10.9 (4.99 � 0.07) 9.2a/3.9b 17c/5dDAPA 28.2 (4.58 � 0.13) 100e/11b ND�-Alanine 41.9 (4.41 � 0.12) �10e/12b 66c/19d(S)-SNAP-5114 126 (3.91 � 0.06)f 20a/22b 21dEF1502 286 (3.55 � 0.02)f �300g NDNipecoticacid 530 (3.28 � 0.05) 124a/29b 113c/39dL-DABA 633 (3.20 � 0.05)f �500e/230b 300cQuinidine 716 (3.15 � 0.05)f �100e NDGuvacine 1000 (3.01 � 0.08) �500e/27b 228c/58dNNC-711 1210 (2.93 � 0.07)f 260b 729c/171hTHPO 1450 (2.84 � 0.01)f 800i ��100jTaurine �3000f 540e/170b 1270cBetaine �3000f ��500e ��500j
a Thomsen et al. (66).b Kragler et al. (59).c Borden et al. (63).d Borden et al. (12).e Liu et al. (13).f The concentration-inhibition curves for compounds that displayed 90% inhibi-tion of hGAT-2 at the maximal tested concentration were fitted to the value of100% inhibition (1 mM GABA). These compounds exhibited the following maxi-mal inhibition: (S)-SNAP-5114 (500 �M), 80.3 � 1.3%; EF1502 (250 �M), 47.4 �2.1%; L-DABA (3 mM), 77.9 � 1.9%; quinidine (1 mM), 61.6 � 4.2%; NNC-711 (1.6mM), 58.9 � 3.9%; THPO (10 mM), 87.6 � 1.0%; taurine (10 mM), 74.1 � 0.2%;betaine (10 mM), 21.3 � 1.6%.
g Clausen et al. (49).h Borden et al. (61).i Bolvig et al. (62).j Borden et al. (11).
The Human GAT-2
19338 JOURNAL OF BIOLOGICAL CHEMISTRY VOLUME 282 • NUMBER 27 • JULY 6, 2007
by guest on April 28, 2018
http://ww
w.jbc.org/
Dow
nloaded from

estimated; however, for the rest of the tested substrates theaverage Hill slopes were between 1.2 and 1.7.
DISCUSSION
Since the cloning of the rat, mouse, and humanGABA trans-porters in the early 1990s, the possible existence of hGAT-2remained enigmatic until a non-functional clone was reportedin 2001 (46). Our analysis of this sequence revealed that it con-tains several truncations and a deviating carboxyl terminuscompared with the rat and mouse orthologs; this was puzzlingconsidering the close sequence relationship shared by theorthologs of the other three GABA transporter subtypes. Thisobservation led us to use bioinformatics tools to identify thefull-length open reading frame of hGAT-2 containing a car-boxyl terminus similar to the rat andmouse orthologs. Here wethus report the cDNA cloning of the humanGABA transporterhGAT-2, which is functional and displays pharmacologicalcharacteristics very similar to its rat and mouse orthologsrGAT-2 and mGAT3. The protein is closely related to othercloned human plasma membrane GABA transporters and dis-plays high amino acid sequence similarity to mGAT3 andrGAT-2. Examination of mRNA levels of hGAT-2 by reversetranscription-PCR in tissues from adult individuals revealedexpression in kidney, brain, lung, and testis. This correspondsto previous reports using either Northern blots (46) or analysisof expressed sequence tags (57), which also demonstrateexpression of hGAT-2 in kidney and brain. Furthermoreexpression in liver (46) and in eye and the gastrointestinal sys-tem has been reported (57). The rGAT-2 has been detected inbrain and retina, and in peripheral tissues it has been found inkidney, liver, heart, spleen, pancreas, and adrenal gland (11, 36,39). The expression of mGAT3 has been found to be morerestricted with low abundance in adult mouse brain and higherlevels of expression in kidney and liver. Interestingly expressionat a high level has been found in neonatal mouse brain (13), andthe expression of mGAT3 in various embryonic peripheral tis-sues has also been reported (44). Based on the expression pat-tern, several suggestions regarding a physiologically relevantfunction of GAT-2 have been made. These include maturation
of the central nervous system (13, 44), regulation of GABA lev-els in the cerebrospinal fluid (36, 37, 39), and a role forGAT-2 intight junctions in the kidney (44).Using the Xenopus oocyte expression system we demon-
strated that hGAT-2 is a functional transporter. Putative sub-strates (GABA and �-alanine) induced inwardly directed cur-rents under voltage-clamped conditions, reflecting theco-transport of ions and substrates. Betaine, however, is not asubstrate for hGAT-2, aswould be expected for this transporter(in contrast to the BGT-1). Not surprisingly, the kinetics of thehGAT-2 are comparable to those of the ortholog mGAT3 (58),whereas they differ from those of hGAT-1 (20). Examination ofion dependence revealed that the transport of substrate is abso-lutely dependent on Na�, whereas transport is not completelyeliminated upon removal of Cl�. This is in agreement withobservations made for both mGAT3 and rGAT-2 and alsohGAT-1 where it has been reported that the transporters arestrictly dependent on the presence ofNa�, whereas the absenceof Cl� only reduces GABA transport by �50% (11, 20, 58).We examined the pharmacological characteristics of
hGAT-2 transiently expressed in tsA201 cells using a numberof both synthesized and commercially available compounds(Fig. 4). These compounds have been tested previously as sub-strates or inhibitors of GABA transport and found to possessdifferent selectivity profiles for neuronal and glial transport andfor the four cloned GABA transporters. The compoundsinclude the classical GABA transporter substrates L-DABA and�-alanine, which originally were thought to bemarkers for neu-ronal and glial transport, respectively, as well as nipecotic acidand guvacine, which were reported to be substrates at bothneuronal and glialGABA transporters (for a review, seeRef. 27).Also included in this study isDAPA,which has been reported tobe selective for the mouse orthologs of GAT-2 and GAT-3 (13,59); quinidine and betaine, which display selectivity for espe-cially the mouse ortholog of BGT-1 (10, 13, 14, 28); (S)-SNAP-5114, which is a relatively selective inhibitor of hGAT-3 (12,60); EF1502, which preferentially inhibits the mouse orthologsof GAT-1 and BGT-1 (41); NNC-711, which selectively inhibitsrGAT-1 and hGAT-1 (61); THPO, which is a weak inhibitor ofall the cloned mouse GABA transporters (62); and taurine,which is a selective substrate of the closely related taurine trans-porter in rat, TAUT (63, 64).Applying the [3H]GABA uptake assay and the FMP assay we
demonstrated that hGAT-2, similarly to hGAT-1 and hGAT-3,displays high affinity transport of GABA. Furthermore wefound the approximately sameorders of potencies for the testedsubstrates in the two assays: GABA � �-alanine � L-DABA �nipecotic acid � guvacine � taurine � betaine. In agreementwith the oocyte data (Fig. 5A) and previous reports (see Refs. 27,62, and 65 and references therein) the results demonstrate thatthe applied FMP assay can be used to distinguish between sub-strates and non-substrates at GABA transporters. However,due to nonspecific effects the pharmacological properties of thecompounds DAPA, (S)-SNAP-5114, quinidine, NNC-771, andEF1502 unfortunately could not be studied in the FMP assay.Considering the bulky substituents of the four latter com-pounds, it is reasonable to assume that they are inhibitors ofhGAT-2 just as they have been demonstrated to be at other
TABLE 2Pharmacological characteristics of test compounds at tsA201 cellstransiently transfected with hGAT-2 in the FMP assay
Substrates Km (pKm � S.E.) Rmax � S.E.a n�M %
GABA 18.3 (4.75 � 0.03) 100 12�-Alanine 39.3 (4.43 � 0.10) 142.4 � 2.6 3L-DABA �200b 120.9 � 9.4 3Nipecotic acid 288 (3.54 � 0.04) 96.5 � 2.4 3Guvacine �300b 139.2 � 5.3 3Taurine �1000b 150.2 � 4.6 3Betaine �1000b 20.5 � 0.6 3
Non-substrate inhibitor Ki (pKi � S.E.) Inhibition � S.E.c n�M %
THPO �200b 49.8 � 3.5 3a Themaximum responses are normalized to themaximal response of GABA (set at100%) measured at 1 mM.
b The concentration-response curve did not reach a plateau at the maximal meas-ured concentration of the compound. The Km or Ki value is therefore estimatedbased on the maximal measured response/inhibition of the compound.
c Percent inhibition of the response elicited by 50 �M GABA by THPO at a concen-tration of 3 mM.
The Human GAT-2
JULY 6, 2007 • VOLUME 282 • NUMBER 27 JOURNAL OF BIOLOGICAL CHEMISTRY 19339
by guest on April 28, 2018
http://ww
w.jbc.org/
Dow
nloaded from

GABA transporter subtypes as described above. Intriguinglyseveral of the substrates (e.g. �-alanine, guvacine, and L-DABA)displayed maximal responses greater than the maximalresponse ofGABA (Table 2 and Fig. 7). This observation cannotbe interpreted as an increased substrate transport rate for thesecompounds compared with GABA because other events couldchange the ion flux ratios during the interaction of the com-pounds with the transporter (54). However, the increasedresponse level is an indication of increased currents, which is inagreement with the observed current trace for �-alanine in theXenopus oocyte expression system (Fig. 5A).Comparing the pharmacological characteristics found in this
study (Tables 1 and 2) with reports for hGAT-1, hBGT-1, andhGAT-3, most of the results obtained in this study are in goodagreement with previously reported properties of the com-pounds. Betaine, quinidine, taurine, NNC-711, and THPO alldisplay low activities at hGAT-2. Nipecotic acid and guvacinedisplay weak to moderate activities as substrates in the FMPassay and as competitors of [3H]GABA transport at hGAT-2. Incomparison these two compounds have been reported to dis-play strong competition of [3H]GABA transport at hGAT-1and moderate and weak competition at hGAT-3 and hBGT-1,respectively (12). The hGAT-2 and hGAT-3 both display highaffinity transport of �-alanine, whereas (S)-SNAP-5114 is aselective inhibitor of hGAT-3-mediated transport (12) and dis-plays a substantially lower inhibitory activity at hGAT-2. Ourstudy therefore demonstrates that hGAT-2, in agreement withthe overall amino acid identity (Fig. 2D), is different from theother cloned GABA transporters and that the pharmacology ofthe transporter is more similar to hGAT-3 and hBGT-1 than tohGAT-1.As can be seen from Table 1, the overall rank order of IC50
values for the 13 standard compounds at hGAT-2 and its ratand mouse orthologs rGAT-2 and mGAT3 is similar. This ishardly surprising considering the high amino acid sequencesimilarity between the three transporters. (S)-SNAP-5114appears to display a lower inhibitory activity at hGAT-2 com-pared with mGAT3 and rGAT-2. However, it should be notedthat data in Table 1 are derived from several different studies,and caution should therefore be taken when drawing compar-isons because differences between transporters from differentspecies also could arise from different assay conditions, assaysystems, or expression levels. This is also indicated by the var-iation of the inhibition constants measured for some of thecompounds at either rGAT-2 or mGAT3 (Table 1).The therapeutic potential of targeting the hGAT-2 remains
to be clarified. It has been suggested previously to be unlikelythat GAT-2 is involved in regulation of GABA inside and out-side intracerebral synapses (35). However, it may be noted thatBGT-1, which similarly to GAT-2 is expressed in non-neuraltissues, only recently has been suggested to have a functionalrole in the central nervous system (41). This finding was basedon the discovery of the novelGABA transport inhibitor EF1502,which acts on both GAT-1 and BGT-1 (49). So far, (S)-SNAP-5114 is the only available pharmacological tool for determina-tion of the functional role of especially GAT-3 but potentiallyalso GAT-2 in the central nervous system (28). However, therecently obtained knowledge about the determinants of sub-
strate binding to a homolog of the GABA transporters (22) islikely to enable a more rational approach to the design of newselective compounds for each of the GABA transporters. Suchcompounds will hopefully reveal more about the function ofGAT-2 both in the central nervous system and in the periphery.Furthermore the identification of this human ortholog ofrGAT-2 and mGAT3 enables the use of the human GABAtransporters in future studies of GABA transport inhibitors.Although GAT-2 is similar among the species mentioned inthis study, there appears to be some variations in transporterpharmacology, and thus the availability of hGAT-2 is highlyrelevant for future drug development programs.
Acknowledgments—We thank Dr. Susan Amara for the hEAAT3cDNA and Dr. Nathan Nelson for the mGAT3 cDNA. Bente Frølund,Rasmus P. Clausen, and Christian A. Olsen are acknowledged forproviding THPO and guvacine, EF1502, and DAPA, respectively.
REFERENCES1. Krnjevic, K., and Schwartz, S. (1967) Exp. Brain Res. 3, 320–3362. Bowery, N. G., and Smart, T. G. (2006) Br. J. Pharmacol. 147, Suppl. 1,
S109–S1193. Rudolph, U., and Mohler, H. (2006) Curr. Opin. Pharmacol. 6, 18–234. Bettler, B., Kaupmann, K., Mosbacher, J., and Gassmann, M. (2004)
Physiol. Rev. 84, 835–8675. Radian, R., Ottersen, O. P., Storm-Mathisen, J., Castel, M., and Kanner,
B. I. (1990) J. Neurosci. 10, 1319–13306. Iversen, L. L., and Kelly, J. S. (1975) Biochem. Pharmacol. 24, 933–9387. Nelson, N. (1998) J. Neurochem. 71, 1785–18038. Guastella, J., Nelson, N., Nelson, H., Czyzyk, L., Keynan, S., Miedel, M. C.,
Davidson, N., Lester, H. A., and Kanner, B. I. (1990) Science 249,1303–1306
9. Nelson, H., Mandiyan, S., and Nelson, N. (1990) FEBS Lett. 269, 181–18410. Lopez-Corcuera, B., Liu, Q. R., Mandiyan, S., Nelson, H., and Nelson, N.
(1992) J. Biol. Chem. 267, 17491–1749311. Borden, L. A., Smith, K. E., Hartig, P. R., Branchek, T. A., andWeinshank,
R. L. (1992) J. Biol. Chem. 267, 21098–2110412. Borden, L. A., Dhar, T. G., Smith, K. E., Branchek, T. A., Gluchowski, C.,
and Weinshank, R. L. (1994) Receptors Channels 2, 207–21313. Liu, Q. R., Lopez-Corcuera, B., Mandiyan, S., Nelson, H., and Nelson, N.
(1993) J. Biol. Chem. 268, 2106–211214. Borden, L. A., Smith, K. E., Gustafson, E. L., Branchek, T. A., and Weins-
hank, R. L. (1995) J. Neurochem. 64, 977–98415. Yamauchi, A., Uchida, S., Kwon,H.M., Preston, A. S., Robey, R. B., Garcia-
Perez, A., Burg, M. B., and Handler, J. S. (1992) J. Biol. Chem. 267,649–652
16. Rasola, A., Galietta, L. J., Barone, V., Romeo, G., and Bagnasco, S. (1995)FEBS Lett. 373, 229–233
17. Burnham, C. E., Buerk, B., Schmidt, C., and Bucuvalas, J. C. (1996) Bio-chim. Biophys. Acta 1284, 4–8
18. Chen, N. H., Reith, M. E., and Quick, M. W. (2004) Pfluegers Arch. Eur.J. Physiol. 447, 519–531
19. Gether, U., Andersen, P. H., Larsson, O. M., and Schousboe, A. (2006)Trends Pharmacol. Sci. 27, 375–383
20. Loo, D. D., Eskandari, S., Boorer, K. J., Sarkar, H. K., and Wright, E. M.(2000) J. Biol. Chem. 275, 37414–37422
21. Kanner, B. I. (1994) J. Exp. Biol. 196, 237–24922. Yamashita, A., Singh, S. K., Kawate, T., Jin, Y., and Gouaux, E. (2005)
Nature 437, 215–22323. Iversen, L. (2006) Br. J. Pharmacol. 147, Suppl. 1, S82–S8824. Treiman, D. M. (2001) Epilepsia 42, Suppl. 3, 8–1225. Wong, C. G., Bottiglieri, T., and Snead, O. C., III (2003) Ann. Neurol. 54,
Suppl. 6, S3–S1226. Jasmin, L., Wu, M. V., and Ohara, P. T. (2004) Curr. Drug Targets CNS
The Human GAT-2
19340 JOURNAL OF BIOLOGICAL CHEMISTRY VOLUME 282 • NUMBER 27 • JULY 6, 2007
by guest on April 28, 2018
http://ww
w.jbc.org/
Dow
nloaded from

Neurol. Disord. 3, 487–50527. Krogsgaard-Larsen, P., Falch, E., Larsson, O.M., and Schousboe, A. (1987)
Epilepsy Res. 1, 77–9328. Borden, L. A. (1996) Neurochem. Int. 29, 335–35629. Schachter, S. C. (1999) Epilepsia 40, Suppl. 5, S17–S2230. Bohme, I., and Luddens, H. (2001) Curr. Med. Chem. 8, 1257–127431. Allen, N. J., Karadottir, R., and Attwell, D. (2004) Pfluegers Arch. Eur.
J. Physiol. 449, 132–14232. Crane, D. (2003) Depress. Anxiety 18, 51–5233. Mathias, S., Wetter, T. C., Steiger, A., and Lancel, M. (2001) Neurobiol.
Aging 22, 247–25334. Backonja, M. M. (2002) Neurology 59, Suppl. 2, S14–S1735. Dalby, N. O. (2003) Eur. J. Pharmacol. 479, 127–13736. Ikegaki, N., Saito, N., Hashima, M., and Tanaka, C. (1994) Brain Res. Mol.
Brain Res. 26, 47–5437. Conti, F., Minelli, A., andMelone, M. (2004) Brain Res. Brain Res. Rev. 45,
196–21238. Jursky, F., Tamura, S., Tamura, A., Mandiyan, S., Nelson, H., and Nelson,
N. (1994) J. Exp. Biol. 196, 283–29539. Durkin, M. M., Smith, K. E., Borden, L. A., Weinshank, R. L., Branchek,
T. A., and Gustafson, E. L. (1995) Brain Res. Mol. Brain Res. 33, 7–2140. Dalby, N. O., Thomsen, C., Fink-Jensen, A., Lundbeck, J., Søkilde, B.,Man,
C. M., Sørensen, P. O., and Meldrum, B. (1997) Epilepsy Res. 28, 51–6141. Clausen, R. P., Frølund, B., Larsson, O. M., Schousboe, A., Krogsgaard-
Larsen, P., and White, H. S. (2006) Neurochem. Int. 48, 637–64242. Schousboe, A., Larsson, O. M., Sarup, A., and White, H. S. (2004) Eur.
J. Pharmacol. 500, 281–28743. White, H. S.,Watson,W. P., Hansen, S. L., Slough, S., Perregaard, J., Sarup,
A., Bolvig, T., Petersen, G., Larsson, O. M., Clausen, R. P., Frølund, B.,Falch, E., Krogsgaard-Larsen, P., and Schousboe, A. (2005) J. Pharmacol.Exp. Ther. 312, 866–874
44. Jursky, F., and Nelson, N. (1999) J. Neurosci. Res. 55, 394–39945. Sarup, A., Larsson, O. M., and Schousboe, A. (2003) Curr. Drug Targets
CNS Neurol. Disord. 2, 269–27746. Gong, Y., Zhang, M., Cui, L., and Minuk, G. Y. (2001) Can. J. Physiol.
Pharmacol. 79, 977–98447. Sauerberg, P., Larsen, J. J., Falch, E., and Krogsgaard-Larsen, P. (1986)
J. Med. Chem. 29, 1004–100948. McElvain, S. M., and Stork, G. (1946) J. Am. Chem. Soc. 68, 1049–105349. Clausen, R. P., Moltzen, E. K., Perregaard, J., Lenz, S. M., Sanchez, C.,
Falch, E., Frølund, B., Bolvig, T., Sarup, A., Larsson, O. M., Schousboe, A.,and Krogsgaard-Larsen, P. (2005) Bioorg. Med. Chem. 13, 895–908
50. Sonnhammer, E. L., von Heijne, G., and Krogh, A. (1998) Proc. Int. Conf.Intell. Syst. Mol. Biol. 6, 175–182
51. Hofmann, K., and Stoffel, W. (1993) Biol. Chem. Hoppe-Seyler 47, 16652. Meinild, A., Klaerke, D. A., Loo, D. D., Wright, E. M., and Zeuthen, T.
(1998) J. Physiol. 508, 15–21
53. Chahine,M., Bennett, P. B., George, A. L., Jr., andHorn, R. (1994)PfluegersArch. Eur. J. Physiol. 427, 136–142
54. Jensen, A. A., and Brauner-Osborne, H. (2004) Biochem. Pharmacol. 67,2115–2127
55. Strausberg, R. L., Feingold, E. A., Grouse, L. H., Derge, J. G., Klausner,R. D., Collins, F. S., Wagner, L., Shenmen, C. M., Schuler, G. D., Altschul,S. F., Zeeberg, B., Buetow, K. H., Schaefer, C. F., Bhat, N. K., Hopkins, R. F.,Jordan, H., Moore, T., Max, S. I., Wang, J., Hsieh, F., Diatchenko, L., Ma-rusina, K., Farmer, A. A., Rubin, G. M., Hong, L., Stapleton, M., Soares,M. B., Bonaldo, M. F., Casavant, T. L., Scheetz, T. E., Brownstein, M. J.,Usdin, T. B., Toshiyuki, S., Carninci, P., Prange, C., Raha, S. S., Loquellano,N. A., Peters, G. J., Abramson, R. D., Mullahy, S. J., Bosak, S. A., McEwan,P. J., McKernan, K. J., Malek, J. A., Gunaratne, P. H., Richards, S., Worley,K. C.,Hale, S., Garcia, A.M.,Gay, L. J., Hulyk, S.W., Villalon,D. K.,Muzny,D.M., Sodergren, E. J., Lu, X., Gibbs, R. A., Fahey, J., Helton, E., Ketteman,M.,Madan, A., Rodrigues, S., Sanchez, A.,Whiting,M.,Madan, A., Young,A. C., Shevchenko, Y., Bouffard, G. G., Blakesley, R. W., Touchman, J. W.,Green, E. D., Dickson, M. C., Rodriguez, A. C., Grimwood, J., Schmutz, J.,Myers, R. M., Butterfield, Y. S., Krzywinski, M. I., Skalska, U., Smailus,D. E., Schnerch, A., Schein, J. E., Jones, S. J., andMarra, M. A. (2002) Proc.Natl. Acad. Sci. U. S. A. 99, 16899–16903
56. Lennon, G., Auffray, C., Polymeropoulos, M., and Soares, M. B. (1996)Genomics 33, 151–152
57. Hoglund, P. J., Adzic, D., Scicluna, S. J., Lindblom, J., and Fredriksson, R.(2005) Biochem. Biophys. Res. Commun. 336, 175–189
58. Sacher, A., Nelson, N., Ogi, J. T., Wright, E. M., Loo, D. D., and Eskandari,S. (2002) J. Membr. Biol. 190, 57–73
59. Kragler, A., Hofner, G., and Wanner, K. T. (2005) Eur. J. Pharmacol. 519,43–47
60. Dhar, T. G., Borden, L. A., Tyagarajan, S., Smith, K. E., Branchek, T. A.,Weinshank, R. L., and Gluchowski, C. (1994) J. Med. Chem. 37,2334–2342
61. Borden, L. A., Murali Dhar, T. G., Smith, K. E., Weinshank, R. L.,Branchek, T. A., and Gluchowski, C. (1994) Eur. J. Pharmacol. 269,219–224
62. Bolvig, T., Larsson, O. M., Pickering, D. S., Nelson, N., Falch, E., Krogs-gaard-Larsen, P., and Schousboe, A. (1999) Eur. J. Pharmacol. 375,367–374
63. Borden, L. A., Smith, K. E., Vaysse, P. J., Gustafson, E. L.,Weinshank, R. L.,and Branchek, T. A. (1995) Receptors Channels 3, 129–146
64. Smith, K. E., Borden, L. A.,Wang, C. H., Hartig, P. R., Branchek, T. A., andWeinshank, R. L. (1992)Mol. Pharmacol. 42, 563–569
65. Schousboe, A., Sarup, A., Larsson,O.M., andWhite, H. S. (2004)Biochem.Pharmacol. 68, 1557–1563
66. Thomsen, C., Sørensen, P. O., and Egebjerg, J. (1997) Br. J. Pharmacol.120, 983–985
The Human GAT-2
JULY 6, 2007 • VOLUME 282 • NUMBER 27 JOURNAL OF BIOLOGICAL CHEMISTRY 19341
by guest on April 28, 2018
http://ww
w.jbc.org/
Dow
nloaded from

Braüner-OsborneBolette Christiansen, Anne-Kristine Meinild, Anders A. Jensen and Hans
(GABA) Transporter, Human GAT-2-Aminobutyric AcidγCloning and Characterization of a Functional Human
doi: 10.1074/jbc.M702111200 originally published online May 14, 20072007, 282:19331-19341.J. Biol. Chem.
10.1074/jbc.M702111200Access the most updated version of this article at doi:
Alerts:
When a correction for this article is posted•
When this article is cited•
to choose from all of JBC's e-mail alertsClick here
http://www.jbc.org/content/282/27/19331.full.html#ref-list-1
This article cites 66 references, 13 of which can be accessed free at
by guest on April 28, 2018
http://ww
w.jbc.org/
Dow
nloaded from