Embed Size (px)
Citation preview
Research ArticleClinicopathological Characteristics and Prognosis ofProximal and Distal Gastric Cancer during 1997–2017 inChina National Cancer Center
Lulu Zhao,1 Huang Huang,2 Dongbin Zhao ,1 ChengfengWang ,1
Yantao Tian,1 Xinghua Yuan,1 Fuhai Ma,1 Hu Ren ,1 Yajie Zhao,1
Saderbiek Aimaiti,1 Shuisheng Zhang,1 Hong Zhou,1 TongboWang,1
NianchangWang,1 Yuemin Sun,1 Xiaofeng Bai,1 and Yingtai Chen 1
1National Cancer Center/National Clinical Research Center for Cancer/Cancer Hospital,Chinese Academy of Medical Sciences and Peking Union Medical College, Beijing 100021, China2Department of Environmental Health Sciences, Yale University School of Public Health, New Haven, CT 06520, USA
Correspondence should be addressed to Dongbin Zhao; [email protected] and Yingtai Chen; [email protected]
Received 29 January 2019; Accepted 8 May 2019; Published 13 June 2019
Academic Editor: Akira Hara
Copyright © 2019 Lulu Zhao et al. This is an open access article distributed under the Creative Commons Attribution License,which permits unrestricted use, distribution, and reproduction in any medium, provided the original work is properly cited.
Background. The prognostic relevance of gastric tumor location has been reported and debated. Our study was conducted toexamine the differences in clinicopathological features, prognostic factors, and overall survival (OS) between patients with proximalgastric cancer (PGC) and distal gastric cancer (DGC). Patients and Methods. Patients with PGC or DGC were identified fromthe China National Cancer Center Gastric Cancer Database (NCCGCDB) during 1997–2017. Survival analysis was performed viaKaplan-Meier estimates andCox proportional hazardsmodels.Results.We reviewed 16,119 cases of gastric cancer patients, including6,479 of PGC and 9,640 of DGC. PGC patients presented as older patients (61.5 versus 56.4 years, P<0.001) and more males (82.9%versus 68.2%, P<0.001). Compared with DGC, PGC was more likely to be in later pT stage (pT3 and pT4, 65.0% versus 52.8%,P<0.001) and lymph node metastasis (54.8% versus 50.9%, P<0.001). In univariate analysis, PGC patients had a worse survivaloutcome in stage I (Hazard ratio [HR] = 2.04, 95% CI: 1.42-2.94) but a better prognosis in stage IV (HR = 0.85, 95% CI: 0.73-0.98)when compared to DGC patients. However, multivariate analysis demonstrated that PGC was not an independent predictor forpoor survival (HR = 1.07, 95% CI: 1.00-1.14). Results from multivariate analysis also revealed that pT4, lymph node metastasis,distant metastasis, no gastrectomy, and Borrmann IV were independent predictors associated with poor survival for both PGC andDGC patients. Additional prognostic factors for PGC patients included underweight (BMI < 18.5) (HR = 1.29, 95% CI: 1.06-1.58),linitis plastica (HR = 2.13, 95% CI: 1.25-3.65), and overweight (23 ≤ BMI <27.5) (HR = 0.80, 95% CI: 0.71-0.90). During the 20-yearstudy period, the 5-year OS increased significantly for both PGC and DGC, with the increase rate of 91.7% and 67.7%, respectively.Conclusion. In China, PGC significantly differed fromDGC in clinicopathological characteristics and prognostic factors. However,there was no significant relationship between survival outcome and gastric tumor location.
1. Introduction
Gastric cancer (GC) is the third leading cause of cancer-related mortality and the fifth most common cancer glob-ally [1]. Many population-based studies have reported thatthe incidence of distal gastric cancer (DGC) has graduallydeclined, while proximal gastric cancer (PGC) has increasedobviously during the last decades [2–9].
Researches have indicated that PGC differed from DGCin clinicopathological characteristics [10–13]. For example,one previous study [11] found that PGC patients were morelikely to be in an advanced tumor stage and have larger tumorsize as compared to DGC. Yu et al. [13] showed that PGCwas more common than DGC in males. Moreover, there wasno clear agreement on the link between tumor location andoverall survival (OS) of GC. Some studies [11, 13–17] reported
HindawiJournal of OncologyVolume 2019, Article ID 9784039, 13 pageshttps://doi.org/10.1155/2019/9784039
2 Journal of Oncology
a worse prognosis in patients with PGC compared to DGC,while others [10, 12, 18] have shown no relationship betweenprognosis and gastric tumor location. Katsuhiko et al. [19]even demonstrated that PGC patients had a longer survivaltime thanDGCafter chemotherapy.The inconsistent findingsfrom these previous studies could be partially due to the smallsample size, with the population records ranging from 270 to3,193.
Given the suggested but undecided differences in clin-icopathological characteristics and prognosis between PGCand DGC, the aim of our study was to compare theclinicopathological features, prognostic factors, and sur-vival outcomes between PGC and DGC based on theChina National Cancer Center Gastric Cancer Database(NCCGCDB) in order to determine whether PGC conveysworse prognosis and provides evidence for the developmentof guiding strategies for GC patients with different tumorlocations.
2. Materials and Methods
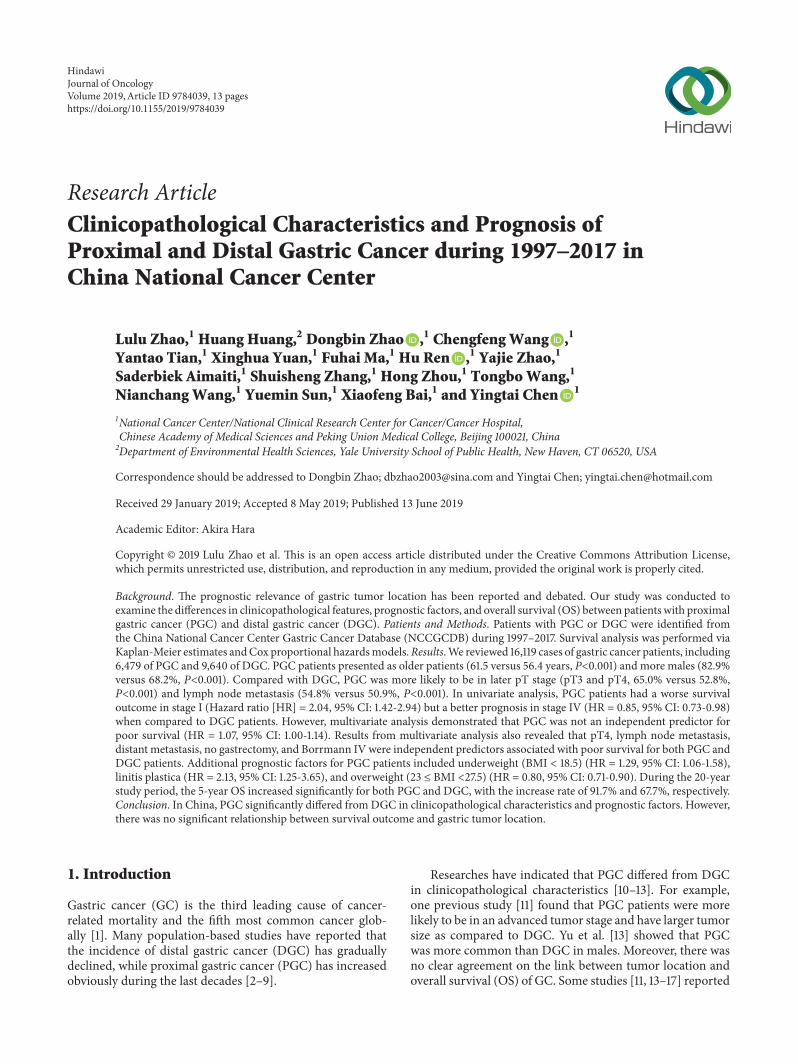
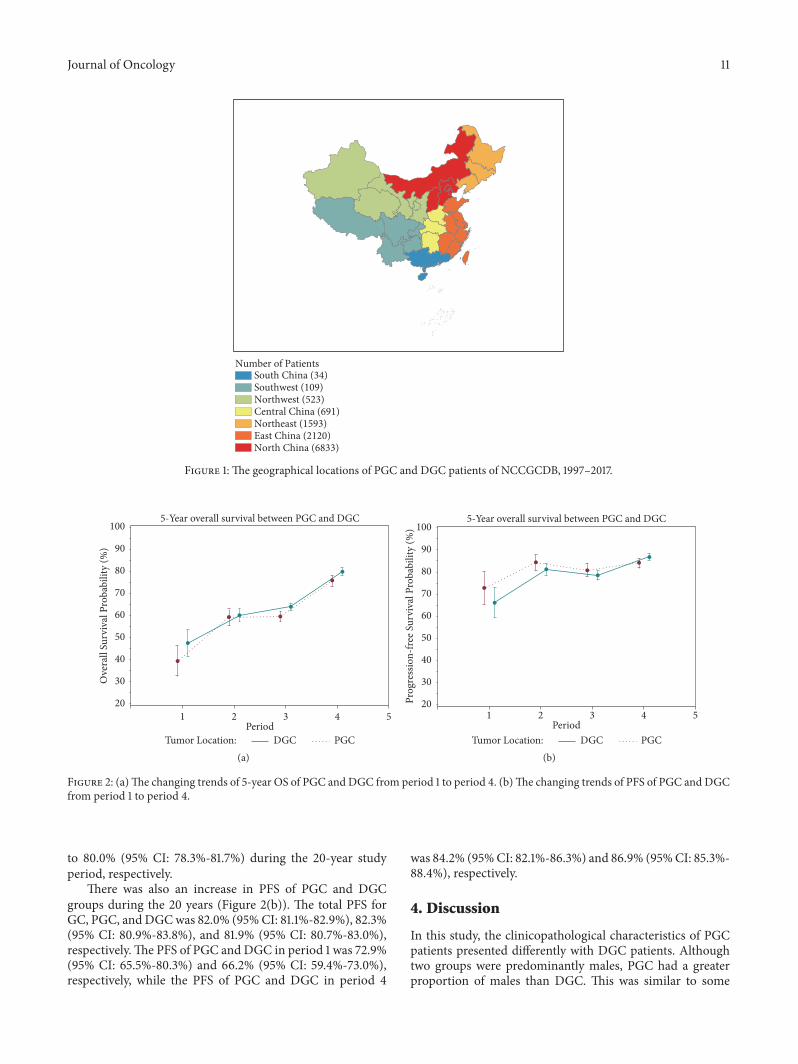
2.1. Patient Population. All the study data were abstractedfrom the NCCGCDB. The NCCGCDB was a clinical gastriccancer database based on a huge retrospective cohort, whichwas sourced from China National Cancer Center, a singlebut large-volume institution, and included more than 19,000patients from all around China from 1997 to 2018. PGC wasdefined as tumors with the epicenter located in cardia (C16.0)or fundus (C16.1), whereas DGC was defined as lesionsof the body (C16.2), antrum (C16.3), or pylorus (C16.4).Changing trends in clinicopathological characteristics andOS of total GC, PGC, and DGC were analyzed in fourconsecutive time periods: from 1997 to 2002 (period 1),from 2002 to 2007 (period 2), from 2007 to 2012 (period3), and from 2012 to 2017 (period 4). The geographicallocations of these gastric cancer patients can be found inFigure 1.
2.2. Statistical Analyses. Categorical variables were comparedusing the Chi-squared test and continuous variables wereanalyzed by Student’s t-test. OS and progression-free sur-vival (PFS) curves were plotted for PGC and DGC groups,respectively, using the Kaplan-Meier method and comparedstatistically using the log-rank test. Hazard ratios (HRs) and95% confidence intervals (CIs) were used to estimate therisk of death by employing the multivariate Cox proportionalhazards models with adjustment for alcohol consumption,BMI, H. pylori infection, pT stage, pN stage, pM stage,Lauren classification, gastrectomy, surgical margin, HER2score, linitis plastica, Borrmann classification, and grossclassification. The covariates included in the final modelswere selected by the stepwise selection method, with asignificant level for adding variables of 0.05 and a significantlevel for removing variables of 0.10. A two-sided P value lessthan 0.05 was considered as statistically significant. All thestatistical analyses were performed using SAS software v9.4(SAS Institute, Inc., Cary, NC).
3. Results
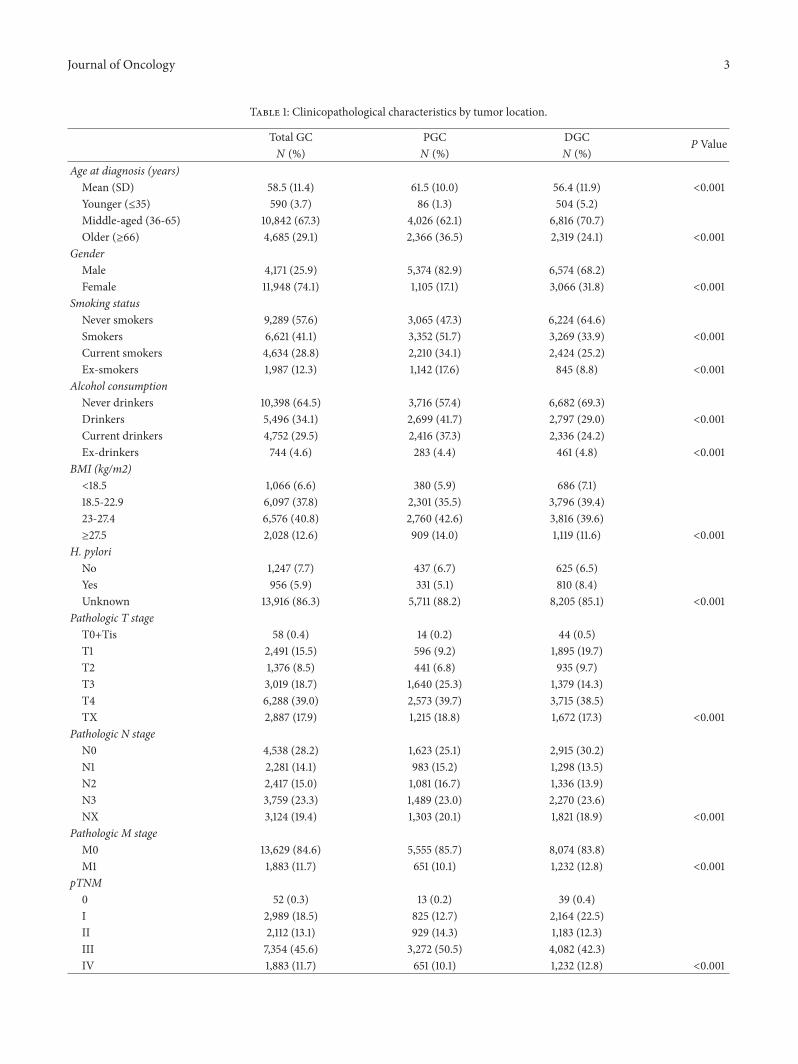
3.1. Clinicopathological Characteristics. In this study, 16,119patients were included. The clinicopathological features of9,640 patients (59.8%) with DGC and 6,479 patients (41.2%)with PGC were compared (Table 1), with an incidenceof DGC:PGC = 1.49:1. Among our study population, ahigher tumor incidence was found in DGC. There weresignificant differences in the distribution of age, gender,smoking, alcohol consumption, BMI, H. pylori infection,pTNM stage, Lauren classification, surgical margin, HER2score, linitis plastica, and Borrmann classification betweenDGC and PGC patients. PGC was more likely to occur inolder patients (61.5 versus 56.4 years, P<0.001). Both groupswere predominantly males and PGC has a greater proportionof males than DGC (82.9% versus 68.2%, P<0.001). Rela-tively higher percentages of smokers (51.7% versus 33.9%,P<0.001), alcohol drinkers (41.7% versus 29.0%, P<0.001),and overweight/obesity (BMI≥23) (56.6% versus 51.2%,P<0.001) were shown in PGC patients as compared to DGCpatients.
As for tumors, PGCpatientsweremore likely to be in laterpT stage (pT3 and pT4, 65.0% versus 52.8%, P<0.001), lymphnode metastasis (54.8% versus 50.9%, P<0.001), intestinaltype (18.8%versus 12.2%,P<0.001), local advancedGC (76.2%versus 65.9%, P<0.001), and Borrmann I (11.0% versus 4.6%,P<0.001).The percentages of ever received surgical treatment(81.2% versus 82.3%, P=0.068) were similar between the twogroups. DGC patients were more common in diffuse type(17.1% versus 8.6%, P<0.001), early stage GC (21.5% versus11.3%, P<0.001), and distant metastasis (12.8% versus 10.1%,P<0.001).
Changing trends of clinicopathological features in GCpatients were analyzed. The proportion of pT1 tumorsincreased gradually with time, from 9.5% in period 1 to 22.0%in period 4, whereas the proportion of pT4 had declinedfrom 66.0% in period 1 to 28.1% in period 4. The proportionof patients with pN0 increased from 24.5% in period 1 to33.5% in period 4, whereas patients with pN3 were graduallydecreased from 26.3% in period 1 to 21.5% in period 4. Theproportion of pM1 remained relatively stable (from 11.2% to10.7%) during the past 20 years. In pTNM stage, a significantincrease was observed in stages I and II (from 12.0% and 3.8%in period 1 to 24.9% and 17.6% in period 4, resp.), while theproportion of stage III had declined from 63.0% in period 1to 37.2% in period 4.
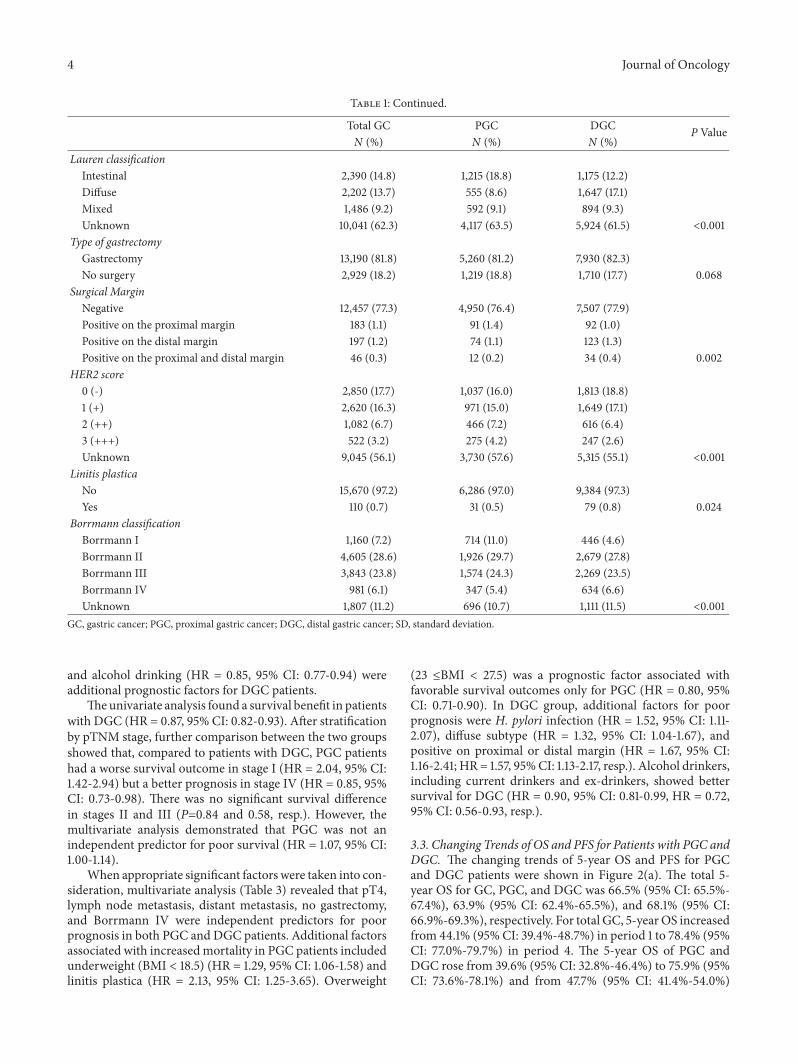
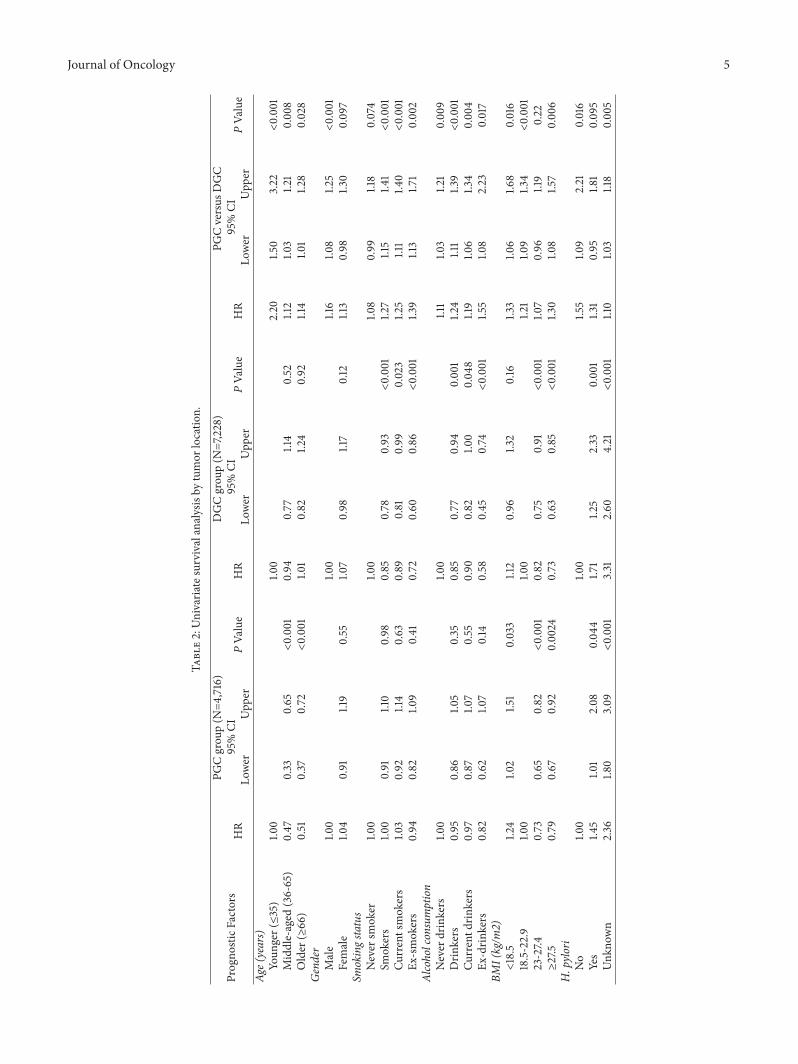
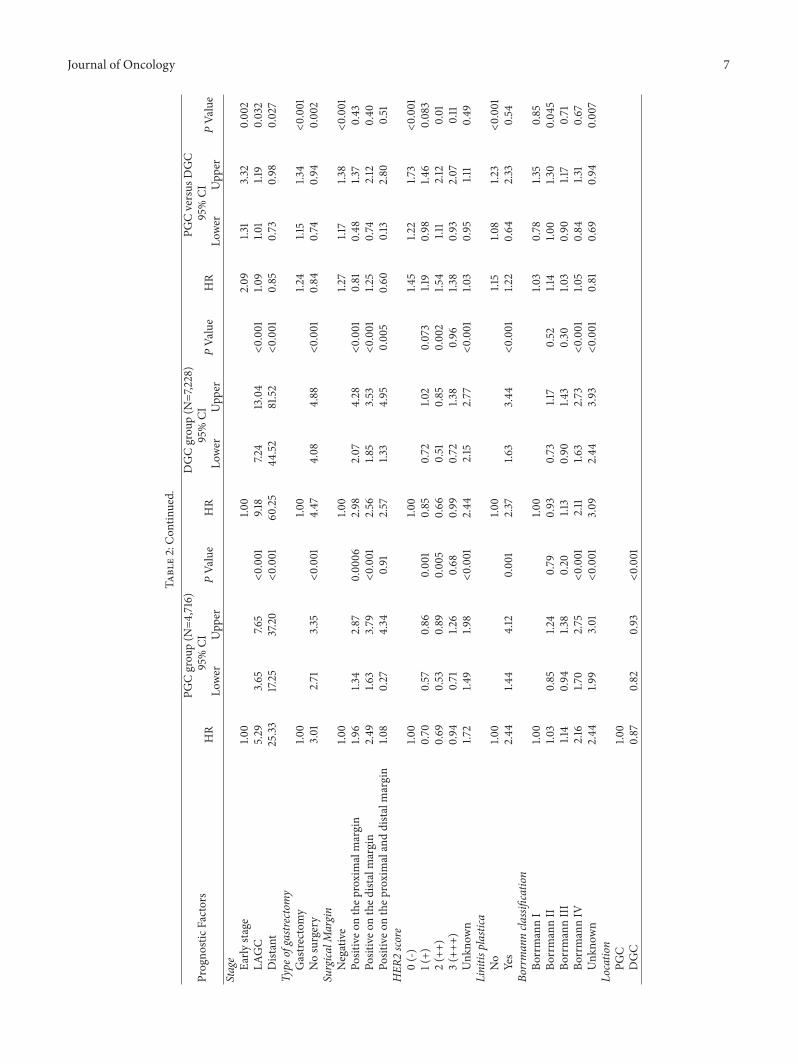
3.2. Prognostic Factors of Survival in Univariate and Multi-variate Analyses. As shown in Table 2, univariate analysesof survival revealed significantly different survival based onthe following parameters: overweight/obesity (BMI ≥ 23), H.pylori infection, advanced pT, pN, pM, and pTNM stage,Lauren classification, no gastrectomy, surgical margin, linitisplastic, andBorrmann IV for both PGCandDGCgroups. Forpatients with PGC, additional parameters including middleand older age (HR = 0.47, 95% CI: 0.33-0.65; HR = 0.51,95% CI: 0.37-0.72, resp.) and HER2 score of 1(+) and 2(++)(HR = 0.70, 95% CI: 0.57-0.86; HR = 0.69, 95% CI: 0.53-0.89, resp.), while smoking (HR = 0.85, 95% CI: 0.78-0.93)
Journal of Oncology 3
Table 1: Clinicopathological characteristics by tumor location.
Total GC PGC DGC P ValueN (%) N (%) N (%)
Age at diagnosis (years)Mean (SD) 58.5 (11.4) 61.5 (10.0) 56.4 (11.9) <0.001Younger (≤35) 590 (3.7) 86 (1.3) 504 (5.2)Middle-aged (36-65) 10,842 (67.3) 4,026 (62.1) 6,816 (70.7)Older (≥66) 4,685 (29.1) 2,366 (36.5) 2,319 (24.1) <0.001
GenderMale 4,171 (25.9) 5,374 (82.9) 6,574 (68.2)Female 11,948 (74.1) 1,105 (17.1) 3,066 (31.8) <0.001
Smoking statusNever smokers 9,289 (57.6) 3,065 (47.3) 6,224 (64.6)Smokers 6,621 (41.1) 3,352 (51.7) 3,269 (33.9) <0.001Current smokers 4,634 (28.8) 2,210 (34.1) 2,424 (25.2)Ex-smokers 1,987 (12.3) 1,142 (17.6) 845 (8.8) <0.001
Alcohol consumptionNever drinkers 10,398 (64.5) 3,716 (57.4) 6,682 (69.3)Drinkers 5,496 (34.1) 2,699 (41.7) 2,797 (29.0) <0.001Current drinkers 4,752 (29.5) 2,416 (37.3) 2,336 (24.2)Ex-drinkers 744 (4.6) 283 (4.4) 461 (4.8) <0.001
BMI (kg/m2)<18.5 1,066 (6.6) 380 (5.9) 686 (7.1)18.5-22.9 6,097 (37.8) 2,301 (35.5) 3,796 (39.4)23-27.4 6,576 (40.8) 2,760 (42.6) 3,816 (39.6)≥27.5 2,028 (12.6) 909 (14.0) 1,119 (11.6) <0.001
H. pyloriNo 1,247 (7.7) 437 (6.7) 625 (6.5)Yes 956 (5.9) 331 (5.1) 810 (8.4)Unknown 13,916 (86.3) 5,711 (88.2) 8,205 (85.1) <0.001
Pathologic T stageT0+Tis 58 (0.4) 14 (0.2) 44 (0.5)T1 2,491 (15.5) 596 (9.2) 1,895 (19.7)T2 1,376 (8.5) 441 (6.8) 935 (9.7)T3 3,019 (18.7) 1,640 (25.3) 1,379 (14.3)T4 6,288 (39.0) 2,573 (39.7) 3,715 (38.5)TX 2,887 (17.9) 1,215 (18.8) 1,672 (17.3) <0.001
Pathologic N stageN0 4,538 (28.2) 1,623 (25.1) 2,915 (30.2)N1 2,281 (14.1) 983 (15.2) 1,298 (13.5)N2 2,417 (15.0) 1,081 (16.7) 1,336 (13.9)N3 3,759 (23.3) 1,489 (23.0) 2,270 (23.6)NX 3,124 (19.4) 1,303 (20.1) 1,821 (18.9) <0.001
Pathologic M stageM0 13,629 (84.6) 5,555 (85.7) 8,074 (83.8)M1 1,883 (11.7) 651 (10.1) 1,232 (12.8) <0.001
pTNM0 52 (0.3) 13 (0.2) 39 (0.4)I 2,989 (18.5) 825 (12.7) 2,164 (22.5)II 2,112 (13.1) 929 (14.3) 1,183 (12.3)III 7,354 (45.6) 3,272 (50.5) 4,082 (42.3)IV 1,883 (11.7) 651 (10.1) 1,232 (12.8) <0.001
4 Journal of Oncology
Table 1: Continued.
Total GC PGC DGC P ValueN (%) N (%) N (%)
Lauren classificationIntestinal 2,390 (14.8) 1,215 (18.8) 1,175 (12.2)Diffuse 2,202 (13.7) 555 (8.6) 1,647 (17.1)Mixed 1,486 (9.2) 592 (9.1) 894 (9.3)Unknown 10,041 (62.3) 4,117 (63.5) 5,924 (61.5) <0.001
Type of gastrectomyGastrectomy 13,190 (81.8) 5,260 (81.2) 7,930 (82.3)No surgery 2,929 (18.2) 1,219 (18.8) 1,710 (17.7) 0.068
Surgical MarginNegative 12,457 (77.3) 4,950 (76.4) 7,507 (77.9)Positive on the proximal margin 183 (1.1) 91 (1.4) 92 (1.0)Positive on the distal margin 197 (1.2) 74 (1.1) 123 (1.3)Positive on the proximal and distal margin 46 (0.3) 12 (0.2) 34 (0.4) 0.002
HER2 score0 (-) 2,850 (17.7) 1,037 (16.0) 1,813 (18.8)1 (+) 2,620 (16.3) 971 (15.0) 1,649 (17.1)2 (++) 1,082 (6.7) 466 (7.2) 616 (6.4)3 (+++) 522 (3.2) 275 (4.2) 247 (2.6)Unknown 9,045 (56.1) 3,730 (57.6) 5,315 (55.1) <0.001
Linitis plasticaNo 15,670 (97.2) 6,286 (97.0) 9,384 (97.3)Yes 110 (0.7) 31 (0.5) 79 (0.8) 0.024
Borrmann classificationBorrmann I 1,160 (7.2) 714 (11.0) 446 (4.6)Borrmann II 4,605 (28.6) 1,926 (29.7) 2,679 (27.8)Borrmann III 3,843 (23.8) 1,574 (24.3) 2,269 (23.5)Borrmann IV 981 (6.1) 347 (5.4) 634 (6.6)Unknown 1,807 (11.2) 696 (10.7) 1,111 (11.5) <0.001
GC, gastric cancer; PGC, proximal gastric cancer; DGC, distal gastric cancer; SD, standard deviation.
and alcohol drinking (HR = 0.85, 95% CI: 0.77-0.94) wereadditional prognostic factors for DGC patients.
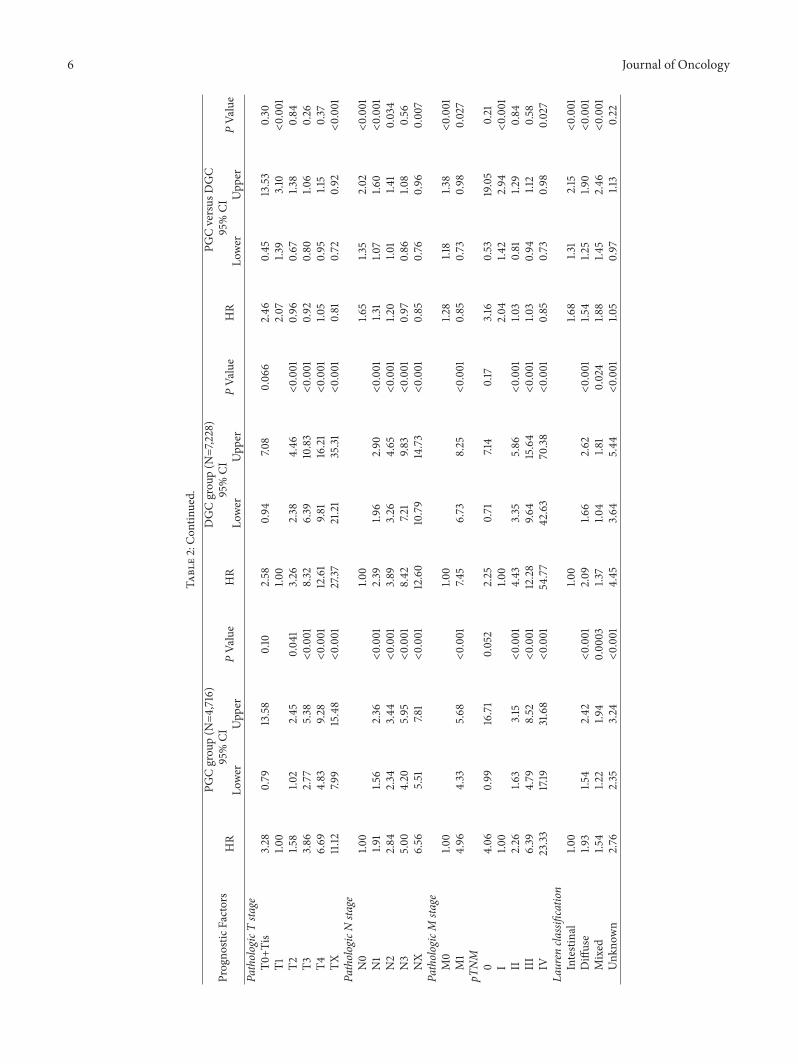
Theunivariate analysis found a survival benefit in patientswith DGC (HR = 0.87, 95% CI: 0.82-0.93). After stratificationby pTNM stage, further comparison between the two groupsshowed that, compared to patients with DGC, PGC patientshad a worse survival outcome in stage I (HR = 2.04, 95% CI:1.42-2.94) but a better prognosis in stage IV (HR = 0.85, 95%CI: 0.73-0.98). There was no significant survival differencein stages II and III (P=0.84 and 0.58, resp.). However, themultivariate analysis demonstrated that PGC was not anindependent predictor for poor survival (HR = 1.07, 95% CI:1.00-1.14).
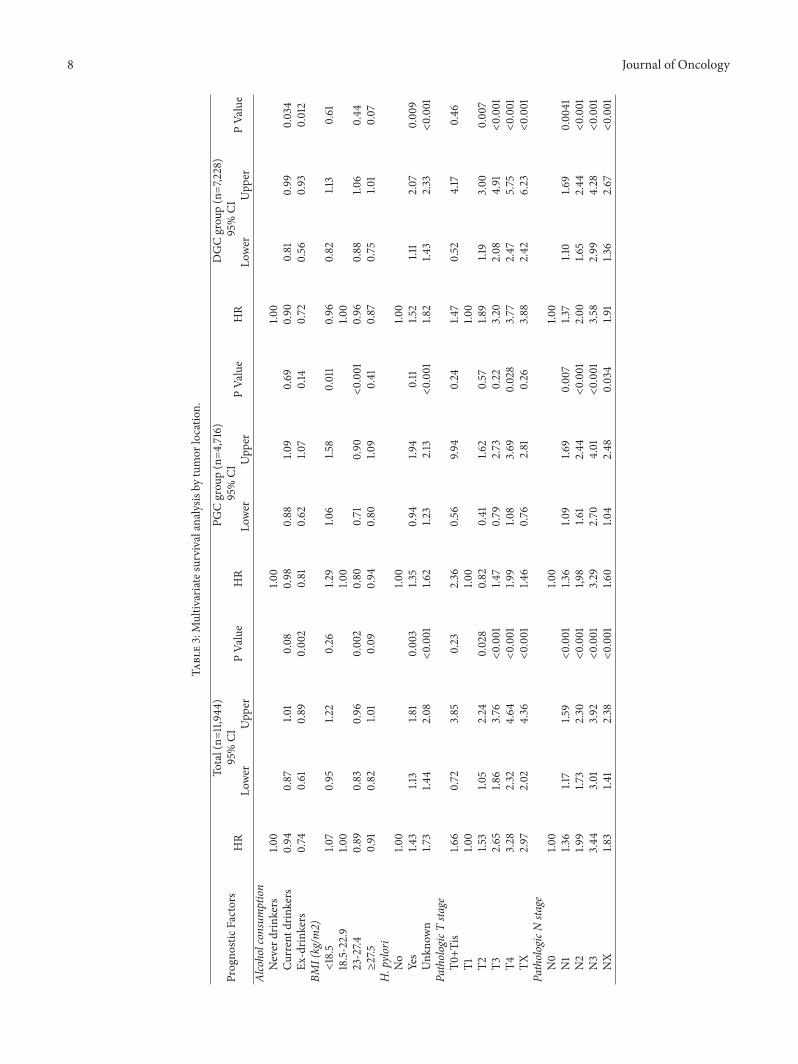
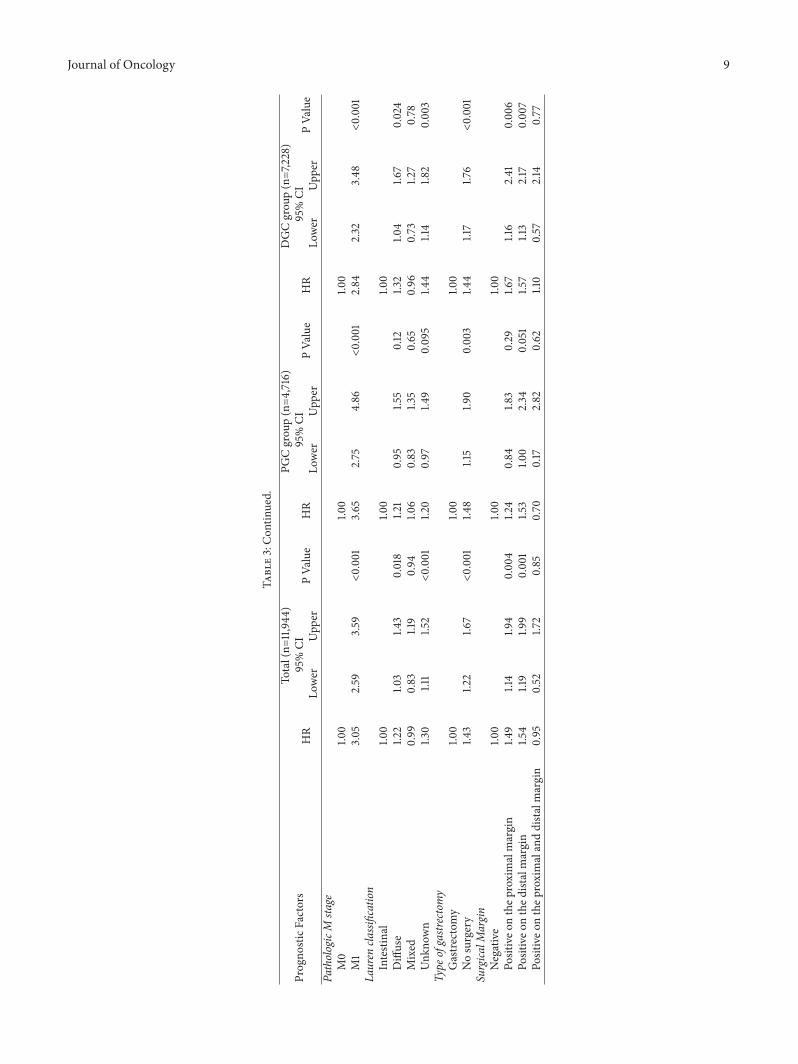
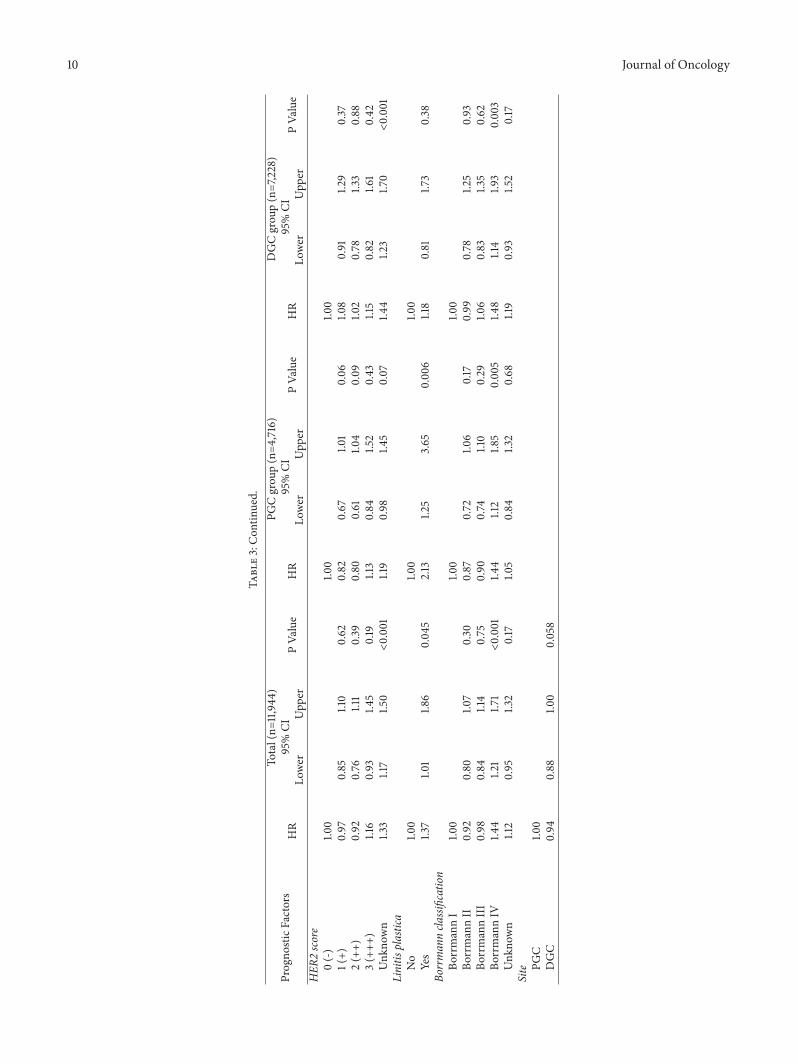
When appropriate significant factors were taken into con-sideration, multivariate analysis (Table 3) revealed that pT4,lymph node metastasis, distant metastasis, no gastrectomy,and Borrmann IV were independent predictors for poorprognosis in both PGC and DGC patients. Additional factorsassociated with increasedmortality in PGC patients includedunderweight (BMI < 18.5) (HR = 1.29, 95% CI: 1.06-1.58) andlinitis plastica (HR = 2.13, 95% CI: 1.25-3.65). Overweight
(23 ≤BMI < 27.5) was a prognostic factor associated withfavorable survival outcomes only for PGC (HR = 0.80, 95%CI: 0.71-0.90). In DGC group, additional factors for poorprognosis were H. pylori infection (HR = 1.52, 95% CI: 1.11-2.07), diffuse subtype (HR = 1.32, 95% CI: 1.04-1.67), andpositive on proximal or distal margin (HR = 1.67, 95% CI:1.16-2.41; HR = 1.57, 95%CI: 1.13-2.17, resp.). Alcohol drinkers,including current drinkers and ex-drinkers, showed bettersurvival for DGC (HR = 0.90, 95% CI: 0.81-0.99, HR = 0.72,95% CI: 0.56-0.93, resp.).
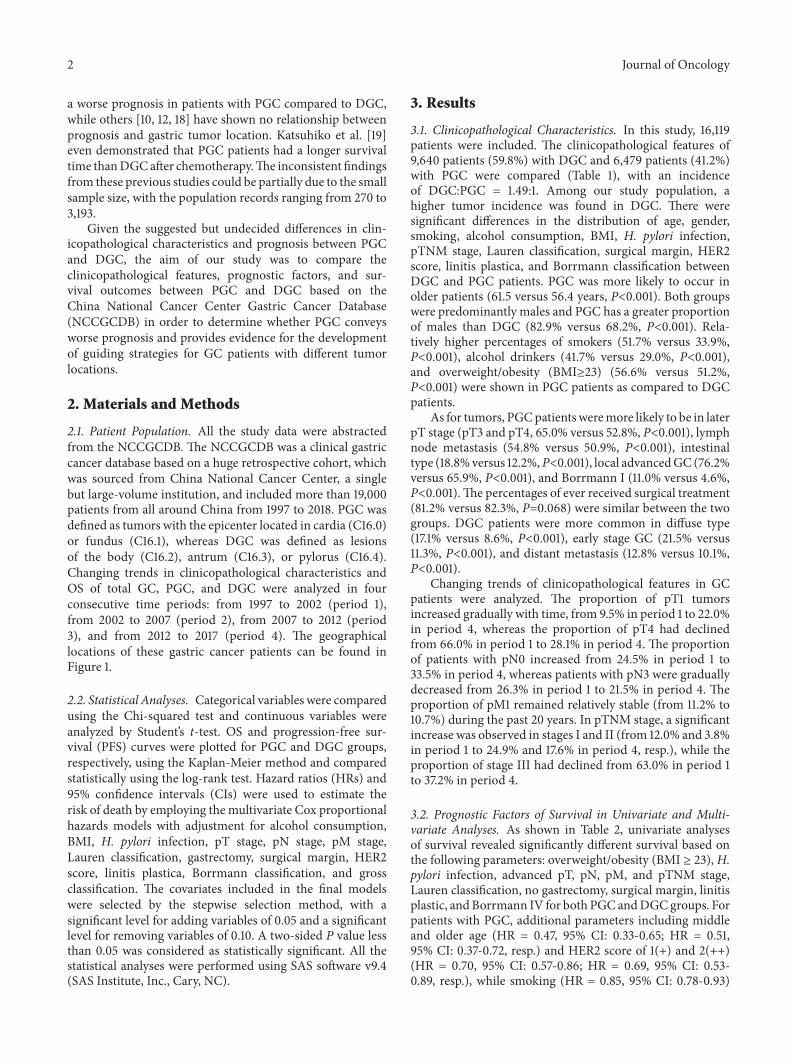
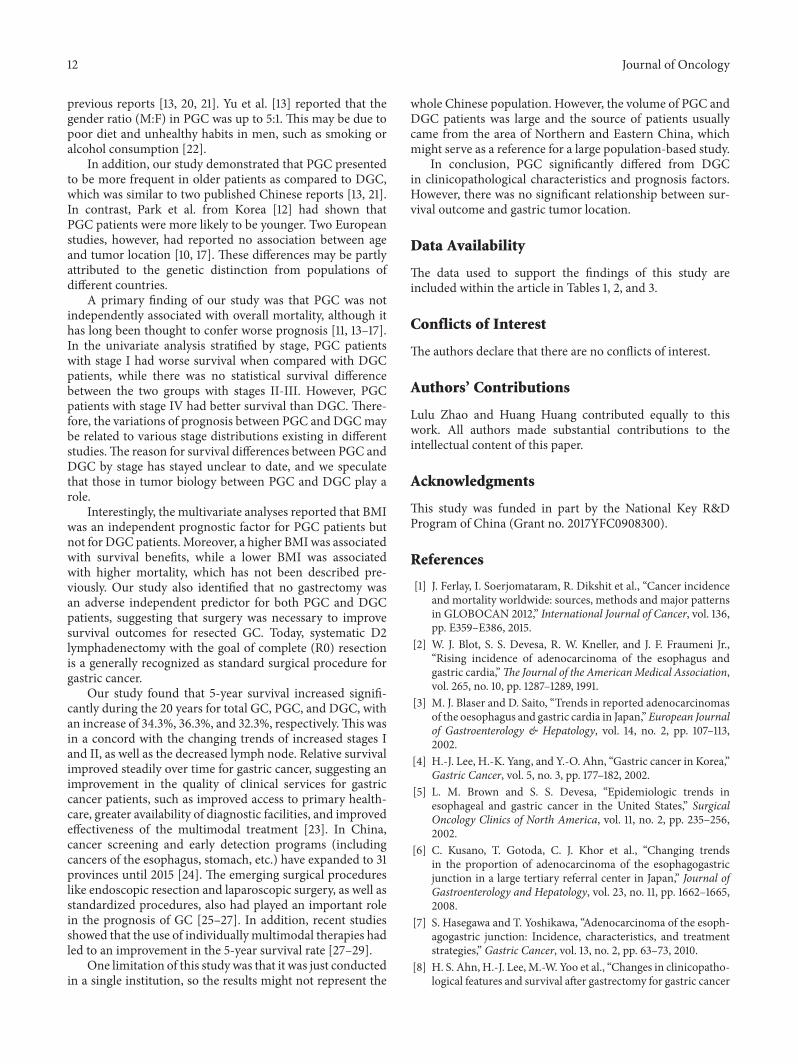
3.3. Changing Trends of OS and PFS for Patients with PGC andDGC. The changing trends of 5-year OS and PFS for PGCand DGC patients were shown in Figure 2(a). The total 5-year OS for GC, PGC, and DGC was 66.5% (95% CI: 65.5%-67.4%), 63.9% (95% CI: 62.4%-65.5%), and 68.1% (95% CI:66.9%-69.3%), respectively. For total GC, 5-yearOS increasedfrom 44.1% (95% CI: 39.4%-48.7%) in period 1 to 78.4% (95%CI: 77.0%-79.7%) in period 4. The 5-year OS of PGC andDGC rose from 39.6% (95% CI: 32.8%-46.4%) to 75.9% (95%CI: 73.6%-78.1%) and from 47.7% (95% CI: 41.4%-54.0%)
Journal of Oncology 5
Table2:Univaria
tesurvivalanalysisby
tumor
locatio
n.
Progno
sticFactors
PGCgrou
p(N
=4,716)
DGCgrou
p(N
=7,228)
PGCversus
DGC
HR
95%CI
PVa
lue
HR
95%CI
PVa
lue
HR
95%CI
PVa
lue
Lower
Upp
erLo
wer
Upp
erLo
wer
Upp
erAg
e(years)
Youn
ger(≤35)
1.00
1.00
2.20
1.50
3.22
<0.001
Middle-aged
(36-65)
0.47
0.33
0.65
<0.001
0.94
0.77
1.14
0.52
1.12
1.03
1.21
0.008
Older
(≥66)
0.51
0.37
0.72
<0.001
1.01
0.82
1.24
0.92
1.14
1.01
1.28
0.028
Gender
Male
1.00
1.00
1.16
1.08
1.25
<0.001
Female
1.04
0.91
1.19
0.55
1.07
0.98
1.17
0.12
1.13
0.98
1.30
0.097
Smokingstatus
Never
smoker
1.00
1.00
1.08
0.99
1.18
0.074
Smokers
1.00
0.91
1.10
0.98
0.85
0.78
0.93
<0.001
1.27
1.15
1.41
<0.001
Currentsmokers
1.03
0.92
1.14
0.63
0.89
0.81
0.99
0.023
1.25
1.11
1.40
<0.001
Ex-smokers
0.94
0.82
1.09
0.41
0.72
0.60
0.86
<0.001
1.39
1.13
1.71
0.002
Alcoholconsumption
Never
drinkers
1.00
1.00
1.11
1.03
1.21
0.00
9Drin
kers
0.95
0.86
1.05
0.35
0.85
0.77
0.94
0.001
1.24
1.11
1.39
<0.001
Currentd
rinkers
0.97
0.87
1.07
0.55
0.90
0.82
1.00
0.04
81.19
1.06
1.34
0.00
4Ex
-drin
kers
0.82
0.62
1.07
0.14
0.58
0.45
0.74
<0.001
1.55
1.08
2.23
0.017
BMI(kg/m
2)<18.5
1.24
1.02
1.51
0.033
1.12
0.96
1.32
0.16
1.33
1.06
1.68
0.016
18.5-22.9
1.00
1.00
1.21
1.09
1.34
<0.001
23-27.4
0.73
0.65
0.82
<0.001
0.82
0.75
0.91
<0.001
1.07
0.96
1.19
0.22
≥27.5
0.79
0.67
0.92
0.0024
0.73
0.63
0.85
<0.001
1.30
1.08
1.57
0.00
6H.pylori
No
1.00
1.00
1.55
1.09
2.21
0.016
Yes
1.45
1.01
2.08
0.04
41.7
11.2
52.33
0.001
1.31
0.95
1.81
0.095
Unk
nown
2.36
1.80
3.09
<0.001
3.31
2.60
4.21
<0.001
1.10
1.03
1.18
0.005
6 Journal of Oncology
Table2:Con
tinued.
Progno
sticFactors
PGCgrou
p(N
=4,716)
DGCgrou
p(N
=7,228)
PGCversus
DGC
HR
95%CI
PVa
lue
HR
95%CI
PVa
lue
HR
95%CI
PVa
lue
Lower
Upp
erLo
wer
Upp
erLo
wer
Upp
erPathologicTsta
geT0
+Tis
3.28
0.79
13.58
0.10
2.58
0.94
7.08
0.06
62.46
0.45
13.53
0.30
T11.0
01.0
02.07
1.39
3.10
<0.001
T21.5
81.0
22.45
0.041
3.26
2.38
4.46
<0.001
0.96
0.67
1.38
0.84
T33.86
2.77
5.38
<0.001
8.32
6.39
10.83
<0.001
0.92
0.80
1.06
0.26
T46.69
4.83
9.28
<0.001
12.61
9.81
16.21
<0.001
1.05
0.95
1.15
0.37
TX11.12
7.99
15.48
<0.001
27.37
21.21
35.31
<0.001
0.81
0.72
0.92
<0.001
PathologicNsta
geN0
1.00
1.00
1.65
1.35
2.02
<0.001
N1
1.91
1.56
2.36
<0.001
2.39
1.96
2.90
<0.001
1.31
1.07
1.60
<0.001
N2
2.84
2.34
3.44
<0.001
3.89
3.26
4.65
<0.001
1.20
1.01
1.41
0.034
N3
5.00
4.20
5.95
<0.001
8.42
7.21
9.83
<0.001
0.97
0.86
1.08
0.56
NX
6.56
5.51
7.81
<0.001
12.60
10.79
14.73
<0.001
0.85
0.76
0.96
0.007
PathologicM
stage
M0
1.00
1.00
1.28
1.18
1.38
<0.001
M1
4.96
4.33
5.68
<0.001
7.45
6.73
8.25
<0.001
0.85
0.73
0.98
0.027
pTNM
04.06
0.99
16.71
0.052
2.25
0.71
7.14
0.17
3.16
0.53
19.05
0.21
I1.0
01.0
02.04
1.42
2.94
<0.001
II2.26
1.63
3.15
<0.001
4.43
3.35
5.86
<0.001
1.03
0.81
1.29
0.84
III
6.39
4.79
8.52
<0.001
12.28
9.64
15.64
<0.001
1.03
0.94
1.12
0.58
IV23.33
17.19
31.68
<0.001
54.77
42.63
70.38
<0.001
0.85
0.73
0.98
0.027
Lauren
classification
Intestinal
1.00
1.00
1.68
1.31
2.15
<0.001
Diffuse
1.93
1.54
2.42
<0.001
2.09
1.66
2.62
<0.001
1.54
1.25
1.90
<0.001
Mixed
1.54
1.22
1.94
0.00
031.3
71.0
41.8
10.024
1.88
1.45
2.46
<0.001
Unk
nown
2.76
2.35
3.24
<0.001
4.45
3.64
5.44
<0.001
1.05
0.97
1.13
0.22
Journal of Oncology 7
Table2:Con
tinued.
Progno
sticFactors
PGCgrou
p(N
=4,716)
DGCgrou
p(N
=7,228)
PGCversus
DGC
HR
95%CI
PVa
lue
HR
95%CI
PVa
lue
HR
95%CI
PVa
lue
Lower
Upp
erLo
wer
Upp
erLo
wer
Upp
erStage Early
stage
1.00
1.00
2.09
1.31
3.32
0.002
LAGC
5.29
3.65
7.65
<0.001
9.18
7.24
13.04<0.001
1.09
1.01
1.19
0.032
Distant
25.33
17.25
37.20<0.001
60.25
44.52
81.52
<0.001
0.85
0.73
0.98
0.027
Type
ofgastrectomy
Gastre
ctom
y1.0
01.0
01.2
41.15
1.34
<0.001
Nosurgery
3.01
2.71
3.35
<0.001
4.47
4.08
4.88
<0.001
0.84
0.74
0.94
0.002
Surgica
lMargin
Negative
1.00
1.00
1.27
1.17
1.38
<0.001
Positiveo
nthep
roximalmargin
1.96
1.34
2.87
0.00
062.98
2.07
4.28
<0.001
0.81
0.48
1.37
0.43
Positiveo
nthed
istalmargin
2.49
1.63
3.79
<0.001
2.56
1.85
3.53
<0.001
1.25
0.74
2.12
0.40
Positiveo
nthep
roximalanddistalmargin
1.08
0.27
4.34
0.91
2.57
1.33
4.95
0.005
0.60
0.13
2.80
0.51
HER
2score
0(-)
1.00
1.00
1.45
1.22
1.73
<0.001
1(+)
0.70
0.57
0.86
0.001
0.85
0.72
1.02
0.073
1.19
0.98
1.46
0.083
2(++)
0.69
0.53
0.89
0.005
0.66
0.51
0.85
0.002
1.54
1.11
2.12
0.01
3(+++
)0.94
0.71
1.26
0.68
0.99
0.72
1.38
0.96
1.38
0.93
2.07
0.11
Unk
nown
1.72
1.49
1.98
<0.001
2.44
2.15
2.77
<0.001
1.03
0.95
1.11
0.49
Linitis
plastica
No
1.00
1.00
1.15
1.08
1.23
<0.001
Yes
2.44
1.44
4.12
0.001
2.37
1.63
3.44
<0.001
1.22
0.64
2.33
0.54
Borrmanncla
ssification
BorrmannI
1.00
1.00
1.03
0.78
1.35
0.85
BorrmannII
1.03
0.85
1.24
0.79
0.93
0.73
1.17
0.52
1.14
1.00
1.30
0.045
BorrmannIII
1.14
0.94
1.38
0.20
1.13
0.90
1.43
0.30
1.03
0.90
1.17
0.71
BorrmannIV
2.16
1.70
2.75
<0.001
2.11
1.63
2.73
<0.001
1.05
0.84
1.31
0.67
Unk
nown
2.44
1.99
3.01
<0.001
3.09
2.44
3.93
<0.001
0.81
0.69
0.94
0.007
Locatio
nPG
C1.0
0DGC
0.87
0.82
0.93
<0.001
8 Journal of Oncology
Table3:Multiv
ariatesurvivalanalysisby
tumor
locatio
n.
Progno
sticFactors
Total(n=
11,944
)PG
Cgrou
p(n=4
,716)
DGCgrou
p(n=7,228)
HR
95%CI
PVa
lue
HR
95%CI
PVa
lue
HR
95%CI
PVa
lue
Lower
Upp
erLo
wer
Upp
erLo
wer
Upp
erAlcoholconsumption
Never
drinkers
1.00
1.00
1.00
Currentd
rinkers
0.94
0.87
1.01
0.08
0.98
0.88
1.09
0.69
0.90
0.81
0.99
0.034
Ex-drin
kers
0.74
0.61
0.89
0.002
0.81
0.62
1.07
0.14
0.72
0.56
0.93
0.012
BMI(kg/m
2)<18.5
1.07
0.95
1.22
0.26
1.29
1.06
1.58
0.011
0.96
0.82
1.13
0.61
18.5-22.9
1.00
1.00
1.00
23-27.4
0.89
0.83
0.96
0.002
0.80
0.71
0.90
<0.001
0.96
0.88
1.06
0.44
≥27.5
0.91
0.82
1.01
0.09
0.94
0.80
1.09
0.41
0.87
0.75
1.01
0.07
H.pylori
No
1.00
1.00
1.00
Yes
1.43
1.13
1.81
0.003
1.35
0.94
1.94
0.11
1.52
1.11
2.07
0.00
9Unk
nown
1.73
1.44
2.08
<0.001
1.62
1.23
2.13
<0.001
1.82
1.43
2.33
<0.001
PathologicTsta
geT0
+Tis
1.66
0.72
3.85
0.23
2.36
0.56
9.94
0.24
1.47
0.52
4.17
0.46
T11.0
01.0
01.0
0T2
1.53
1.05
2.24
0.028
0.82
0.41
1.62
0.57
1.89
1.19
3.00
0.007
T32.65
1.86
3.76
<0.001
1.47
0.79
2.73
0.22
3.20
2.08
4.91
<0.001
T43.28
2.32
4.64
<0.001
1.99
1.08
3.69
0.028
3.77
2.47
5.75
<0.001
TX2.97
2.02
4.36
<0.001
1.46
0.76
2.81
0.26
3.88
2.42
6.23
<0.001
PathologicNsta
geN0
1.00
1.00
1.00
N1
1.36
1.17
1.59
<0.001
1.36
1.09
1.69
0.007
1.37
1.10
1.69
0.00
41N2
1.99
1.73
2.30
<0.001
1,98
1.61
2.44
<0.001
2.00
1.65
2.44
<0.001
N3
3.44
3.01
3.92
<0.001
3.29
2.70
4.01
<0.001
3.58
2.99
4.28
<0.001
NX
1.83
1.41
2.38
<0.001
1.60
1.04
2.48
0.034
1.91
1.36
2.67
<0.001
Journal of Oncology 9
Table3:Con
tinued.
Progno
sticFactors
Total(n=
11,944
)PG
Cgrou
p(n=4
,716)
DGCgrou
p(n=7,228)
HR
95%CI
PVa
lue
HR
95%CI
PVa
lue
HR
95%CI
PVa
lue
Lower
Upp
erLo
wer
Upp
erLo
wer
Upp
erPathologicM
stage
M0
1.00
1.00
1.00
M1
3.05
2.59
3.59
<0.001
3.65
2.75
4.86
<0.001
2.84
2.32
3.48
<0.001
Lauren
classification
Intestinal
1.00
1.00
1.00
Diffuse
1.22
1.03
1.43
0.018
1.21
0.95
1.55
0.12
1.32
1.04
1.67
0.024
Mixed
0.99
0.83
1.19
0.94
1.06
0.83
1.35
0.65
0.96
0.73
1.27
0.78
Unk
nown
1.30
1.11
1.52
<0.001
1.20
0.97
1.49
0.095
1.44
1.14
1.82
0.003
Type
ofgastrectomy
Gastre
ctom
y1.0
01.0
01.0
0Nosurgery
1.43
1.22
1.67
<0.001
1.48
1.15
1.90
0.003
1.44
1.17
1.76
<0.001
Surgica
lMargin
Negative
1.00
1.00
1.00
Positiveo
nthep
roximalmargin
1.49
1.14
1.94
0.00
41.2
40.84
1.83
0.29
1.67
1.16
2.41
0.00
6Po
sitiveo
nthed
istalmargin
1.54
1.19
1.99
0.001
1.53
1.00
2.34
0.051
1.57
1.13
2.17
0.007
Positiveo
nthep
roximalanddistalmargin
0.95
0.52
1.72
0.85
0.70
0.17
2.82
0.62
1.10
0.57
2.14
0.77
10 Journal of Oncology
Table3:Con
tinued.
Progno
sticFactors
Total(n=
11,944
)PG
Cgrou
p(n=4
,716)
DGCgrou
p(n=7,228)
HR
95%CI
PVa
lue
HR
95%CI
PVa
lue
HR
95%CI
PVa
lue
Lower
Upp
erLo
wer
Upp
erLo
wer
Upp
erHER
2score
0(-)
1.00
1.00
1.00
1(+)
0.97
0.85
1.10
0.62
0.82
0.67
1.01
0.06
1.08
0.91
1.29
0.37
2(++)
0.92
0.76
1.11
0.39
0.80
0.61
1.04
0.09
1.02
0.78
1.33
0.88
3(+++
)1.16
0.93
1.45
0.19
1.13
0.84
1.52
0.43
1.15
0.82
1.61
0.42
Unk
nown
1.33
1.17
1.50
<0.001
1.19
0.98
1.45
0.07
1.44
1.23
1.70
<0.001
Linitis
plastica
No
1.00
1.00
1.00
Yes
1.37
1.01
1.86
0.045
2.13
1.25
3.65
0.00
61.18
0.81
1.73
0.38
Borrmanncla
ssification
BorrmannI
1.00
1.00
1.00
BorrmannII
0.92
0.80
1.07
0.30
0.87
0.72
1.06
0.17
0.99
0.78
1.25
0.93
BorrmannIII
0.98
0.84
1.14
0.75
0.90
0.74
1.10
0.29
1.06
0.83
1.35
0.62
BorrmannIV
1.44
1.21
1.71
<0.001
1.44
1.12
1.85
0.005
1.48
1.14
1.93
0.003
Unk
nown
1.12
0.95
1.32
0.17
1.05
0.84
1.32
0.68
1.19
0.93
1.52
0.17
Site PG
C1.0
0DGC
0.94
0.88
1.00
0.058
Journal of Oncology 11
Number of PatientsSouth China (34)Southwest (109)Northwest (523)Central China (691)Northeast (1593)East China (2120)North China (6833)
Figure 1: The geographical locations of PGC and DGC patients of NCCGCDB, 1997–2017.
5-Year overall survival between PGC and DGC
20
30
40
50
60
70
80
90
100
Ove
rall
Surv
ival
Pro
babi
lity
(%)
2 3 4 51Period
Tumor Location: DGC PGC(a)
5-Year overall survival between PGC and DGC
2 3 4 51Period
Tumor Location: DGC PGC
20
30
40
50
60
70
80
90
100
Prog
ress
ion-
free S
urvi
val P
roba
bilit
y (%
)
(b)
Figure 2: (a)The changing trends of 5-year OS of PGC and DGC from period 1 to period 4. (b)The changing trends of PFS of PGC and DGCfrom period 1 to period 4.
to 80.0% (95% CI: 78.3%-81.7%) during the 20-year studyperiod, respectively.
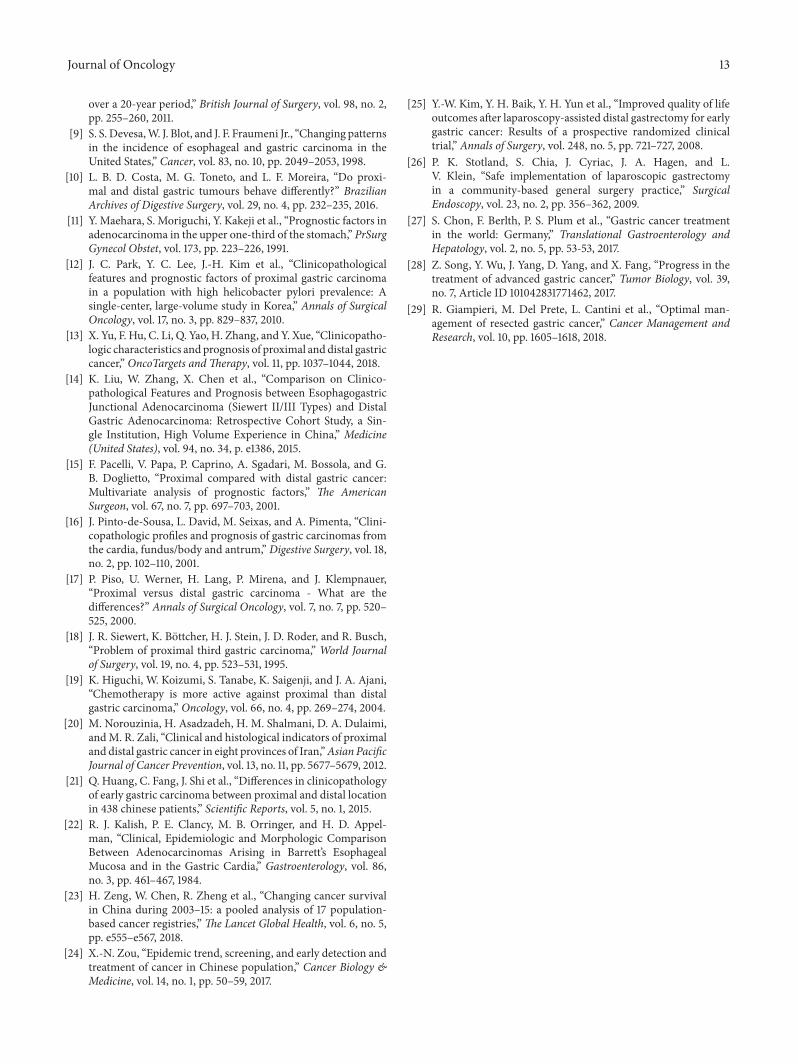
There was also an increase in PFS of PGC and DGCgroups during the 20 years (Figure 2(b)). The total PFS forGC, PGC, andDGCwas 82.0% (95%CI: 81.1%-82.9%), 82.3%(95% CI: 80.9%-83.8%), and 81.9% (95% CI: 80.7%-83.0%),respectively.The PFS of PGC and DGC in period 1 was 72.9%(95% CI: 65.5%-80.3%) and 66.2% (95% CI: 59.4%-73.0%),respectively, while the PFS of PGC and DGC in period 4
was 84.2% (95%CI: 82.1%-86.3%) and 86.9% (95%CI: 85.3%-88.4%), respectively.
4. Discussion
In this study, the clinicopathological characteristics of PGCpatients presented differently with DGC patients. Althoughtwo groups were predominantly males, PGC had a greaterproportion of males than DGC. This was similar to some
12 Journal of Oncology
previous reports [13, 20, 21]. Yu et al. [13] reported that thegender ratio (M:F) in PGC was up to 5:1. This may be due topoor diet and unhealthy habits in men, such as smoking oralcohol consumption [22].
In addition, our study demonstrated that PGC presentedto be more frequent in older patients as compared to DGC,which was similar to two published Chinese reports [13, 21].In contrast, Park et al. from Korea [12] had shown thatPGC patients were more likely to be younger. Two Europeanstudies, however, had reported no association between ageand tumor location [10, 17]. These differences may be partlyattributed to the genetic distinction from populations ofdifferent countries.
A primary finding of our study was that PGC was notindependently associated with overall mortality, although ithas long been thought to confer worse prognosis [11, 13–17].In the univariate analysis stratified by stage, PGC patientswith stage I had worse survival when compared with DGCpatients, while there was no statistical survival differencebetween the two groups with stages II-III. However, PGCpatients with stage IV had better survival than DGC. There-fore, the variations of prognosis between PGC and DGCmaybe related to various stage distributions existing in differentstudies.The reason for survival differences between PGC andDGC by stage has stayed unclear to date, and we speculatethat those in tumor biology between PGC and DGC play arole.
Interestingly, the multivariate analyses reported that BMIwas an independent prognostic factor for PGC patients butnot for DGC patients.Moreover, a higher BMIwas associatedwith survival benefits, while a lower BMI was associatedwith higher mortality, which has not been described pre-viously. Our study also identified that no gastrectomy wasan adverse independent predictor for both PGC and DGCpatients, suggesting that surgery was necessary to improvesurvival outcomes for resected GC. Today, systematic D2lymphadenectomy with the goal of complete (R0) resectionis a generally recognized as standard surgical procedure forgastric cancer.
Our study found that 5-year survival increased signifi-cantly during the 20 years for total GC, PGC, and DGC, withan increase of 34.3%, 36.3%, and 32.3%, respectively.This wasin a concord with the changing trends of increased stages Iand II, as well as the decreased lymph node. Relative survivalimproved steadily over time for gastric cancer, suggesting animprovement in the quality of clinical services for gastriccancer patients, such as improved access to primary health-care, greater availability of diagnostic facilities, and improvedeffectiveness of the multimodal treatment [23]. In China,cancer screening and early detection programs (includingcancers of the esophagus, stomach, etc.) have expanded to 31provinces until 2015 [24]. The emerging surgical procedureslike endoscopic resection and laparoscopic surgery, as well asstandardized procedures, also had played an important rolein the prognosis of GC [25–27]. In addition, recent studiesshowed that the use of individually multimodal therapies hadled to an improvement in the 5-year survival rate [27–29].
One limitation of this study was that it was just conductedin a single institution, so the results might not represent the
whole Chinese population. However, the volume of PGC andDGC patients was large and the source of patients usuallycame from the area of Northern and Eastern China, whichmight serve as a reference for a large population-based study.
In conclusion, PGC significantly differed from DGCin clinicopathological characteristics and prognosis factors.However, there was no significant relationship between sur-vival outcome and gastric tumor location.
Data Availability
The data used to support the findings of this study areincluded within the article in Tables 1, 2, and 3.
Conflicts of Interest
The authors declare that there are no conflicts of interest.
Authors’ Contributions
Lulu Zhao and Huang Huang contributed equally to thiswork. All authors made substantial contributions to theintellectual content of this paper.
Acknowledgments
This study was funded in part by the National Key R&DProgram of China (Grant no. 2017YFC0908300).
References
[1] J. Ferlay, I. Soerjomataram, R. Dikshit et al., “Cancer incidenceand mortality worldwide: sources, methods and major patternsin GLOBOCAN 2012,” International Journal of Cancer, vol. 136,pp. E359–E386, 2015.
[2] W. J. Blot, S. S. Devesa, R. W. Kneller, and J. F. Fraumeni Jr.,“Rising incidence of adenocarcinoma of the esophagus andgastric cardia,”The Journal of the AmericanMedical Association,vol. 265, no. 10, pp. 1287–1289, 1991.
[3] M. J. Blaser and D. Saito, “Trends in reported adenocarcinomasof the oesophagus and gastric cardia in Japan,”European Journalof Gastroenterology & Hepatology, vol. 14, no. 2, pp. 107–113,2002.
[4] H.-J. Lee, H.-K. Yang, and Y.-O. Ahn, “Gastric cancer in Korea,”Gastric Cancer, vol. 5, no. 3, pp. 177–182, 2002.
[5] L. M. Brown and S. S. Devesa, “Epidemiologic trends inesophageal and gastric cancer in the United States,” SurgicalOncology Clinics of North America, vol. 11, no. 2, pp. 235–256,2002.
[6] C. Kusano, T. Gotoda, C. J. Khor et al., “Changing trendsin the proportion of adenocarcinoma of the esophagogastricjunction in a large tertiary referral center in Japan,” Journal ofGastroenterology and Hepatology, vol. 23, no. 11, pp. 1662–1665,2008.
[7] S. Hasegawa and T. Yoshikawa, “Adenocarcinoma of the esoph-agogastric junction: Incidence, characteristics, and treatmentstrategies,” Gastric Cancer, vol. 13, no. 2, pp. 63–73, 2010.
[8] H. S. Ahn, H.-J. Lee, M.-W. Yoo et al., “Changes in clinicopatho-logical features and survival after gastrectomy for gastric cancer
Journal of Oncology 13
over a 20-year period,” British Journal of Surgery, vol. 98, no. 2,pp. 255–260, 2011.
[9] S. S. Devesa,W. J. Blot, and J. F. Fraumeni Jr., “Changing patternsin the incidence of esophageal and gastric carcinoma in theUnited States,” Cancer, vol. 83, no. 10, pp. 2049–2053, 1998.
[10] L. B. D. Costa, M. G. Toneto, and L. F. Moreira, “Do proxi-mal and distal gastric tumours behave differently?” BrazilianArchives of Digestive Surgery, vol. 29, no. 4, pp. 232–235, 2016.
[11] Y. Maehara, S. Moriguchi, Y. Kakeji et al., “Prognostic factors inadenocarcinoma in the upper one-third of the stomach,” PrSurgGynecol Obstet, vol. 173, pp. 223–226, 1991.
[12] J. C. Park, Y. C. Lee, J.-H. Kim et al., “Clinicopathologicalfeatures and prognostic factors of proximal gastric carcinomain a population with high helicobacter pylori prevalence: Asingle-center, large-volume study in Korea,” Annals of SurgicalOncology, vol. 17, no. 3, pp. 829–837, 2010.
[13] X. Yu, F. Hu, C. Li, Q. Yao, H. Zhang, and Y. Xue, “Clinicopatho-logic characteristics and prognosis of proximal anddistal gastriccancer,” OncoTargets andTherapy, vol. 11, pp. 1037–1044, 2018.
[14] K. Liu, W. Zhang, X. Chen et al., “Comparison on Clinico-pathological Features and Prognosis between EsophagogastricJunctional Adenocarcinoma (Siewert II/III Types) and DistalGastric Adenocarcinoma: Retrospective Cohort Study, a Sin-gle Institution, High Volume Experience in China,” Medicine(United States), vol. 94, no. 34, p. e1386, 2015.
[15] F. Pacelli, V. Papa, P. Caprino, A. Sgadari, M. Bossola, and G.B. Doglietto, “Proximal compared with distal gastric cancer:Multivariate analysis of prognostic factors,” The AmericanSurgeon, vol. 67, no. 7, pp. 697–703, 2001.
[16] J. Pinto-de-Sousa, L. David, M. Seixas, and A. Pimenta, “Clini-copathologic profiles and prognosis of gastric carcinomas fromthe cardia, fundus/body and antrum,” Digestive Surgery, vol. 18,no. 2, pp. 102–110, 2001.
[17] P. Piso, U. Werner, H. Lang, P. Mirena, and J. Klempnauer,“Proximal versus distal gastric carcinoma - What are thedifferences?” Annals of Surgical Oncology, vol. 7, no. 7, pp. 520–525, 2000.
[18] J. R. Siewert, K. Bottcher, H. J. Stein, J. D. Roder, and R. Busch,“Problem of proximal third gastric carcinoma,” World Journalof Surgery, vol. 19, no. 4, pp. 523–531, 1995.
[19] K. Higuchi, W. Koizumi, S. Tanabe, K. Saigenji, and J. A. Ajani,“Chemotherapy is more active against proximal than distalgastric carcinoma,” Oncology, vol. 66, no. 4, pp. 269–274, 2004.
[20] M. Norouzinia, H. Asadzadeh, H. M. Shalmani, D. A. Dulaimi,andM. R. Zali, “Clinical and histological indicators of proximaland distal gastric cancer in eight provinces of Iran,”Asian PacificJournal of Cancer Prevention, vol. 13, no. 11, pp. 5677–5679, 2012.
[21] Q. Huang, C. Fang, J. Shi et al., “Differences in clinicopathologyof early gastric carcinoma between proximal and distal locationin 438 chinese patients,” Scientific Reports, vol. 5, no. 1, 2015.
[22] R. J. Kalish, P. E. Clancy, M. B. Orringer, and H. D. Appel-man, “Clinical, Epidemiologic and Morphologic ComparisonBetween Adenocarcinomas Arising in Barrett’s EsophagealMucosa and in the Gastric Cardia,” Gastroenterology, vol. 86,no. 3, pp. 461–467, 1984.
[23] H. Zeng, W. Chen, R. Zheng et al., “Changing cancer survivalin China during 2003–15: a pooled analysis of 17 population-based cancer registries,”The Lancet Global Health, vol. 6, no. 5,pp. e555–e567, 2018.
[24] X.-N. Zou, “Epidemic trend, screening, and early detection andtreatment of cancer in Chinese population,” Cancer Biology &Medicine, vol. 14, no. 1, pp. 50–59, 2017.
[25] Y.-W. Kim, Y. H. Baik, Y. H. Yun et al., “Improved quality of lifeoutcomes after laparoscopy-assisted distal gastrectomy for earlygastric cancer: Results of a prospective randomized clinicaltrial,” Annals of Surgery, vol. 248, no. 5, pp. 721–727, 2008.
[26] P. K. Stotland, S. Chia, J. Cyriac, J. A. Hagen, and L.V. Klein, “Safe implementation of laparoscopic gastrectomyin a community-based general surgery practice,” SurgicalEndoscopy, vol. 23, no. 2, pp. 356–362, 2009.
[27] S. Chon, F. Berlth, P. S. Plum et al., “Gastric cancer treatmentin the world: Germany,” Translational Gastroenterology andHepatology, vol. 2, no. 5, pp. 53-53, 2017.
[28] Z. Song, Y. Wu, J. Yang, D. Yang, and X. Fang, “Progress in thetreatment of advanced gastric cancer,” Tumor Biology, vol. 39,no. 7, Article ID 101042831771462, 2017.
[29] R. Giampieri, M. Del Prete, L. Cantini et al., “Optimal man-agement of resected gastric cancer,” Cancer Management andResearch, vol. 10, pp. 1605–1618, 2018.

Stem Cells International
Hindawiwww.hindawi.com Volume 2018
Hindawiwww.hindawi.com Volume 2018
MEDIATORSINFLAMMATION
of
EndocrinologyInternational Journal of
Hindawiwww.hindawi.com Volume 2018
Hindawiwww.hindawi.com Volume 2018
Disease Markers
Hindawiwww.hindawi.com Volume 2018
BioMed Research International
OncologyJournal of
Hindawiwww.hindawi.com Volume 2013
Hindawiwww.hindawi.com Volume 2018
Oxidative Medicine and Cellular Longevity
Hindawiwww.hindawi.com Volume 2018
PPAR Research
Hindawi Publishing Corporation http://www.hindawi.com Volume 2013Hindawiwww.hindawi.com
The Scientific World Journal
Volume 2018
Immunology ResearchHindawiwww.hindawi.com Volume 2018
Journal of
ObesityJournal of
Hindawiwww.hindawi.com Volume 2018
Hindawiwww.hindawi.com Volume 2018
Computational and Mathematical Methods in Medicine
Hindawiwww.hindawi.com Volume 2018
Behavioural Neurology
OphthalmologyJournal of
Hindawiwww.hindawi.com Volume 2018
Diabetes ResearchJournal of
Hindawiwww.hindawi.com Volume 2018
Hindawiwww.hindawi.com Volume 2018
Research and TreatmentAIDS
Hindawiwww.hindawi.com Volume 2018
Gastroenterology Research and Practice
Hindawiwww.hindawi.com Volume 2018
Parkinson’s Disease
Evidence-Based Complementary andAlternative Medicine
Volume 2018Hindawiwww.hindawi.com
Submit your manuscripts atwww.hindawi.com