Embed Size (px)
Citation preview

CAUTION: Federal law restrictsthis device to sale by or on theorder of a physician trained orexperienced in device implantand follow-up procedures.
CRT OPTIMIZATION ALGORITHMCLINICAL SUMMARY

Boston Scientific Corporation acquired Guidant Corporation in April 2006. During our transition period, you may see both the Boston Scientific and Guidant names on product and patient materials. As we work through the transition, we will continue to offer doctors and their patients technologically advanced and high quality medical devices and therapies.

TABLE OF CONTENTS
Summary . . . . . . . . . . . . . . . . . . . . . . . . . . . . . . . . . . . . . . . . . . . . . . . . . . . . . . . . . . . . . . . . . 1
Study Design . . . . . . . . . . . . . . . . . . . . . . . . . . . . . . . . . . . . . . . . . . . . . . . . . . . . . . . . . . . . . . 2
Glossary of Terms . . . . . . . . . . . . . . . . . . . . . . . . . . . . . . . . . . . . . . . . . . . . . . . . . . . . . . 2
Methods . . . . . . . . . . . . . . . . . . . . . . . . . . . . . . . . . . . . . . . . . . . . . . . . . . . . . . . . . . . . . . 2
Inclusion/Exclusion Criteria . . . . . . . . . . . . . . . . . . . . . . . . . . . . . . . . . . . . . . . . . . . . . . . 3Pressure Test . . . . . . . . . . . . . . . . . . . . . . . . . . . . . . . . . . . . . . . . . . . . . . . . . . . . . . . 3Echocardiographic Test . . . . . . . . . . . . . . . . . . . . . . . . . . . . . . . . . . . . . . . . . . . . . . . 4Key Data Analyses . . . . . . . . . . . . . . . . . . . . . . . . . . . . . . . . . . . . . . . . . . . . . . . . . . . 5
Results . . . . . . . . . . . . . . . . . . . . . . . . . . . . . . . . . . . . . . . . . . . . . . . . . . . . . . . . . . . . . . . . . . 6Patient Accountability . . . . . . . . . . . . . . . . . . . . . . . . . . . . . . . . . . . . . . . . . . . . . . . . . 6Patient Characteristics . . . . . . . . . . . . . . . . . . . . . . . . . . . . . . . . . . . . . . . . . . . . . . . . 6LV dP/dtmax Results . . . . . . . . . . . . . . . . . . . . . . . . . . . . . . . . . . . . . . . . . . . . . . . . . . 7AoVTI Results . . . . . . . . . . . . . . . . . . . . . . . . . . . . . . . . . . . . . . . . . . . . . . . . . . . . . . 9AV Delay Results . . . . . . . . . . . . . . . . . . . . . . . . . . . . . . . . . . . . . . . . . . . . . . . . . . . 11Conclusions . . . . . . . . . . . . . . . . . . . . . . . . . . . . . . . . . . . . . . . . . . . . . . . . . . . . . . . 15

1
SUMMARY OF THE CRT OPTIMIZATION ALGORITHM VALIDATION STUDY
SUMMARY
NOTE: The SmartDelay optimization feature was previously known as Expert Ease for Heart Failure (EEHF+). In addition, SmartDelay can take the LV Offset into account.
This clinical investigation was a 50-patient, multi-center, acute hemodynamic study at five centers in the United States to validate the performance of Expert Ease for Heart Failure AV delay optimization algorithm (EEHF+1). The EEHF+ algorithm recommends sensed and paced AV delay values based on each patient’s electrical conduction characteristics, in an effort to maximize global left ventricular contractile function as measured by LV dP/dtmax.
The main purposes of this clinical investigation were: (A) to test prospectively the efficacy of EEHF+ in optimizing global contractile function as measured by LV dP/dtmax (maximum rate of LV pressure change) for biventricular (BV) CRT in atrial sensing and pacing modes; and (B) to evaluate and compare contractile function (LV dP/dtmax) and stroke volume (as measured by AoVTI2) at AV delays determined by several CRT optimization methods (EEHF+ and echocardiographic techniques), and also by a series of fixed AV delay values for BV CRT in atrial sensing and pacing modes.
While this study provides comparisons between multiple optimization methods, a standard method for optimizing AV delay has not been previously established. In addition, the degree to which AV delay can be altered from an optimal setting without degrading cardiac performance has not been established.
1. From this point on, Expert Ease for Heart Failure AV delay optimization algorithm is referred as EEHF+.
2. Otto CM, Pearlman AS, Comess K, Reamer R, Janko C, Huntsman L. Determination of the stenotic aortic valve area in adults using Doppler echocardiography. J Am Coll Cardiol 1986;7:509-17.

SUMMARY OF THE CRT OPTIMIZATION ALGORITHM VALIDATION STUDYSTUDY DESIGN
2
STUDY DESIGN
Glossary of Terms
AoVTI (aortic velocity-time integral)A surrogate measure of stroke volume determined via echocardiography of blood flow through the aortic valve.
LV dP/dtmaxAn index for global left ventricular contractile function and pumping efficiency1,2, as defined by the maximum rate of LV pressure change during systole.
Pressure test (i.e., invasive hemodynamic test)Collection of LV pressure during the implant procedure using invasive pressure catheters.
% change in AoVTIChange in stroke volume during pacing compared to baseline intrinsic beats.
% change in LV dP/dtmaxChange in LV dP/dtmax during pacing compared to baseline intrinsic beats.
Methods
The study consisted of the following: a standard implant of a CRT device and pacing leads, the pressure test (during implant), and a non-invasive echo test. In the pressure test, the LV pressure data was collected invasively at pre-specified stimulation mode/site/AV delay combinations during the CRT/CRT-D device implant procedure. A standard non-invasive echo test was performed an average of 9 days (range 0 to 60 days) after the pressure test and implant.
1. Auricchio A, Stellbrink C, Block M, Sack S, Vogt J, Bakker P, Klein H, Kramer A, Ding J, Salo R, Tockman B, Pochet T, Spinelli J. Effect of pacing chamber and atrioventricular delay on acute systolic function of paced patients with congestive heart failure. The Pacing Therapies for Congestive Heart Failure Study Group. The Guidant Congestive Heart Failure Research Group. Circulation 1999;99:2993-3001.
2. Kass DA, Chen CH, Curry C, Talbot M, Berger R, Fetics B, Nevo E. Improved left ventricular mechanics from acute VDD pacing in patients with dilated cardiomyopathy and ventricular conduction delay. Circulation 1999;99:1567-73.

SUMMARY OF THE CRT OPTIMIZATION ALGORITHM VALIDATION STUDYSTUDY DESIGN
3
Inclusion/Exclusion Criteria
Patients enrolled in this study were required to meet the criteria for a CRT/CRT-D device implant at the time of implant (Sept 2003 - Oct 2004).
Patients were excluded from the study if they met any of the following criteria:
• Patients in AF that cannot be cardioverted for the study
• Sustained, uncontrolled ventricular tachycardia
• Frequent ectopic activity that makes stable hemodynamic measurements infeasible
• Sinus rhythm < 30 bpm or >100 bpm
• Complete AV node block
• Acute severe heart failure exacerbation
• Severe aortic valvular stenosis (valve area < 1.0 square cm)
• Hypertrophic obstructive cardiomyopathy
• CABG within 2 weeks
• Congenital heart disease
• Pregnancy
• Patient involved in other clinical investigations of active therapy or treatment
• Patient at unacceptably high risk for catheterization (a patient who would not medically be indicated for an EP study or diagnostic catheterization)
Pressure Test
Each patient underwent standard catheterization procedure for implanting a CRT/CRT-D device. A standard pacing lead was placed in the right atrium, a second in the right ventricle, and a third placed via the coronary venous system on the epicardial surface of the left ventricle. Following lead placement, an additional

SUMMARY OF THE CRT OPTIMIZATION ALGORITHM VALIDATION STUDYSTUDY DESIGN
4
disposable pressure catheter (Millar Instruments, Inc) was placed inside the LV chamber, and the pacing protocol for the pressure test was performed.
BV pacing was performed in atrial sensing and atrial pacing modes at four equally spaced AV delays, which were preset to percentages of the patient's intrinsic AV interval. Each combination of atrial mode and AV delay was randomly repeated four times, as sequences of 14 non-paced beats followed by 6 paced beats. The randomized repetitions were designed to minimize the variability in LV dP/dtmax measurements due to respiration.
At the end of the pressure test (during the same operative procedure), the Millar catheter was removed. The CRT device implantation continued according to standard clinical practice. The lead positions determined prior to the invasive pressure test were maintained as the permanent lead positions.
Calculating % change in LV dP/dtmax from pressure test
The % change in LV dP/dtmax was calculated as follows:
The LV dP/dtmax for each beat was averaged over the last four paced beats and compared to an average of the immediately preceding six non-stimulated beats (“baseline”) to yield the % change in LV dP/dtmax. The % change values for all four repetitions with the same AV delay (4 beats per repetition x 4 repetitions = 16 values for % change in LV dP/dtmax) were then averaged to determine a single value of % change in LV dP/dtmax for that AV delay. A third order polynomial curve was fit to the % change in LV dP/dtmax values at the four equally spaced AV delays.
The % change in LV dP/dtmax curve was then used to derive the maximum achievable % change in LV dP/dtmax, and the corresponding AV delay was designated as the optimal AV delay defined by the pressure test. This curve was also used to derive the % change in LV dP/dtmax at fixed AV delays (100 ms, 120 ms, 140 ms, 160 ms), and at the AV delays recommended by EEHF+, Ritter and Aortic Velocity-Time Integral (AoVTI).
Echocardiographic Test
A standard non-invasive echo test was used to collect Doppler flow-velocity profiles from aortic, mitral, and pulmonary valves during BV CRT for each atrial mode and 9 AV delay combinations (8 fixed AV delays ranging from 60 to 200 ms at 20 ms increments and the EEHF+ recommended AV delay). From the echo test results, AV delay recommendations using the Ritter and AoVTI methods were determined. The Ritter method used Doppler-derived mitral inflow measured at the time interval from

SUMMARY OF THE CRT OPTIMIZATION ALGORITHM VALIDATION STUDYSTUDY DESIGN
5
pacing inflection to mitral valve closure at long (160 ms for AS and 200 ms for AP) and short AV delays (60 ms) to calculate the optimal AV delay. The AoVTI method used flow velocity profiles from the aortic valve and recommended the AV delay at which the AoVTI was maximized.
Calculating % change in AoVTI from echocardiographic test
The % change in AoVTI was calculated as follows:
The AoVTI values for each beat were determined by continuous wave Doppler recording of the aortic flow velocity envelope for the nine tested AV delays and two atrial modes. Beat-by-beat AoVTI values were averaged from three to five cardiac cycles for each tested AV delay and for the intrinsic baseline. The % change in AoVTI was calculated as the percentage change during pacing from the baseline established by the non-stimulation beats.
The % change in AoVTI was calculated at the following AV delays: 100 ms, 120 ms, 140 ms, 160 ms and the AV delay recommended by EEHF+. The % change in AoVTI at the Ritter AV delay was either measured (if the Ritter AV delay was equal to one of the nine AV delays during the echo test) or derived (by linear interpolation of the AoVTI values between the nine AV delays). The AoVTI-recommended AV delay was defined as the AV delay with the largest % change in AoVTI among the nine directly measured AV delays; therefore, it was a directly measured value.
Key Data Analyses
As there is no standard for comparing optimization methods, the following comparisons were made:
% change in LV dP/dtmax at the AV delay recommended by:
EEHF+ vs. pressure tests vs. echo test
% change in AoVTI at the AV delay recommended by:
EEHF+ vs. echo test
Value of AV delay recommended by:
EEHF+ vs. pressure tests vs. echo test

SUMMARY OF THE CRT OPTIMIZATION ALGORITHM VALIDATION STUDYRESULTS
6
Note that pressure data and echocardiographic data were not necessarily collected on the same day. On implant day, pressure tests were performed (% change in LV dP/dtmax was measured) and EEHF+ recommended AV delay was determined. Echo test was performed on a different day for majority of patients, where echo-recommended AV delays and % change in AoVTI were determined. The % change in LV dP/dtmax was not directly measured during the echo test but was derived from the % change in LV dP/dtmax curve obtained on the implant day.
RESULTS
Patient Accountability
Fifty patients were enrolled in the study. Forty-one patients had valid pressure tests completed and thirty-eight patients had valid echo tests completed. Among the 9 patients with invalid pressure tests, 7 were attempts, and 2 completed the pressure test but with invalid results (one of them had an unstable atrial rate and the other had 2:1 AV conduction). A valid echo test was defined as a subject who had a valid pressure test and also completed the echo test.
Patient Characteristics
Table 1. Subject Demographics
Characteristic Measurement Result
Age at Implant Number of subjects 50
Mean ± SD 68.1 ± 10.5
Range [47.0, 85.0]
Gender [N (%)] Female 12 (24.0)
Male 38 (76.0)
NYHA Class [N (%)] II 1 (2.0)
III 49 (98.0)
LVEF Number of subjects 50
Mean ± SD 26.6 ± 6.6
Range [5.0, 35.0]
Conduction Disorder LBBB 38 (86.4)
RBBB 12 (27.3)

SUMMARY OF THE CRT OPTIMIZATION ALGORITHM VALIDATION STUDYRESULTS
7
LV dP/dtmax Results
Correlation between the LV dP/dtmax at the EEHF+ recommended AV delay and maximum achievable LV dP/dtmax
For the regression analysis in Figure 1, the 95% confidence intervals of the regression slope were (0.98, 1.07) and (0.94, 1.10) for atrial sensing and pacing. The 95% confidence intervals for the corresponding intercept values were (-2.07, -0.86) and (-3.73, -0.76) for atrial sensing and pacing. The ability of EEHF+ to suggest an AV delay that maximizes % change in LV dP/dtmax for both atrial sensing and atrial pacing is demonstrated in the regression plots. The % change in LV dP/dtmax at the AV delay recommended by EEHF+ was close to the maximum achievable % change in LV dP/dtmax for all patients.
Figure 1. The scatter plots compare % change in LV dP/dtmax at the AV delay setting recommended by EEHF+ to the maximum achievable % change in LV dP/dtmax determined empirically. Data were obtained during atrial sensing (left, n=38) and atrial pacing (right, n=36).
Comparison of EEHF+ recommended AV delay to fixed AV delays of 100 ms, 120 ms, 140 ms, and 160 ms in achieving LV dP/dtmax
In Figure 2, differences between the % change in LV dP/dtmax achieved with AV delays recommended by EEHF+ and the % change in LV dP/dtmax achieved with fixed AV delays were plotted for each fixed AV delay.

SUMMARY OF THE CRT OPTIMIZATION ALGORITHM VALIDATION STUDYRESULTS
8
Figure 2. Differences between % change in LV dP/dtmax achieved with AV Delays recommended by EEHF+ and with fixed AV delays of 100 ms, 120 ms, 140 ms, and 160 ms for atrial sensing (left) and atrial pacing (right). A positive value indicated that the % change in LV dP/dtmax achieved with EEHF+ was higher. The square represents the mean and error bars represent 95% CI of mean. Note: The % change in LV dP/dtmax data were derived from the % change in LV dP/dtmax curve obtained during the pressure test.
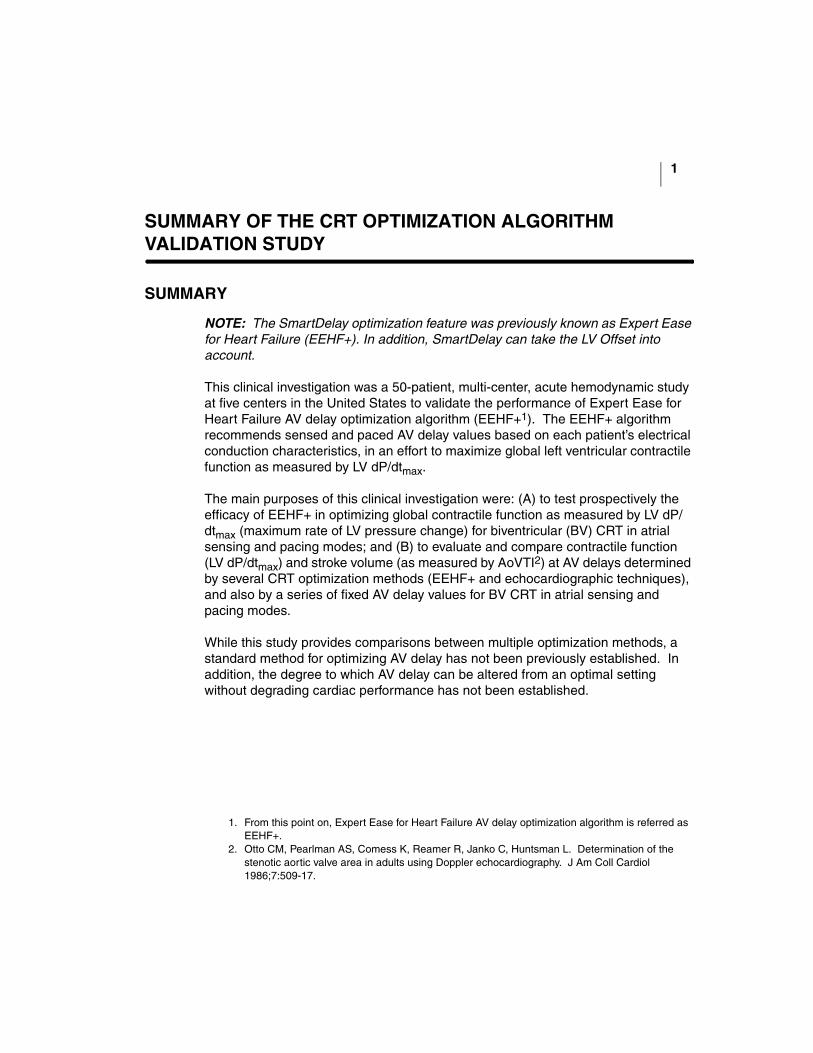
Comparison of EEHF+ recommended AV delay to the echo-based Ritter and AoVTI methods in achieving LV dP/dtmax
In Figure 3, differences between the % change in LV dP/dtmax achieved with AV delays recommended by EEHF+ and the % change in LV dP/dtmax achieved with the Ritter and AoVTI echo methods were plotted for the two echo methods.
SUMMARY OF THE CRT OPTIMIZATION ALGORITHM VALIDATION STUDYRESULTS
9
Figure 3. Differences between % change in LV dP/dtmax achieved with AV Delays recommended by EEHF+ and with AV delays recommended by two echo-based methods: the Ritter method and the AoVTI method for atrial sensing (left) and atrial pacing (right). A positive value indicated that the % change in LV dP/dtmax achieved with EEHF+ was higher. The square represents the mean and error bars represent 95% CI of mean.Note: The % change in LV dP/dtmax data were derived from the % change in LV dP/dtmax curve obtained during the pressure test. The pressure test and the echo test were performed at different times.
AoVTI Results
There was a large variance in the difference in % change in AoVTI achieved by all the methods evaluated in this study, which is consistent with the inherent variability of the AoVTI measurements.
Comparison of EEHF+ recommended AV delay to fixed AV delays of 100 ms, 120 ms, 140 ms, and 160 ms in achieving AoVTI
In Figure 4, differences between the % change in AoVTI achieved with AV delays recommended by EEHF+ and the % change in AoVTI achieved with fixed AV delays were plotted for each fixed AV delay.

SUMMARY OF THE CRT OPTIMIZATION ALGORITHM VALIDATION STUDYRESULTS
10
Figure 4. Differences between % change in AoVTI achieved with AV delays recommended by EEHF+ and with fixed AV delays of 100 ms, 120 ms, 140 ms, and 160 ms for atrial sensing (left) and atrial pacing (right). A positive value indicated that the % change in AoVTI achieved with EEHF+ was higher. The square represents the mean and error bars represent 95% CI of mean.
Comparison of EEHF+ recommended AV delay to echo-based Ritter and AoVTI methods in achieving AoVTI
In Figure 5, differences between the % change in AoVTI achieved with AV delays recommended by EEHF+ and the % change in AoVTI achieved with the Ritter and AoVTI methods are plotted.

SUMMARY OF THE CRT OPTIMIZATION ALGORITHM VALIDATION STUDYRESULTS
11
Figure 5. Differences between % change in AoVTI achieved with AV delays recommended by EEHF+ and AV delays recommended by the echo-based Ritter and AoVTI methods. A positive value indicated that the % change in AoVTI achieved with EEHF+ was higher. The square represents the mean and error bars represent 95% CI of mean.
AV Delay Results
Accuracy of AV delays
Figure 6 compares the accuracy of each method in recommending AV delays with respect to the AV delay optimized using the % change in LV dP/dtmax. The sensing and pacing AV delays calculated by the EEHF+ had the smallest root mean square errors compared to all the other AV delay programming methods.
This demonstrated that the EEHF+ AV delays were the closest to the AV delay optimized using % change in LV dP/dtmax.

SUMMARY OF THE CRT OPTIMIZATION ALGORITHM VALIDATION STUDYRESULTS
12
Figure 6. Root mean square error (RMSE) (in ms) represents the average difference between the AV delays recommended by the different methods (in x-axis) and the AV delay optimized using the % change in LV dP/dtmax. Smaller RMSE values for EEHF+ demonstrate that EEHF+ AV delays are closest to AV delay optimized using the % change in LV dP/dtmax.Note: The AV delay optimized using % change in LV dP/dtmax data was derived from the % change in LV dP/dtmax curve obtained from the pressure test. The pressure test and the echo test were performed at different times.
Comparison of the AV delays recommended by EEHF+, pressure test and echo (AoVTI) methods
The correlation analysis between the AV delays recommended by the three AV delay methods is presented below:
Figure 7 shows the correlation between the AV delay recommended by the pressure test and AV delay recommended by EEHF+ for atrial sensing (left) and atrial pacing (right). The 95% confidence intervals of the regression slope were (0.43, 0.83) and (0.37, 0.71) for atrial sensing and pacing. The 95% confidence intervals for the corresponding intercept values were (25.30, 82.87) and (42.13, 115.25) for atrial sensing and pacing. AV delay recommended by Pressure test = AV delay optimized using % change in LV dP/dtmax.
Figure 8 shows the correlation between the AV delay recommended by echo test (AoVTI) and AV delay recommended by EEHF+ for atrial sensing (left) and atrial pacing (right). The 95% confidence intervals of the regression slope were (-0.04, 0.86) and (0.00, 0.84) for atrial sensing and pacing. The 95% confidence intervals

SUMMARY OF THE CRT OPTIMIZATION ALGORITHM VALIDATION STUDYRESULTS
13
for the corresponding intercept values were (32.60, 147.04) and (52.48, 194.47) for atrial sensing and pacing.
Figure 9 shows the correlation between the AV delay recommended by the pressure test and AV delay recommended by echo test (AoVTI) for atrial sensing (left) and atrial pacing (right). The 95% confidence intervals of the regression slope were (0.07, 0.47) and (0.06, 0.45) for atrial sensing and pacing. The 95% confidence intervals for the corresponding intercept values were (59.17, 117.30) and (70.98, 154.14) for atrial sensing and pacing. AV delay recommended by Pressure test = AV delay optimized using % change in LV dP/dtmax.
Figure 7. Scatter plots between AV delay recommended by the pressure test and EEHF+. Note: AV delay recommended by the pressure test was derived from the % change in LV dP/dtmax curve obtained from the pressure test.

SUMMARY OF THE CRT OPTIMIZATION ALGORITHM VALIDATION STUDYRESULTS
14
Figure 8. Scatter plots between AV delay recommended by echo test (AoVTI) and EEHF+. Note: The pressure test and the echo test were performed at different times.
Figure 9. Scatter plots between AV delay recommended by pressure test and echo test (AoVTI).Note: AV delay recommended by the pressure test was derived from the % change in LV dP/dtmax curve obtained from the pressure test. The pressure test and the echo test were performed at different times.

SUMMARY OF THE CRT OPTIMIZATION ALGORITHM VALIDATION STUDYRESULTS
15
Conclusions
The results of the CRT Optimization Algorithm Validation Study are summarized as follows:
• The EEHF+ algorithm recommended AV delays that maximized global contractile function as measured by % change in LV dP/dtmax.
• The EEHF+ algorithm recommended an AV delay that increased acute hemodynamic responses in terms of % change in LV dP/dtmax, as compared to fixed AV delays of 100 ms, 120 ms, 140 ms or 160 ms.
• The EEHF+ algorithm recommended an AV delay that increased acute hemodynamic responses in terms of % change in LV dP/dtmax, as compared to AV delay recommended by Ritter method.
• The AV delay settings recommended by EEHF+, pressure test, and echo methods may vary in comparison to one another.

SUMMARY OF THE CRT OPTIMIZATION ALGORITHM VALIDATION STUDYRESULTS
16

© 2011 Boston Scientific or its affiliates
All Rights Reserved.
358487-003 EN US 01/11
*358487-003*
Boston Scientific
4100 Hamline Avenue North
St. Paul, MN 55112-5798 USA
www.bostonscientific.com
1.800.CARDIAC (227.3422)
+1.866.484.3268
Manufacturer