Embed Size (px)
Citation preview
CENTER FOR DRUG EVALUATION AND RESEARCH
APPLICATION NUMBER: 22-465
CLINICAL PHARMACOLOGY AND BIOPHARMACEUTICS REVIEW(S)
1
Clinical Pharmacology Review NDA 22-465 Submission Date: 19 December 2008 Brand Name: VOTRIENT TM Generic Name: Pazopanib (GW786034) Formulation: 200 and 400 mg tablets OCP Reviewers: Bahru A Habtemariam, Pharm.D IRT Scientific Lead: Christine Garnett, Ph.D. OCP Team Leader: Brian Booth, Ph.D. Pharmacometrics Team Leader: Christoffer Tornoe, Ph.D. Genomics Reviewer: Rosane Charlab Orbach, Ph.D. Genomics Team Leader: Issam Zineh, Pharm.D., MPH OCP Division: Division of Clinical Pharmacology V ORM Division: Division of Drug Oncology Products Sponsor: GlaxoSmithKline Submission Type; Code: Original NDA; 0000 Dosing regimen: 800 mg once daily Indications Advanced Renal Cell Carcinoma
Table of contents 1 Executive Summary .........................................................................................................................4
1.1 Recommendations ...............................................................................................................4 1.2 Clinical Pharmacology Summary........................................................................................6
2 Question Based Review ...................................................................................................................7 2.1 General Attributes ...............................................................................................................7
2.1.1 What are the highlights of the chemistry and physical-chemical properties of the drug substance and the formulation of the drug product as they relate to clinical pharmacology and biopharmaceutics review?............7
2.1.2 What are the proposed mechanisms of action and therapeutic indications?........................................................................................................7
2.1.3 What are the proposed dosage and route of administration?.............................8 2.2 General Clinical Pharmacology...........................................................................................8
2.2.1 What are the design features of the clinical pharmacology and clinical studies used to support dosing or claims? .........................................................8
2.2.2 What is the basis for selecting the response endpoints or biomarkers and how are they measured in clinical pharmacology and clinical studies? ..........11
2.2.3 Are the active moieties in the plasma (or other biological fluid) appropriately identified and measured to assess pharmacokinetic parameters and exposure response relationships? ...........................................13
2.2.4 Exposure-response...........................................................................................13 2.2.5 Pharmacokinetic characteristics of the drug and its major metabolites...........20
2.3 Intrinsic Factors.................................................................................................................25 2.3.1 What intrinsic factors (age, gender, race, weight, height, disease, genetic
polymorphism, pregnancy, and organ dysfunction) influence exposure (PK usually) and/or response, and what is the impact of any differences in exposure on efficacy or safety responses? ..................................................25
2.3.2 Based upon what is known about exposure-response relationships and their variability and the groups studied, healthy volunteers vs. patients
2
vs. specific populations, what dosage regimen adjustments, if any, are recommended for each of these groups? If dosage regimen adjustments are not based upon exposure-response relationships, describe the alternative basis for the recommendation. .......................................................25
2.4 Extrinsic Factors................................................................................................................30 2.4.1 What extrinsic factors (drugs, herbal products, diet, smoking, and
alcohol use) influence dose-exposure and/or -response and what is the impact of any differences in exposure on response? .......................................30
2.4.2 Drug-drug interactions ....................................................................................30 2.5 General Biopharmaceutics.................................................................................................37
2.5.1 Based on BCS principles, in what class is this drug and formulation? What solubility, permeability and dissolution data support this classification? ..................................................................................................37
2.5.2 What is the composition of the to-be-marketed formulation? .........................38 2.5.3 What is the in vivo relationship of the proposed to-be-marketed
formulation to the pivotal clinical trial formulation? ......................................40 2.5.4 What moieties should be assessed in bioequivalence studies?........................41 2.5.5 What is the effect of food on the bioavailability (BA) of the drug from
the dosage form? What dosing recommendation should be made, if any, regarding administration of the product in relation to meals or meal types?...............................................................................................................41
2.5.6 Has the applicant developed an appropriate dissolution method and specification that will assure in vivo performance and quality of the product? ...........................................................................................................41
2.6 Analytical Section .............................................................................................................42 2.6.1 Were relevant metabolite concentrations measured in the clinical
pharmacology and biopharmaceutics studies? ................................................42 2.6.2 Were the analytical procedures used to determine drug concentrations in
this NDA acceptable? ......................................................................................42 3 Detailed Labeling Recommendations ............................................................................................43 4 Appendices .........................................................................................................................................
4.1 Appendix 1 - Pharmacometrics Review ................................................................................ 4.2 Appendix 2 - Genomics Group Review ................................................................................ 4.2 Appendix 3 - Sponsor's proposed labeling ............................................................................
List of Tables
Table 1. Studies supporting the clinical pharmacology and biopharmaceutics of pazopanib................8 Table 2. PFS of the intent to treat (ITT) Population per independent review committee (IRC)
Assessment ...................................................................................................................................11 Table 3. Kaplan-Meier estimates of overall survival using interim data (ITT Population) ..................12 Table 4. Study VEG10003 patient and dosing information..................................................................13 Table 5. Summary of single dose (day 1) and multiple dose (day 22) pazopanib plasma concentrations
from phase 3 study (VEG105192). ..............................................................................................15
3
Table 6. Summary of subjects with grade 2 or higher increases in ALT, ALT, and total bilirubin study VEG10003....................................................................................................................................18
Table 7. Dose proportionality characteristics of pazopanib following day 1 and day 22 doses. ..........20 Table 8. Pazopanib AUC ratio following single (day 1) and multiple (day 22) dose administration...21 Table 9. Cumulative percentages of recovered radioactivity in, feces, urine, and total........................22 Table 10. Time dependence assessment of pazopanib following single dose (day 1) and chronic dose
(day 22) pazopanib administration...............................................................................................24 Table 11. Pazopanib population PK parameter estimates .....................................................................25 Table 12. Definition and stratification of hepatic function groups in study NCI 8065. .......................26 Table 13. Interim results of study NCI 8063 showing the influence of hepatic function on pazopanib
PK.................................................................................................................................................27 Table 14. In vitro P450 enzyme inhibition potentials of pazopanib ....................................................32 Table 15. Cmax:IC50 ratio for the in vitro P450 enzyme inhibition study. ..........................................32 Table 16. CYP (1A2, 2B6, and 3A4) induction assessment of pazopanib. ..........................................33 Table 17. Pharmacokinetics of ocular pazopanib in the absence (A) and presence (B) of ketocoanzole
......................................................................................................................................................34 Table 18. Pazopanib exposure in the absence and presence of lapatinib..............................................35 Table 19. CYP enzyme probes, doses, and analytes used in study VEG10007....................................35 Table 20. Effect of pazopanib on the metabolic activities of CYP (3A4, 2C9, 2C19, 1A2, and 2D6). 36 Table 21. PK Properties of Pazopanib in the absence and presence of probe P450 cocktail drugs......36 Table 22. Effect of pazopanib on paclitaxel clearance and Cmax. .......................................................37 Table 23. Permeability of Pazopanib across Caco-2 Cell Lines in the presence of P-gp inhibitor.......38 Table 24. Composition of phase 3 and proposed commercial
pazopanib tablets. .........................................................................................................................39 Table 25. Comparison of pazopanib PK following whole or crushed tablet dosing.............................40 Table 26. Difference and similarity factors for phase 3 and proposed commercial formulation of
pazopanib 200 and 400 mg tablets. ..............................................................................................40 Table 27. Effect of low and high fat food on pazopanib exposure. .....................................................41 Table 28. Summary of Bioanalytical methods for analytes in clinical pharmacology studies .............42
List of Figures Figure 1. PFS of Pazopanib and Placebo Treated Subjects ..................................................................12 Figure 2. Kaplan Meier plots for progression free survival stratified by placebo and quartiles of
pazopanib concentrations (Q1-Q4). .............................................................................................14 Figure 3. Probability of Grade 3+ ALT elevation vs. steady-state pazopanib trough concentrations. 15 Figure 4. Cumulative incidence of any grade ALT/AST elevations from baseline .............................16 Figure 5. QTcF change from baseline vs. pazopanib concentrations...................................................17 Figure 6. Proportion of responders vs. pazopanib dose. .......................................................................18 Figure 7. Probability of clinical response vs. steady-state trough pazopanib concentrations. .............19 Figure 8. Probability of Study-Specific hypertension vs. trough concentration. ..................................19
(b) (4) (b) (4)
4
Figure 9. Pazopanib steady-state AUC vs. dose. Note: the red line circles represent slope for pazopanib (0.46), the black line shows a hypothetical slope of 1. ...............................................20
Figure 10. Proposed Pathways for the Metabolism of Pazopanib in humans .......................................23 Figure 11. Pazopanib clearance vs. creatinine clearance in patients with various cancers ..................26
1 EXECUTIVE SUMMARY
Pazopanib is an inhibitor of protein kinases associated with multiple growth factors that is being developed as a tablet formulation for the treatment of advanced renal cell carcinoma (RCC). Studies in healthy volunteers and in patients support the development of pazopanib.
To support the efficacy in advanced RCC, the sponsor conducted one randomized, controlled phase 3 study. Subjects in the phase 3 study were randomized to receive placebo or pazopanib at 800 mg once daily (qd). Median progression free survival (PFS), the primary endpoint, of the placebo and pazopanib treated patients was 4.2 and 9.2 months, respectively. Compared to placebo, pazopanib was efficacious in extending PFS in RCC patients. No exposure-response relationship was present between PFS and pazopanib trough concentrations. However, a clear exposure-response relationship was detected between ALT (alanine aminotransferase) and pazopanib trough concentrations.
Pazopanib has a bioavailability range of 14-39%, and absorption peaks at 2-8 hours post dose. Pazopanib is mainly metabolized by CYP3A4 and to a lesser extent by CYP1A2 and CYP2C8. In plasma, pazopanib metabolites accounted for less <10% of administered drug.
In a drug-drug interaction study using ocular pazopanib and oral ketocoanzole, pazopanib Cmax and AUC were increased 1.5- and 2.2-fold. When coadministered with lapatinib, a weak CYP3A4 inhibitor, pazopanib Cmax and AUC increased by 60% and 50 %. Enzyme inducing anti-convulsants decreased pazopanib AUC and Cmin by 30% and 50 %, respectively.
A food effect study was also performed using low and high fat meals. Low fat meals increased Cmax and AUC by 1.9 and 2.1-fold, whereas high fat meals increased Cmax and AUC by 2.1 and 2.3-fold. To minimize unintended over exposure, the sponsor proposes to administer pazopanib without food.
Finally, a pooled (phase I-III) pharmacogenetic analysis of alanine aminotransferase (ALT) and total bilirubin (TBL) elevations in pazopanib-treated patients was performed. Variation in the hemachromatosis gene (HFE) and UGT1A1 were associated with elevations in ALT and TBL, respectively. The UGT1A1-TBL association is supported by the inhibition of UGT1A1 in vitro by pazopanib.
1.1 RECOMMENDATIONS
The Office of Clinical Pharmacology/Division of Clinical Pharmacology 5 has reviewed the information contained in NDA 22-465. This NDA is considered acceptable from a clinical pharmacology perspective. Post Marketing Requirements
1. The applicant should conduct a drug-drug interaction study using oral pazopanib and a strong CYP3A4 inhibitor (e.g. ketocoanzole)
5
2. Submit the complete study report of the on going hepatic impairment study (Study NCI 8063 )
3. Submit the complete study report of the QT/QTc evaluation study (study VEG111485).
Post Marketing Commitment
1. In order to support appropriate dose modifications, you should develop a 100 mg formulation.
Comment to the sponsor
1. Due to the absence of an exposure-efficacy relationship within the 800 mg daily treated patients, and a clear exposure-toxicity relationship between pazopanib trough concentrations and ALT, a lower dose with superior safety and equivalent efficacy profile may be possible. We recommend that you consider conducting a study in renal cell carcinoma patients to identify an optimal dosing regimen that produces the highest progression free survival and the least liver enzyme elevations.
2. Angiogenesis related genes were not associated with pazopanib-induced changes in MAP. You should consider testing associations for SBP and DBP, independently.
Labeling Recommendations
Please refer to Section 3 - Detailed Labeling Recommendations
Reviewer: Bahru A Habtemariam, Pharm.D. Team Leader: Brian Booth, Ph.D. Division of Clinical Pharmacology 5 Division of Clinical Pharmacology 5 Cc: DDOP: CSO - K Robertson; MTL - E Maher; MO - M Ning DCP-5: Reviewers - B Habtemariam, TL - B Booth, PM TL - C Tornoe;
DDD - B Booth; DD - A Rahman
6
1.2 CLINICAL PHARMACOLOGY SUMMARY
Pazopanib is an ATP-competitive, second-generation inhibitor of tyrosine kinase activity associated with human VEGFR-1, -2 and -3, and platelet-derived growth factor receptor (PDGFR)-α, and -β, and stem cell factor receptor (c-KIT). A tablet formulation of pazopanib is being developed for the treatment of advanced renal cell carcinoma (RCC).
The sponsor conducted several phase 1 studies in healthy volunteers, subjects with advanced solid tumors, and patients with advanced renal cell carcinoma to evaluate the safety, pharmacokinetics, and efficacy of pazopanib. Pazopanib has a bioavailability range of 14-39% (n=3), with absorption peaking at approximately 2-8 hours. Pazopanib follows less than dose proportional PK, and the slope relating AUC and dose is approximately 0.5 over a dose range of 50 to 2000 mg once daily. After administration of radio-labeled pazopanib, 82% of the total radioactivity was eliminated in the feces, of which 67% was unchanged drug. In plasma, metabolites accounted for less <10% of administered drug. Pazopanib is primarily metabolized by CYP3A4 and to a lesser extent by CYP1A2 and CYP2C8. Pazopanib is also a substrate of P-glycoprotein (P-gp).
Drug-drug interaction studies show that CYP3A4 inhibitors increase pazopanib exposure. In a study using ocular pazopanib (0.4 mg) and oral ketocoanzole, pazopanib Cmax and AUC were increased 1.5- and 2.2-fold. However, because the proposed dose for advanced RCC indication is as a tablet formulation at 800 mg daily, 2000-fold higher than ocular formulation dose, the finding of drug-drug interaction study is inconclusive. In another study, when oral pazopanib at 800 mg was coadministered with the CYP3A4 inhibitor lapatinib, pazopanib Cmax and AUC increased by 60 and 50 %. Respectively, enzyme inducing anti-convulsants decreased pazopanib AUC and Cmin by 30 and 50 %, respectively.
An in vivo cocktail drug-drug interaction study using known enzyme probes showed that pazopanib is a weak inhibitor of CYP3A4 and CYP2D6 enzymes. Another in vivo study demonstrated the CYP3A4/CYP2C8 inhibition activity of pazopanib by increasing the Cmax and AUC of paclitaxel by 31 and 26%, respectively. An in vitro P450 enzyme induction study showed that pazopanib is a moderate inducer of CYP3A4 and CYP2B6. Therefore concomitant use of narrow therapeutic drugs that are substrates of CYP3A4, CYP2D6, CYP2B6, and CYP2C8 should be avoided.
Based on safety, pharmacological activity, and tumor response rate of phase 1 data, 800 mg qd was selected for further development. The sponsor then conducted a phase 3 study (VEG105192) in advanced RCC patients comparing the effect of placebo (n=145) and pazopanib (n=296) at 800 mg once daily on progression free survival. The median progression free survival of the placebo and pazopanib treated patients was 4.2 and 9.2 months, respectively, which showed that pazopanib is efficacious in improving progression free survival. Exposure-efficacy relationship was not observed within the 800 mg treated patients.
In the pivotal phase 3 study (study VEG105192) the most important adverse effect was liver enzyme (ALT/AST) elevations. Exposure response analysis showed that ALT increases with increased pazopanib trough concentrations. Consistent with such an observation, the sponsor plans to reduce pazopanib dose by 200 mg decrements to address ALT elevations. Because pazopanib has less than dose proportional PK, a 200 mg dose reduction will decrease the corresponding pazopanib AUC by approximately 12.5 %. Therefore, to have a meaningful exposure reduction, the initial dose reduction should be by 400 mg. Subsequent dose
(b) (4)
7
reductions can be done in 100 mg decrements.
The sponsor conducted a pooled candidate gene analysis (phase I-III) to evaluate if selected polymorphisms in 282 gene/gene regions were associated with maximum alanine aminotransferase (ALT) and/or total bilirubin (TBL) elevations observed in subjects treated with pazopanib. The sponsor’s results suggest that among White participants, variation in the hemachromatosis (HFE) gene may be associated with ALT elevation. The clinical significance of this finding is unknown. UGT1A1 genotypes implicated in benign hyperbilirubinemia due to a lower UGT1A1 function (i.e., Gilbert’s Syndrome) were associated with pazopanib-induced hyperbilirubinemia. Both associations were tested and confirmed in two independent cohorts of patients using both quantitative trait analyses and case-control methodology.
2 QUESTION BASED REVIEW
2.1 GENERAL ATTRIBUTES
2.1.1 What are the highlights of the chemistry and physical-chemical properties of the drug substance and the formulation of the drug product as they relate to clinical pharmacology and biopharmaceutics review?
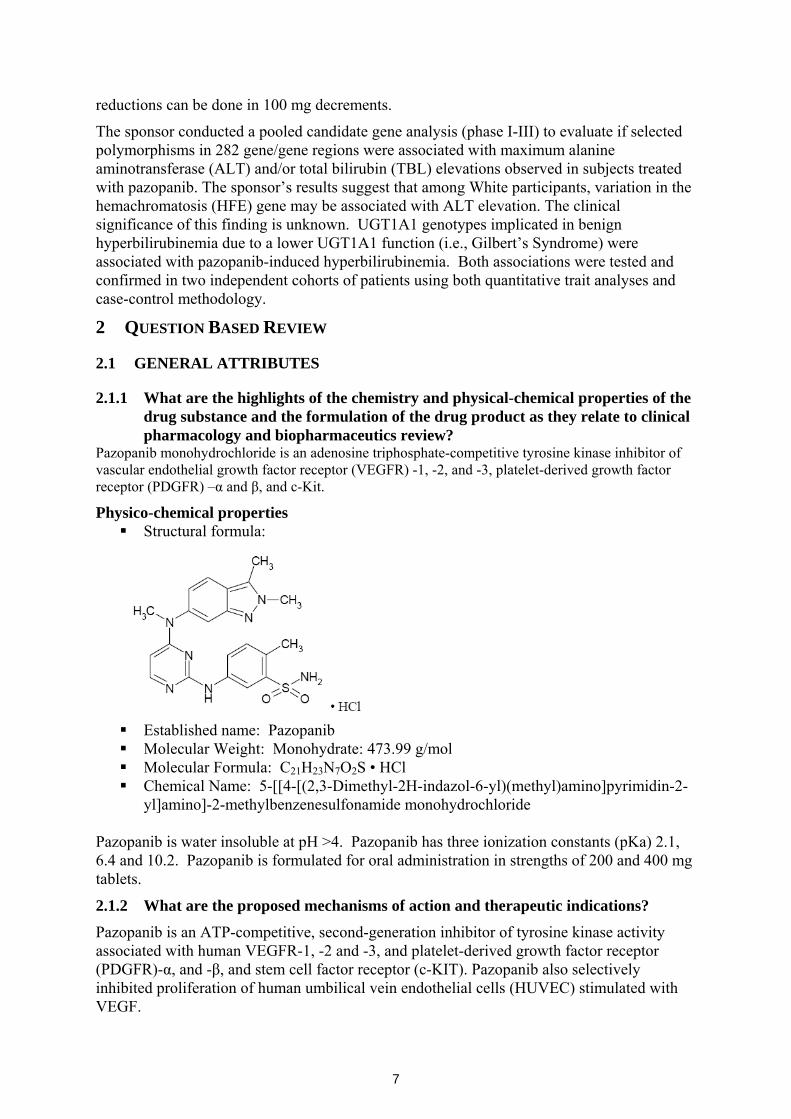
Pazopanib monohydrochloride is an adenosine triphosphate-competitive tyrosine kinase inhibitor of vascular endothelial growth factor receptor (VEGFR) -1, -2, and -3, platelet-derived growth factor receptor (PDGFR) –α and β, and c-Kit.
Physico-chemical properties Structural formula:
Established name: Pazopanib Molecular Weight: Monohydrate: 473.99 g/mol Molecular Formula: C21H23N7O2S • HCl Chemical Name: 5-[[4-[(2,3-Dimethyl-2H-indazol-6-yl)(methyl)amino]pyrimidin-2-
yl]amino]-2-methylbenzenesulfonamide monohydrochloride
Pazopanib is water insoluble at pH >4. Pazopanib has three ionization constants (pKa) 2.1, 6.4 and 10.2. Pazopanib is formulated for oral administration in strengths of 200 and 400 mg tablets.
2.1.2 What are the proposed mechanisms of action and therapeutic indications?
Pazopanib is an ATP-competitive, second-generation inhibitor of tyrosine kinase activity associated with human VEGFR-1, -2 and -3, and platelet-derived growth factor receptor (PDGFR)-α, and -β, and stem cell factor receptor (c-KIT). Pazopanib also selectively inhibited proliferation of human umbilical vein endothelial cells (HUVEC) stimulated with VEGF.
8
The sponsor is seeking indication of advanced renal cell carcinoma (RCC) for pazopanib.
2.1.3 What are the proposed dosage and route of administration?
The proposed dosage of pazopanib is 800 mg orally once daily without food (at least 1 hour before or 2 hours after a meal).
2.2 GENERAL CLINICAL PHARMACOLOGY
2.2.1 What are the design features of the clinical pharmacology and clinical studies used to support dosing or claims?
Study reports were submitted from a total of 13 studies. Three studies were performed in healthy volunteers. The rest of the 10 studies were conducted in advanced solid tumor or renal cell carcinoma (RCC) subjects. The phase 3 pivotal efficacy study (study VEG105192) was conducted in RCC subjects. Drug-drug interaction studies involving liver enzyme inhibitors, inducers, and other anti-cancer agents were also conducted to support dosing claims. Table 1 below describes the design features of the submitted studies.
Table 1. Studies supporting the clinical pharmacology and biopharmaceutics of pazopanib
Study Study Objective(s)
Study Design
Study population
Pazopanib Dose/Regimen
Total Treated
MD1103367 Oral PK Rising Dose Healthy Elderly 100-800 mg qd 9
MD7108238 Ocular PK Rising Dose Healthy subjects
ocular (2 or 5 mg/mL) 80 µM 8
MD7110861
DDI PK CYP3A4 inhibitor crossover
Healthy Subjects Ocular (5 mg/mL) 80 µM 24
VEG10003 PK/Efficacy Rising Dose solid tumors patients
50-2000 mg qd or 300-400 mg bid, or 50/100 mg TIW. 63
VEG10004 ADME, PK Rising Dose solid tumor patients
400/800 mg po or and 5 mg IV 24
VEG10005 Food Effect, crushed tablet Crossover
Cancer patients 400/800 mg qd 44
VEG10006 PK DDI Lapatinib Rising Dose
Solid Tumors 500-800 mg qd 75
VEG102857
PK DDI Lapatinib and EIAC Rising Dose
Cancer patients 200 -600 mg qd 55
VEG10007 PK DDI CYP450 Crossover
Solid Tumors 800 mg qd 24
VEG105427 PK DDI Paclitaxel Rising Dose
Cancer patients 400/800 mg qd 68
VEG105192 Efficacy and safety
Randomized Pivotal RCC 800 mg qd 435
VEG102616 Efficacy/PK open label RCC 800 mg qd 225 VEG107769 Efficacy/PK extension RCC 800 mg qd 71
9
Pivotal Phase 3 study: • VEG105192 was randomized, double-blind, placebo-controlled study to evaluate the
efficacy and safety of pazopanib compared to placebo in patients with locally advanced and/or metastatic renal cell carcinoma (RCC). The study enrolled 435 patients who were either treatment-naïve (n = 233 [54%]) or received 1 prior cytokine-based systemic therapy (n = 202 [46%]) for advanced RCC; 290 subjects were randomized to the pazopanib arm and 145 subjects were randomized to the placebo arm. At the time of clinical cut off on 23 May 2008, 38% of subjects in the pazopanib arm and 46% of subjects in the placebo arm had died; 78% of subjects in the pazopanib arm and 90% of subjects in the placebo arm had discontinued the investigational product. The median PFS in the pazopanib arm was more than double that in the placebo arm: 9.2 months (95% CI, 7.4, 12.9) versus 4.2 months (95% CI, 2.8, 4.2), respectively.
Phase 2 studies:
VEG102616 was an open-label study in subjects with Locally Recurrent or Metastatic Clear-Cell RCC, subjects received pazopanib doses of 800 mg per day. The study enrolled 225 subjects (155 treatment naïve, and 79 cytokine pretreated). Median PFS was 51.7 weeks, and median duration of response was 68 weeks.
Other Efficacy Study:
VEG107769 was an open-label extension study to assess the safety and efficacy of pazopanib in subjects with RCC previously enrolled on protocol VEG105192, where subjects were treated with pazopanib doses of 800 mg daily. The median PFS was 8.3 months. A total of 71 subjects were enrolled, 37 of the subjects were cytokine pretreated. The frequencies of grade 3 liver enzyme elevations were ALT (7%) and AST (6%). The most common adverse effect was hypertension at 46%.
Phase 1 Studies:
MD1103367 was a single-masked, randomized, placebo-controlled, parallel-group, dose-rising study to evaluate the safety and pharmacokinetics of pazopanib in elderly healthy volunteers. The study was prematurely terminated due to liver enzyme elevations (>3 x ULN) after enrolling 9 subjects. Six subjects received 100 mg pazopanib while the other 3 received placebo.
MD7108238 was placebo-controlled, randomized, dose rising safety and pharmacokinetic study using ocular pazopanib in healthy adults and elderly subjects. Subjects received single or multiple dose pazopanib consisting of two 40 µL drops of pazopanib solutions (2 or 5 mg/mL) administered to one eye. The study enrolled a total of 8 subjects. Two subjects had increased ALT. Pazopanib AUC increased in a greater than dose proportional manner. Ocular pazopanib drug administration was comparable to placebo (artificial tear) in terms of adverse effects to the eye. Reports of moderate stinging were higher for those receiving the 5 mg/mL solution of pazopanib.
MD7110861 was an open-label, two-period, fixed-sequence study in healthy volunteers to evaluate the effects of repeat doses of ketoconazole on the pharmacokinetics of a single dose of pazopanib administered as eye drops. A total of 24 subjects were enrolled in the study. Two 40 µL drops of pazopanib solution (5 mg/mL) were administered on days 1 (period 1) and 5 (period 2), and 400 mg of ketocoanzole was administered on days 1-8 during period 2. Following multiple dose ketocoanzole, pazopanib Cmax, AUC(0-t), and half-life were increased 1.47, 2.21, and 2.81 fold, respectively. Subjects reported transient
10
irritation of the treated eye.
VEG10003 was a phase 1, open-label, dose escalation study in subjects with solid tumors. A total of 63 patients were enrolled and doses of 50-2000 mg were evaluated using once daily (QD), twice daily (BID), or thrice weekly (TIW) dosing schedules. Hypertension and diarrhea were the most common grade 3 adverse events. Following oral doses, the Tmax and half-life ranges were 2-8 and 18-53 hours, respectively. Pazopanib Cmax and AUC increased in less than dose proportional fashion. In addition, the prototype 400 mg tablet had greater systemic exposure than the original tablet. However, at 800 mg, the prototype and original tablets exhibited similar exposure.
VEG10004 was a single dose pharmacokinetics study to assess the absorption, distribution, metabolism and elimination of pazopanib in subjects with solid tumors following single 5 mg IV or 400/800 mg oral doses. A total of 10 subjects were enrolled in the study. Two subjects had liver enzyme elevations (grade 1), and two subjects have grade ≥ 2 hypertension. Pazopanib oral absorption was incomplete, having bioavailability that ranged from 14 to 39%. Fecal excretion was the predominant route of elimination while < 4% of the orally administered dose was excreted in the urine.
VEG10005 was an open-label, two-period, crossover study to evaluate the effect of food on the pharmacokinetics of single dose pazopanib in cancer subjects. The food effect portion of the study enrolled 35 patients. Patients were administered 800 mg dose of pazopanib. The pazopanib AUC was increased 2.3 and 1.9 fold, following high and low fat food, respectively. Similarly, coadministration of pazopanib with food increased Cmax 2-fold. On the other hand, half-life was not influenced by food. The high fat meal increased Tmax 3 hours, whereas the low fat meal did not alter Tmax. Liver enzyme elevations were observed. Cardiovascular adverse events were the most common, occurring in 34 % of the subjects.
VEG10007 was a multi-center, open-label, multiple-probe drug interaction study to determine the effects of pazopanib on the metabolism of cytochrome P450 probe drugs in patients with solid tumors. A total of 24 subjects were enrolled in the study, and received 800 mg pazopanib daily. The pharmacokinetic findings were as follows:
o Pazopanib 800 mg once daily is a weak inhibitor of CYP3A4.
o Pazopanib 800 mg once daily is a weak inhibitor of CYP2D6.
o Pazopanib 800 mg once daily had no effect on CYP2C9 mediated metabolism.
o Pazopanib 800 mg once daily had no effect on CYP1A2 mediated metabolism.
o Pazopanib 800 mg once daily had no effect on CYP2C19 mediated metabolism.
The most common adverse events included cardiovascular and hepatobiliary events, affecting 78% and 39% of subjects, respectively. The most common cardiovascular event was any grade hypertension.
VEG105427 was a phase 1, open-label, study of the safety, tolerability and pharmacokinetics of pazopanib in combination with paclitaxel (part 1), paclitaxel + carboplatin (part 2), paclitaxel + lapatinib (part 3). The paclitaxel combination used a 28-day cycle, the carboplatin combination used a 21-day cycle, and the paclitaxel + lapatinib combination used a 28-day cycle. Results are available from part 2 of the study (n=26). Clinical activity was observed in 6 (38%) patients. The maximum tolerated regimen (MTR) was determined to be 80 mg/m2 of weekly IV paclitaxel and 800 mg pazopanib daily. Six subjects died during the study, and 5 of those were related to underlying
11
disease. Six subjects were withdrawn due to adverse effects. The most common (53%) adverse effects were grade 1 liver enzyme (AST/ALT) elevations. Pazopanib decreased paclitaxel clearance by 14%, and increased Cmax by 31%. Paclitaxel clearance and Cmax changes are due to CYP (2C8, 3A4) inhibition by pazopanib.
NCI 8063 was a phase one, single agent, pharmacokinetic study of pazopanib in patients with advanced malignancies and varying degrees of liver dysfunction. The study is ongoing and data submitted from 12 subjects (8 normal, 1 mild, 2 moderate liver impairment) are not conclusive.
2.2.2 What is the basis for selecting the response endpoints or biomarkers and how are they measured in clinical pharmacology and clinical studies?
Biomarker:
The putative biomarker for clinical response is hypertension. PK/PD modeling was performed to establish concentration-hypertension relationships. See section 2.2.4.4. The safety biomarkers for pazopanib are liver enzyme elevations and more discussions are provided in section 2.2.4.2.
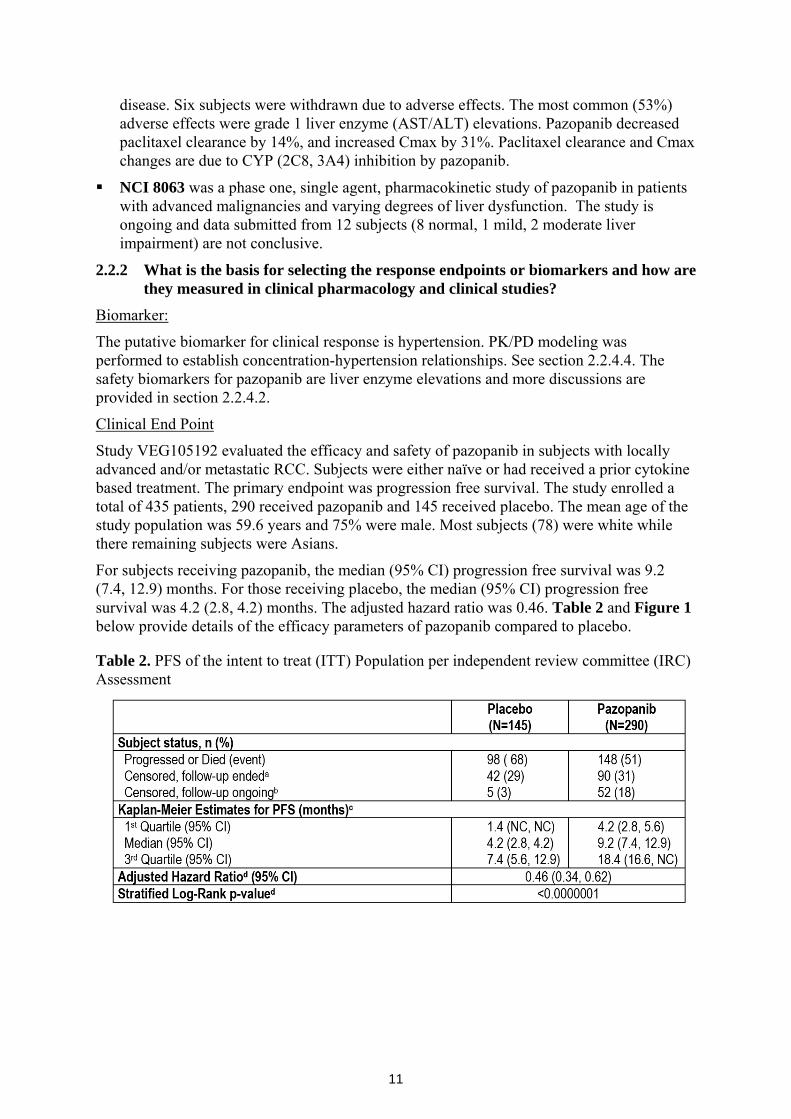
Clinical End Point
Study VEG105192 evaluated the efficacy and safety of pazopanib in subjects with locally advanced and/or metastatic RCC. Subjects were either naïve or had received a prior cytokine based treatment. The primary endpoint was progression free survival. The study enrolled a total of 435 patients, 290 received pazopanib and 145 received placebo. The mean age of the study population was 59.6 years and 75% were male. Most subjects (78) were white while there remaining subjects were Asians.
For subjects receiving pazopanib, the median (95% CI) progression free survival was 9.2 (7.4, 12.9) months. For those receiving placebo, the median (95% CI) progression free survival was 4.2 (2.8, 4.2) months. The adjusted hazard ratio was 0.46. Table 2 and Figure 1 below provide details of the efficacy parameters of pazopanib compared to placebo. Table 2. PFS of the intent to treat (ITT) Population per independent review committee (IRC) Assessment
12
Figure 1. PFS of Pazopanib and Placebo Treated Subjects
The secondary endpoint for study VEG105192 was overall survival, and it appears that pazopanib does not significantly prolong overall survival. Interim results of study VEG105192 show that the median overall survival estimates were 18.7 and 21.1 months for placebo and pazopanib treated patients (Table 3). The hazard ratio (95% CI) for placebo:pazopanib treated patients was 0.73 (.47, 1.12). Because the upper 95% CI included 1, the treatment effect on overall survival is not considered statistically significant.
Table 3. Kaplan-Meier estimates of overall survival using interim data (ITT Population)
Study VEG102616 was a supportive phase 2 study that assessed the efficacy of pazopanib in subjects with locally recurrent metastatic clear-cell RCC. The study enrolled a total of 225 subjects receiving 800 mg of pazopanib once daily or placebo, of which 28 subjects were initially randomized to placebo and later crossed to pazopanib. The primary end point was overall response rate. The overall response rate was reported to be 35%. In addition, the median duration of response was reported to be 68 weeks and the median PFS was 45.3 weeks.
13
A third study that assessed the efficacy of pazopanib in RCC subjects was study VEG107769. In study VEG107769, subjects previously enrolled in study VEG105192 and who had progressed following placebo treatment were enrolled in an open label fashion. The objectives of the study included safety and tolerability of pazopanib following 800 mg per day, overall response rate, progression free survival, and overall survival. The study enrolled a total of 71 patients. The overall response rate was 32.4%, the median PFS was 8.3 months, and the median overall survival was 16.3 months.
2.2.3 Are the active moieties in the plasma (or other biological fluid) appropriately identified and measured to assess pharmacokinetic parameters and exposure response relationships?
Pazopanib and its metabolites are measured in plasma. Pazopanib has four identified metabolites including GSK1268992, GSK1268997, GSK1071306 and GW70020. The method for the determination of GSK1268992, GSK1268997, GSK1071306 and GW700201 in human plasma was validated over the range 50 to 10000 ng/mL using HPLC-MS/MS. The between run assay precision (%CV) for all metabolites was ≤ 15%.
Please refer to section 2.6 (Analytical) for more detail.
2.2.4 Exposure-response
All three of efficacy (RCC) studies were conducted using only the 800 mg per day dose. As such, extensive dose-response or exposure response analysis is not possible.
The 800 mg per day dosing schedule was chosen for further development based efficacy, safety, and pharmacodynamic results of Study VEG10003. Study VEG10003 was a dose escalation study in solid tumor patients where pazopanib total daily doses of 50 to 2000 mg were given as shown in Table 4 below.
Table 4. Study VEG10003 patient and dosing information
2.2.4.1 What are the characteristics of the exposure-response relationships (dose-response,
concentration-response) for efficacy? Preliminary PK-biomarker and PK-efficacy analyses indicated that concentrations above 15 µg/mL were needed to produce biomarker and clinical response (see section 2.2.4.4). In order to determine the presence of meaningful concentration-response relationships based on
14
progression free survival, the reviewer divided the trough concentrations from the available patients into quartiles and performed a Kaplan Meier analysis (with four quartiles as different strata). The survival curves of patients in different trough concentration-quartile groups overlapped at several points, indicating the absence of concentration-response within the 800 mg/day dosing regimen (Figure 2). The lack of concentration-efficacy relationship within the 800 mg qd could be because 800 mg is considerably higher than a dose necessary to achieve clinical response. As shown in Table 5, the median steady state trough concentration of pazopanib is 32 µg/mL, which is 2-fold higher than concentrations needed to produce biomarker response. However, despite the lack of exposure response differences within the 800 mg dosed patients, the PFS curves (Figure 1) still indicate that pazopanib treated subjects have favorable survival.
Time (months)
Pro
porti
on P
rogr
essi
on F
ree
0 5 10 15 20 25
0.0
02
0.4
0.6
0.8
1.0 Placebo
Pazopanib Cmin Q1Pazopanib Cmin Q2Pazopanib Cmin Q3Pazopanib Cmin Q4
Figure 2. Kaplan Meier plots for progression free survival stratified by placebo and quartiles of pazopanib concentrations (Q1-Q4).
15
Table 5. Summary of single dose (day 1) and multiple dose (day 22) pazopanib plasma concentrations from phase 3 study (VEG105192).
2.2.4.2 What are the characteristics of the exposure-response relationships (dose-response,
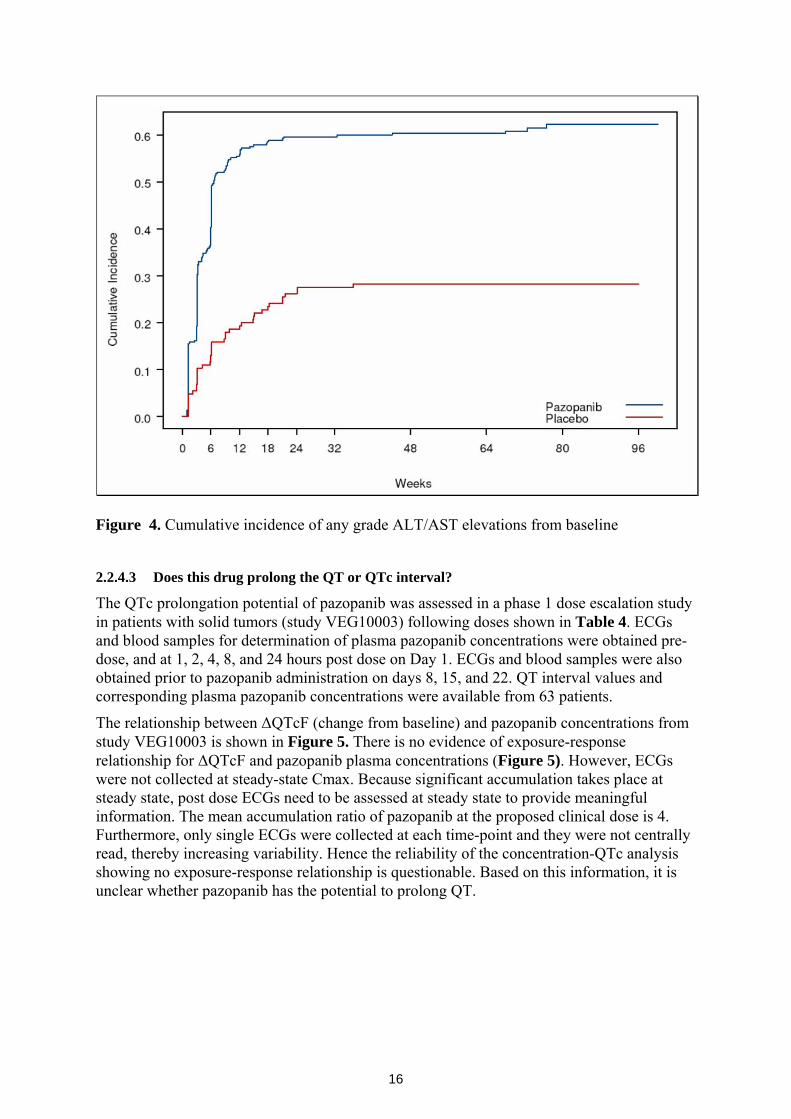
concentration-response) for safety? For pazopanib, the most unique and important safety concern is liver toxicity. The sponsor measured liver enzymes AST and ALT in the phase 3 pivotal study (VEG105192) as surrogates of liver toxicity. Using data from the pivotal study, a logistic regression analysis was performed to assess the relationship between probability of Grade 3 or more (Grade 3+) ALT and steady state (day 22) trough pazopanib concentrations. As shown in Figure 3 below, the probability of Grade 3+ ALT increases with increased pazopanib concentration. This relationship supports the sponsor’s proposal for reducing pazopanib doses based on ALT levels as outlined in the label. The overall (any grade) ALT and AST elevations were similar (53%). Time to event plot (Figure 4) shows that the ALT/AST elevations peaked by week 24.
0
20
40
60
80
0 20 40 60 80
| | | | |2/145
37/290
0/12 1/12 2/12 3/12
Steady-state Ctrough (mcg/mL)
Pro
babi
lity
of G
rade
3+
ALT
(%)
PlaceboPazopanib
Figure 3. Probability of Grade 3+ ALT elevation vs. steady-state pazopanib trough concentrations.
(b) (4)
16
Figure 4. Cumulative incidence of any grade ALT/AST elevations from baseline
2.2.4.3 Does this drug prolong the QT or QTc interval?
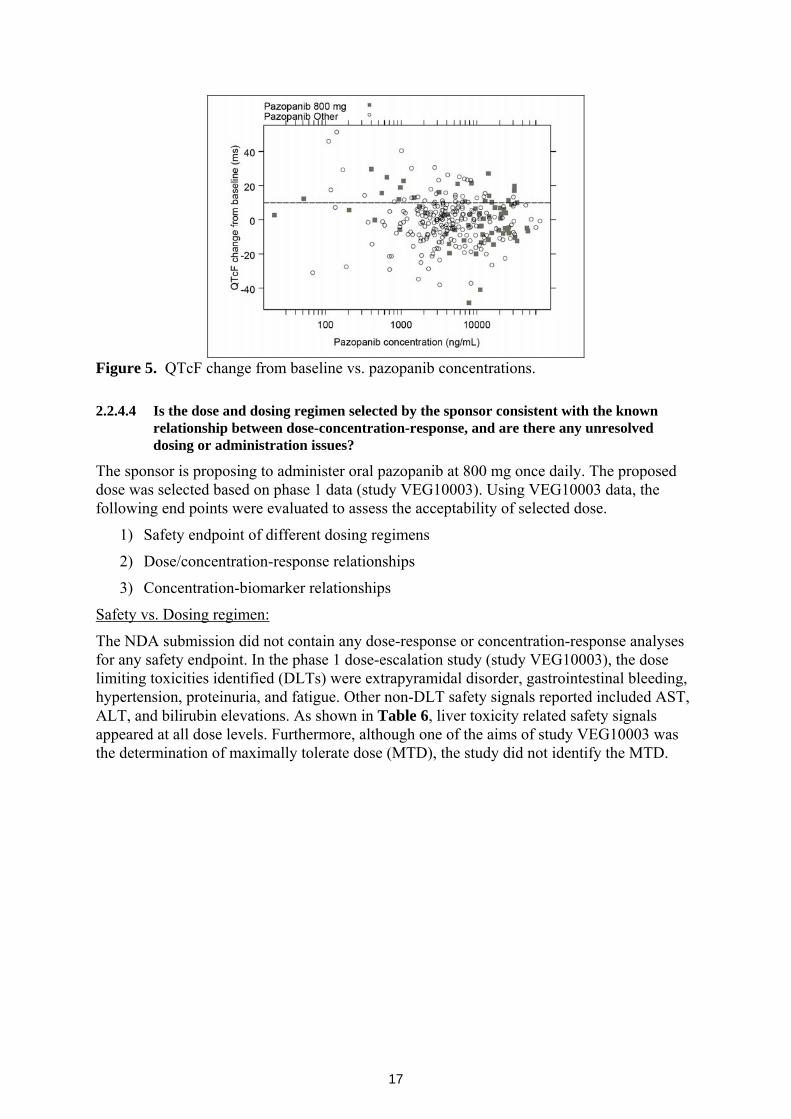
The QTc prolongation potential of pazopanib was assessed in a phase 1 dose escalation study in patients with solid tumors (study VEG10003) following doses shown in Table 4. ECGs and blood samples for determination of plasma pazopanib concentrations were obtained pre-dose, and at 1, 2, 4, 8, and 24 hours post dose on Day 1. ECGs and blood samples were also obtained prior to pazopanib administration on days 8, 15, and 22. QT interval values and corresponding plasma pazopanib concentrations were available from 63 patients.
The relationship between ΔQTcF (change from baseline) and pazopanib concentrations from study VEG10003 is shown in Figure 5. There is no evidence of exposure-response relationship for ΔQTcF and pazopanib plasma concentrations (Figure 5). However, ECGs were not collected at steady-state Cmax. Because significant accumulation takes place at steady state, post dose ECGs need to be assessed at steady state to provide meaningful information. The mean accumulation ratio of pazopanib at the proposed clinical dose is 4. Furthermore, only single ECGs were collected at each time-point and they were not centrally read, thereby increasing variability. Hence the reliability of the concentration-QTc analysis showing no exposure-response relationship is questionable. Based on this information, it is unclear whether pazopanib has the potential to prolong QT.
17
Figure 5. QTcF change from baseline vs. pazopanib concentrations.
2.2.4.4 Is the dose and dosing regimen selected by the sponsor consistent with the known relationship between dose-concentration-response, and are there any unresolved dosing or administration issues?
The sponsor is proposing to administer oral pazopanib at 800 mg once daily. The proposed dose was selected based on phase 1 data (study VEG10003). Using VEG10003 data, the following end points were evaluated to assess the acceptability of selected dose.
1) Safety endpoint of different dosing regimens
2) Dose/concentration-response relationships
3) Concentration-biomarker relationships
Safety vs. Dosing regimen:
The NDA submission did not contain any dose-response or concentration-response analyses for any safety endpoint. In the phase 1 dose-escalation study (study VEG10003), the dose limiting toxicities identified (DLTs) were extrapyramidal disorder, gastrointestinal bleeding, hypertension, proteinuria, and fatigue. Other non-DLT safety signals reported included AST, ALT, and bilirubin elevations. As shown in Table 6, liver toxicity related safety signals appeared at all dose levels. Furthermore, although one of the aims of study VEG10003 was the determination of maximally tolerate dose (MTD), the study did not identify the MTD.
18
Table 6. Summary of subjects with grade 2 or higher increases in ALT, ALT, and total bilirubin study VEG10003
Dose vs. Best Response:
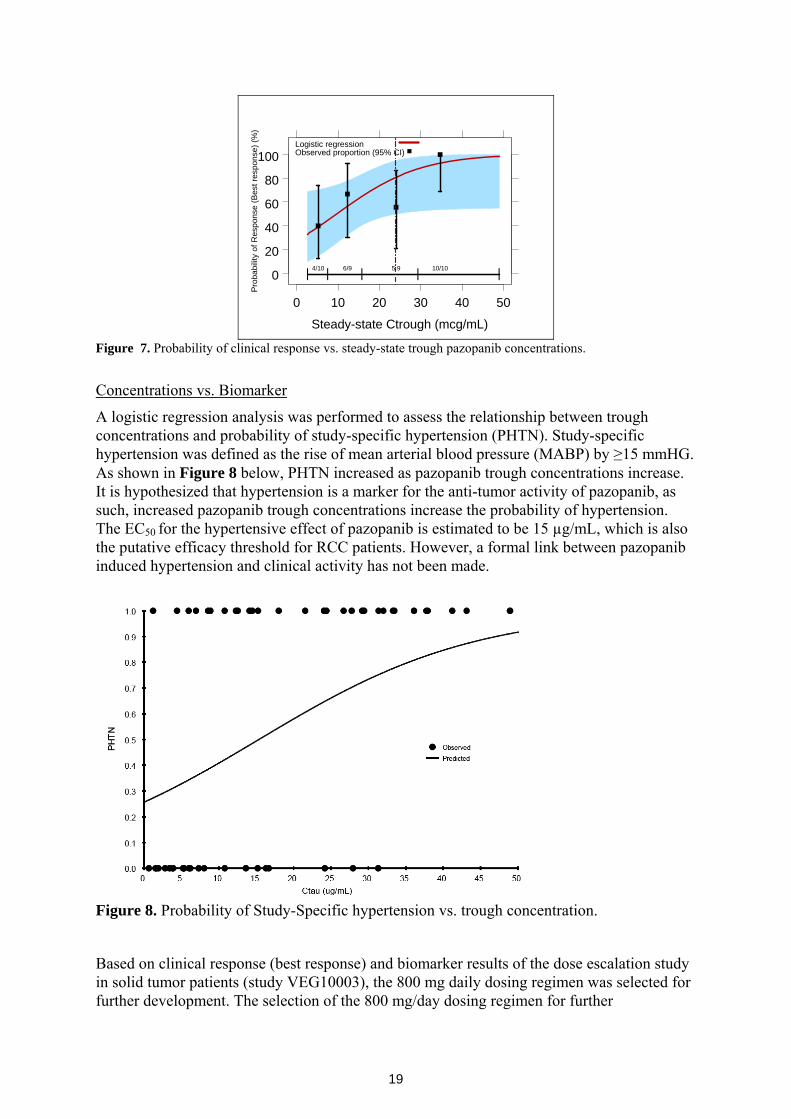
In study VEG10003 30 patients attained best response (partial response or stable disease of any duration), 17 patients attained clinical benefit (partial response or stable disease for ≥ 6 months). To simplify analysis and interpretation of analysis, subset of patients who received once daily pazopanib doses were selected and a plot of proportion of responders (best response) vs. dose was generated as shown in Figure 6, which indicates that pazopanib doses of ≥ 400 mg result in clinical response. However, the most frequent response occurred at 800 mg/day. Clinical response is defined as partial response or disease stabilization of the tumor for any number of days.
In addition, logistic regression was performed to assess the relationship between steady-state trough concentration and best response. As shown in Figure 7, the probability of best response increases with increasing trough steady-state pazopanib concentrations. On Figure 7, vertical broken line indicates the median trough concentration of the 800 mg per day dose.
50
60
70
80
90
100
0 500 1000 1500 2000
3/61/2 1/2 2/3 2/3 7/11 2/3 1/2 3/3
Dose (mg)
Pro
porti
on o
f Res
pond
ers
(Bes
t res
pons
e) (%
)
Figure 6. Proportion of responders vs. pazopanib dose.
19
0
20
40
60
80
100
0 10 20 30 40 50
| | | | |4/10 6/9 5 9 10/10
Steady-state Ctrough (mcg/mL)
Prob
abilit
y of
Res
pons
e (B
est r
espo
nse)
(%)
Logistic regressionObserved proportion (95% CI)
Figure 7. Probability of clinical response vs. steady-state trough pazopanib concentrations.
Concentrations vs. Biomarker
A logistic regression analysis was performed to assess the relationship between trough concentrations and probability of study-specific hypertension (PHTN). Study-specific hypertension was defined as the rise of mean arterial blood pressure (MABP) by ≥15 mmHG. As shown in Figure 8 below, PHTN increased as pazopanib trough concentrations increase. It is hypothesized that hypertension is a marker for the anti-tumor activity of pazopanib, as such, increased pazopanib trough concentrations increase the probability of hypertension. The EC50 for the hypertensive effect of pazopanib is estimated to be 15 µg/mL, which is also the putative efficacy threshold for RCC patients. However, a formal link between pazopanib induced hypertension and clinical activity has not been made.
Figure 8. Probability of Study-Specific hypertension vs. trough concentration.
Based on clinical response (best response) and biomarker results of the dose escalation study in solid tumor patients (study VEG10003), the 800 mg daily dosing regimen was selected for further development. The selection of the 800 mg/day dosing regimen for further
20
development is acceptable; however, because the sponsor did not perform any dose optimization study, it is not clear whether 800 mg/day is the most optimal dosing regimen for pazopanib. In addition, there was no consistent dose response relationship for liver enzyme elevations in study VEG10003, as liver enzyme elevations appeared at doses as low as 50 mg/day (Table 6).
2.2.5 Pharmacokinetic characteristics of the drug and its major metabolites 2.2.5.1 What are the single dose and multiple dose PK parameters?
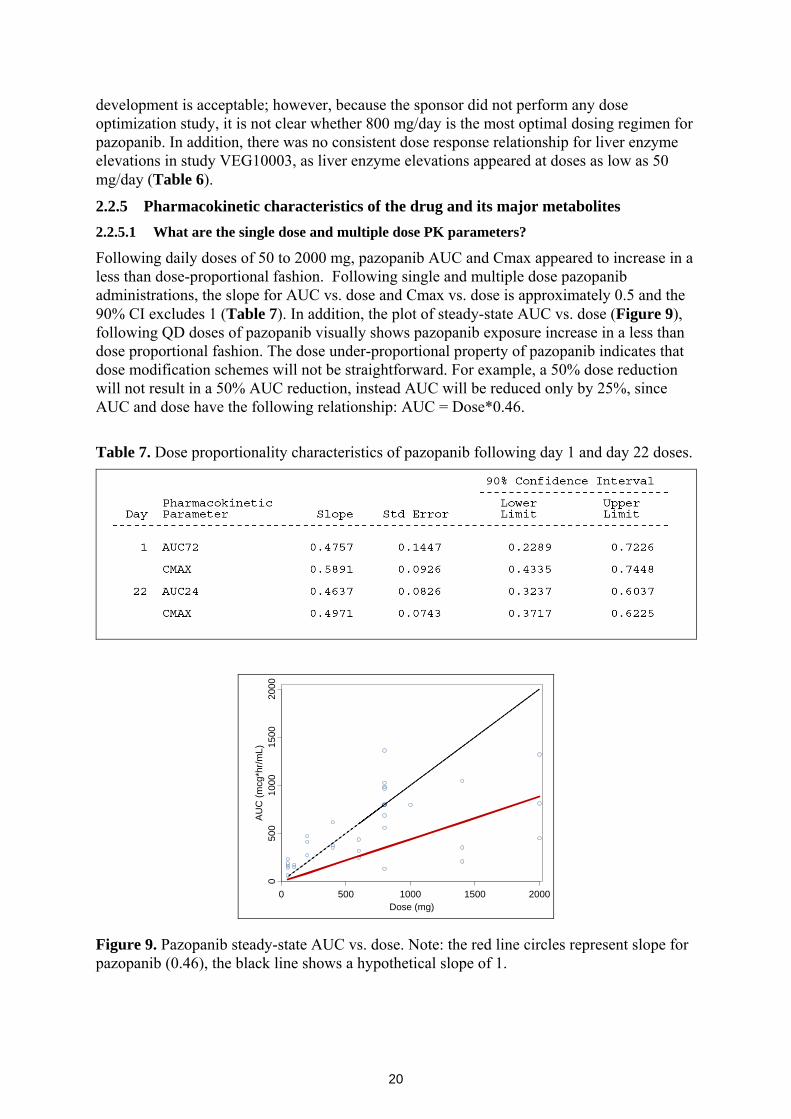
Following daily doses of 50 to 2000 mg, pazopanib AUC and Cmax appeared to increase in a less than dose-proportional fashion. Following single and multiple dose pazopanib administrations, the slope for AUC vs. dose and Cmax vs. dose is approximately 0.5 and the 90% CI excludes 1 (Table 7). In addition, the plot of steady-state AUC vs. dose (Figure 9), following QD doses of pazopanib visually shows pazopanib exposure increase in a less than dose proportional fashion. The dose under-proportional property of pazopanib indicates that dose modification schemes will not be straightforward. For example, a 50% dose reduction will not result in a 50% AUC reduction, instead AUC will be reduced only by 25%, since AUC and dose have the following relationship: AUC = Dose*0.46.
Table 7. Dose proportionality characteristics of pazopanib following day 1 and day 22 doses.
Dose (mg)
AU
C (m
cg*h
r/mL)
0 500 1000 1500 2000
050
010
0015
0020
00
Figure 9. Pazopanib steady-state AUC vs. dose. Note: the red line circles represent slope for pazopanib (0.46), the black line shows a hypothetical slope of 1.
21
Following once daily dosing over dose ranges of 50 to 2000 mg, the mean accumulation ratio for pazopanib ranged from 1.23 to 4.8 (Table 8). At the proposed clinical dose of 800 mg qd, pazopanib has a mean accumulation ratio of 4.0, with a 90 % CI of 2.6 to 6.1 (Table 8). It is apparent that at the proposed clinical dose, significant drug accumulation takes place, which further supports the need to conduct QT/QTc study following multiple dose administration (see 2.2.4.3). Table 8. Pazopanib AUC ratio following single (day 1) and multiple (day 22) dose administration.
2.2.5.2 How does the PK of the drug and its major active metabolites in healthy volunteers
compare to that in patients?
The safety and pharmacokinetics assessment of oral pazopanib following 100, 300 or 800 mg doses of pazopanib was planned in study MD1103367. However, the study was terminated prematurely due to liver enzyme elevations in 3 of the 6 subjects that received pazopanib doses of 100 mg/day. PK data were available from these 6 subjects. The mean 24-hour AUC of the 6 subjects in study MD1103367 was 73 µg·hr/mL which was lower than the mean 24-hour AUC of 98 µg·hr/mL following 100 mg/day (n=3) in study VEG10003. However, because study MD1103367 has a very small sample size, the PK variability is high, and the 100 mg/day dose is much smaller than the proposed 800 mg/dose in the target population, PK comparison between healthy volunteers and patients can not be reliably performed.
2.2.5.3 What are the characteristics of drug absorption?
Study VEG10004 characterized the ADME properties of pazopanib in subjects with solid tumor malignancies (n=10). The bioavailability of pazopanib was determined following 5 mg single intravenous dose and 800 mg multiple oral dose of pazopanib (n=3). Pazopanib oral absorption was incomplete; the median (range) absolute bioavailability was 21% (14-39%) in the three subjects were that received intravenous doses. The median (range) Tmax following 800 mg qd was 3.5(1-8) hours (n=6). The median (range) half-life following single intravenous dose was 27.5 (26-39) hours (n=3). 2.2.5.4 What are the characteristics of drug distribution?
Protein Binding
The protein binding properties of pazopanib was investigated in an in vitro study (study 04DMM013) using pazopanib concentration of 10, 20, 50, and 100 µg/mL. At all concentration levels, pazopanib protein binding was > 99.9%. These data indicate that
22
pazopanib protein binding is not concentration dependent. Blood/Plasma Ratio (Crbc/Cp)
The extent of blood partitioning of pazopanib was determined in the ADME study (study VEG10004) following 433 mg [14C]-pazopanib dose in subjects with solid tumor malignancies. The range of blood to plasma concentration ratio (Cblood/Cplasma) was 0.59 to 0.93 through 96 hours pose dose, suggesting a weak association with human red blood cells. 2.2.5.5 Does the mass balance study suggest renal or hepatic as the major route of
elimination?
In study VEG10004, three subjects with solid tumor malignancies received a single, 433 mg oral dose of [14C]-pazopanib (400 mg free base) solution, containing 70 μCi of radio activity. The most of the radiolabeled dose was recovered in feces and urine by 168 hours after pazopanib administration. A total of 96.9%, 95.3%, and 62.4% of the radiolabeled doses were recovered in the urine and feces of subject 1, 2, 3, respectively, 168 hours following oral pazopanib administration (Table 9).
Renal elimination of pazopanib is accounted for less than 4% of bodily excretion of the administered dose (Table 9). The majority of the radioactivity (82.2%) was recovered in feces by 120 hours (Table 9). Pazopanib undergoes moderate liver metabolism. Pazopanib was the major drug-related component in human plasma representing 84% and 91% of the AUC(0-∞) in two of the three subjects that received 400 mg radiolabeled pazopanib. Individual circulating metabolite concentrations accounted for less than 10% of the blood and plasma radioactivity at all time points. Table 9. Cumulative percentages of recovered radioactivity in, feces, urine, and total.
Percent of Administered Dose Subject
Elimination route 1 2 3 Mean (SD) Feces 93.4 92.2 61.1 82.2 (18.3) Urine 3.48 3.1 1.32 2.63 (1.15) Total 96.9 95.3 62.4 84.9 (19.5)
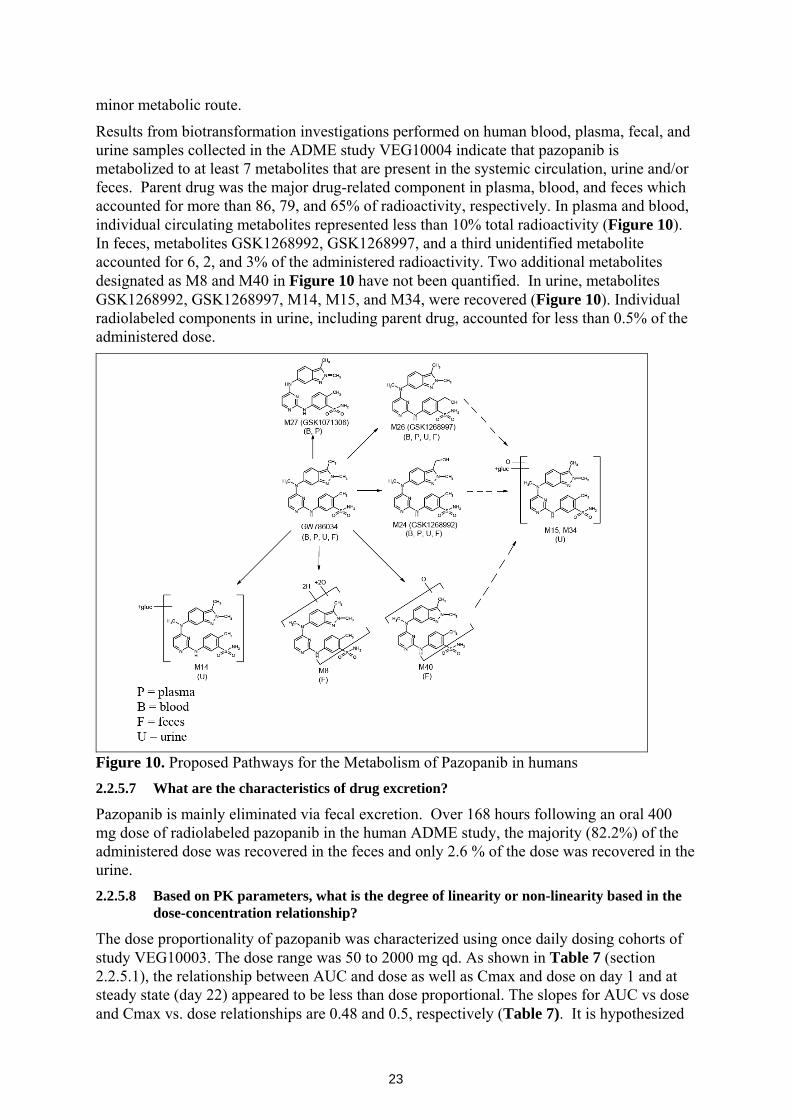
The majority of radiolabeled material recovered in feces constituted unchanged pazopanib, accounting for a mean of 67% of the administered radioactivity activity dose. Pazopanib metabolites GSK1268992 and GSK1268997 accounted for means of approximately 6% and 2% of the administered radioactivity dose, respectively. Another metabolite with 30 mass units greater than the parent compound, possible result from a methyl group oxidation, accounted for a mean of approximately 3%. Additional metabolites, designated as GSK1268992, GSK1268997, M14, M15 and M34 were recovered in urine. However, individual radiolabeled components in urine, including parent drug, was lass than 0.5% of administered radioactive drug. 2.2.5.6 What are the characteristics of drug metabolism?
The in vitro metabolism of pazopanib was studied by incubating [14C]-pazopanib with human hepatocytes and liver microsomes. Results of in vitro metabolism revealed that hepatic CYP3A4 enzymes are the primary metabolizing enzymes, with CYP1A2 and CYP2C8 making minor contributions. The primary routes of metabolism were identified to be mono- and di-oxygenation pazopanib. Further conjugation of the mono-oxygenated metabolite was a
23
minor metabolic route.
Results from biotransformation investigations performed on human blood, plasma, fecal, and urine samples collected in the ADME study VEG10004 indicate that pazopanib is metabolized to at least 7 metabolites that are present in the systemic circulation, urine and/or feces. Parent drug was the major drug-related component in plasma, blood, and feces which accounted for more than 86, 79, and 65% of radioactivity, respectively. In plasma and blood, individual circulating metabolites represented less than 10% total radioactivity (Figure 10). In feces, metabolites GSK1268992, GSK1268997, and a third unidentified metabolite accounted for 6, 2, and 3% of the administered radioactivity. Two additional metabolites designated as M8 and M40 in Figure 10 have not been quantified. In urine, metabolites GSK1268992, GSK1268997, M14, M15, and M34, were recovered (Figure 10). Individual radiolabeled components in urine, including parent drug, accounted for less than 0.5% of the administered dose.
Figure 10. Proposed Pathways for the Metabolism of Pazopanib in humans 2.2.5.7 What are the characteristics of drug excretion?
Pazopanib is mainly eliminated via fecal excretion. Over 168 hours following an oral 400 mg dose of radiolabeled pazopanib in the human ADME study, the majority (82.2%) of the administered dose was recovered in the feces and only 2.6 % of the dose was recovered in the urine. 2.2.5.8 Based on PK parameters, what is the degree of linearity or non-linearity based in the
dose-concentration relationship?
The dose proportionality of pazopanib was characterized using once daily dosing cohorts of study VEG10003. The dose range was 50 to 2000 mg qd. As shown in Table 7 (section 2.2.5.1), the relationship between AUC and dose as well as Cmax and dose on day 1 and at steady state (day 22) appeared to be less than dose proportional. The slopes for AUC vs dose and Cmax vs. dose relationships are 0.48 and 0.5, respectively (Table 7). It is hypothesized
24
that pazopanib follows nonlinear absorption where less drug is absorbed with increasing dose administration. The mechanism for nonlinear absorption has not been elucidated. However, once the drug is absorbed, the clearance of pazopanib appears to follow linear pharmacokinetics. Based on population PK modeling, the sponsor has identified a 1-compartment linear PK model as the best model describing the disposition of pazopanib.
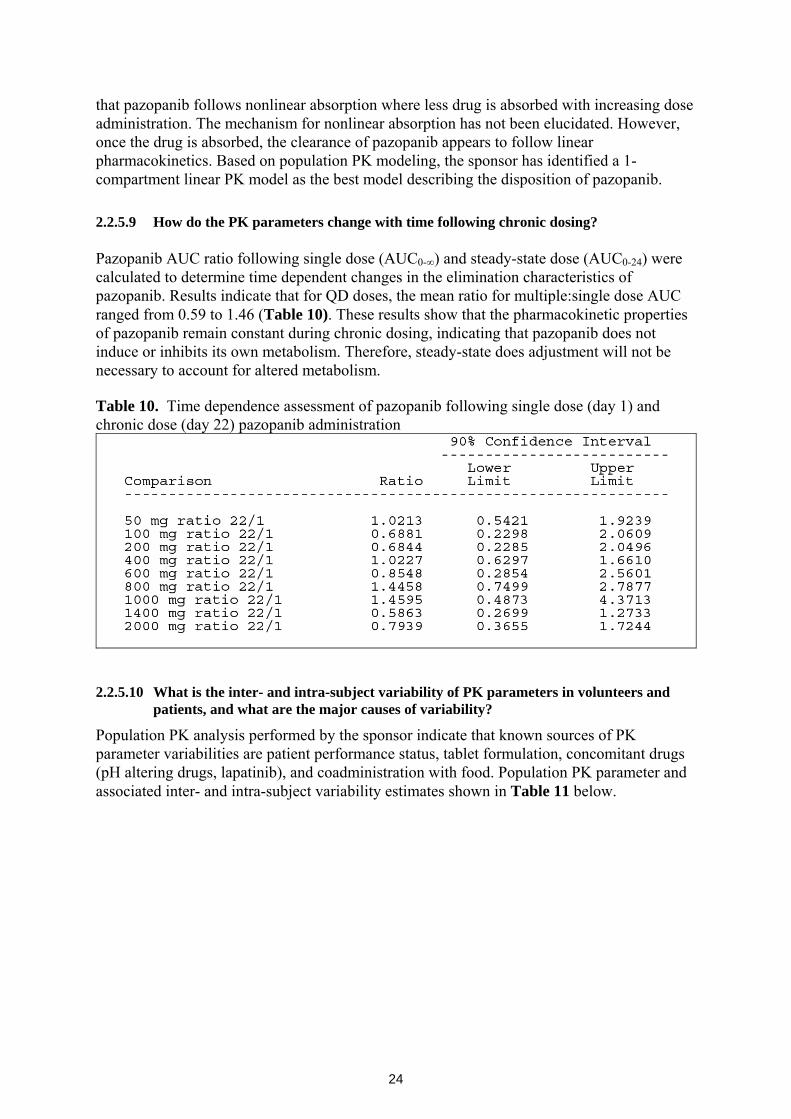
2.2.5.9 How do the PK parameters change with time following chronic dosing? Pazopanib AUC ratio following single dose (AUC0-∞) and steady-state dose (AUC0-24) were calculated to determine time dependent changes in the elimination characteristics of pazopanib. Results indicate that for QD doses, the mean ratio for multiple:single dose AUC ranged from 0.59 to 1.46 (Table 10). These results show that the pharmacokinetic properties of pazopanib remain constant during chronic dosing, indicating that pazopanib does not induce or inhibits its own metabolism. Therefore, steady-state does adjustment will not be necessary to account for altered metabolism. Table 10. Time dependence assessment of pazopanib following single dose (day 1) and chronic dose (day 22) pazopanib administration
2.2.5.10 What is the inter- and intra-subject variability of PK parameters in volunteers and
patients, and what are the major causes of variability?
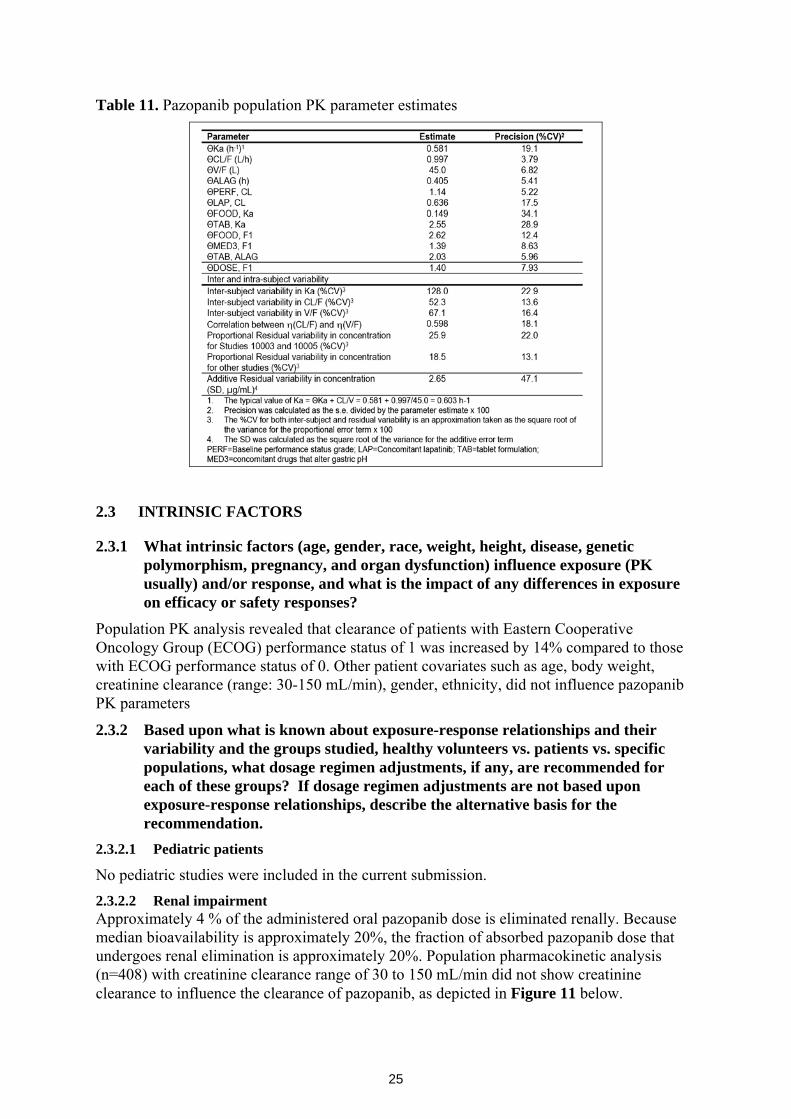
Population PK analysis performed by the sponsor indicate that known sources of PK parameter variabilities are patient performance status, tablet formulation, concomitant drugs (pH altering drugs, lapatinib), and coadministration with food. Population PK parameter and associated inter- and intra-subject variability estimates shown in Table 11 below.
25
Table 11. Pazopanib population PK parameter estimates
2.3 INTRINSIC FACTORS
2.3.1 What intrinsic factors (age, gender, race, weight, height, disease, genetic polymorphism, pregnancy, and organ dysfunction) influence exposure (PK usually) and/or response, and what is the impact of any differences in exposure on efficacy or safety responses?
Population PK analysis revealed that clearance of patients with Eastern Cooperative Oncology Group (ECOG) performance status of 1 was increased by 14% compared to those with ECOG performance status of 0. Other patient covariates such as age, body weight, creatinine clearance (range: 30-150 mL/min), gender, ethnicity, did not influence pazopanib PK parameters
2.3.2 Based upon what is known about exposure-response relationships and their variability and the groups studied, healthy volunteers vs. patients vs. specific populations, what dosage regimen adjustments, if any, are recommended for each of these groups? If dosage regimen adjustments are not based upon exposure-response relationships, describe the alternative basis for the recommendation.
2.3.2.1 Pediatric patients
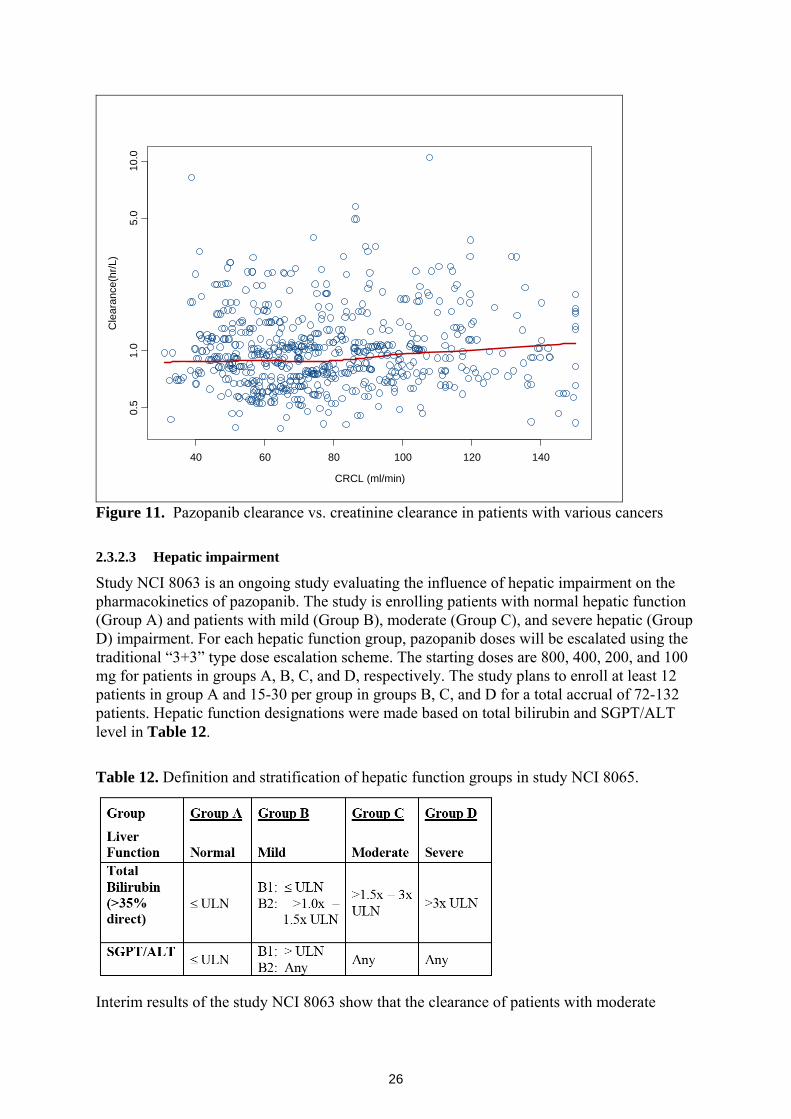
No pediatric studies were included in the current submission. 2.3.2.2 Renal impairment Approximately 4 % of the administered oral pazopanib dose is eliminated renally. Because median bioavailability is approximately 20%, the fraction of absorbed pazopanib dose that undergoes renal elimination is approximately 20%. Population pharmacokinetic analysis (n=408) with creatinine clearance range of 30 to 150 mL/min did not show creatinine clearance to influence the clearance of pazopanib, as depicted in Figure 11 below.
26
CRCL (ml/min)
Cle
aran
ce(h
r/L)
40 60 80 100 120 140
0.5
1.0
5.0
10.0
Figure 11. Pazopanib clearance vs. creatinine clearance in patients with various cancers 2.3.2.3 Hepatic impairment
Study NCI 8063 is an ongoing study evaluating the influence of hepatic impairment on the pharmacokinetics of pazopanib. The study is enrolling patients with normal hepatic function (Group A) and patients with mild (Group B), moderate (Group C), and severe hepatic (Group D) impairment. For each hepatic function group, pazopanib doses will be escalated using the traditional “3+3” type dose escalation scheme. The starting doses are 800, 400, 200, and 100 mg for patients in groups A, B, C, and D, respectively. The study plans to enroll at least 12 patients in group A and 15-30 per group in groups B, C, and D for a total accrual of 72-132 patients. Hepatic function designations were made based on total bilirubin and SGPT/ALT level in Table 12.
Table 12. Definition and stratification of hepatic function groups in study NCI 8065.
Interim results of the study NCI 8063 show that the clearance of patients with moderate
27
hepatic impairment is reduced by approximately 50% (Table 13). It was determined that the MTD for patients with moderate hepatic impairment is 200 mg once daily since two of the four evaluable patients that received 400 mg once daily experienced grade 4 liver enzyme elevations, and one patient experienced grade 3 hyperbilirubinemia. Available data indicate that patients with mild hepatic impairment have similar clearance as those with normal hepatic function. Therefore, patients with mild hepatic impairment will not need dose reductions, and patients with moderate hepatic impairment will be recommended to take 200 mg once daily, and those with severe hepatic impairment will be recommended to avoid pazopanib pending complete study report of the hepatic impairment study.
Table 13. Interim results of study NCI 8063 showing the influence of hepatic function on pazopanib PK
Group Dose (mg) N Cmax
(µg/ml) AUC(0-24) (µg·hr/ml) CL/F (L/hr)
A-Normal 800 12 48.6 (17.1-85.7)
854.8 (345.5-1099)
0.9 (0.7-2.3)
B - Mild 400 5 22.7 (14.6-39.8) 467.6 0.9
C-Moderate 200 7 23.9 (6.4-32.9)
443.1 (131.8-464.0)
0.5 (0.4-1.5)
Is there a genetic predisposition to elevated ALT and/or total bilirubin concentrations in pazopanib-treated patients?
The sponsor conducted a pharmacogenetic analysis evaluating the association of selected germline polymorphisms with the ALT and TBL elevation. Blood samples for the pharmacogenetic analysis were collected from consenting subjects from studies MD1103367, VEG10005, VEG10006, VEG10007, VEG102616 and VEG105192 (see Appendix 2 for details). Due to sample size considerations, only pharmacogenetic results from White subjects participating in studies VEG102616 (n=116) and VEG105192 (n=130) were considered. Inferential analyses were performed using White subjects from VEG102616 in the primary analysis and White subjects from VEG105192 in the confirmatory analysis. Statistical analyses were also performed for confirmed markers using White subjects combined from both studies: VEG102616 and VEG105192.
Blood DNA was genotyped for germline variations in 282 candidate genes or gene regions associated to drug induced liver injury (DILI), ADME and pazopanib mechanism of action, encompassing a total of 9,308 selected SNPs. In addition, HLA genotypes and the UGT1A1 TA repeat polymorphism were evaluated. For the UGT1A1 TA repeat polymorphism genotyping, the FDA-cleared Third Wave Invader Assay was used. Alleles other than (TA)6 or (TA)7 were reported as missing.
Quantitative trait analysis (QTA) and case-control (CC) analysis were used to evaluate the association of genotypes with pazopanib induced ALT and TBL elevation. Associations were declared statistically significant at the P = 0.01 level. ALT elevations and TBL elevations were analyzed as independent endpoints. ALT case was defined as any pazopanib-treated subject who had one or more on-treatment ALT measurements of ≥ 3.0xULN, while an ALT control had all on-treatment ALT measurements within the reference range. A TBL case was defined as any pazopanib-treated subject who had one or more on-treatment TBL measurements of ≥ 1.5xULN, while a TBL control had all on-treatment TBL measurements within the reference range.
28
Results for each endpoint are summarized below.
Genetic association with pazopanib induced ALT elevation: The sponsor reports that polymorphisms in 39 genes were associated with ALT elevation in the primary analysis using White subjects from study VEG102616. Among these, two polymorphisms (rs2858996 and rs707889) located in the HFE gene were significantly associated with ALT elevation in the confirmatory analysis with White subjects from study VEG105192. No evidence of deviation from HWE is reported (p >0.49). These two polymorphisms were highly correlated, and thus only the analysis results for rs2858996 are reported.
The TT genotype of marker rs2858996 was associated with an increased risk of ALT elevation in pazopanib-treated White subjects from both studies, VEG102616 and VEG105192, with an odds ratio (with 95% confidence interval) of 15.5 (0.8, 301.0), and 28.0 (1.4, 546.9) respectively for the risk genotype against the other genotypes
In the combined analysis with White subjects from VEG102616 and VEG105192 studies, the sponsor reports that a statistically significant difference in the HFE (rs2858996) genotype distributions between ALT cases (≥3xULN) and controls (≤1xULN) (FET p = 6.50 x 10⁻⁵). Twelve subjects had the TT genotype. Of these, 8 (67%) were ALT cases and none were ALT controls. The remaining four subjects with the TT genotype had maximum ALT greater than 1xULN and less than 3xULN. These data predicted an odds ratio (95% CI) of 39.7 (2.24, 703.7) for cases versus controls, in relation to TT homozygotes versus the GG and GT genotypes.
Within the pharmacogenetic analysis populations, two subjects (subject 233 from study VEG102616 and subject 170 from study VEG105192) met the laboratory criteria for potential severe drug-induced liver injury (ALT >3xULN, TBL >2xULN, alkaline phosphatase <2xULN). None of the subjects had the TT risk genotype. The HFE rs2858996 genotype for both subjects was GG.
Based on known allele frequencies in multiple ethnic/racial populations (dbSNP), the expected frequencies for the rs2858996 TT genotype in populations of European, Asian, and African ancestry are aprroximately 3.4%, 4.5%, and <1%, respectively. Based on these low frequencies, the high proportion of ALT elevation events observed in pazopanib-treated patients cannot be explained solely by the TT genotype. The clinical significance of the association rs2858996 marker with ALT elevation in pazopanib-treated patients remains to be further investigated.
Genetic association with pazopanib induced TBL elevation: The sponsor reports a significant association with TBL elevation and UGT1A1 genotype, especially with the UGT1A1 *28 allele.
Initially, markers in 36 genes were significantly associated with TBL elevation in the primary pharmacogenetic analysis with VEG102616. In the confirmatory analysis with VEG105192 White subjects, ten markers in the UGT1A cluster region (rs4347832, rs11680450, rs6759892, rs1105879, rs6715829, rs6725478, rs869283, rs887829, rs8175347, and rs6742078) were significantly associated with TBL elevation. No evidence of deviation from HWE is reported (p>0.16).
The UGT1A1 TA repeat polymorphism (rs8175347) was previously associated with plasma bilirubin concentration and with drug induced hyperbilirubinemia in the literature. The UGT1A1*28 allele corresponds to a promoter TA insertion polymorphism also known as (TA)7 (wild-type= (TA)6). UGT1A1*28 is implicated with Gilbert’s syndrome in Caucasians, a mild unconjugated nonhemolytic hyperbilirubinemia that does not lead to liver
29
failure. Approximately 40% of Caucasians have at least one UGT1A1*28 allele and the incidence of Gilbert’s syndrome in this population is approximately 10%. The Gilbert’s phenotype is also described in association with other UGT1A1 alleles, as for example UGT1A1*29 (Pharmacogenomics. 2008 Jun; 9(6):703-15; PMID: 18518849).
The other UGT1A cluster markers were strongly correlated to the (TA)7 repeat polymorphism. After adjusting for the effect of UGT1A1 TA repeat polymorphism on TBL, no additional independent significant genetic associations were reported. A statistically significant difference in the UGT1A1 TA repeat genotype distributions was observed between cases and controls among the combined White subjects from study VEG102616 and VEG105192 (FET p=1.75 x 10⁻⁸). Larger sample sizes may have been required to capture low frequency variants, or variants with smaller contributions to total serum bilirubin elevation. It is of note that potentially relevant polymorphisms to bilirubin elevation may not have been tested.
Among subjects homozygotes for the UGT1A1*28 allele (n=37), 49% had TBL ≥1.5 x ULN, 24% had TBL greater than 1xULN and less than 1.5xULN and 27% had TBL within the normal range (1xULN or less). The sponsor indicated that approximately 35% of White subjects presented maximum TBL > 1 x ULN, and 16% (38/236) had levels 1.5 ≥ x ULN. Approximately 47% (18/38) of the subjects with TBL (≥1.5 x ULN) were homozogotes for UGT1A1*28, while 84% of subjects (32/38) carried at least one copy of the (TA)7 allele. These data predicted an odds ratio (95% CI) of 12.5 (5.2, 30.4) for cases versus controls, in relation to UGT1A1* 28 (TA)7 homozygotes versus the other TA genotypes (wild-type and heterozygote (TA)6/(TA)7). The same two subjects who met the laboratory criteria for potential severe drug-induced liver injury described above were heterozygotes for UGT1A1 TA repeat polymorphism (UGT1A1*28; (TA)6/(TA)7).
To conclude, pazopanib-induced TBL elevation in White subjects was significantly associated with the UGT1A1 TA repeat polymorphism marker rs8175347.
The contribution of UGT1A1 genotype to drug-induced hyperbilirubinemia has been evaluated previously for other TKIs. Most notably, as reflected in the nilotinib drug label, the (TA)7/(TA)7 genotype was associated with a statistically significant increase in the risk of hyperbilirubinemia in nilotinib-treated patients. The largest increases in bilirubin were observed in the (TA)7/(TA)7 genotype (UGT1A1*28) patients (Tasigna (nilotinib), full prescribing information). Dose adjustments are based on bilirubin concentrations and not UGT1A1 genotypes per se. Of note, both pazopanib and nilotinib are inhibitors of UGT1A1 in vitro, which may contribute to an increased susceptibility to hyperbilirubinemia in subjects having the UGT1A1*28 allele (i.e., genetically-reduced UGT1A1 activity). Furthermore, UGT1A1 genotype associations with drug-induced increases in TBL have been described for other drugs known to be UGT1A1 inhibitors of the bilirubin clearance pathways (Proc Natl Acad Sci U S A. 2001 Oct 23;98(22):12671-6..PMID: 11606755)
These examples add support to the sponsor’s reported association between UGT1A1 and hyperbilirubinemia. These examples also suggest that both an underlying genetic predisposition to Gilbert’s syndrome and direct drug-induced inhibition of UGT1A1 contribute to drug-induced hyperbilirubinemia. Are genetic variants associated with pazopanib-induced hypertension in patients with renal cell carcinoma?
The sponsor conducted an analysis to determine if candidate germline polymorphisms of genes implicated in angiogenesis were associated with pazopanib efficacy and hypertension
30
in studies VEG105192 and VEG102216 (see Appendix 2 for full report).
70% (303/435) of the study VEG105192 ITT population provided informed consent and a blood sample. 281 (65%) subjects had sufficient DNA for genotyping, and 279 subjects (181 pazopanib-treated subjects and 98 placebo-treated subjects) passed a subject quality control check. 79% (178/225) of the study VEG102616 ITT population provided written informed consent. 165 (73% of the total sample) subjects had sufficient DNA for genotyping, and 164 subjects passed a subject quality control check. All VEG102616 subjects were treated with pazopanib. The ITT population from VEG105192 with genotype data was used for association with efficacy endpoints, while pazopanib-treated subjects from VEG105192 and VEG102616 studies who had genotype data (n=345) were used for hypertension analyses.
PFS, OS and response rate were used as efficacy endpoints. Two endpoints were used for the hypertension/genotype analyses: 1) maximum increase in mean arterial pressure (MAP), and 2) the NCI CTCAE v3.0 hypertension grade.
No significant association was found between the twelve tested polymorphisms and pazopanib efficacy at p < 0.01 (study VEG105192). No significant association was found between the twelve tested polymorphisms and maximum increase in MAP while on pazopanib or with severe hypertension as measured by CTCAE v3.0 grade 3 or 4 hypertension at p < 0.01 (combined data from studies VEG105192 and VEG102616). Based on a priori assumptions of the genetic effect, the sponsor was underpowered to detect a relationship between VEGF variants and pazopanib-induced blood pressure changes (range of power estimates: 0.4 to 50.1%). 2.3.2.4 What pregnancy and lactation use information is there in the application?
No data regarding the excretion of pazopanib and its metabolites in the milk of humans or animals was provided.
2.4 EXTRINSIC FACTORS
2.4.1 What extrinsic factors (drugs, herbal products, diet, smoking, and alcohol use) influence dose-exposure and/or -response and what is the impact of any differences in exposure on response?
As shown in Table 11 above, several extrinsic factors influence the dose-exposure properties of pazopanib. It was shown that the coadministration of lapatinib, a CYP3A4 inhibitor, resulted in a 36% (95% CI: 14 – 58%) reduction in clearance. Coadministration of pazopanib with food was estimated to result in a 2.62-fold (95% CI: 1.98 – 3.26) increase in bioavailability and was associated with a slowing in the absorption rate constant. Coadministration of pazopanib with drugs that increase gastric pH resulted in increased bioavailability of approximately 39% (95% CI: 15 – 63%). In addition, the population PK analysis shows that the bioavailability of pazopanib at 400 mg/day is 40% (95% CI: 18-62) higher than the 800 mg/day dose. The increased bioavailability with higher doses is hypothesized to be due to lower gastric solubility at higher doses, which limits the amount of drug available for absorption across the to the systemic circulation. Additional details regarding the influence of extrinsic factors on pazopanib exposure are provided in the next sections.
2.4.2 Drug-drug interactions 2.4.2.1 Is there an in vitro basis to suspect in vivo drug-drug interactions?
In vitro studies show that the major enzymes involved in metabolism of pazopanib are
31
CYP3A4 enzymes. Therefore inhibitors and inducers of CYP3A4 could affect the pharmacokinetics of pazopanib see section 2.4.2.7 for more detail.
In an in vitro study pazopanib was shown to have moderate to marked inhibition potentials of the following enzymes (IC50 provided in parenthesis): CYP1A2 (16 µM), CYP2B6 (15 µM), CYP2C8 (10 µM), CYP2C9 (7.9 µM), CYP2C19 (11 µM), CYP2D6 (18 µM), CYP2E1 (17 µM), CYP3A4 (11 to 14 µM). There was no evidence for in vitro time dependent inhibition of CYP450 enzymes by pazopanib. Pazopanib is also shown to induce CYP3A4 and CYP2B6 enzymes. 2.4.2.2 Is the drug a substrate of CYP enzymes? Is metabolism influenced by genetics?
An In vitro study (04DMM010) with expressed enzymes and human liver microsomes (HLM) show that the following enzymes are involved in forming the primary oxidative metabolites of pazopanib:
Mono-oxygenated metabolite M22, M26,: CYP1A2, 2C8, 2C9/19, 3A4, and HLM
Demethylated metabolite M27: CYP1A2, and HLM
When the results were normalized based on their abundance in the human liver, nearly all of the in vitro oxidative metabolism of pazopanib in human liver is primarily mediated by CYP3A4, with minor contributions from CYP1A2 and CYP2C8. The influence of CYP3A4 inhibition on the exposure of pazopanib is described in section 2.4.2.7. 2.4.2.3 Is the drug an inhibitor and/or an inducer of CYP enzymes?
In vitro CYP inhibition
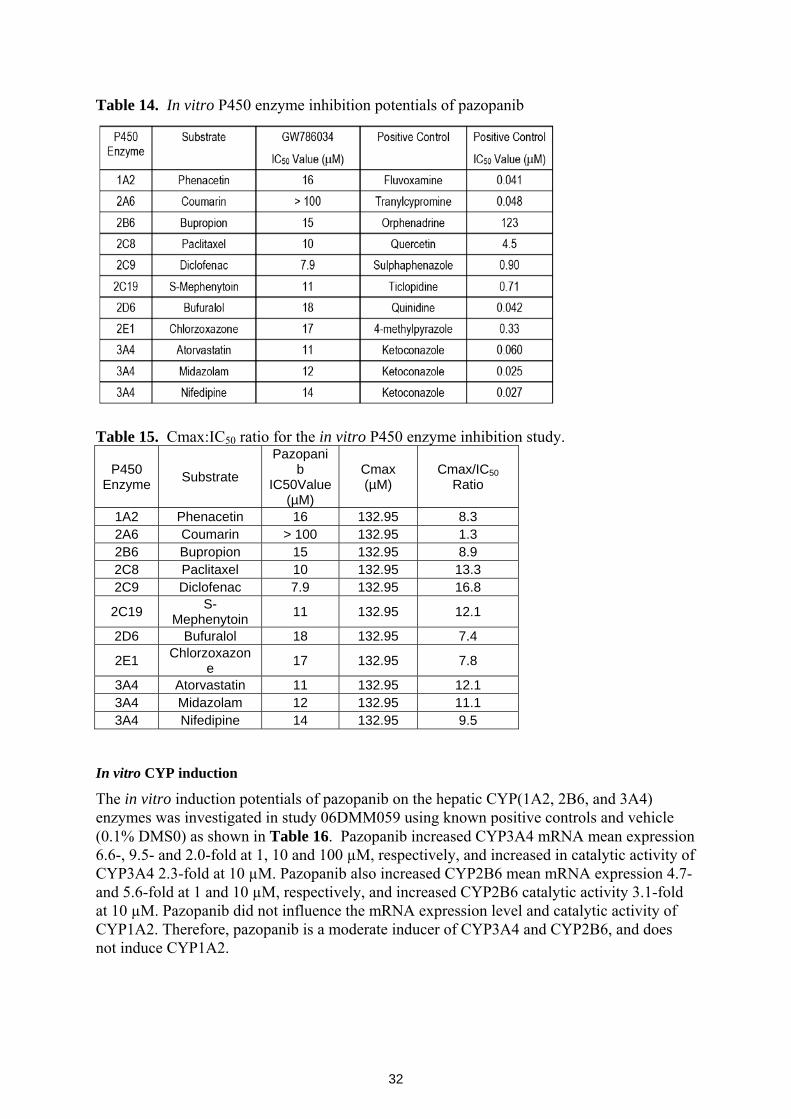
The enzymatic metabolic activities CYP1A2, CYP2A6, CYP2B6, CYP2C8, CYP2C9, CYP2C19, CYP2D6, CYP2E1, and CYP3A4 were investigated in human liver microsomes in the presence and absence of pazopanib. The potential for pazopanib to inhibit enzymatic activity in a time- and NADPH-dependent manner was also assessed. Known enzyme substrates and known positive controls for the particular enzymes were used as shown in (Table 14). The P450 substrates used in the in vitro study conform to FDA’s drug interaction guidance list of “Preferred and acceptable substrates for in vitro experiment.”
Results of the in vitro CYP450 inhibition study show that pazopanib inhibits P450 enzymes with an IC50 range of 8 to more than 17 µM (Table 14), except for CYP2A6 which has an IC50 of more than 100. Using pazopanib Cmax (58.1 µg/mL) from the cocktail drug-drug interaction study (VEG10007), the Cmax:IC50 ratio values were calculated for the P450 enzymes, and ranged from 7.4 to 16.8 (Table 15). The findings from this in vitro study were basis to conduct a cocktail drug-drug interaction study in patients with solid tumors. However, in vitro data do not show time dependent inhibition of P450 enzymes by pazopanib.
32
Table 14. In vitro P450 enzyme inhibition potentials of pazopanib
Table 15. Cmax:IC50 ratio for the in vitro P450 enzyme inhibition study.
P450 Enzyme Substrate
Pazopanib
IC50Value (µM)
Cmax (µM)
Cmax/IC50 Ratio
1A2 Phenacetin 16 132.95 8.3 2A6 Coumarin > 100 132.95 1.3 2B6 Bupropion 15 132.95 8.9 2C8 Paclitaxel 10 132.95 13.3 2C9 Diclofenac 7.9 132.95 16.8
2C19 S-Mephenytoin 11 132.95 12.1
2D6 Bufuralol 18 132.95 7.4
2E1 Chlorzoxazone 17 132.95 7.8
3A4 Atorvastatin 11 132.95 12.1 3A4 Midazolam 12 132.95 11.1 3A4 Nifedipine 14 132.95 9.5
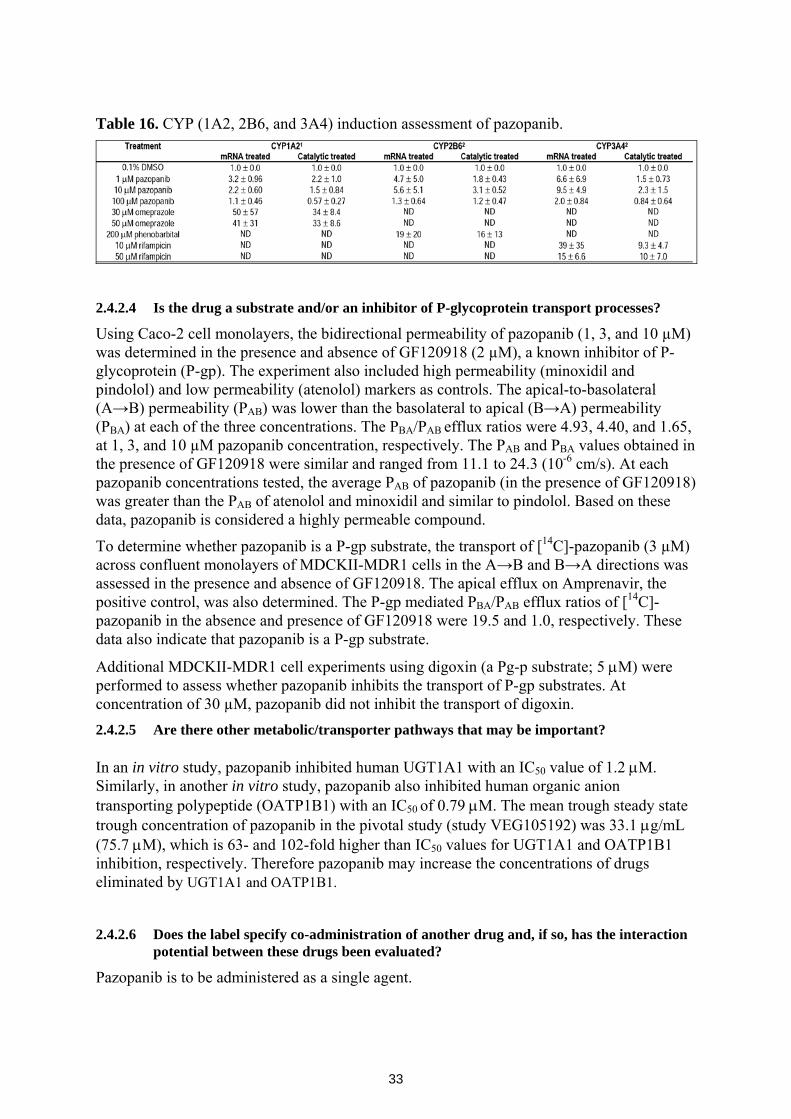
In vitro CYP induction
The in vitro induction potentials of pazopanib on the hepatic CYP(1A2, 2B6, and 3A4) enzymes was investigated in study 06DMM059 using known positive controls and vehicle (0.1% DMS0) as shown in Table 16. Pazopanib increased CYP3A4 mRNA mean expression 6.6-, 9.5- and 2.0-fold at 1, 10 and 100 µM, respectively, and increased in catalytic activity of CYP3A4 2.3-fold at 10 µM. Pazopanib also increased CYP2B6 mean mRNA expression 4.7- and 5.6-fold at 1 and 10 µM, respectively, and increased CYP2B6 catalytic activity 3.1-fold at 10 µM. Pazopanib did not influence the mRNA expression level and catalytic activity of CYP1A2. Therefore, pazopanib is a moderate inducer of CYP3A4 and CYP2B6, and does not induce CYP1A2.
33
Table 16. CYP (1A2, 2B6, and 3A4) induction assessment of pazopanib.
2.4.2.4 Is the drug a substrate and/or an inhibitor of P-glycoprotein transport processes?
Using Caco-2 cell monolayers, the bidirectional permeability of pazopanib (1, 3, and 10 µM) was determined in the presence and absence of GF120918 (2 µM), a known inhibitor of P-glycoprotein (P-gp). The experiment also included high permeability (minoxidil and pindolol) and low permeability (atenolol) markers as controls. The apical-to-basolateral (A→B) permeability (PAB) was lower than the basolateral to apical (B→A) permeability (PBA) at each of the three concentrations. The PBA/PAB efflux ratios were 4.93, 4.40, and 1.65, at 1, 3, and 10 µM pazopanib concentration, respectively. The PAB and PBA values obtained in the presence of GF120918 were similar and ranged from 11.1 to 24.3 (10-6 cm/s). At each pazopanib concentrations tested, the average PAB of pazopanib (in the presence of GF120918) was greater than the PAB of atenolol and minoxidil and similar to pindolol. Based on these data, pazopanib is considered a highly permeable compound.
To determine whether pazopanib is a P-gp substrate, the transport of [14C]-pazopanib (3 µM) across confluent monolayers of MDCKII-MDR1 cells in the A→B and B→A directions was assessed in the presence and absence of GF120918. The apical efflux on Amprenavir, the positive control, was also determined. The P-gp mediated PBA/PAB efflux ratios of [14C]-pazopanib in the absence and presence of GF120918 were 19.5 and 1.0, respectively. These data also indicate that pazopanib is a P-gp substrate.
Additional MDCKII-MDR1 cell experiments using digoxin (a Pg-p substrate; 5 μM) were performed to assess whether pazopanib inhibits the transport of P-gp substrates. At concentration of 30 µM, pazopanib did not inhibit the transport of digoxin. 2.4.2.5 Are there other metabolic/transporter pathways that may be important? In an in vitro study, pazopanib inhibited human UGT1A1 with an IC50 value of 1.2 μM. Similarly, in another in vitro study, pazopanib also inhibited human organic anion transporting polypeptide (OATP1B1) with an IC50 of 0.79 μM. The mean trough steady state trough concentration of pazopanib in the pivotal study (study VEG105192) was 33.1 μg/mL (75.7 μM), which is 63- and 102-fold higher than IC50 values for UGT1A1 and OATP1B1 inhibition, respectively. Therefore pazopanib may increase the concentrations of drugs eliminated by UGT1A1 and OATP1B1.
2.4.2.6 Does the label specify co-administration of another drug and, if so, has the interaction
potential between these drugs been evaluated?
Pazopanib is to be administered as a single agent.
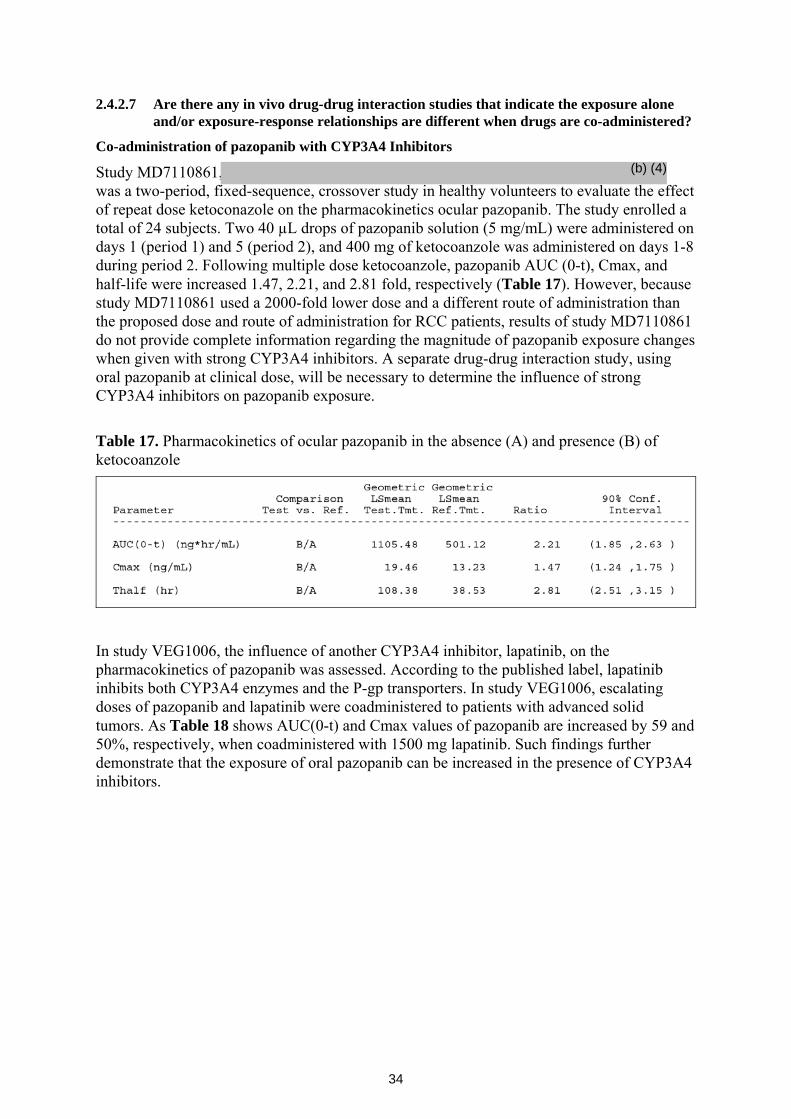
34
2.4.2.7 Are there any in vivo drug-drug interaction studies that indicate the exposure alone and/or exposure-response relationships are different when drugs are co-administered?
Co-administration of pazopanib with CYP3A4 Inhibitors
Study MD7110861, was a two-period, fixed-sequence, crossover study in healthy volunteers to evaluate the effect of repeat dose ketoconazole on the pharmacokinetics ocular pazopanib. The study enrolled a total of 24 subjects. Two 40 µL drops of pazopanib solution (5 mg/mL) were administered on days 1 (period 1) and 5 (period 2), and 400 mg of ketocoanzole was administered on days 1-8 during period 2. Following multiple dose ketocoanzole, pazopanib AUC (0-t), Cmax, and half-life were increased 1.47, 2.21, and 2.81 fold, respectively (Table 17). However, because study MD7110861 used a 2000-fold lower dose and a different route of administration than the proposed dose and route of administration for RCC patients, results of study MD7110861 do not provide complete information regarding the magnitude of pazopanib exposure changes when given with strong CYP3A4 inhibitors. A separate drug-drug interaction study, using oral pazopanib at clinical dose, will be necessary to determine the influence of strong CYP3A4 inhibitors on pazopanib exposure.
Table 17. Pharmacokinetics of ocular pazopanib in the absence (A) and presence (B) of ketocoanzole
In study VEG1006, the influence of another CYP3A4 inhibitor, lapatinib, on the pharmacokinetics of pazopanib was assessed. According to the published label, lapatinib inhibits both CYP3A4 enzymes and the P-gp transporters. In study VEG1006, escalating doses of pazopanib and lapatinib were coadministered to patients with advanced solid tumors. As Table 18 shows AUC(0-t) and Cmax values of pazopanib are increased by 59 and 50%, respectively, when coadministered with 1500 mg lapatinib. Such findings further demonstrate that the exposure of oral pazopanib can be increased in the presence of CYP3A4 inhibitors.
(b) (4)
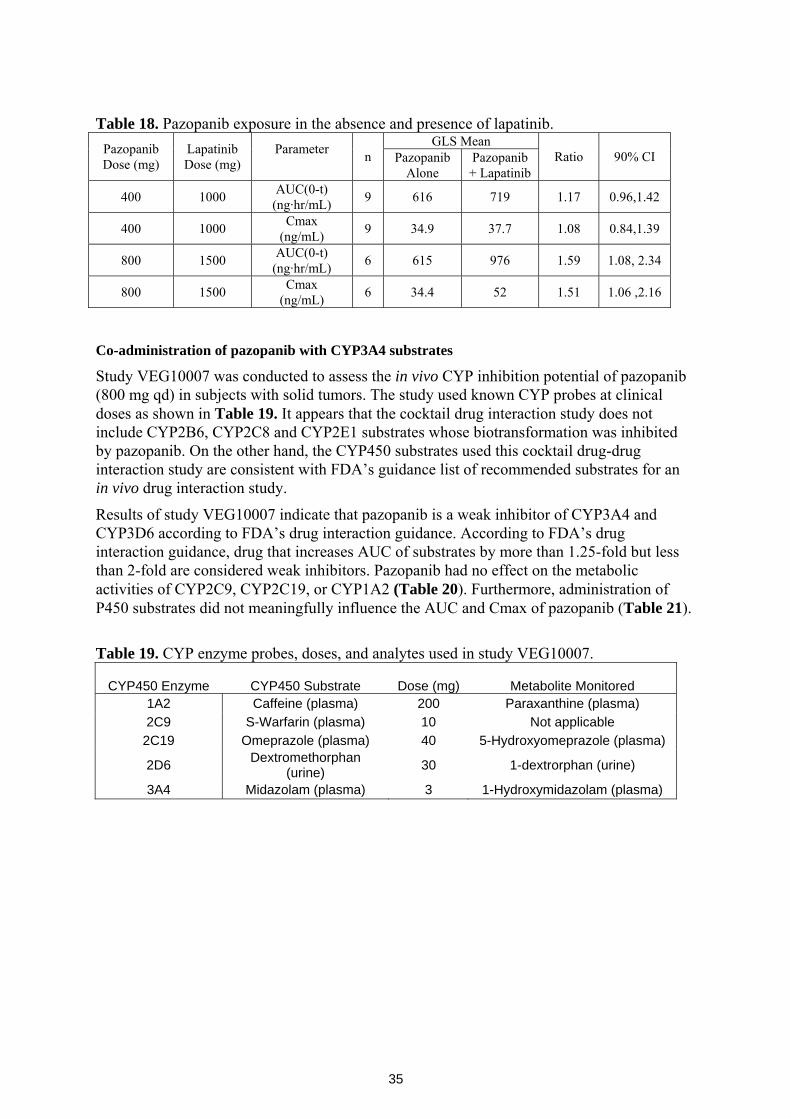
35
Table 18. Pazopanib exposure in the absence and presence of lapatinib.
GLS Mean Pazopanib Dose (mg)
Lapatinib Dose (mg)
Parameter n Pazopanib
Alone Pazopanib + Lapatinib
Ratio 90% CI
400 1000 AUC(0-t) (ng·hr/mL) 9 616 719 1.17 0.96,1.42
400 1000 Cmax (ng/mL) 9 34.9 37.7 1.08 0.84,1.39
800 1500 AUC(0-t) (ng·hr/mL) 6 615 976 1.59 1.08, 2.34
800 1500 Cmax (ng/mL) 6 34.4 52 1.51 1.06 ,2.16
Co-administration of pazopanib with CYP3A4 substrates
Study VEG10007 was conducted to assess the in vivo CYP inhibition potential of pazopanib (800 mg qd) in subjects with solid tumors. The study used known CYP probes at clinical doses as shown in Table 19. It appears that the cocktail drug interaction study does not include CYP2B6, CYP2C8 and CYP2E1 substrates whose biotransformation was inhibited by pazopanib. On the other hand, the CYP450 substrates used this cocktail drug-drug interaction study are consistent with FDA’s guidance list of recommended substrates for an in vivo drug interaction study.
Results of study VEG10007 indicate that pazopanib is a weak inhibitor of CYP3A4 and CYP3D6 according to FDA’s drug interaction guidance. According to FDA’s drug interaction guidance, drug that increases AUC of substrates by more than 1.25-fold but less than 2-fold are considered weak inhibitors. Pazopanib had no effect on the metabolic activities of CYP2C9, CYP2C19, or CYP1A2 (Table 20). Furthermore, administration of P450 substrates did not meaningfully influence the AUC and Cmax of pazopanib (Table 21).
Table 19. CYP enzyme probes, doses, and analytes used in study VEG10007.
CYP450 Enzyme CYP450 Substrate Dose (mg) Metabolite Monitored
1A2 Caffeine (plasma) 200 Paraxanthine (plasma) 2C9 S-Warfarin (plasma) 10 Not applicable
2C19 Omeprazole (plasma) 40 5-Hydroxyomeprazole (plasma)
2D6 Dextromethorphan (urine) 30 1-dextrorphan (urine)
3A4 Midazolam (plasma) 3 1-Hydroxymidazolam (plasma)
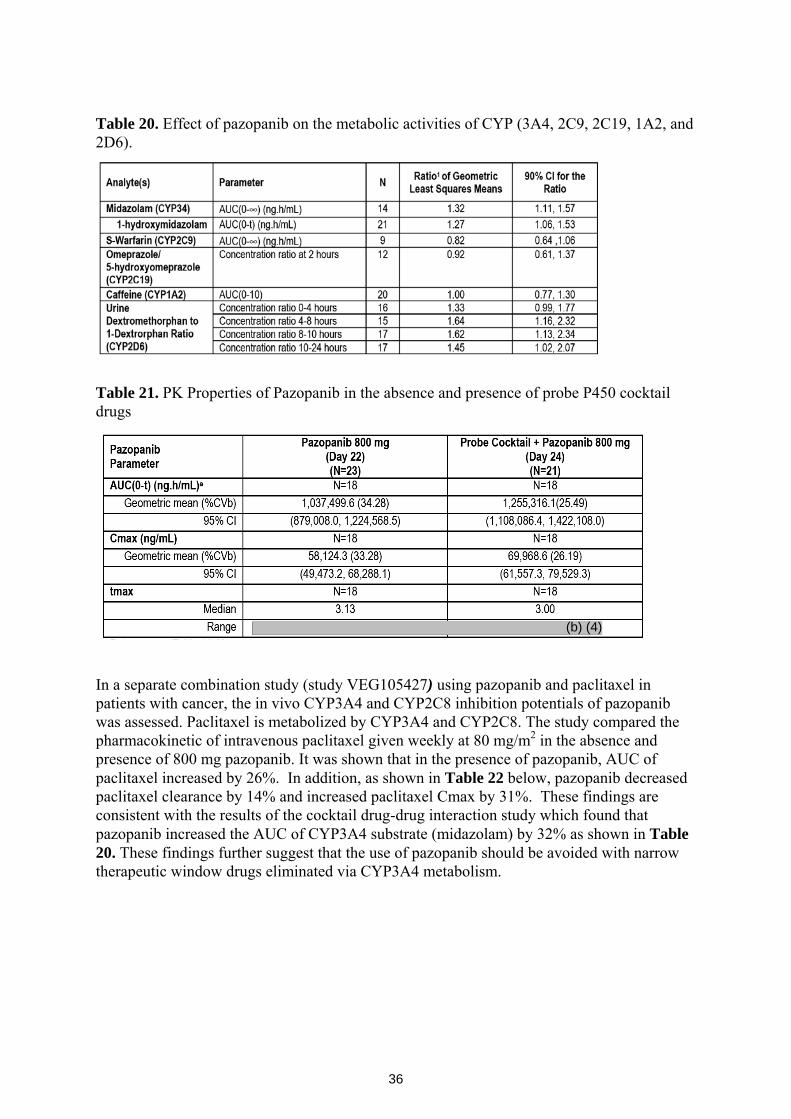
36
Table 20. Effect of pazopanib on the metabolic activities of CYP (3A4, 2C9, 2C19, 1A2, and 2D6).
Table 21. PK Properties of Pazopanib in the absence and presence of probe P450 cocktail drugs
In a separate combination study (study VEG105427) using pazopanib and paclitaxel in patients with cancer, the in vivo CYP3A4 and CYP2C8 inhibition potentials of pazopanib was assessed. Paclitaxel is metabolized by CYP3A4 and CYP2C8. The study compared the pharmacokinetic of intravenous paclitaxel given weekly at 80 mg/m2 in the absence and presence of 800 mg pazopanib. It was shown that in the presence of pazopanib, AUC of paclitaxel increased by 26%. In addition, as shown in Table 22 below, pazopanib decreased paclitaxel clearance by 14% and increased paclitaxel Cmax by 31%. These findings are consistent with the results of the cocktail drug-drug interaction study which found that pazopanib increased the AUC of CYP3A4 substrate (midazolam) by 32% as shown in Table 20. These findings further suggest that the use of pazopanib should be avoided with narrow therapeutic window drugs eliminated via CYP3A4 metabolism.
(b) (4)
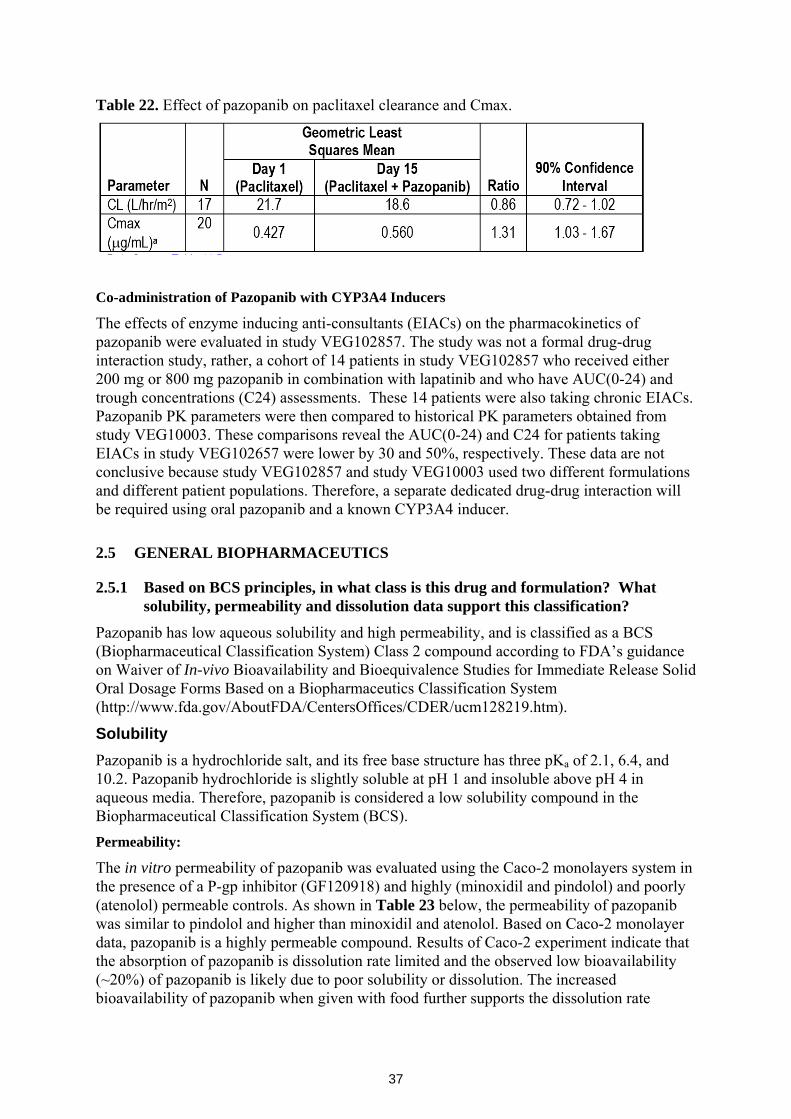
37
Table 22. Effect of pazopanib on paclitaxel clearance and Cmax.
Co-administration of Pazopanib with CYP3A4 Inducers
The effects of enzyme inducing anti-consultants (EIACs) on the pharmacokinetics of pazopanib were evaluated in study VEG102857. The study was not a formal drug-drug interaction study, rather, a cohort of 14 patients in study VEG102857 who received either 200 mg or 800 mg pazopanib in combination with lapatinib and who have AUC(0-24) and trough concentrations (C24) assessments. These 14 patients were also taking chronic EIACs. Pazopanib PK parameters were then compared to historical PK parameters obtained from study VEG10003. These comparisons reveal the AUC(0-24) and C24 for patients taking EIACs in study VEG102657 were lower by 30 and 50%, respectively. These data are not conclusive because study VEG102857 and study VEG10003 used two different formulations and different patient populations. Therefore, a separate dedicated drug-drug interaction will be required using oral pazopanib and a known CYP3A4 inducer.
2.5 GENERAL BIOPHARMACEUTICS
2.5.1 Based on BCS principles, in what class is this drug and formulation? What solubility, permeability and dissolution data support this classification?
Pazopanib has low aqueous solubility and high permeability, and is classified as a BCS (Biopharmaceutical Classification System) Class 2 compound according to FDA’s guidance on Waiver of In-vivo Bioavailability and Bioequivalence Studies for Immediate Release Solid Oral Dosage Forms Based on a Biopharmaceutics Classification System (http://www.fda.gov/AboutFDA/CentersOffices/CDER/ucm128219.htm).
Solubility Pazopanib is a hydrochloride salt, and its free base structure has three pKa of 2.1, 6.4, and 10.2. Pazopanib hydrochloride is slightly soluble at pH 1 and insoluble above pH 4 in aqueous media. Therefore, pazopanib is considered a low solubility compound in the Biopharmaceutical Classification System (BCS). Permeability:
The in vitro permeability of pazopanib was evaluated using the Caco-2 monolayers system in the presence of a P-gp inhibitor (GF120918) and highly (minoxidil and pindolol) and poorly (atenolol) permeable controls. As shown in Table 23 below, the permeability of pazopanib was similar to pindolol and higher than minoxidil and atenolol. Based on Caco-2 monolayer data, pazopanib is a highly permeable compound. Results of Caco-2 experiment indicate that the absorption of pazopanib is dissolution rate limited and the observed low bioavailability (~20%) of pazopanib is likely due to poor solubility or dissolution. The increased bioavailability of pazopanib when given with food further supports the dissolution rate
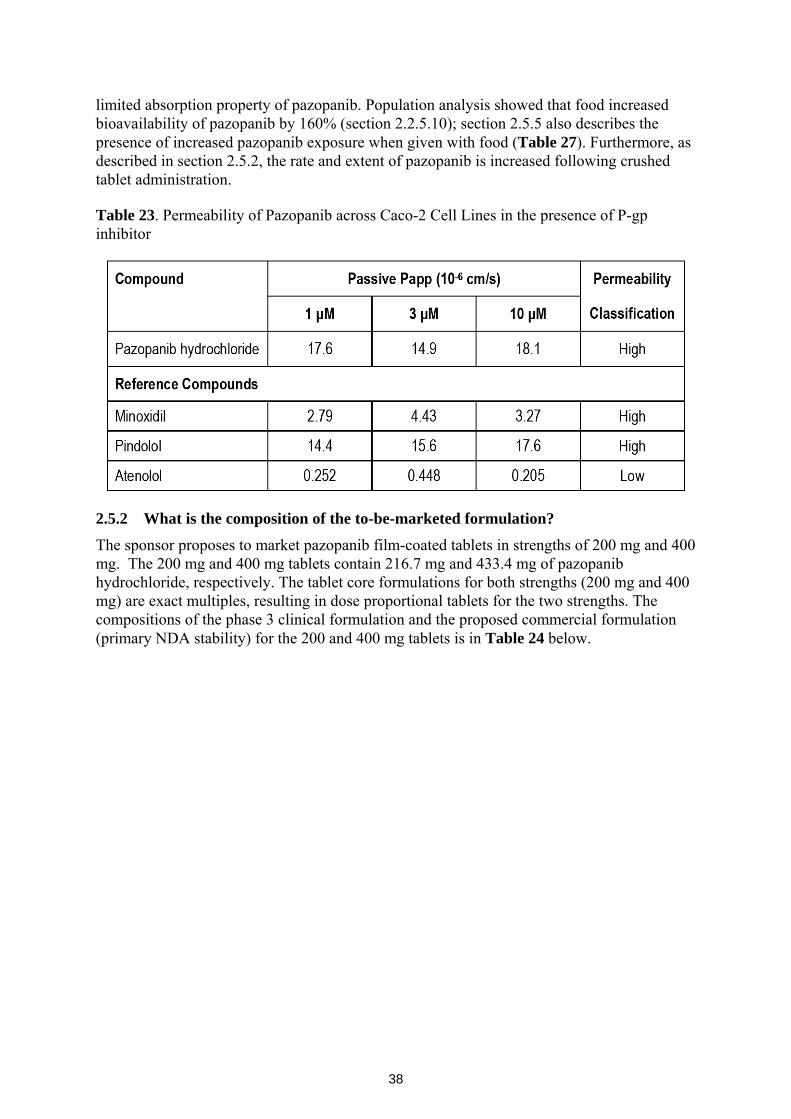
38
limited absorption property of pazopanib. Population analysis showed that food increased bioavailability of pazopanib by 160% (section 2.2.5.10); section 2.5.5 also describes the presence of increased pazopanib exposure when given with food (Table 27). Furthermore, as described in section 2.5.2, the rate and extent of pazopanib is increased following crushed tablet administration. Table 23. Permeability of Pazopanib across Caco-2 Cell Lines in the presence of P-gp inhibitor
2.5.2 What is the composition of the to-be-marketed formulation?
The sponsor proposes to market pazopanib film-coated tablets in strengths of 200 mg and 400 mg. The 200 mg and 400 mg tablets contain 216.7 mg and 433.4 mg of pazopanib hydrochloride, respectively. The tablet core formulations for both strengths (200 mg and 400 mg) are exact multiples, resulting in dose proportional tablets for the two strengths. The compositions of the phase 3 clinical formulation and the proposed commercial formulation (primary NDA stability) for the 200 and 400 mg tablets is in Table 24 below.
39
Table 24. Composition of phase 3 and proposed commercial pazopanib tablets.
Tablet vs. oral solution formulation Study VEG10005 compared the pharmacokinetic properties of tablet formulation (phase 3 clinical formulation) and crushed tablet formulation using a randomized crossover study design. Each patient received either a single 400 mg crushed tablet with a small amount of applesauce or a single whole tablet on day 1 and day 15. A total of 8 subjects were enrolled in the crushed tablet cohort of study VEG10005. Compared to whole tablet, the Cmax and AUC of pazopanib estimates were approximately 2- and 1.5-fold higher (Table 27). In addition, the Tmax of pazopanib decreased from 4 hours to 2.5 hours when given as a crushed tablet. Therefore both the rate and extent of pazopanib absorption is increased when administer as a crushed tablet. As described in section 2.5.1, these findings further support the hypothesis that pazopanib absorption is dissolution rate limited in the gastric/intestinal lumen.
(b) (4)
(b) (4) (b) (4)(b) (4)
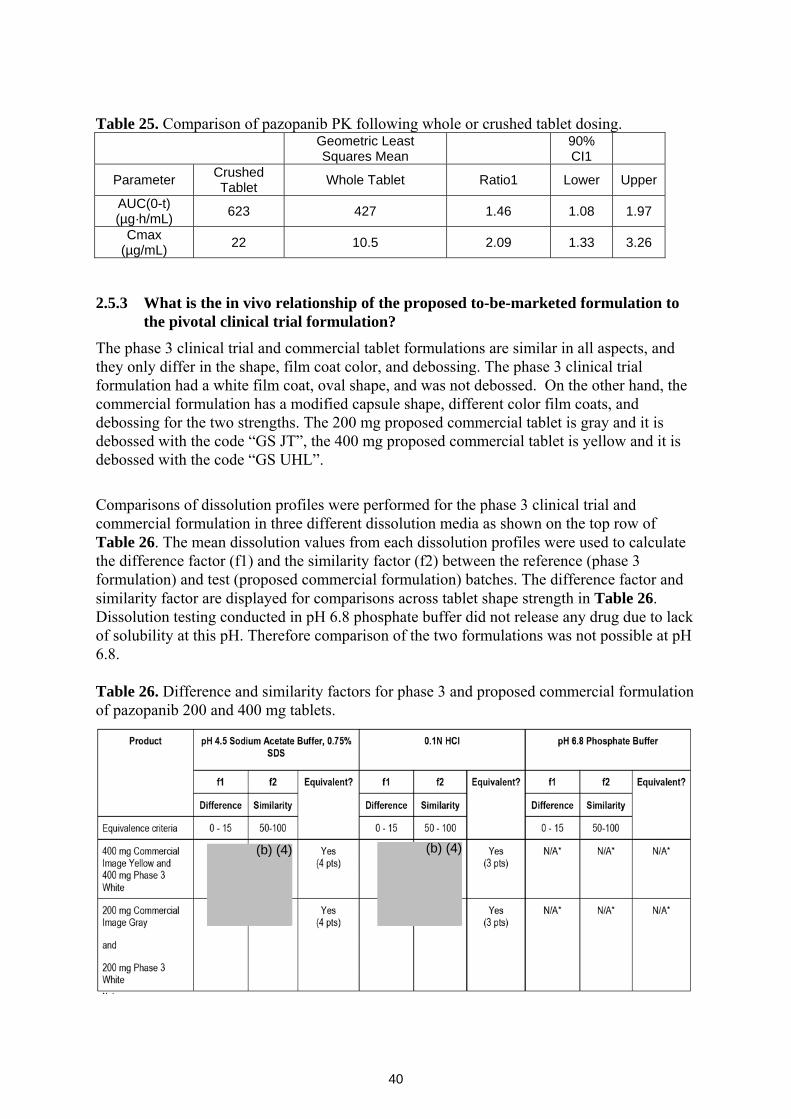
40
Table 25. Comparison of pazopanib PK following whole or crushed tablet dosing.
Geometric Least Squares Mean 90%
CI1
Parameter Crushed Tablet Whole Tablet Ratio1 Lower Upper
AUC(0-t) (µg·h/mL) 623 427 1.46 1.08 1.97
Cmax (µg/mL) 22 10.5 2.09 1.33 3.26
2.5.3 What is the in vivo relationship of the proposed to-be-marketed formulation to the pivotal clinical trial formulation?
The phase 3 clinical trial and commercial tablet formulations are similar in all aspects, and they only differ in the shape, film coat color, and debossing. The phase 3 clinical trial formulation had a white film coat, oval shape, and was not debossed. On the other hand, the commercial formulation has a modified capsule shape, different color film coats, and debossing for the two strengths. The 200 mg proposed commercial tablet is gray and it is debossed with the code “GS JT”, the 400 mg proposed commercial tablet is yellow and it is debossed with the code “GS UHL”.
Comparisons of dissolution profiles were performed for the phase 3 clinical trial and commercial formulation in three different dissolution media as shown on the top row of Table 26. The mean dissolution values from each dissolution profiles were used to calculate the difference factor (f1) and the similarity factor (f2) between the reference (phase 3 formulation) and test (proposed commercial formulation) batches. The difference factor and similarity factor are displayed for comparisons across tablet shape strength in Table 26. Dissolution testing conducted in pH 6.8 phosphate buffer did not release any drug due to lack of solubility at this pH. Therefore comparison of the two formulations was not possible at pH 6.8. Table 26. Difference and similarity factors for phase 3 and proposed commercial formulation of pazopanib 200 and 400 mg tablets.
(b) (4) (b) (4)
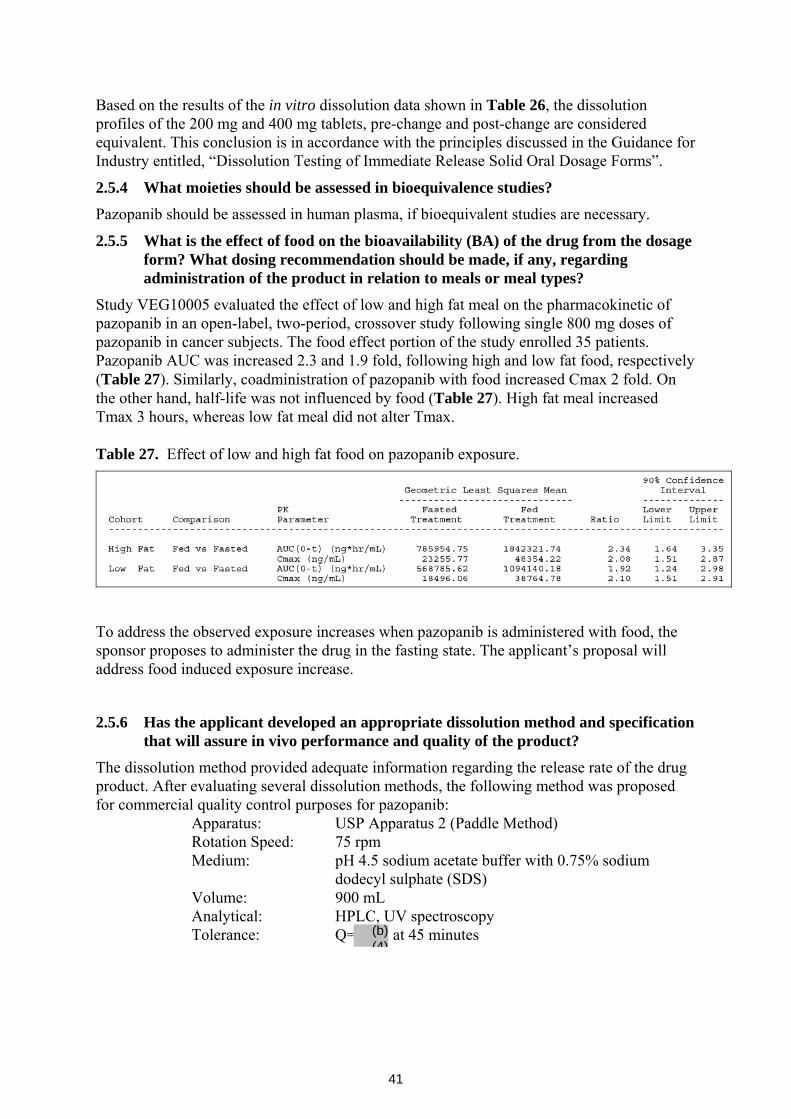
41
Based on the results of the in vitro dissolution data shown in Table 26, the dissolution profiles of the 200 mg and 400 mg tablets, pre-change and post-change are considered equivalent. This conclusion is in accordance with the principles discussed in the Guidance for Industry entitled, “Dissolution Testing of Immediate Release Solid Oral Dosage Forms”.
2.5.4 What moieties should be assessed in bioequivalence studies?
Pazopanib should be assessed in human plasma, if bioequivalent studies are necessary.
2.5.5 What is the effect of food on the bioavailability (BA) of the drug from the dosage form? What dosing recommendation should be made, if any, regarding administration of the product in relation to meals or meal types?
Study VEG10005 evaluated the effect of low and high fat meal on the pharmacokinetic of pazopanib in an open-label, two-period, crossover study following single 800 mg doses of pazopanib in cancer subjects. The food effect portion of the study enrolled 35 patients. Pazopanib AUC was increased 2.3 and 1.9 fold, following high and low fat food, respectively (Table 27). Similarly, coadministration of pazopanib with food increased Cmax 2 fold. On the other hand, half-life was not influenced by food (Table 27). High fat meal increased Tmax 3 hours, whereas low fat meal did not alter Tmax. Table 27. Effect of low and high fat food on pazopanib exposure.
To address the observed exposure increases when pazopanib is administered with food, the sponsor proposes to administer the drug in the fasting state. The applicant’s proposal will address food induced exposure increase.
2.5.6 Has the applicant developed an appropriate dissolution method and specification that will assure in vivo performance and quality of the product?
The dissolution method provided adequate information regarding the release rate of the drug product. After evaluating several dissolution methods, the following method was proposed for commercial quality control purposes for pazopanib: Apparatus: USP Apparatus 2 (Paddle Method) Rotation Speed: 75 rpm
Medium: pH 4.5 sodium acetate buffer with 0.75% sodium dodecyl sulphate (SDS)
Volume: 900 mL Analytical: HPLC, UV spectroscopy Tolerance: Q= at 45 minutes (b)
(4)
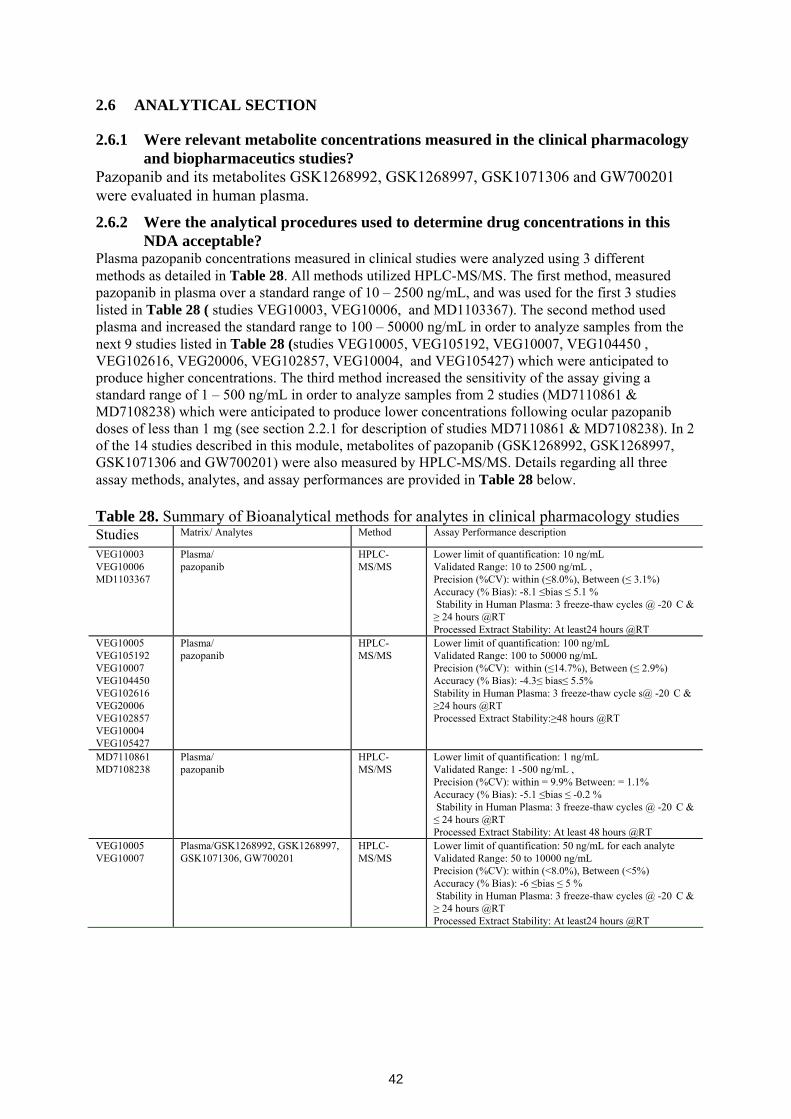
42
2.6 ANALYTICAL SECTION
2.6.1 Were relevant metabolite concentrations measured in the clinical pharmacology and biopharmaceutics studies?
Pazopanib and its metabolites GSK1268992, GSK1268997, GSK1071306 and GW700201 were evaluated in human plasma.
2.6.2 Were the analytical procedures used to determine drug concentrations in this NDA acceptable?
Plasma pazopanib concentrations measured in clinical studies were analyzed using 3 different methods as detailed in Table 28. All methods utilized HPLC-MS/MS. The first method, measured pazopanib in plasma over a standard range of 10 – 2500 ng/mL, and was used for the first 3 studies listed in Table 28 ( studies VEG10003, VEG10006, and MD1103367). The second method used plasma and increased the standard range to 100 – 50000 ng/mL in order to analyze samples from the next 9 studies listed in Table 28 (studies VEG10005, VEG105192, VEG10007, VEG104450 , VEG102616, VEG20006, VEG102857, VEG10004, and VEG105427) which were anticipated to produce higher concentrations. The third method increased the sensitivity of the assay giving a standard range of 1 – 500 ng/mL in order to analyze samples from 2 studies (MD7110861 & MD7108238) which were anticipated to produce lower concentrations following ocular pazopanib doses of less than 1 mg (see section 2.2.1 for description of studies MD7110861 & MD7108238). In 2 of the 14 studies described in this module, metabolites of pazopanib (GSK1268992, GSK1268997, GSK1071306 and GW700201) were also measured by HPLC-MS/MS. Details regarding all three assay methods, analytes, and assay performances are provided in Table 28 below. Table 28. Summary of Bioanalytical methods for analytes in clinical pharmacology studies Studies Matrix/ Analytes Method Assay Performance description
VEG10003 VEG10006 MD1103367
Plasma/ pazopanib
HPLC-MS/MS
Lower limit of quantification: 10 ng/mL Validated Range: 10 to 2500 ng/mL , Precision (%CV): within (≤8.0%), Between (≤ 3.1%) Accuracy (% Bias): -8.1 ≤bias ≤ 5.1 % Stability in Human Plasma: 3 freeze-thaw cycles @ -20 C & ≥ 24 hours @RT Processed Extract Stability: At least24 hours @RT
VEG10005 VEG105192 VEG10007 VEG104450 VEG102616 VEG20006 VEG102857 VEG10004 VEG105427
Plasma/ pazopanib
HPLC-MS/MS
Lower limit of quantification: 100 ng/mL Validated Range: 100 to 50000 ng/mL Precision (%CV): within (≤14.7%), Between (≤ 2.9%) Accuracy (% Bias): -4.3≤ bias≤ 5.5% Stability in Human Plasma: 3 freeze-thaw cycle s@ -20 C & ≥24 hours @RT Processed Extract Stability:≥48 hours @RT
MD7110861 MD7108238
Plasma/ pazopanib
HPLC-MS/MS
Lower limit of quantification: 1 ng/mL Validated Range: 1 -500 ng/mL , Precision (%CV): within = 9.9% Between: = 1.1% Accuracy (% Bias): -5.1 ≤bias ≤ -0.2 % Stability in Human Plasma: 3 freeze-thaw cycles @ -20 C & ≤ 24 hours @RT Processed Extract Stability: At least 48 hours @RT
VEG10005 VEG10007
Plasma/GSK1268992, GSK1268997, GSK1071306, GW700201
HPLC-MS/MS
Lower limit of quantification: 50 ng/mL for each analyte Validated Range: 50 to 10000 ng/mL Precision (%CV): within (<8.0%), Between (<5%) Accuracy (% Bias): -6 ≤bias ≤ 5 % Stability in Human Plasma: 3 freeze-thaw cycles @ -20 C & ≥ 24 hours @RT Processed Extract Stability: At least24 hours @RT

43
3 DETAILED LABELING RECOMMENDATIONS
Only relevant clinical pharmacology sections are included.
5 Pages Withheld as b(4) Draft Labeling

4 APPENDICES
APPENDIX 1 - PHARMACOMETRICS REVIEW
Pharmacometric Review Page 1 of 16
OFFICE OF CLINICAL PHARMACOLOGY: PHARMACOMETRIC REVIEW
Application Number 22465
Submission Number (Date) December 19, 2008
Compound Votrient (Pazopanib 800 mg QD)
Clinical Division DDOP
Primary PM Reviewer Bahru A Habtemariam, Pharm.D.
Secondary PM Reviewer Christoffer W. Tornoe, Ph.D.
1 Summary of Findings.................................................................................................. 2
1.1 Key Review Questions........................................................................................ 2
1.1.1 Is there evidence of exposure-response in the dose ranging study supporting the dose used for the pivotal trial? ............................................................ 2
1.1.2 Is there evidence of exposure-response for effectiveness in the pivotal trial? 4
1.1.3 Is there evidence of exposure-response for safety in the pivotal trial?....... 5
1.1.4 Is the proposed dose reduction scheme adequate?...................................... 6
1.2 Recommendations............................................................................................... 8
1.3 Label Statements................................................................................................. 9
2 Results of Sponsor’s Analysis .................................................................................. 10
3 Reviewer’s Analysis ................................................................................................. 12
3.1 Introduction....................................................................................................... 12
3.2 Objectives ......................................................................................................... 12
3.3 Methods............................................................................................................. 12
3.3.1 Data Sets ................................................................................................... 12
3.3.2 Software .................................................................................................... 12
3.4 Results............................................................................................................... 13
4 Appendix A: Synopsis of Sponsor’s Population PK Analysis ................................. 14
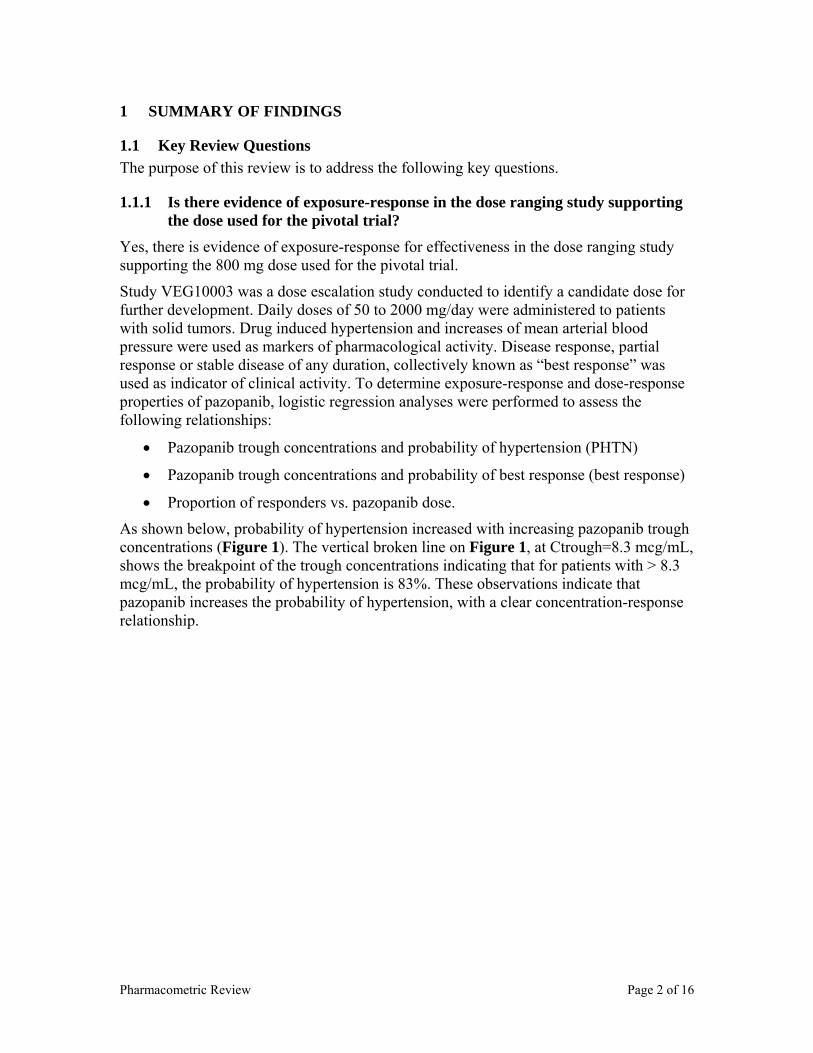
Pharmacometric Review Page 2 of 16
1 SUMMARY OF FINDINGS
1.1 Key Review Questions The purpose of this review is to address the following key questions.
1.1.1 Is there evidence of exposure-response in the dose ranging study supporting the dose used for the pivotal trial?
Yes, there is evidence of exposure-response for effectiveness in the dose ranging study supporting the 800 mg dose used for the pivotal trial.
Study VEG10003 was a dose escalation study conducted to identify a candidate dose for further development. Daily doses of 50 to 2000 mg/day were administered to patients with solid tumors. Drug induced hypertension and increases of mean arterial blood pressure were used as markers of pharmacological activity. Disease response, partial response or stable disease of any duration, collectively known as “best response” was used as indicator of clinical activity. To determine exposure-response and dose-response properties of pazopanib, logistic regression analyses were performed to assess the following relationships:
• Pazopanib trough concentrations and probability of hypertension (PHTN)
• Pazopanib trough concentrations and probability of best response (best response)
• Proportion of responders vs. pazopanib dose.
As shown below, probability of hypertension increased with increasing pazopanib trough concentrations (Figure 1). The vertical broken line on Figure 1, at Ctrough=8.3 mcg/mL, shows the breakpoint of the trough concentrations indicating that for patients with > 8.3 mcg/mL, the probability of hypertension is 83%. These observations indicate that pazopanib increases the probability of hypertension, with a clear concentration-response relationship.
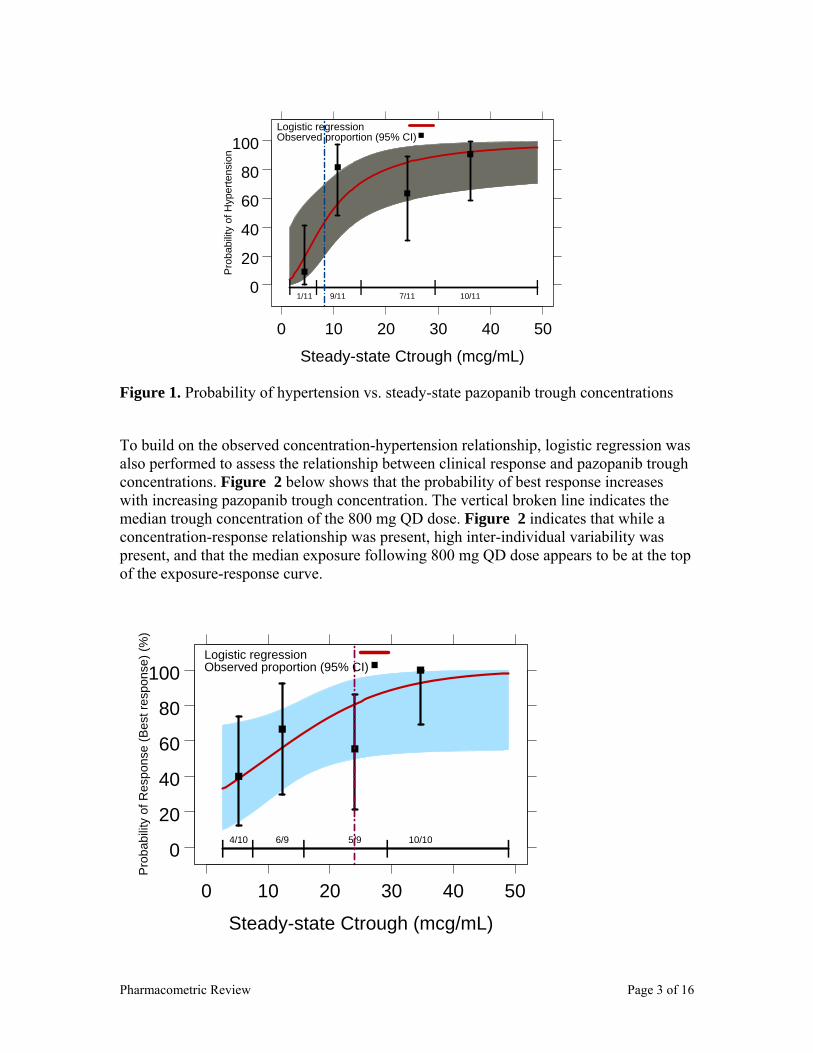
Pharmacometric Review Page 3 of 16
0
20
40
60
80
100
0 10 20 30 40 50
| | | | |1/11 9/11 7/11 10/11
Steady-state Ctrough (mcg/mL)
Pro
babi
lity
of H
yper
tens
ion
Logistic regressionObserved proportion (95% CI)
Figure 1. Probability of hypertension vs. steady-state pazopanib trough concentrations
To build on the observed concentration-hypertension relationship, logistic regression was also performed to assess the relationship between clinical response and pazopanib trough concentrations. Figure 2 below shows that the probability of best response increases with increasing pazopanib trough concentration. The vertical broken line indicates the median trough concentration of the 800 mg QD dose. Figure 2 indicates that while a concentration-response relationship was present, high inter-individual variability was present, and that the median exposure following 800 mg QD dose appears to be at the top of the exposure-response curve.
0
20
40
60
80
100
0 10 20 30 40 50
| | | | |4/10 6/9 5/9 10/10
Steady-state Ctrough (mcg/mL)
Pro
babi
lity
of R
espo
nse
(Bes
t res
pons
e) (%
)
Logistic regressionObserved proportion (95% CI)
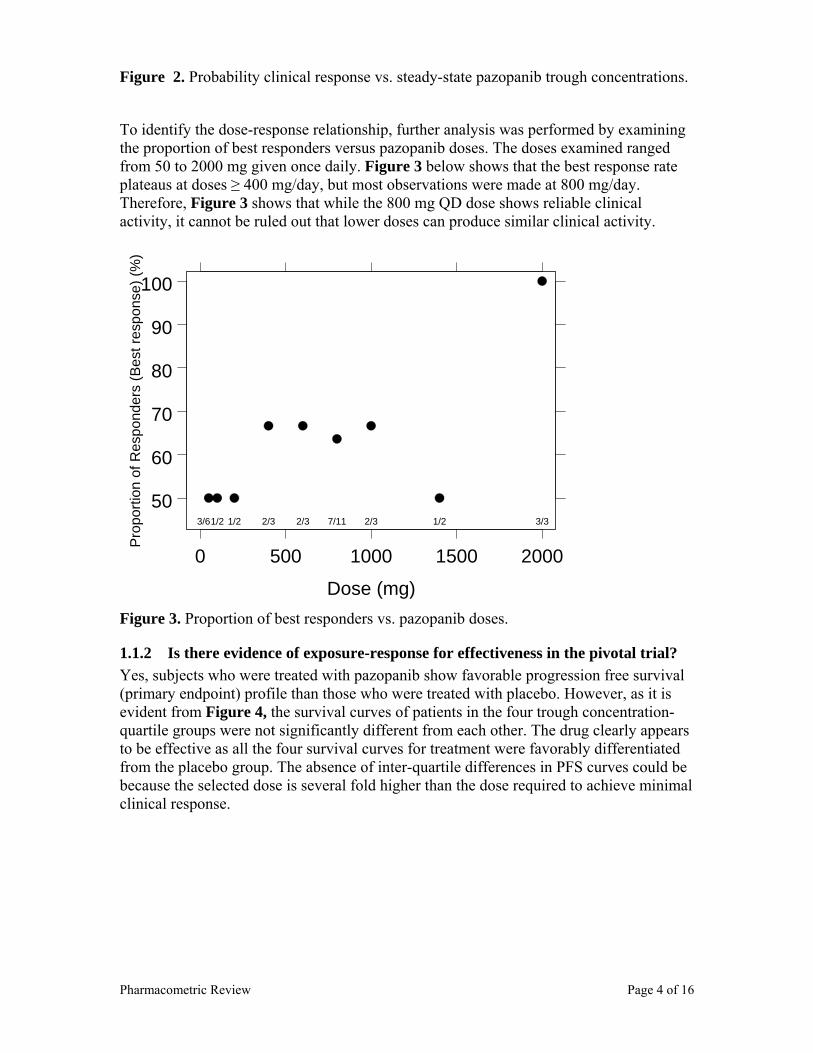
Pharmacometric Review Page 4 of 16
Figure 2. Probability clinical response vs. steady-state pazopanib trough concentrations.
To identify the dose-response relationship, further analysis was performed by examining the proportion of best responders versus pazopanib doses. The doses examined ranged from 50 to 2000 mg given once daily. Figure 3 below shows that the best response rate plateaus at doses ≥ 400 mg/day, but most observations were made at 800 mg/day. Therefore, Figure 3 shows that while the 800 mg QD dose shows reliable clinical activity, it cannot be ruled out that lower doses can produce similar clinical activity.
50
60
70
80
90
100
0 500 1000 1500 2000
3/61/2 1/2 2/3 2/3 7/11 2/3 1/2 3/3
Dose (mg)
Pro
porti
on o
f Res
pond
ers
(Bes
t res
pons
e) (%
)
Figure 3. Proportion of best responders vs. pazopanib doses.
1.1.2 Is there evidence of exposure-response for effectiveness in the pivotal trial? Yes, subjects who were treated with pazopanib show favorable progression free survival (primary endpoint) profile than those who were treated with placebo. However, as it is evident from Figure 4, the survival curves of patients in the four trough concentration-quartile groups were not significantly different from each other. The drug clearly appears to be effective as all the four survival curves for treatment were favorably differentiated from the placebo group. The absence of inter-quartile differences in PFS curves could be because the selected dose is several fold higher than the dose required to achieve minimal clinical response.
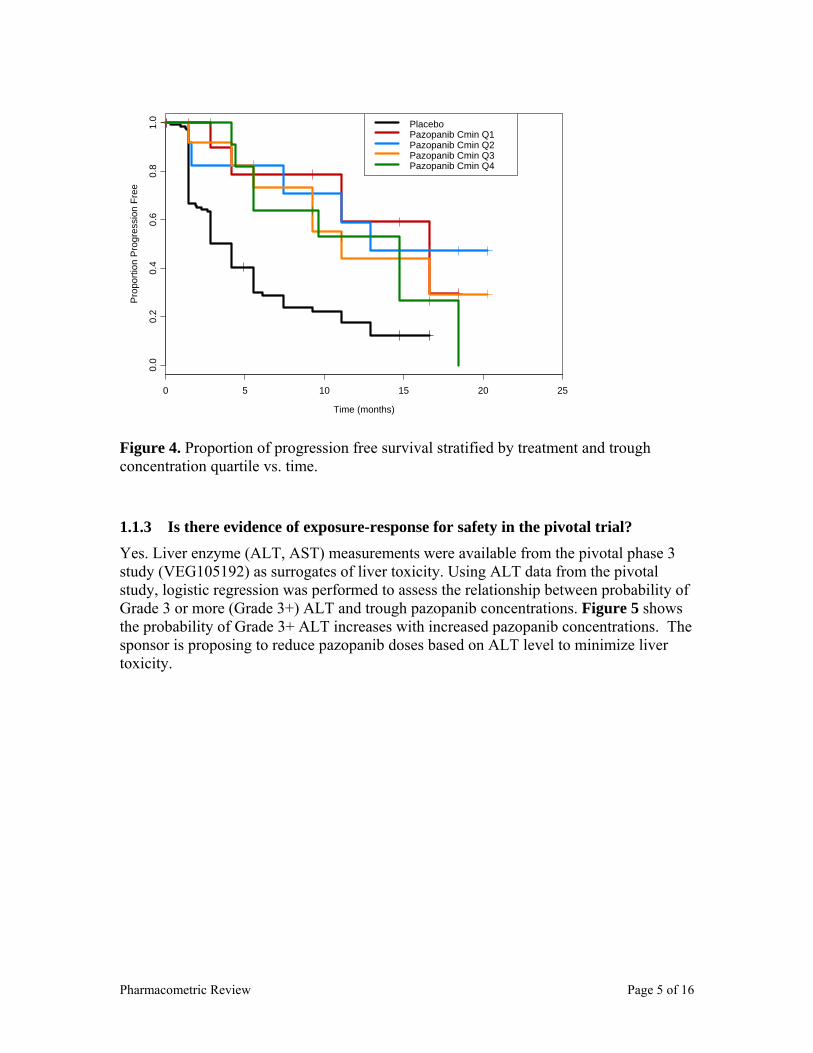
Pharmacometric Review Page 5 of 16
Time (months)
Pro
porti
on P
rogr
essi
on F
ree
0 5 10 15 20 25
0.0
0.2
0.4
0.6
0.8
1.0 Placebo
Pazopanib Cmin Q1Pazopanib Cmin Q2Pazopanib Cmin Q3Pazopanib Cmin Q4
Figure 4. Proportion of progression free survival stratified by treatment and trough concentration quartile vs. time.
1.1.3 Is there evidence of exposure-response for safety in the pivotal trial? Yes. Liver enzyme (ALT, AST) measurements were available from the pivotal phase 3 study (VEG105192) as surrogates of liver toxicity. Using ALT data from the pivotal study, logistic regression was performed to assess the relationship between probability of Grade 3 or more (Grade 3+) ALT and trough pazopanib concentrations. Figure 5 shows the probability of Grade 3+ ALT increases with increased pazopanib concentrations. The sponsor is proposing to reduce pazopanib doses based on ALT level to minimize liver toxicity.
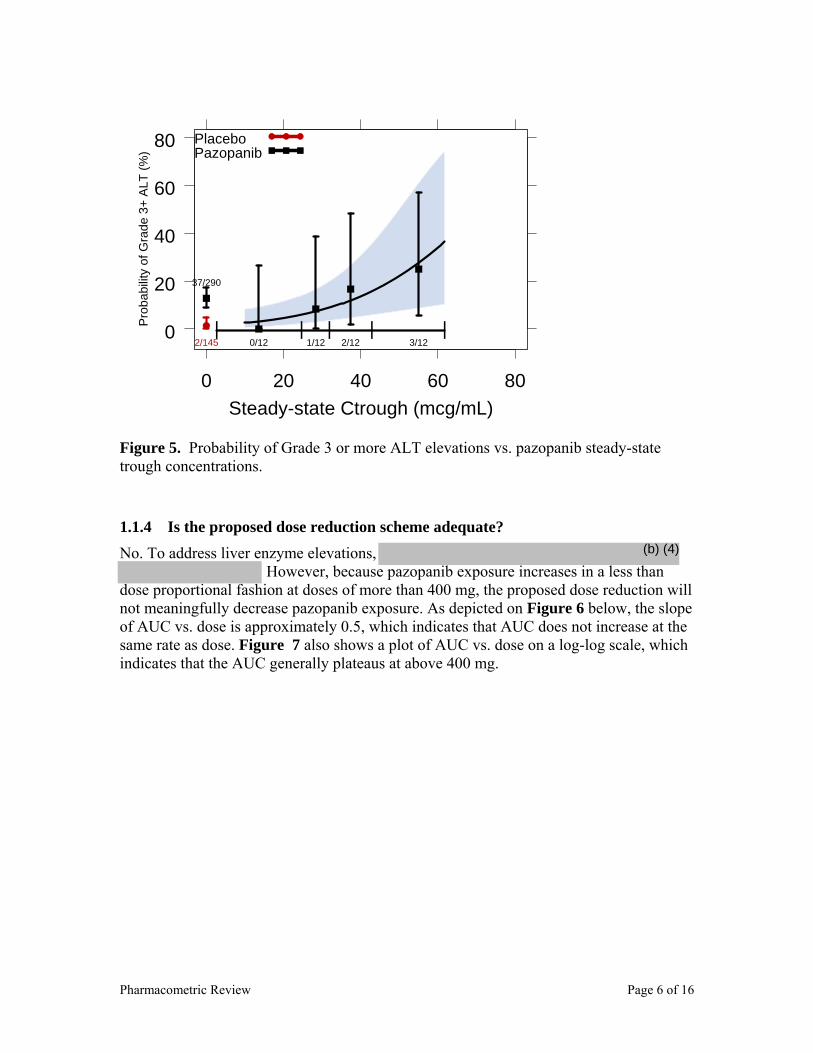
Pharmacometric Review Page 6 of 16
0
20
40
60
80
0 20 40 60 80
| | | | |2/145
37/290
0/12 1/12 2/12 3/12
Steady-state Ctrough (mcg/mL)
Pro
babi
lity
of G
rade
3+
ALT
(%)
PlaceboPazopanib
Figure 5. Probability of Grade 3 or more ALT elevations vs. pazopanib steady-state trough concentrations.
1.1.4 Is the proposed dose reduction scheme adequate? No. To address liver enzyme elevations,
However, because pazopanib exposure increases in a less than dose proportional fashion at doses of more than 400 mg, the proposed dose reduction will not meaningfully decrease pazopanib exposure. As depicted on Figure 6 below, the slope of AUC vs. dose is approximately 0.5, which indicates that AUC does not increase at the same rate as dose. Figure 7 also shows a plot of AUC vs. dose on a log-log scale, which indicates that the AUC generally plateaus at above 400 mg.
(b) (4)
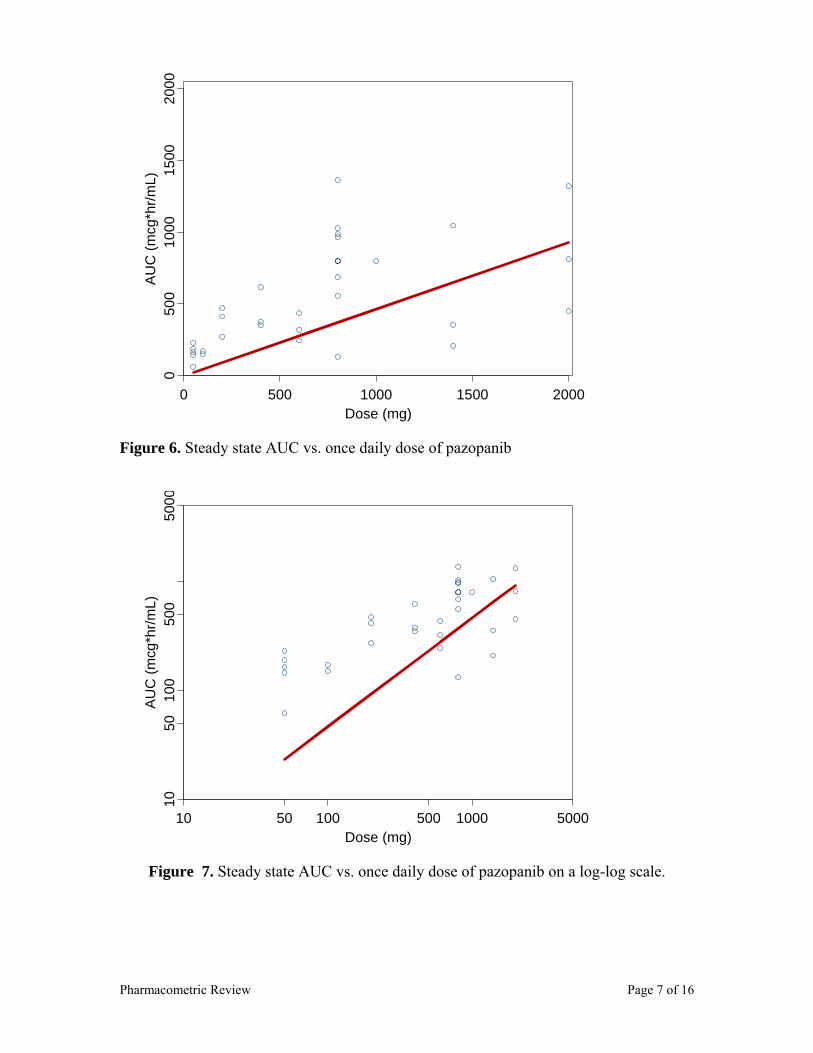
Pharmacometric Review Page 7 of 16
Dose (mg)
AU
C (m
cg*h
r/mL)
0 500 1000 1500 2000
050
010
0015
0020
00
Figure 6. Steady state AUC vs. once daily dose of pazopanib
Dose (mg)
AU
C (m
cg*h
r/mL)
10 50 100 500 1000 5000
1050
100
500
5000
Figure 7. Steady state AUC vs. once daily dose of pazopanib on a log-log scale.
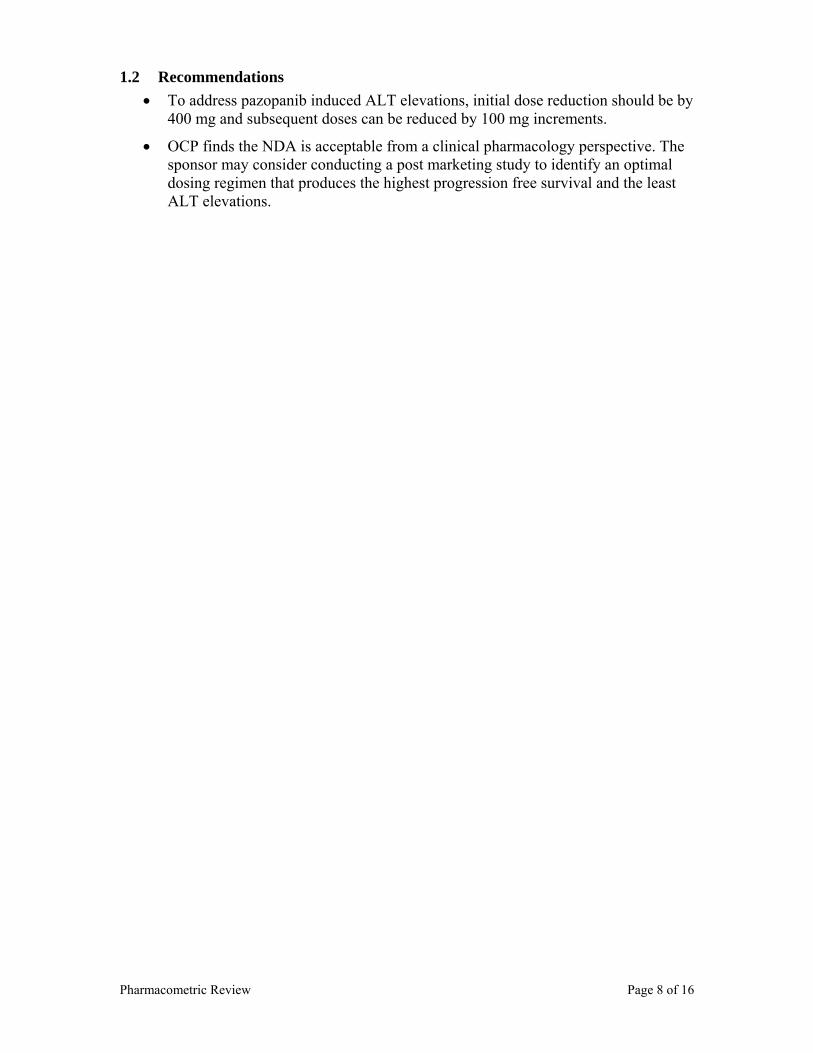
Pharmacometric Review Page 8 of 16
1.2 Recommendations • To address pazopanib induced ALT elevations, initial dose reduction should be by
400 mg and subsequent doses can be reduced by 100 mg increments.
• OCP finds the NDA is acceptable from a clinical pharmacology perspective. The sponsor may consider conducting a post marketing study to identify an optimal dosing regimen that produces the highest progression free survival and the least ALT elevations.
Pharmacometric Review Page 9 of 16
1.3 Label Statements
(b) (4)
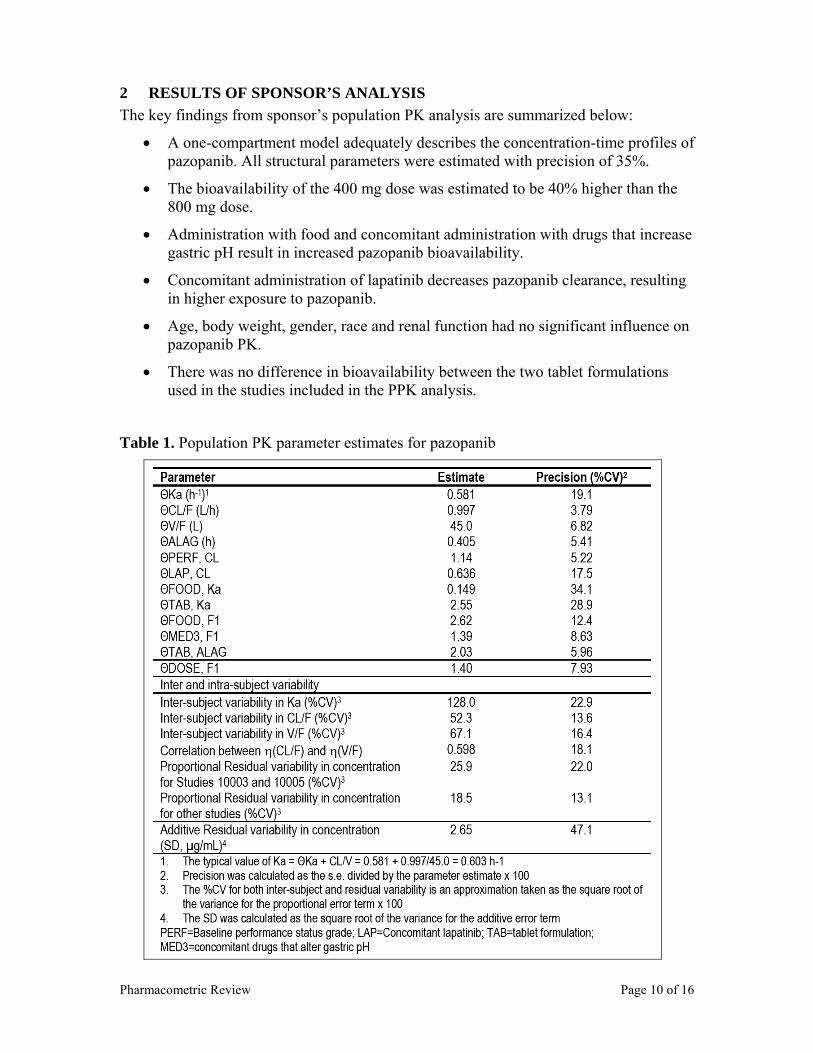
Pharmacometric Review Page 10 of 16
2 RESULTS OF SPONSOR’S ANALYSIS The key findings from sponsor’s population PK analysis are summarized below:
• A one-compartment model adequately describes the concentration-time profiles of pazopanib. All structural parameters were estimated with precision of 35%.
• The bioavailability of the 400 mg dose was estimated to be 40% higher than the 800 mg dose.
• Administration with food and concomitant administration with drugs that increase gastric pH result in increased pazopanib bioavailability.
• Concomitant administration of lapatinib decreases pazopanib clearance, resulting in higher exposure to pazopanib.
• Age, body weight, gender, race and renal function had no significant influence on pazopanib PK.
• There was no difference in bioavailability between the two tablet formulations used in the studies included in the PPK analysis.
Table 1. Population PK parameter estimates for pazopanib
Pharmacometric Review Page 11 of 16
Reviewer’s comments: Sponsor’s population PK analysis is adequate and results are consistent with results of individual studies submitted separately. Consistent with individual study reports, population PK analysis identified the following characteristics of pazopanib.
1) Population PK analysis showed that pazopanib has 40% higher bioavailability following 400 mg dose than the 800 mg dose. In study VEG10003 pazopanib was shown to follow dose under-proportional PK, the slope relating AUC and dose found to be 0.46.
2) Population PK showed that food increases the bioavailability of pazopanib,
which is consistent with results of study VEG10005 which showed that low and high fat food increased pazopanib AUC > 2-fold
3) Population PK showed that lapatinib decreased the clearance of pazopanib,
consistent with pre-clinical and clinical data that that showed pazopanib as substrate of CYP3A4 enzymes.
Pharmacometric Review Page 12 of 16
3 REVIEWER’S ANALYSIS
3.1 Introduction The sponsor performed population PK analysis of pazopanib to identify sources of pazopanib PK variability. However, the sponsor did not perform any exposure-response analysis beyond some exploratory analysis using phase 1 data. The reviewers performed additional analyses to further elucidate the exposure-response properties of pazopanib.
3.2 Objectives Exposure-response and dose-response analyses were performed to address the following:
1) To understand the dose-response properties of pazopanib in the dose-escalation study and the appropriateness of selected dose for the pivotal trial
2) To characterize the exposure-efficacy relationship of pazopanib within the 800 mg/day dose used in the pivotal study
3) To characterize the exposure-safety relationship in regards to liver enzyme (ALT) elevation
3.3 Methods
3.3.1 Data Sets Data sets used are summarized in Table 2 below.
Table 2: Analysis Data Sets. Study Number
Name Link to EDR
VEG10003
VEG105192
ppkall.xpt \\Cdsesub1\EVSPROD\NDA022465\0000\m5\datasets\pop-pk\analysis
VEG10003 bpdiary.xpt
evalonc.xpt
pkparauc.xpt
\\Cdsesub1\EVSPROD\NDA022465\0000\m5\datasets\veg10003\analysis
VEG105192 onctte-105192.xpt
lab.xpt
\\Cdsesub1\EVSPROD\NDA022465\0000\m5\datasets\veg105192\analysis
3.3.2 Software SAS and S-PLUS were used for the reviewer’s analyses.

Pharmacometric Review Page 13 of 16
3.4 Results See section 1.1
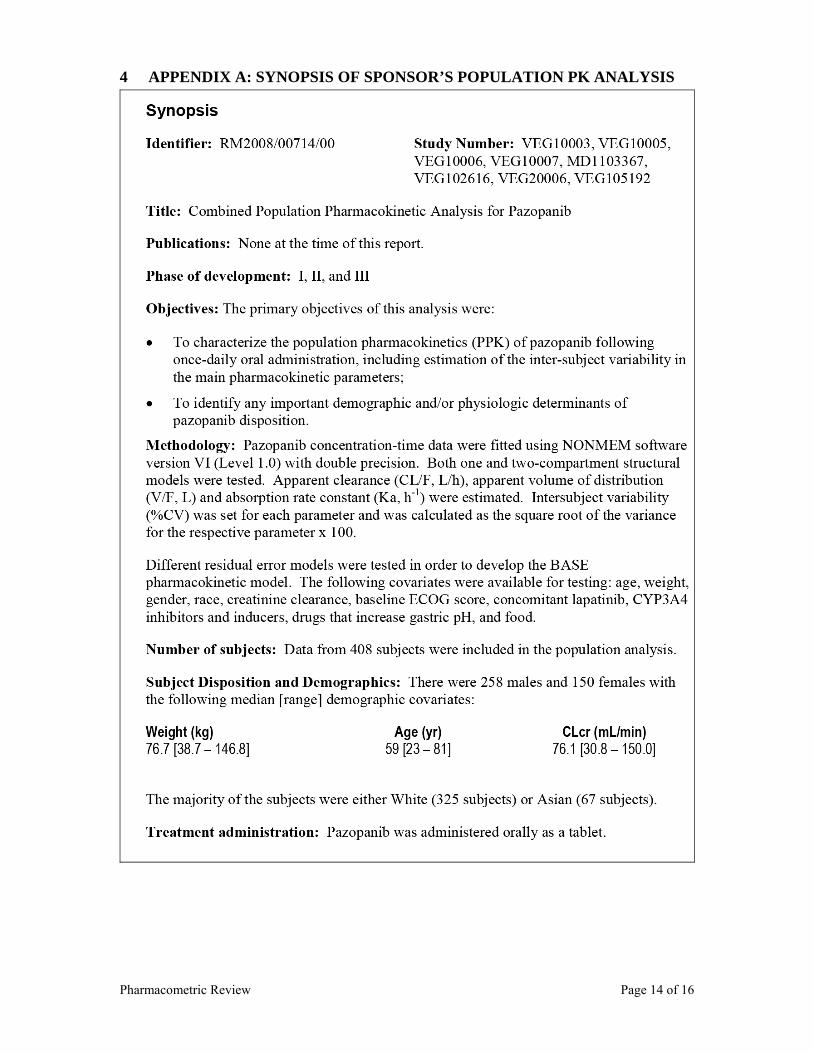
Pharmacometric Review Page 14 of 16
4 APPENDIX A: SYNOPSIS OF SPONSOR’S POPULATION PK ANALYSIS
Pharmacometric Review Page 15 of 16
Pharmacometric Review Page 16 of 16

4 APPENDICES
APPENDIX 2 – GENOMICS GROUP REVIEW
1
CLINICAL PHARMACOLOGY GENOMICS GROUP REVIEW
NDA Number 022465
Submission Type; Code NDA Applicant Name GlaxoSmithKline Submission Date December 19, 2008 Brand Name Votrient
Generic Name Pazopanib
Proposed Indication Advanced renal cell carcinoma (RCC) Genomics Reviewer Rosane Charlab Orbach, Ph.D.
Team Leader Issam Zineh, Pharm.D., MPH
TABLE OF CONTENTS
1. EXECUTIVE SUMMARY ..................................................................................................... 2
2. BACKGROUND ...................................................................................................................... 2
3. NDA CONTENT RELATED TO GENOMICS.................................................................... 4
4. KEY QUESTIONS AND SUMMARY OF GENOMICS FINDINGS ................................ 4
4.1 IS THERE A GENETIC PREDISPOSITION TO ELEVATED ALT AND/OR TOTAL BILIRUBIN CONCENTRATIONS IN PAZOPANIB-TREATED PATIENTS? .................................................4
4.2 ARE GENETIC VARIANTS ASSOCIATED WITH PAZOPANIB-INDUCED HYPERTENSION IN PATIENTS WITH RENAL CELL CARCINOMA? ....................................................................9
5. COMMENTS.......................................................................................................................... 11
6. RECOMMENDATIONS........................................................................................................ 11
7. LABEL RECOMMENDATIONS ......................................................................................... 11
8. ABBREVIATIONS................................................................................................................ 12
2
1. EXECUTIVE SUMMARY The sponsor conducted a pooled candidate gene analysis (phase I-III) to evaluate if selected polymorphisms in 282 gene/gene regions were associated with maximum alanine aminotransferase (ALT) and/or total bilirubin (TBL) elevations observed in subjects treated with pazopanib. The sponsor’s results suggest that among White participants, variation in the hemachromatosis (HFE) gene may be associated with ALT elevation. The clinical significance of this finding is unknown. UGT1A1 genotypes implicated in benign hyperbilirubinemia due to a lower UGT1A1 function (i.e., Gilbert’s Syndrome) were associated with pazopanib-induced hyperbilirubinemia. Both associations were tested and confirmed in two independent cohorts of patients using both quantitative trait analyses and case-control methodology. Analyses were not conducted in placebo-treated patients. Moreover, pazopanib inhibits UGT1A1 and SLCO1B1 (OATP1B1) activities in vitro. UGT1A1 and SLCO1B1 are involved in bilirubin elimination, and their inhibition may further contribute to the observed increase in TBL. The observation that UGT1A1 inhibitors cause benign elevations in TBL among patients with genetic predisposition to Gilbert’s Syndrome has been described for other tyrosine kinase inhibitors (TKIs) such as nilotinib and is currently reflected in the drug label. The sponsor also evaluated if selected polymorphisms in 5 angiogenesis-related genes could be associated to efficacy or hypertension endpoints in pazopanib-treated subjects. No significant association was found in the tested conditions. Based on the results summarized above, we recommend the following information be included in the pazopanib label: (1) Certain UGT1A1 genotypes are associated with an increase in the risk of pazopanib-induced hyperbilirubinemia. (2) Pazopanib inhibits UGT1A1 and SLCO1B1 in vitro. The specific labeling recommendations can be found in section 7 of this review.
2. BACKGROUND RCC is often associated with upregulated VEGF and VEGF receptor activity. The VHL tumor suppressor gene, frequently mutated/inactivated in RCC, is a negative regulator of hypoxia-inducible factor-1 activity and VEGF expression. The increase in VEGF expression due to VHL loss may contribute to the angiogenic nature of RCC (Urol. 2003 Aug; 170(2 Pt 1):588-92; PMID: 12853836). Thus, VEGF-targeted therapies have been extensively tested in RCC (Clin Cancer Res 2007; 13(13):3765-70; PMID: 17606705). Pazopanib is an oral multi-target receptor tyrosine kinase inhibitor of VEGF receptors 1, 2, and 3; PDGFR; and c-kit. As part of the clinical development program, the sponsor noted elevations in liver transaminases (e.g., ALT) and TBL as a side effect of pazopanib. In addition, hypertension is a known side effect of VEGF inhibitors. The following background provides context for interpretation of the pharmacogenetic analyses conducted
3
by the sponsor to elucidate genetic associations with pazopanib-induced elevations in ALT and TBL, as well as blood pressure changes. Metabolism/transport: Pazopanib is as an in vitro inhibitor of the human uptake transporter SLCO1B1 (IC50 = 0.79 μM) and of UDP-glucuronosyltransferase 1A1 [UGT1A1] (IC50 = 1.2 μM), both of which are involved in bilirubin elimination. UGT1A1 polymorphisms may predispose to hyperbilirubinemia via decreased hepatic bilirubin conjugation. Polymorphisms of SLCO1B1 may predispose to hyperbilirubinemia by limiting hepatic bilirubin uptake (Hum Mol Genet. 2009 Jul 15;18(14):2700-10; PMID: 19414484). Additionally, functional alteration of UGT1A1 activity due to different polymorphisms leads to a spectrum of clinical phenotypes involving unconjugated hyperbilirubinemia including Gilbert’s syndrome (Pharmacogenomics. 2008 Jun;9(6):703-15; PMID: 18518849). A number of other clinical genetic disorders involving additional genes potentially affecting bilirubin physiology have also been reported (Hum Mol Genet. 2009 Jul 15;18(14):2700-10; PMID: 19414484), suggesting different gene polymorphisms beyond those in UGT1A1 may contribute to inter-individual variation in bilirubin. Safety - Hepatic Effects: The adverse events (AE) commonly reported for VEGF receptor inhibitors include fatigue, diarrhea, and hypertension. Among relevant pazopanib adverse events is the elevation of hepatic enzymes which typically occurred during the first 18 weeks of treatment. Approximately half the subjects receiving pazopanib experienced some elevations in transaminases. 4% had elevations >10xULN. In addition, <1% subjects had concurrent ALT and TBL elevations without significant alkaline phosphatase elevations suggestive of possible impairment of hepatic function. The transaminase elevations were reversible in 86% of subjects with adequate follow up of laboratory data. Liver failure and fatal hepatic events were reported in 4 subjects. TBL elevations (>1 x ULN) occurred in approximately 35% of subjects. Safety – Hypertension: Hypertension is a known anti-angiogenesis therapy AE, and its occurrence represents a risk factor for the development of heart failure and other cardiovascular events. 15–60% of patients treated with anti-angiogenic TKIs develop hypertension. As a possible mechanism to hypertension, VEGF induces NO and PGI2 release by endothelial cells. Inhibition of VEGF receptor signaling leads to a decrease in the release of these mediators, and to vascular resistance and increased blood pressure (Nat Rev Cancer. 2007 Jun; 7(6):475-85; PMID: 17522716). 40% of pazopanib-treated patients in the study VEG105192 experienced hypertension (any grade) versus 10% in the control arm. The onset of hypertension generally occurred within the first 12 weeks of treatment.
4
3. NDA CONTENT RELATED TO GENOMICS The sponsor conducted a pooled candidate gene analysis (phase I-III) to evaluate if genetic markers are associated with elevation in ALT and/or TBL in subjects treated with pazopanib (pharmacogenetic study HJ2008/00001/00). Genetic markers in a total of 282 candidate gene/gene regions selected based on their potential role in drug induced liver injury, relevance to pazopanib ADME, and mode of action for pazopanib were analyzed. In addition, the sponsor submitted an exploratory analysis of genetic association with efficacy and hypertension endpoints in consenting pazopanib-treated subjects in studies VEG105192 and VEG102616. For this analysis, 12 germline polymorphisms in 5 angiogenesis candidate genes were genotyped. The review is based on the pharmacogenetic study reports. 4. KEY QUESTIONS AND SUMMARY OF GENOMICS FINDINGS
4.1 Is there a genetic predisposition to elevated ALT and/or total bilirubin concentrations in pazopanib-treated patients?
The sponsor conducted a pharmacogenetic analysis evaluating the association of selected germline polymorphisms with the ALT and TBL elevation. Blood samples for the pharmacogenetic analysis were collected from consenting subjects from studies MD1103367, VEG10005, VEG10006, VEG10007, VEG102616 and VEG105192 (for individual study details, see table 1). Due to sample size considerations, only pharmacogenetic results from White subjects participating in studies VEG102616 (n=116) and VEG105192 (n=130) were considered. Inferential analyses were performed using White subjects from VEG102616 in the primary analysis and White subjects from VEG105192 in the confirmatory analysis. Statistical analyses were also performed for confirmed markers using White subjects combined from both studies: VEG102616 and VEG105192. Blood DNA was genotyped for germline variations in 282 candidate genes or gene regions associated to drug induced liver injury (DILI), ADME and pazopanib mechanism of action, encompassing a total of 9,308 selected SNPs. In addition, HLA genotypes and the UGT1A1 TA repeat polymorphism were evaluated. For the UGT1A1 TA repeat polymorphism genotyping, the FDA-cleared Third Wave Invader Assay was used. Alleles other than (TA)6 or (TA)7 were reported as missing. Table 1 summarizes the number of subjects in the intent to treat (ITT) and pharmacogenetic analysis populations. Only pazopanib-treated subjects were considered. The final analysis population consisted of consenting White pazopanib-treated subjects that were successfully genotyped for at least one of the selected polymorphisms, and passed a subject data quality control check. Briefly, monomorphic markers were removed from the analysis. Markers successfully genotyped for less than 80% of the subjects in the analysis were not considered. Instances were reviewed when genotypes for sex chromosomes differed from subject’s reported gender, or when the number of markers successfully genotyped for a
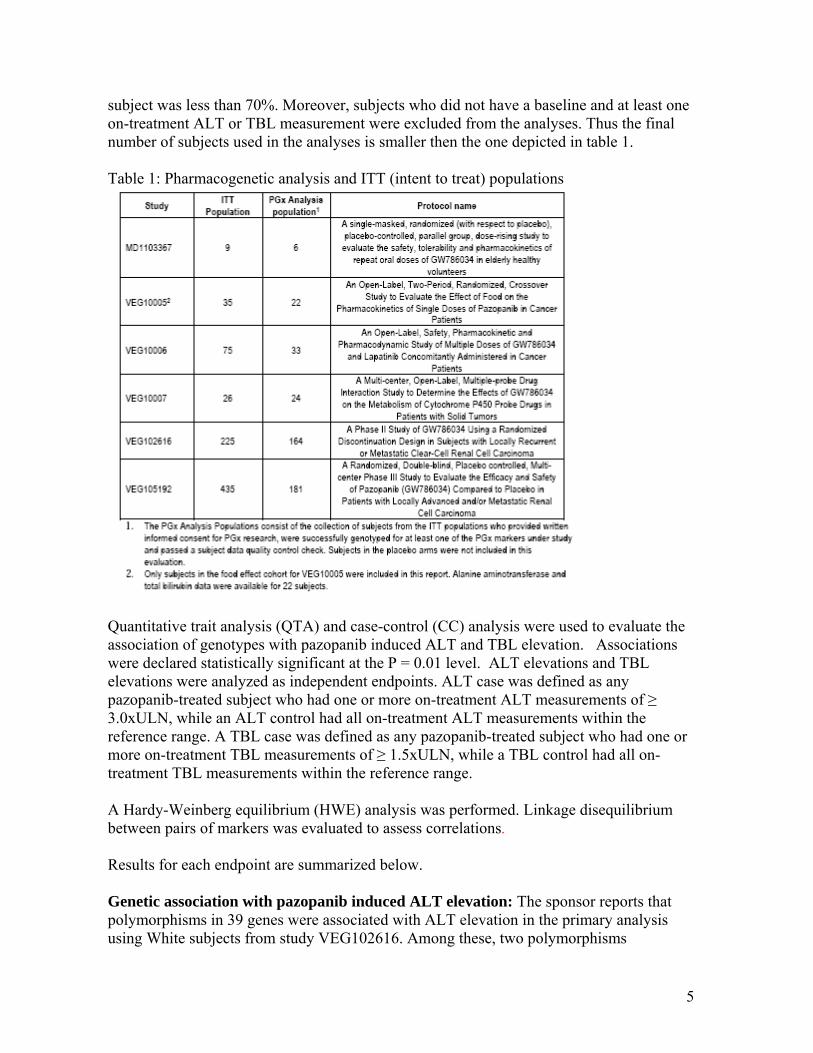
5
subject was less than 70%. Moreover, subjects who did not have a baseline and at least one on-treatment ALT or TBL measurement were excluded from the analyses. Thus the final number of subjects used in the analyses is smaller then the one depicted in table 1. Table 1: Pharmacogenetic analysis and ITT (intent to treat) populations
Quantitative trait analysis (QTA) and case-control (CC) analysis were used to evaluate the association of genotypes with pazopanib induced ALT and TBL elevation. Associations were declared statistically significant at the P = 0.01 level. ALT elevations and TBL elevations were analyzed as independent endpoints. ALT case was defined as any pazopanib-treated subject who had one or more on-treatment ALT measurements of ≥ 3.0xULN, while an ALT control had all on-treatment ALT measurements within the reference range. A TBL case was defined as any pazopanib-treated subject who had one or more on-treatment TBL measurements of ≥ 1.5xULN, while a TBL control had all on-treatment TBL measurements within the reference range. A Hardy-Weinberg equilibrium (HWE) analysis was performed. Linkage disequilibrium between pairs of markers was evaluated to assess correlations. Results for each endpoint are summarized below. Genetic association with pazopanib induced ALT elevation: The sponsor reports that polymorphisms in 39 genes were associated with ALT elevation in the primary analysis using White subjects from study VEG102616. Among these, two polymorphisms
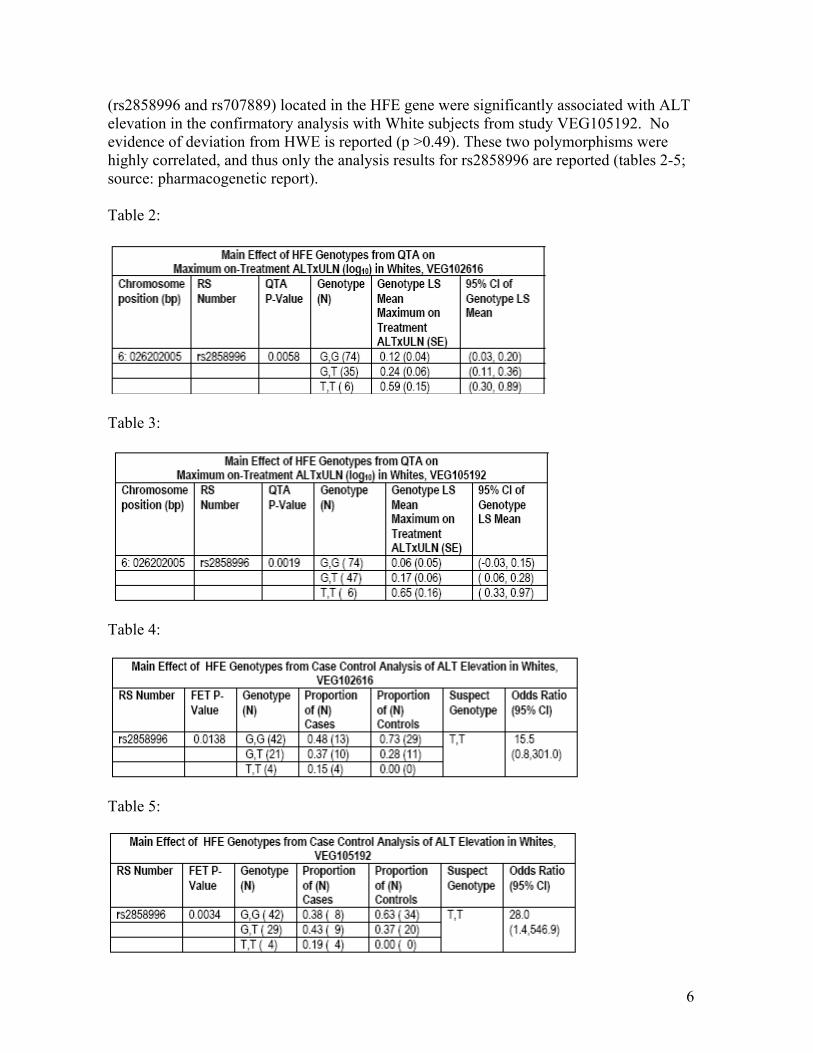
6
(rs2858996 and rs707889) located in the HFE gene were significantly associated with ALT elevation in the confirmatory analysis with White subjects from study VEG105192. No evidence of deviation from HWE is reported (p >0.49). These two polymorphisms were highly correlated, and thus only the analysis results for rs2858996 are reported (tables 2-5; source: pharmacogenetic report). Table 2:
Table 3:
Table 4:
Table 5:
7
The TT genotype of marker rs2858996 was associated with an increased risk of ALT elevation in pazopanib-treated White subjects from both studies, VEG102616 and VEG105192, with an odds ratio (with 95% confidence interval) of 15.5 (0.8, 301.0), and 28.0 (1.4, 546.9) respectively for the risk genotype against the other genotypes (tables 4 and 5). In the combined analysis with White subjects from VEG102616 and VEG105192 studies, the sponsor reports that a statistically significant difference in the HFE (rs2858996) genotype distributions between ALT cases (≥3xULN) and controls (≤1xULN) (FET p = 6.50 x 10⁻⁵). Twelve subjects had the TT genotype. Of these, 8 (67%) were ALT cases and none were ALT controls. The remaining four subjects with the TT genotype had maximum ALT greater than 1xULN and less than 3xULN. These data predicted an odds ratio (95% CI) of 39.7 (2.24, 703.7) for cases versus controls, in relation to TT homozygotes versus the GG and GT genotypes. Within the pharmacogenetic analysis populations, two subjects (subject 233 from study VEG102616 and subject 170 from study VEG105192) met the laboratory criteria for potential severe drug-induced liver injury (ALT >3xULN, TBL >2xULN, alkaline phosphatase <2xULN). None of the subjects had the TT risk genotype. The HFE rs2858996 genotype for both subjects was GG. For the other ethnicities in VEG102616 and VEG105192, the only subject with TT genotype among 97 non-white subjects was Asian (study VEG102616) and had maximum ALT value within the normal range (less than 1xULN). For the remaining studies not included in the formal statistical analyses, two White subjects (VEG10005; n=22) had the TT genotype with ALT levels within normal range, and one White subject (VEG10006; n=33) had the TT genotype and the maximum ALT of 1.72xULN. To conclude, pazopanib-induced ALT elevation in White subjects from studies VEG102616 and VEG10519 was significantly associated with the TT genotype of the HFE rs2858996 marker. The rs2858996 marker is located in the intron of the HFE gene, and the exact function of the variant is unknown. However, other HFE gene variants have been associated with hemochromatosis, whose clinical features include abnormalities in AST and ALT levels (J Clin Gastroenterol. 1991 Jun; 13(3):316-20; PMID: 2066547; N Engl J Med. 2008 Jan 17; 358(3):221-30; PMID: 18199861; Genet Test. 2000; 4(2):151-61; PMID: 11479183). It is possible that the HFE genotype predisposes to an increase risk of ALT elevation as observed in pazopanib-treated patients. Based on known allele frequencies in multiple ethnic/racial populations (dbSNP), the expected frequencies for the rs2858996 TT genotype in populations of European, Asian, and African ancestry are aprroximately 3.4%, 4.5%, and <1%, respectively. Based on these low frequencies, the high proportion of ALT elevation events observed in pazopanib-treated patients cannot be explained solely by the TT genotype. The clinical significance of the association rs2858996 marker with ALT elevation in pazopanib-treated patients remains to be further investigated.
8
Genetic association with pazopanib induced TBL elevation: The sponsor reports a significant association with TBL elevation and UGT1A1 genotype, especially with the UGT1A1 *28 allele. Initially, markers in 36 genes were significantly associated with TBL elevation in the primary pharmacogenetic analysis with VEG102616. In the confirmatory analysis with VEG105192 White subjects, ten markers in the UGT1A cluster region (rs4347832, rs11680450, rs6759892, rs1105879, rs6715829, rs6725478, rs869283, rs887829, rs8175347, and rs6742078) were significantly associated with TBL elevation. No evidence of deviation from HWE is reported (p>0.16). The UGT1A1 TA repeat polymorphism (rs8175347) was previously associated with plasma bilirubin concentration and with drug induced hyperbilirubinemia in the literature. The UGT1A1*28 allele corresponds to a promoter TA insertion polymorphism also known as (TA)7 (wild-type= (TA)6). UGT1A1*28 is implicated with Gilbert’s syndrome in Caucasians, a mild unconjugated nonhemolytic hyperbilirubinemia that does not lead to liver failure. Approximately 40% of Caucasians have at least one UGT1A1*28 allele and the incidence of Gilbert’s syndrome in this population is approximately 10%. The Gilbert’s phenotype is also described in association with other UGT1A1 alleles, as for example UGT1A1*29 (Pharmacogenomics. 2008 Jun; 9(6):703-15; PMID: 18518849). The other UGT1A cluster markers were strongly correlated to the (TA)7 repeat polymorphism. After adjusting for the effect of UGT1A1 TA repeat polymorphism on TBL, no additional independent significant genetic associations were reported. A statistically significant difference in the UGT1A1 TA repeat genotype distributions was observed between cases and controls among the combined White subjects from study VEG102616 and VEG105192 (FET p=1.75 x 10⁻⁸). Larger sample sizes may have been required to capture low frequency variants, or variants with smaller contributions to total serum bilirubin elevation. It is of note that potentially relevant polymorphisms to bilirubin elevation may not have been tested. Among subjects homozygotes for the UGT1A1*28 allele (n=37), 49% had TBL ≥1.5 x ULN, 24% had TBL greater than 1xULN and less than 1.5xULN and 27% had TBL within the normal range (1xULN or less). The sponsor indicated that approximately 35% of White subjects presented maximum TBL > 1 x ULN, and 16% (38/236) had levels 1.5 ≥ x ULN. Approximately 47% (18/38) of the subjects with TBL (≥1.5 x ULN) were homozogotes for UGT1A1*28, while 84% of subjects (32/38) carried at least one copy of the (TA)7 allele. These data predicted an odds ratio (95% CI) of 12.5 (5.2, 30.4) for cases versus controls, in relation to UGT1A1* 28 (TA)7 homozygotes versus the other TA genotypes (wild-type and heterozygote (TA)6/(TA)7). The same two subjects who met the laboratory criteria for potential severe drug-induced liver injury described above were heterozygotes for UGT1A1 TA repeat polymorphism (UGT1A1*28; (TA)6/(TA)7). For the other ethnicities , a descriptive analysis for VEG102616 and VEG105192 was provided as follows: 91 of the 99 non-White subjects (33 Hispanics, 44 Asians, 3 Blacks and 11 subjects having race/ethnicity other than White, Hispanic, Asian or Black) were
9
successfully genotyped for the UGT1A1 TA repeat polymorphism (rs8175347). Among 14 TBL cases, 9 subjects (64%) carried at least one copy of the (TA)7 allele versus 22 (41%) of the 54 controls. To conclude, pazopanib-induced TBL elevation in White subjects was significantly associated with the UGT1A1 TA repeat polymorphism marker rs8175347. The contribution of UGT1A1 genotype to drug-induced hyperbilirubinemia has been evaluated previously for other TKIs. Most notably, as reflected in the nilotinib drug label, the (TA)7/(TA)7 genotype was associated with a statistically significant increase in the risk of hyperbilirubinemia in nilotinib-treated patients. The largest increases in bilirubin were observed in the (TA)7/(TA)7 genotype (UGT1A1*28) patients (Tasigna (nilotinib), full prescribing information). Dose adjustments are based on bilirubin concentrations and not UGT1A1 genotypes per se. Of note, both pazopanib and nilotinib are inhibitors of UGT1A1 in vitro, which may contribute to an increased susceptibility to hyperbilirubinemia in subjects having the UGT1A1*28 allele (i.e., genetically-reduced UGT1A1 activity). Furthermore, UGT1A1 genotype associations with drug-induced increases in TBL have been described for other drugs known to be UGT1A1 inhibitors of the bilirubin clearance pathways (Proc Natl Acad Sci U S A. 2001 Oct 23;98(22):12671-6; PMID: 11606755) These examples add support to the sponsor’s reported association between UGT1A1 and hyperbilirubinemia. These examples also suggest that both an underlying genetic predisposition to Gilbert’s syndrome and direct drug-induced inhibition of UGT1A1 contribute to drug-induced hyperbilirubinemia.
4.2 Are genetic variants associated with pazopanib-induced hypertension in patients with renal cell carcinoma?
The sponsor conducted an analysis to determine if candidate germline polymorphisms of genes implicated in angiogenesis were associated with pazopanib efficacy and hypertension in studies VEG105192 and VEG102216. Details of these studies can be found in table 1, above. For these analyses, the following SNPs were evaluated: GENE SNP VEGFA: -2578C/A VEGFA: -1498C/T VEGFA: -1154G/A VEGFA: - 634G/C VEGFA: 936C/T VEGFR2: 1416A/T (Q472H) VEGFR2: 889G/A (V297I) HIF1A: 1744C/T (P582S) HIF1A: 1762G/A (A588T) eNOS: -786T/C eNOS: 894G/T (E298D) IL-8: -251T/A
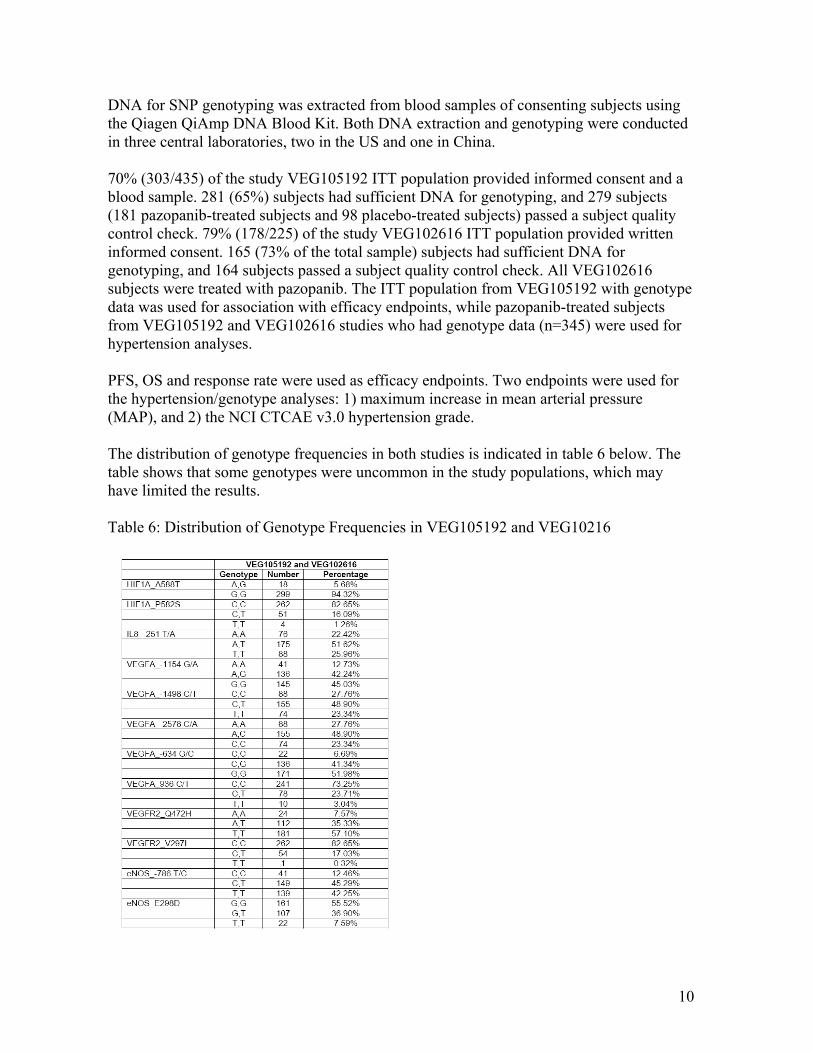
10
DNA for SNP genotyping was extracted from blood samples of consenting subjects using the Qiagen QiAmp DNA Blood Kit. Both DNA extraction and genotyping were conducted in three central laboratories, two in the US and one in China. 70% (303/435) of the study VEG105192 ITT population provided informed consent and a blood sample. 281 (65%) subjects had sufficient DNA for genotyping, and 279 subjects (181 pazopanib-treated subjects and 98 placebo-treated subjects) passed a subject quality control check. 79% (178/225) of the study VEG102616 ITT population provided written informed consent. 165 (73% of the total sample) subjects had sufficient DNA for genotyping, and 164 subjects passed a subject quality control check. All VEG102616 subjects were treated with pazopanib. The ITT population from VEG105192 with genotype data was used for association with efficacy endpoints, while pazopanib-treated subjects from VEG105192 and VEG102616 studies who had genotype data (n=345) were used for hypertension analyses. PFS, OS and response rate were used as efficacy endpoints. Two endpoints were used for the hypertension/genotype analyses: 1) maximum increase in mean arterial pressure (MAP), and 2) the NCI CTCAE v3.0 hypertension grade. The distribution of genotype frequencies in both studies is indicated in table 6 below. The table shows that some genotypes were uncommon in the study populations, which may have limited the results. Table 6: Distribution of Genotype Frequencies in VEG105192 and VEG10216
11
No deviation from HWE was found for White (self-reported) subjects. Non-White were not analyzed due to small sample sizes No significant association was found between the twelve tested polymorphisms and pazopanib efficacy at p < 0.01 (study VEG105192). No significant association was found between the twelve tested polymorphisms and maximum increase in MAP while on pazopanib or with severe hypertension as measured by CTCAE v3.0 grade 3 or 4 hypertension at p < 0.01 (combined data from studies VEG105192 and VEG102616). Based on a priori assumptions of the genetic effect, the sponsor was underpowered to detect a relationship between VEGF variants and pazopanib-induced blood pressure changes (range of power estimates: 0.4 to 50.1%). 5. COMMENTS • UGT1A1 polymorphisms were associated with TBL elevations in pazopanib-treated
patients. The observation is consistent with previous data implicating UGT1A1 variants and benign drug-induced hyperbilirubinemia, but cannot be currently extended to non-Caucasians.
• HFE gene variants were associated with ALT elevations in pazopanib-treated patients.
However, the potential clinical implications are unknown. • The relationship between gene-gene interactions (epistasis) and ALT/TBL elevations
may reveal other genetic influences on hepatic enzyme changes in pazopanib-treated patients.
• Angiogenesis related genes were not associated with pazopanib-induced changes in
MAP. Associations should be tested for SBP and DBP, independently. 6. RECOMMENDATIONS The pazopanib labeling should describe the relationship between UGT1A1 variation and TBL in pazopanib-treated patients, as well as the fact that pazopanib is a UGT1A1/SLCO1B1 inhibitor in vitro (See section 7 below). 7. LABEL RECOMMENDATIONS
(b) (4)
12
8. ABBREVIATIONS ADME Absorption, distribution, metabolism, and excretion AE Adverse event ALT Alanine transaminase AST Aspartate transaminase CC Case - control analysis CI Confidence interval c-KIT v-kit Hardy-Zuckerman 4 feline sarcoma viral oncogene homolog CTCAE Common Terminology Criteria for Adverse Events DBP Diastolic blood pressure dbSNP The Single Nucleotide Polymorphism database DILI Drug induced liver injury eNOS (NOS3) nitric oxide synthase 3 (endothelial cell) HFE Hemochromatosis HIF1A Hypoxia inducible factor 1, alpha subunit HLA Human Leukocyte Antigen HR Hazard ratio FET Fisher’s exact test IC50 50% inhibitory concentration IL-8 Interleukin 8 ITT Intent to treat MAP Mean arterial pressure NCI National Cancer Institute NO Nitric oxide OATP1B1 (SLCO1B1) solute carrier organic anion transporter family, member 1B1 OS Overall survival PDGFR (PDGFRB) Platelet-derived growth factor receptor, beta polypeptide PFS Progression-free survival PGI2 Prostacyclin P-gp (ABCB1) p-glycoprotein (ATP-binding cassette, sub-family B (MDR/TAP), member 1) QTA Quantitative trait analysis RCC Renal cell carcinoma RECIST Response evaluation criteria in solid tumors SBP Systolic blood pressure SLCO1B1 Solute carrier organic anion transporter family, member 1B1 (same as OATP1B1) SNP Single nucleotide polymorphism TBL Total bilirubin TKI Tyrosine kinase inhibitor UGT1A1 UDP glucuronosyltransferase 1 family, polypeptide A1
(b) (4)

13
ULN Upper limit of normal VEGF (VEGFA) Vascular endothelial growth factor A VEGFR (KDR; VEGFR2) Vascular endothelial growth factor receptor (kinase insert domain receptor (a type III receptor tyrosine kinase)) VHL von Hippel-Lindau

4 APPENDICES
APPENDIX 3 – SPONSOR’S PROPOSED LABELING
22 Pages Withheld as b(4) Draft Labeling
ApplicationType/Number
SubmissionType/Number Submitter Name Product Name
-------------------- -------------------- -------------------- ------------------------------------------NDA-22465 ORIG-1 GLAXO
WELLCOMEMANUFACTURINGPTE LTD DBAGLAXOSMITHKLINE
VOTRIENT TABLETS
---------------------------------------------------------------------------------------------------------This is a representation of an electronic record that was signedelectronically and this page is the manifestation of the electronicsignature.---------------------------------------------------------------------------------------------------------/s/----------------------------------------------------
BAHRU A HABTEMARIAM09/21/2009
ROSANE CHARLAB ORBACH09/21/2009
ISSAM ZINEH09/21/2009
CHRISTOFFER W TORNOE09/21/2009
BRIAN P BOOTH09/21/2009
NAM ATIQUR RAHMAN09/21/2009
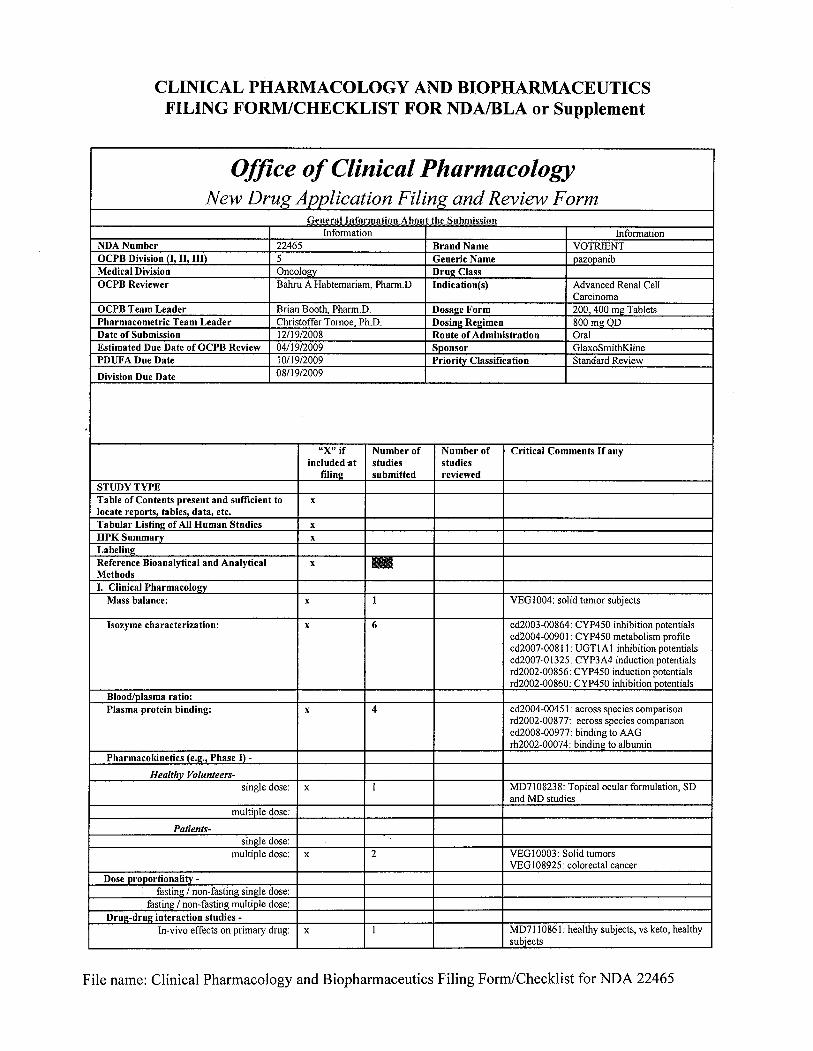
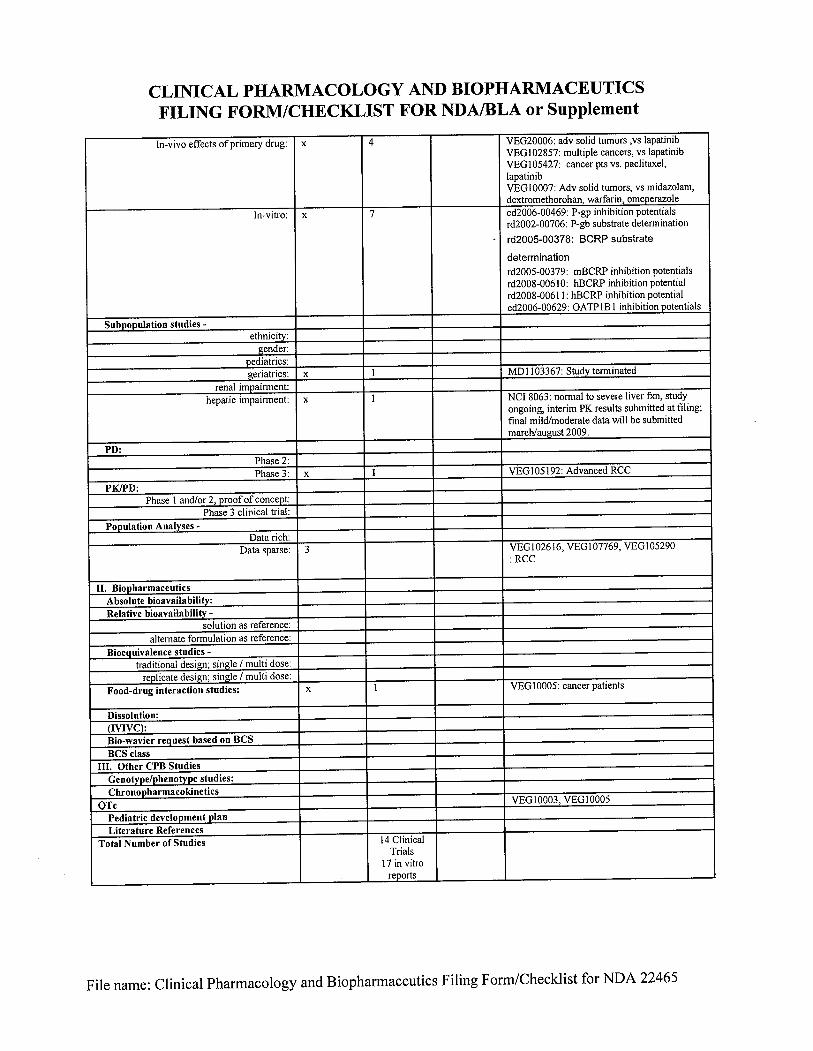
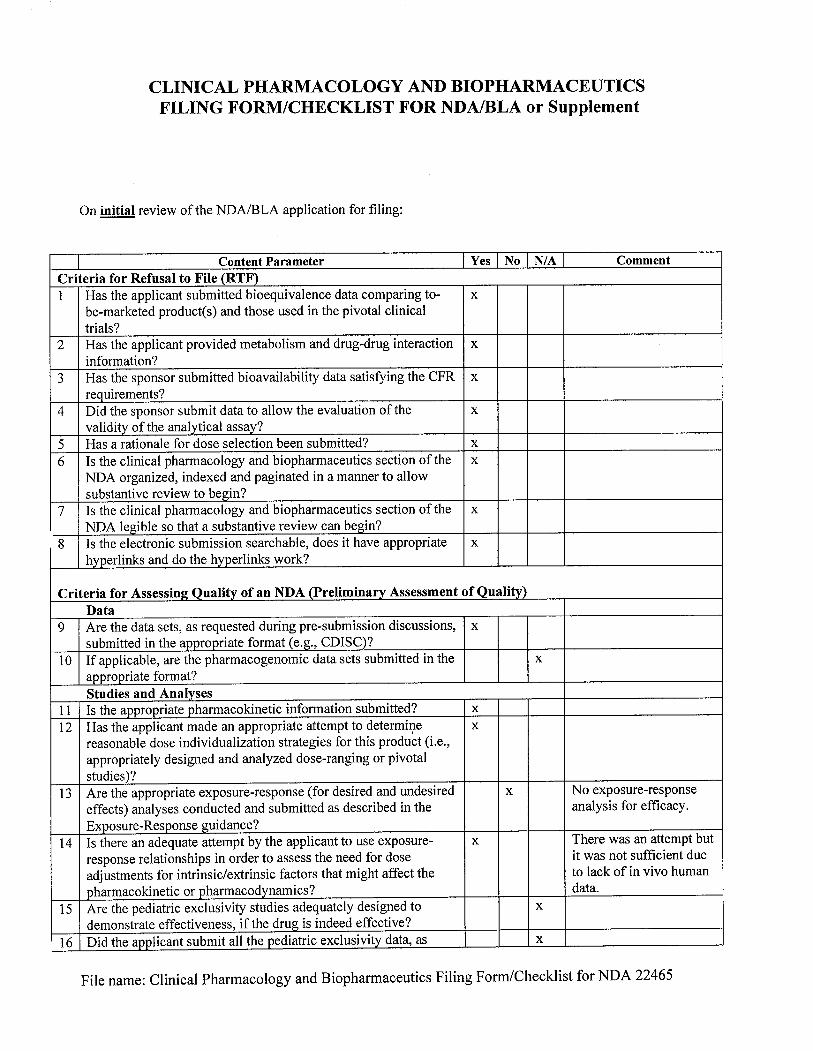
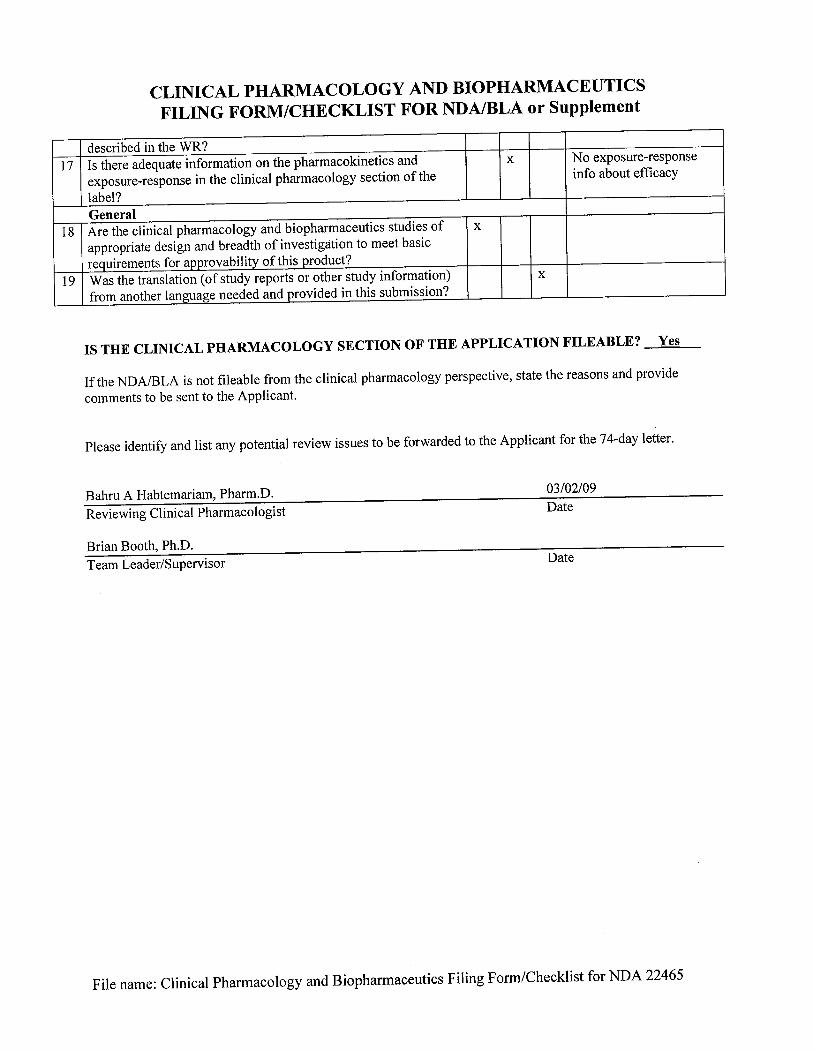
1
ONDQA BIOPHARMACEUTICS REVIEW
NDA#: 22-465 Submission Date: 12/19/2008, 7/31/2009, 8/18/2009, 9/14/2009 Brand Name: Votrient Tablets Generic Name: Pazopanib tablets Formulation: Tablets Strength: 200 and 400 mg Sponsor: GSK Reviewer: John Duan, Ph.D. Submission Type: Original NDA
THE SUBMISSION Pazopanib is an oral angiogenesis inhibitor targeting VEGFR-1, -2, -3. PDGFR-α and ß, and c-Kit. Pazopanib is being evaluated in clinical development for the treatment of a variety of tumors. The current submission is an original NDA. After the original NDA submission, the sponsor requested a meeting to discuss the implementation of the A dissolution model is included in the implementation plan. The meeting was held on July 1, 2009. This review will focus on the dissolution method development and the acceptance criteria. The relevant issues will be discussed. The dissolution method development and the comparability protocol implementation of approach for dissolution can be found in the Attachments. THE PROPOSED DISSOLUTION METHOD AND ACCEPTANCE CRITERIA
(b) (4)
(b) (4)
(b) (4)
13
COMMENTS 1. Although the dissolution method seems adequate, the dissolution acceptance criteria
for pazopanib tablets have not been justified and the proposed Q at 45 minutes is not reasonable. Subsequently, the acceptance criteria in the DOE for defining the design space are not appropriate.
2. For a BCS Class II drug, dissolution is the rate limiting step. An appropriate
dissolution method would be sensitive to formulation and/or process changes, which should provide reliable quality assurance. The dissolution data show significant variability, which may imply inconsistent in vivo performance. The sponsor should seek the source of the observed large variability in dissolution.
3. If the source of the variability can not be identified or the variability can not be
reduced, the bioequivalence between the batch with highest dissolution profile and that with lowest dissolution profile should be shown in order to market the product with such a large variability
4. The acceptance criteria for dissolution should be set as shown below. Q= at 30 minutes using the following conditions. Apparatus: USP Apparatus 2 Volume: 900 mL Medium: 50 mM sodium acetate buffer, pH 4.5, containing 0.75% SDS Agitation: Paddle speed of 75 rpm. Analysis: UV at 270 nm with a background correction at 400 nm. Temperature: 37°C. RECOMMENDATION The comments were conveyed to the review team and to the sponsor in an Email. During a subsequent teleconference held on September 14, 2009, the sponsor accepted the recommended dissolution specification and agreed to modify the acceptance criteria for defining the Design Space in the dissolution model. _______________________________________ _________________ John Duan, Ph.D. Date Reviewer ONDQA Biopharmaceutics _______________________________________________ ____________________ Angelica Dorantes, Ph.D. Date Team Leader ONDQA Biopharmaceutics
(b) (4)
(b) (4)

14
_______________________________________ _________________ Patrick Marroum, Ph.D. Date Supervisor ONDQA Biopharmaceutics cc: NDA 22-465 Patrick Marroum, Angelica Dorantes, John Duan
ApplicationType/Number
SubmissionType/Number Submitter Name Product Name
-------------------- -------------------- -------------------- ------------------------------------------NDA-22465 ORIG-1 GLAXO
WELLCOMEMANUFACTURINGPTE LTD DBAGLAXOSMITHKLINE
VOTRIENT TABLETS
NDA-22465 ORIG-1 GLAXOWELLCOMEMANUFACTURINGPTE LTD DBAGLAXOSMITHKLINE
VOTRIENT TABLETS
NDA-22465 ORIG-1 GLAXOWELLCOMEMANUFACTURINGPTE LTD DBAGLAXOSMITHKLINE
VOTRIENT TABLETS
NDA-22465 ORIG-1 GLAXOWELLCOMEMANUFACTURINGPTE LTD DBAGLAXOSMITHKLINE
VOTRIENT TABLETS
---------------------------------------------------------------------------------------------------------This is a representation of an electronic record that was signedelectronically and this page is the manifestation of the electronicsignature.---------------------------------------------------------------------------------------------------------/s/----------------------------------------------------
JOHN Z DUAN09/18/2009
PATRICK J MARROUM09/18/2009