Embed Size (px)
Citation preview

CENTER FOR DRUG EVALUATION AND RESEARCH
APPLICATION NUMBER:
212839Orig1s000
CLINICAL PHARMACOLOGY AND BIOPHARMACEUTICS REVIEW(S)

1
OFFICE OF CLINICAL PHARMACOLOGY INTEGRATED REVIEW
NDA Number 212839 Link to EDR \\CDSESUB1\evsprod\NDA212839\0001Submission Date 11/21/2018
Submission Type Standard Brand Name XCOPRI
Generic Name Cenobamate
Dosage Form and Strength Tablet, 12.5 mg, 25 mg, 50 mg, 100 mg, 150 mg and 200 mg
Route of Administration Oral
Proposed Indication For the treatment of partial-onset seizures in adult patients
Applicant SK Life Science, Inc. Associated IND 76809 OCP Review Team Jagan Parepally, Angela Men, Michael Bewernitz,
Atul Bhattaram
OCP Final Signatory Mehul Mehta, PhD., FAAPS Division Director Division of Clinical Pharmacology I
Reference ID: 4488162

2
Table of Contents 1. EXECUTIVE SUMMARY ...................................................................................................................... 3
1.1 Recommendations ................................................................................................................................. 3 1.2 Post-Marketing Requirements ............................................................................................................... 4
2. SUMMARY OF CLINICAL PHARMACOLOGY ASSESSMENT.................................................... 5 2.1 Pharmacology and Clinical Pharmacokinetics ...................................................................................... 5 2.2 Dosing and Therapeutic Individualization ............................................................................................ 6
2.2.1 General dosing ................................................................................................................................ 6 2.2.2 Therapeutic individualization ......................................................................................................... 6
2.3 Outstanding Issues ................................................................................................................................ 7 2.4 Summary of Labeling Recommendations ............................................................................................. 7
3. COMPREHENSIVE CLINICAL PHARMACOLOGY REVIEW ..................................................... 8 3.1 Overview of the Product and Regulatory Background ......................................................................... 8 3.2 General Pharmacological and Pharmacokinetic Characteristics ........................................................... 8 3.3 Clinical Pharmacology Questions ....................................................................................................... 10
3.3.1 Does the clinical pharmacology information provide supportive evidence of effectiveness? ...... 10 3.3.2 Is the proposed dosing regimen appropriate for the general patient population for which the indication is being sought? .................................................................................................................... 12 3.3.3 Is an alternative dosing regimen and management strategy required for subpopulations based on intrinsic factors? .................................................................................................................................... 15 3.3.4 Are there clinically relevant food-drug or drug-drug interactions and what is the appropriate management strategy? ........................................................................................................................... 17 3.3.5 Is the to-be-marketed formulation the same as the clinical trial formulation, and if not, are there bioequivalence data to support the to-be-marketed formulation? ......................................................... 24
4. APPENDICES ......................................................................................................................................... 25 4.1 Summary of Bioanalytical Method Validation and Performance ....................................................... 25 4.2 Population PK Analyses ...................................................................................................................... 27
4.2.3 Applicant’s Monotherapy PK Simulations (sk17009-monotherapy.pdf) ..................................... 33 4.3 Exposure-Response Analyses ............................................................................................................. 36
4.3.1 Applicant’s Exposure-Efficacy Model (report sk16008-expo-res.pdf) ........................................ 36 4.3.2 Applicant’s Exposure-Safety Model (report sk16008-expo-res.pdf) ........................................... 40
4.4 Reviewer’s Assessment of Titration Phase 2 Versus Proposed Titration ........................................... 40 4.5 Reviewer’s Assessment of Cenobamate’s Potential to Perpetrate an Interaction against Oxcarbazepine ........................................................................................................................................... 41
Reference ID: 4488162

3
1. EXECUTIVE SUMMARY Cenobamate (YKP3089) is a new molecular entity being developed by SK Life Science, Inc. as an antiepileptic drug (AED). The applicant is seeking its approval for the treatment of partial onset seizures (POS) in adults. Cenobamate reduces repetitive neuronal firing by enhancing the fast and slow inactivation of sodium channels and by inhibiting the persistent component of the sodium current. It is also a positive allosteric modulator of six subtypes of the γ aminobutyric acid (GABAA) ion channel. The proposed dosing regimen includes the recommended starting dose of 12.5 mg once daily for two weeks; followed by 25 mg once daily for two weeks; followed by 50 mg once daily for two weeks. Increase the dose in bi-weekly increments by no more than 50 mg once daily to a recommended maintenance dose of mg once daily. The maximum daily dosage is 400 mg. The efficacy and safety of cenobamate in POS patients were supported by two randomized, double-blind, placebo controlled, multicenter registration trials with an open-label extension study. The efficacy of cenobamate, at daily doses of 100 mg, 200 mg, and 400 mg, has been demonstrated in two adequate and well controlled studies (YKP3089C013 and YKP3089C017). The primary endpoints were percentage change from baseline in seizure frequency over 28 days. The Applicant reports statistically significant differences in placebo-controlled pivotal trials for seizure frequency in POS. The main safety concerns were potential for drug reaction (or rash) with eosinophilia and systemic symptoms (DRESS) and QT shortening. The Applicant proposed slower titration regimen intended to reduce DRESS risk based on safety data from an open-label study c021, which used this slower titration regimen.
There were 19 clinical pharmacology studies in this submission. The pharmacology of cenobamate has been characterized in single doses up to 750 mg and in multiple doses up to 500 mg for 35 days. Cenobamate increases exposure of phenytoin, omeprazole (CYP2C19 probe substrate) by approximately 2-fold when administered concomitantly. Cendobamate decreases midazolam concentration upto 4-fold (CYP3A induction) when administered concomitantly. Hepatic impairment results in a significant increase in exposure to cenobamate.
The key review questions focus on acceptability of cenobamate dose and alternate titration regimen with regard to safety and appropriateness of dosing recommendations for cenobamate in specific populations and patients taking concomitant medications.
1.1 Recommendations
The Office of Clinical Pharmacology, Divisions of Clinical Pharmacology I and Pharmacometrics, have reviewed the information contained in NDA 212,839. The review team recommends approval of this NDA from a clinical pharmacology perspective. The key review issues with specific recommendations /comments are summarized below:
Review Issues Recommendations and Comments Supportive evidence of effectiveness Two pivotal, adequate and well controlled
(YKP3089C013 and YKP3089C017) trials in POS patients provide primary evidence of effectiveness.
Reference ID: 4488162
(b) (4)

4
General dosing instructions
The proposed dosing regimen includes recommended starting dose of 12.5 mg once daily for two weeks; followed by 25 mg once daily for two weeks; followed by 50 mg once daily for two weeks. Increase the dose in bi-weekly increments by no more than 50 mg once daily to a recommended maintenance dose of mg once daily. The maximum daily dosage is 400 mg. The recommended titration and dosing regimen are acceptable from clinical pharmacology perspective. Cenobamate tablets may be taken any time with or without food and should be swallowed whole.
Dosing in patient subgroups (intrinsic and extrinsic factors)
A lower maintenance dose and slower titration in patients with mild and moderate hepatic impairment is recommended.
Phenytoin doses should be decreased by at least 50% when co-administered with cenobamate. Doses of omeprazole and other CYP2C19 substrates may need to be decreased when co-administered with cenobamate.
Midazolam and other CYP3A sensitive substrates should be avoided and increase in dose of CYP3A4 substrates should be considered. Women using oral contraceptives should use additional or alternative non-hormonal birth control when co-administered with cenobamate.Refer to Section 3.3.3 for further details.
Bridge between the “to-be- marketed” and clinical trial formulations
The to-be-marketed (TBM) formulation will be an oral tablet of cenobamate. Capsule formulation of cenobamate was used in earlier clinical trials and one of the pivotal safety and efficacy trial. A bridging PK study was conducted and showed that capsule and tablet formulations were bioequivalent.
1.2 Post-Marketing Requirements
Key Issue(s) to be Addressed Rationale
Key Considerations for Design Features
Reference ID: 4488162
(b) (4)

5
Effect of severe hepatic impairment on pharmacokinetics of cenobamate.
Cenobamate is extensively metabolized in liver.
A specific population study to evaluate the effect of severe hepatic impairment on pharmacokinetics of cenobamate.
2. SUMMARY OF CLINICAL PHARMACOLOGY ASSESSMENT
2.1 Pharmacology and Clinical Pharmacokinetics Mechanism of Action (MOA): Cenobamate reduces repetitive neuronal firing by enhancing the fast and slow inactivation of sodium channels and by inhibiting the persistent component of the sodium current. It is also a positive allosteric modulator of six subtypes of the γ aminobutyric acid (GABAA) ion channel.
Absorption: Cenobamate is well absorbed (>88%). The median cenobamate, Tmax of 1 to 4 hours after single- or multiple-dose administration under fasted condition over the range of 10 to 400 mg. Co-administration with a high-fat meal showed no significant effect on the rate and the extent of absorption.
Distribution: Plasma protein binding of cenobamate is moderate (60%). Cenobamate mainly binds with human albumin protein and not with α1-acid glycoprotein. Cenobamate is mainly confined to plasma. The whole blood to plasma ratio of cenobamate was 0.6. The estimated volume of distribution was 40 L to 50 L.
Metabolism: Cenobamate is extensively metabolized in liver, primarily by glucuronidation via UGT2B7 and to a lesser extent by UGT2B4, and by oxidation via CYP2E1, CYP2A6, CYP2B6, and to a lesser extent by CYP2C19 and CYP3A4/5.
There were no major circulating metabolites identified in human plasma. M1 (N-glucuronide of cenobamate) was the only metabolite found in human plasma, and the exposure (AUC) of M1 was found to be 1.2% of the parent drug. In urine and feces, N-glucuronide metabolite (39.4% of the dose), oxidative O-phenyl glucuronide (20.4% of the dose), dihydrodiol and its glucuronide (17.1% of the dose), and side chain O-glucuronide (3.9% of the dose) appeared to be the major metabolite of cenobamate in vivo. Unchanged cenobamate accounted for 6.8% of the dose which was mainly excreted in the urine (6.4%).
Elimination: The mean elimination half-life ranged from 50 to 60 hours. Following administration of radiolabeled cenobamate, a mean of 93.0% of the total radioactive dose was recovered in urine (87.8%) and feces (5.2%).
Reference ID: 4488162

6
2.2 Dosing and Therapeutic Individualization
2.2.1 General dosing
The applicant recommended starting dose 12.5 mg of once daily for two weeks; followed by 25 mg once daily for two weeks; followed by 50 mg once daily for two weeks. Increase the dose in bi-weekly increments by no more than 50 mg once daily to a recommended maintenance dose of
mg once daily. The maximum daily dosage is 400 mg. The recommended titration and dosing are acceptable from clinical pharmacology perspective (see Section 3.3.2). Cenobamate tablets may be taken any time with or without food and should be swallowed whole.
2.2.2 Therapeutic individualization
Concomitant AEDs: Dedicated drug-interaction trials were conducted evaluating cenobamate’s effect on the PK of commonly concomitant AEDs (valproate, phenobarbital, phenytoin and carbamazepine). A multiple-dose regimen of cenobamate had no significant effect on the steady-state plasma pharmacokinetics of divalproex. However, Cmax and AUC (0-τ) increased by ~2-fold for phenytoin, ~35% for phenobarbital, decreased by ~25 to 35% for carbamezepine in normal volunteer subjects. No dose adjustments are needed for valproic acid when co-administered with cenobamate at maintenance doses from 100 mg/day to 400 mg/day. Carbamazepine doses should be increased when co-administered with cenobamate. Phenytoin doses should be decreased by at least 50% when co-administered with cenobamate. Phenobarbital doses may need to be decreased when co-administered with cenobamate. Substrates of CYP2B6, CYP3A, CYP2C19: Effect of cenobamate on CYP450 probe substrates (CYP2B6 - Bupropion, CYP3A - Midazolam, CYP2C9 - Warfarin, CYP2C19 - Omeprazole) were evaluated in a single DDI study using cocktail approach at steady-state. Bupropion (CYP2B6): In the presence or absence of chronic 200 mg doses of cenobamate, AUC0-
tlast values for R-, S-bupropion and total bupropion decreased by 39%, 31%, and 39% respectively and mean Cmax values decreased for R-bupropion and total bupropion by 24% and 23%. Doses of bupropion and other CYP2B6 substrates may need to be increased when co-administered with 200 mg cenobamate. The drug-drug interaction effect at 400 mg cenobamate is unknown. Omeprazole (CYP2C19): In the presence or absence of multiple 200 mg doses of cenobamate, the AUC0-tlast and Cmax increased by 83% and 107%, respectively. These results showed that cenobamate inhibited CYP2C19 isoenzyme. Doses of omeprazole and other CYP2C19 substrates may need to be decreased by approximately 50% when co-administered with cenobamate. Midazolam (CYP3A): In the presence of multiple 200 mg doses of cenobamate, the AUC0-tlast and Cmax for midazolam decreased by 72% and 61%, respectively. Midazolam or CYP3A sensitive substrates should be avoided or increase in dose of CYP3A4 substrates should be considered. Oral Contraceptives Effectiveness of hormonal oral contraceptives is reduced by CYP3A4 inducers. Since cenobamate is a potent inducer of CYP3A4, women of reproductive potential concomitantly using oral contraceptives should use additional or alternative non-hormonal birth control.
Reference ID: 4488162
(b) (4)
7
Renal Impairment: A renal impairment trial (YKP3089C028) was conducted to evaluate the effect of renal impairment on PK of cenobamate in subjects with mild, moderate, and severe renal impairment compared with subjects with normal renal function. There was a slight decrease in cenobamate Cmax in patients with mild, moderate or severe forms of renal impairment. Geometric mean for total plasma exposure (AUC0-inf) to cenobamate was 1.4-1.5 fold higher in subjects with mild and moderate renal impairment compared to subjects with normal renal function. The results from the severe renal impairment group were comparable to that of normal subjects. The reason behind unanticipated results seen in severe renal impaired patients could not be explained by inter subject variability, inter occasion variability or demographic factors. Cenobamate should be used with caution in subjects with mild, moderate or severe renal impairment. The effect of hemodialysis on PK of cenobamate was not evaluated in a clinical study. The incidence of POS patients with ESRD is very low. Dializability of cenobamate or its glucuronide metabolites from plasma are unknown. Therefore, cenobamate is not recommended in patients undergoing hemodialysis. Hepatic Impairment: Cenobamate is extensively metabolized. The effect of hepatic impairment on PK of cenobamate was evaluated in a dedicated Study YKP3089C027. The geometric mean Cmax for cenobamate was slightly higher in subjects with mild HI (about 20%) compared to subjects with normal hepatic function. However, Cmax did not change significantly in moderate hepatic-impaired subjects, compared with subjects with normal hepatic function. The geometric mean AUC (0-∞) for total cenobamate increased by 1.93- and 2.3-fold in mild and moderate hepatic-impaired subjects, respectively compared with subjects with normal hepatic function. In patients with mild and moderate hepatic impairment, cenobamate dose in titration phase should be reduced by 50% and maximum daily dosage of 200 mg cenobamate should not be exceeded. A slower titration is recommended in case of any safety concerns or poor tolerability. Cenobamate is not recommended in patients with severe hepatic impairment.
2.3 Outstanding Issues
A PMR clinical trial will be issued: To evaluate potential effects of severe hepatic impairment on the pharmacokinetics of cenobamate. Refer to Section 1.2 above for details.
2.4 Summary of Labeling Recommendations
The Office of Clinical Pharmacology recommends the following labeling concepts to be included in the final package insert:
Highlights: Effectiveness of hormonal oral contraceptives may be reduced when administered concomitantly with cenobamate. Cenobamate induces CYP3A, an enzyme involved in metabolism of oral contraceptives.
In section 7, OCP recommends adding increase in dosage or decrease in dosage based on changes due to drug-drug interactions instead of dose adjustments. Adding the statements regarding effectiveness of hormonal oral contraceptives.
In section 8, adding decrease in dosage for patients with hepatic impairment instead of dose adjustments. Adding the statements regarding effectiveness of hormonal oral contraceptives.
Reference ID: 4488162

• Removal of the proposed labeling statements related to oral contraceptives.
3. COMPREHENSIVE CLINICAL PHARMACOLOGY REVIEW
3.1 Overview of the Product and Regulatory Background
Cenobamate is planned to be available as tablets for oral administration, which contain the following inactive ingredients: colloidal silicon dioxide, lactose monohydrate, magnesium stearate, microc1ystalline cellulose, and sodium starch glycolate and film coating agents. Cenobamate tablet strengths include 12.5 mg, 25 mg, 50 mg, 100 mg, 150 mg and 200 mg.
Cenobamate is a new molecular entity being developed by SK Life Science, Inc. as an antiepileptic dmg (AED) for paiiial onset seizures. The efficacy of cenobamate, at daily doses of 100 mg, 200 mg, and 400 mg, has been demonstrated in 2 adequate and well controlled studies (YKP3089C013 and YKP3089C017). The phaimacology of cenobamate has been chai·acterized in single doses up to 750 mg and in multiple doses up to 500 mg. Cenobamate for the treatment of POS was developed under IND 76809. At the end of phase 2 meeting, the sponsor agreed to provide a rationale in the NDA for not including a severe hepatic impairment group in your hepatic impainnent study. However, no fmther infonnation is provided in cmTent application. In the Type C meeting minutes (7/2014) the sponsor was info1med that the DDI assessments ai·e based on the projected efficacious doses 100-200mg. If the planned 400mg dose for the ongoing Phase 2 clinical trial (YKP3089C017) turns out to be efficacious for the approval, then the DDI potential will need to be re-assessed, as results obtained to date will not be conclusive. In this NDA cenobamate DDI potential at the highest possible dose ( 400 mg) was not evaluated.
3.2 General Pharmacological and Pharmacokinetic Characteristics
SUMMARY OF CLINICAL PHARMACOLOGY AND PHARMACOKINETICS
Pharmacology
Mechanism of Action Cenobamate reduces repetitive neuronal filing by enhancing the fast and slow inactivation of sodium channels and by inhibiting the persistent component of the sodium cunent. It is also a positive alloste1ic modulator of six subtypes of they aminobutyric acid (GABAA) ion channel. However, the exact mechanisms by which cenobamate exe1ts its anticonvulsant effect in humans is unknown.
Active Moieties There were no major circulating metabolites (i.e.,> 10% of total diug-related material) identified in human olasma.
QT Change Thorough QT study demonstrated that cenobamate doses up to 500 mg/day does not induce a dose dependent prolongation of the QTc. However, there was a dose dependent shortening of the QTc inte1val. The mean placebo-conected LiQTcF (LiliQTcF) at 0.5 hour, -10.8 msec [90% confidence inte1val (CI): -13.4 to -8.2] on Day 35 and-18.4 msec (90% CI: -21.5 to -15.2) on Day 63.
8
Reference ID 4488162

General Information
Bioanalysis A chiral validated liquid chromatographic-tandem mass spect:rometiic (LC/MS/MS) bioanalytical methods were used to quantify plasma concenti·ations of cenobamate in human plasma with a calibration range of 0.02 µg/mL to 25 ~tg/mL. A summaiy of the method validation repo1t is included as an appendix.
Healthy Volunteers vs The PK of cenobamate was compai·able between healthy subjects and Patients subjects with POS based on the population analysis.
Drng exposure at The mean overall cenobamate exposure at the steady state (AUCO--r) of steady state following cenobamate at 200 mg/day was 482 µg.hr/mL and at 400 mg/day was 861 the therapeutic µg.hr/mL in healthy subjects. dosing regimen Dose Propo1t ionality The phannacokinetics of cenobamate were greater than dose-propo1t ional
manner following single oral doses ranging from 5 mg to 750 mg. However, the Cmax of cenobamate increased in a dose propo1tional manner. The PK of cenobamate was essentially dose propo1t ional following multiple doses ranging from 50 mg/day to 500 mg/day.
Accumulation A mean accumulation ratio obse1ved at steady-state was approximately 5-fold based on AUC.
Variability Inter-subject variability of cenobamate in humans was up to 25% for Cmax and up to 35% for AUCO-t. The intrasubject vaiiability of cenobamate estimated to be 14% for Cmax and up to 5% for AUCO-t.
ADME
Absorption Cenobamate was well absorbed, based on mass-balance study at least 88% was recovered in mine following oral administi·ation. Co-administi·ation with a high-fat meal showed no significant effect on the rate and the extent of absorption.
Tmax The median cenobamate Tmax 1 to 4 hours after single- or multiple-dose administration under fasted condition over the range of 10 to 400 mg.
-
Food Effect (high-fat) AUCO-oo Cmax
GMR(90% CI) Cenobamate 0.90 (0.85, 0.95) 0.90 (0.85, 0.95)
Disti·ibution Plasma protein binding of cenobamate is moderate (60%) and independent of concenti·ation. Cenobamate mainly binds with human albumin protein and not with al-acid glycoprotein. Cenobamate is mainly confined to plasma. The whole blood to plasma ratio of cenobamate was 0.6. The estimated volume of distribution was 40 L to 50 L.
Elimination
Mean Te1minal Elimination half-life 50 to 60 hours
Metabolism
9
Reference ID 44881 62

10
Primary metabolic pathway(s)
Cenobamate is extensively metabolized in liver, primarily by glucuronidation via UGT2B7 and to a lesser extent by UGT2B4, and by oxidation via CYP2E1, CYP2A6, CYP2B6, and to a lesser extent by CYP2C19 and CYP3A4/5.
There were no major circulating metabolites (i.e., >10% of total drug-related material) identified in human plasma. In a mass-balance study, administration of radiolabeled cenobamate, unchanged cenobamate accounted for >98% of the total AUC of radioactivity in plasma. M1 (N-glucuronide of cenobamate) was the only metabolite found in human plasma, and the exposure (AUC) of M1 was found to be 1.2% of the parent drug. In urine and feces, N-glucuronide metabolite (39.4% of the dose), oxidative O-phenyl glucuronide (20.4% of the dose), dihydrodiol and its glucuronide (17.1% of the dose), and side chain O-glucuronide (3.9% of the dose) appeared to be the major metabolite of cenobamate in vivo. Unchanged cenobamate accounted for 6.8% of the dose which was mainly excreted in the urine (6.4%).
Inhibitor/Inducer (in vitro)
Cenobamate inhibits CYP2B6, CYP2C19 and CYP3A4/5 with an IC50 of 280 µM, 170 µM and 720 µM, respectively. Cenobamate did not inhibit CYP1A2, CYP2C8, CYP2C9 or CYP2D6. The Cmax of cenobamate following 200 mg daily dose was approximately 90 µM. A maintenance dose of maximum 400 mg per day is proposed. Cenobamate caused an induction of CYP2B6, CYP2C8 and CYP3A4. No cytochrome P450 induction was observed for CYP1A2, CYP2C9, or CYP2C19.
Transporter Systems (in vitro)
Cenobamate is not a substrate of of P-gp, BCRP, OAT1, OAT3, OCT2, MATE1 or MATE2-K, and did not inhibit P-gp, OAT1, OCT1, OCT2, OATP1B3, or BSEP. Weak inhibition of OAT3 and OATP1B1 were observed with cenobamate.
Excretion Following administration of radiolabeled cenobamate, a mean of 93.0% of the total radioactive dose was recovered in urine (87.8%) and feces (5.2%). Mean terminal half-life for cenobamate ranged from 50 to 60 hours following single oral doses of 100 to 400 mg.
3.3 Clinical Pharmacology Questions
3.3.1 Does the clinical pharmacology information provide supportive evidence of effectiveness?
Sponsor’s exposure-response analyses demonstrate a trend of increasing effectiveness with increasing exposure. The Applicant’s simulations indicate that the 100, 200, and 400 mg dose levels are expected to reduce seizure rate, on average, by 30%, 48%, and 63%, respectively. In Phase 2 study c017 the observed reduction in seizure rate is 35.5%, 55%, and 55%. Additional details regarding the Sponsor’s exposure-response analyses can be found in section 3.3.2 as well as Appendix 4.3. In addition, the reviewer generated plots using the observed efficacy data from Phase 2 study c013 and Phase 2 study c017. Figure 1 and Figure 2 highlight a trend of increasing effectiveness with increasing dose during titration, maintenance, as well as the conversion to the open-label
Reference ID: 4488162

11
extension (for Phase 2 trial c017 only). Figure 1: Percent Change from Baseline Monthly Seizure Frequency by Arm and By Time Period in Phase 2 Study c013
Figure 2: Percent Change from Baseline Monthly Seizure Frequency by Arm and By Time Period in Phase 3 Study c017
Reference ID: 4488162

12
3.3.2 Is the proposed dosing regimen appropriate for the general patient population for which the indication is being sought? Maintenance dose regimen: The proposed maintenance dose range of mg once daily is supported by clinical efficacy and is acceptable from OCP’s perspective.
Titration regimen: The Titration regimen applied in Phase 2 trial c017 is 50 mg/day initially followed by 50 mg/day increases every week for subjects in the 100 mg/day arm and 200 mg/day arm. For the subjects randomized to 400 mg/day, once titration reaches 200 mg/day the titration escalates to 100 mg/day increases every week. However, due to concerns about Drug Reaction (or Rash) with Eosinophilia and Systemic Symptoms (DRESS), the Applicant is proposing a slower titration regimen which was utilized in open-label PK and safety study c021. The slower titration regimen utilized in study c021 was 12.5 mg, 25 mg, 50 mg, 100 mg, 150 mg, and 200 mg per day at two weeks intervals to 200 mg/day was reached followed by increases at increments of 50 mg/day to a maximum of 400 mg/day. The Applicant states that the proposed slower titration regimen is intended to reduce DRESS risk based on safety data from an open-label study c021 which used this slower titration regimen. Please refer to the review from the medical officer for additional discussion regarding DRESS risk.
Efficacy was not assessed in study c021 and seizure rate information was not available from the interim report from c021. The Applicant conducted PK and PD simulations to predict the dose-response at the slower titration regimen that was utilized in study c021 and proposed for the label. The simulations were summarized in the form of a dose-response curve which appears consistent with an Emax model (see Figure 3).
Reference ID: 4488162
(b) (4)

13
Figure 3: Applicant’s Simulated Seizure Dose-Response During Maintenance for Slower Titration Regimen Utilized in Study c021
Source: sequence 0001, module 5335, sk16008-expo-res.pdf page 61 of 161
The Applicant’s plot does not show the progression of the therapeutic response effect over time. In order to visualize the progression of therapeutic benefit over time, the reviewer conducted an independent analysis to compare the phase 3 titration scheme versus the proposed titration scheme. The Applicant’s population pharmacokinetic model and exposure-response model were utilized to simulate the typical PK profile and typical seizure frequency throughout each titration regimen. Figure 4 provides a comparison of the simulated PK profiles. Figure 5 provides a comparison of the simulated seizure frequency under the two proposed regimens.
Figure 4: Predicted Mean Plasma Concentration-Time Profile For Both Titration Regimens
Reference ID: 4488162

14
Reference ID: 4488162

15
Figure 5: Predicted Change from Baseline 28-day Seizure Rate For Both Titration Regimens
The titration scheme used in Phase 3 trial c017 can be expected to achieve maximum effect at, on average, approximately 5 weeks (at the completion of titration). The slower titration scheme proposed for the label can be expected to produce approximately half the maximum effect by 5 weeks and maximum effect at 14 to 18 weeks. The purpose of the proposed slower titration scheme (which is slower than was applied in Phase 3 trial c017) is to reduce the risk of DRESS. This slower titration scheme was applied in open-label PK and safety study c021.
As expected, the slower titration results in a slower progression towards maximum therapeutic response. At the time that this review was archived, internal and external discussions are ongoing regarding selection of a titration regimen regarding the potential reduction in DRESS risk versus slower achievement of therapeutic response. Assuming this drug is approved, the final label will reflect subsequent ongoing internal discussions and external discussions.
3.3.3 Is an alternative dosing regimen and management strategy required for subpopulations based on intrinsic factors?
Yes. Cenobamate is extensively metabolized in the liver and excreted as metabolites in urine. The average cumulative recovery in urine for all radioactive components was about 87.5% in human mass balance study. As no major circulating metabolites were observed in plasma.
Reference ID: 4488162

16
Hepatic Impairment: The effect of hepatic impairment on PK of cenobamate was evaluated in a dedicated Study YKP3089C027. The PK of a single oral dose of 200 mg cenobamate in subjects with mild (Child-Pugh Grade A, Score: 5-6), moderate (Child-Pugh Grade B, Score: 7-9), hepatic impairment was compared with subjects with normal hepatic function, with 8 subjects per group. The geometric mean Cmax for cenobamate was slightly higher in subjects with mild HI (about 20%) compared to subjects with normal hepatic function. However, Cmax did not change significantly in moderate hepatic-impaired subjects, compared with subjects with normal hepatic function. The geometric mean AUC (0-∞) for total cenobamate increased by 1.93- and 2.3-fold in mild and moderate hepatic-impaired subjects, respectively compared with subjects with normal hepatic function as shown in Table below.
Table 1: Effect of Hepatic Impairment on cenobamate Cmax and AUC
Comparison (Test/Reference) Cmax (µg/mL) AUC(0-t)
(µg*h/mL) AUC(0-∞) (µg*h/mL)
Ratio of Geometric Least Squared Means (90% CI) Cenobamate
Mild/Normal 1.23 (1.04, 1.46) 1.92 (1.51, 2.44) 1.93 (1.51, 2.49) Moderate/Normal 0.90 (0.76, 1.07) 2.13 (1.67, 2.71) 2.30 (1.79, 2.95)
In patients with mild and moderate hepatic impairment, cenobamate dose in titration phase should be reduced by 50% and maximum daily dosage of 200 mg cenobamate should not be exceeded. A slower titration is recommended in case of any safety concerns or poor tolerability. A PMR will be issued to the sponsor to conduct additional study evaluating the effect of severe hepatic impairment on PK of cenobamate when compared to healthy subjects.
Renal Impairment: A renal impairment trial (YKP3089C028) was conducted to evaluate the effect of renal impairment on PK of cenobamate in subjects with mild, moderate, and severe renal impairment compared with subjects with normal renal function. A 200 mg cenobamate dose was administered in normal subjects and in subjects with mild and moderate renal impairment. However, in subjects with severe renal impairment a dose of 100 mg was administered in this study.
There was a slight decrease in cenobamate Cmax in patients with mild, moderate or severe forms of renal impairment (Table below). Geometric mean for total plasma exposure (AUC0-inf) to cenobamate was 1.4-fold higher in subjects with mild renal impairment compared to subjects with normal renal function (90% CI: AUC0-∞ 1.11 to 1.70) and was about 1.5-fold higher in subjects with moderate renal impairment compared to subjects with normal renal function (90% CI: AUC0-∞ =1.17 to 1.86).
The results from the severe renal impairment group were unanticipated (plasma exposure apparently lower than for the normal renal function group after 200 mg dose normalization). The reason behind the unanticipated results seen in severe renal impaired patients could not be explained by inter-subject variability, inter-occasion variability or demographic factors. Cenobamate should be used with caution in subjects with mild, moderate or severe renal
Reference ID: 4488162

17
impairment. The effect of hemodialysis on PK of cenobamate was not evaluated in a clinical study. The incidence of POS patients with ESRD is very low. Dializability of cenobamate or its glucuronide metabolites from plasma are unknown. Therefore, cenobamate is not recommended in patients undergoing hemodialysis. Table 2: Geometric Mean Ratios and 90% Confidence Intervals for cenobamate by Status of Renal Function
Comparison (Test/Reference) Cmax (µg/mL) AUC(0-t)
(µg*h/mL) AUC(0-∞) (µg*h/mL)
Ratio of Geometric Least Squared Means (90% CI) Cenobamate
Mild/Normal 0.86 (0.75, 1.00) 1.36 (1.10, 1.69) 1.37 (1.11, 1.70) Moderate/Normal 0.92 (0.79, 1.08) 1.47 (1.17, 1.86) 1.48(1.17, 1.86) Severe/Normal 0.76 (0.66, 0.88) 0.86 (0.69, 1.06) 0.88 (0.71, 1.09)
Effect of UGT2B7 Polymorphism Cenobamate is extensively metabolized in the liver, primarily mediated by glucuronidation via UDP-glucuronosyltransferase (UGT)2B7. Though UGT2B7 polymorphism (*1, *2) exists commonly there is no available literature demonstrating significant effect of polymorphism on UGT2B7 enzymatic activity. The sponsor did not collect DNA samples from patients in any of the registration trials. The pharmacokinetics of cenobamate showed moderate variability (inter-subject variability was up to 25% for Cmax and up to 35% for AUC0-t). Therefore, no further evaluation was sought. Effect of Age The effect of age on the PK of cenobamate was investigated in Study YKP3089C030. A relatively small difference (6% increase) in total exposure to cenobamate (AUC) was observed between young and elderly. However, difference in the AUC between young and elderly was not considered to be clinically meaningful. No dose adjustment is necessary in elderly subjects. Effect of Gender The results of Study AA24143 showed that there were no differences in the PK of cenobamate between males and females at a daily cenobamate dose of 150 mg. Based on population PK analyses, African American race has been shown to have a statistically significant decrease (15%) on the oral clearance of cenobamate and Hispanic ethnicity, body weight has been shown to have a decrease of 13% on clearance. However, these relatively small changes are not considered clinically meaningful.
3.3.4 Are there clinically relevant food-drug or drug-drug interactions and what is the appropriate management strategy?
Cenobamate is extensively metabolized in the liver, primarily mediated by glucuronidation via UDP-glucuronosyltransferase (UGT)2B7 and to a lesser extent by UGT2B4, and by oxidation via CYP2E1, CYP2A6, CYP2B6, and to a lesser extent by CYP2C19 and CYP3A4/5, based on in
Reference ID: 4488162

18
vitro studies. There was no significant food effect observed. The effects of extrinsic factors such as herbal products on the dose-exposure and/or dose-response of cenobamate was not assessed in dedicated studies. The in vitro drug interaction potential, clinical drug-drug interactions between cenobamate and valproate, phenobarbital, phenytoin, carbamazepine, bupropion, midazolam, warfarin, omeprazole, oral contraceptive (Ortho-Novum), alcohol and the food effect on cenobamate are further discussed in this section. In Vitro Assessment of DDI Potential In vitro studies indicate that cenobamate inhibits CYP2B6, CYP2C19 and CYP3A4/5 with an IC50 of 280 µM, 170 µM and 720 µM, respectively. Cenobamate did not inhibit CYP1A2, CYP2C8, CYP2C9 or CYP2D6. The Cmax of cenobamate following 200 mg daily dose was approximately 90 µM. A maintenance dose of maximum 400 mg per day is proposed. In vitro studies indicate that cenobamate at concentrations up to 600 µM, caused an induction of CYP2B6, CYP2C8 and CYP3A4. No cytochrome P450 induction was observed for CYP1A2, CYP2C9, or CYP2C19. Cenobamate is not a substrate of P-gp, BCRP, OAT1, OAT3, OCT2, MATE1 or MATE2-K, and did not inhibit P-gp, OAT1, OCT1, OCT2, OATP1B3, or BSEP. Weak inhibition of OAT3 and OATP1B1 were observed with cenobamate. The applicant conducted dedicated drug-drug interaction studies with probe substrates of CYP2B6 (bupropione), CYP3A4 (midazolam), CYP2C9 (warfarin), CYP2C19 (omeprazole), commonly used anti-epileptic drugs valproate, phenobarbital, phenytoin and carbamazepine to investigate the CYP450 inhibitory and induction potential of cenobamate against the major CYP450 isoforms. Drug-drug interaction studies with oral contraceptive (Ortho-Novum) and alcohol were also included in this submission. In Vivo Assessment of Drug-Drug Interactions Effect of Cenobamate on Other Drugs Effect of Cenobamate on Concomitant AEDs Several dedicated drug-drug interaction studies were conducted to evaluate the effect of cenobamate treatment following repeated dosing on the pharmacokinetics of valproate, phenobarbital, phenytoin and carbamazepine at steady-state in healthy male and female subjects. A multiple-dose regimen of cenobamate had no significant effect on the steady-state plasma pharmacokinetics of divalproex. However, Cmax and AUC (0-τ) increased by ~2-fold for phenytoin, ~35% for phenobarbital, decreased by ~25 to 35% for carbamezepine in normal volunteer subjects. The effects of cenobamate on the PK of AEDs (valproate, phenobarbital, phenytoin and carbamazepine) are summarized in Table below. No dose adjustments for valproic acid when co-administered with cenobamate at maintenance doses from 100 mg/day to 400 mg/day. Carbamazepine doses should be increased when co-administered with cenobamate. Phenytoin doses should be decreased when co-administered with cenobamate.
Reference ID: 4488162

Note: Most of the dedicated DDI studies were evaluated using cenobamate at 200 mg dose. Midazolam study was conducted using 100 mg and 200 mg cenobamate doses as described above. However, a maintenance dose of maximum 400 mg per day is proposed for POS. These studies do not indicate the maximum possible chug-chug interaction potential of cenobamate. Therefore, DDis could not be excluded at 400 mg of cenobamate.
Effect of Cenobamate on PK of Concomitant AEDs
Drug, PK Parameter AED + Cenobamate versus AED Alone Ratio
900/o CI Divalproex Cmax 1.0477 0.9357, 1.1732 AVCO-< 1.0968 0.9903, 1.2147 Phenobarbital Cmax 1.3380 1.2843, 1.3938 AVCO-< 1.3745 1.3292, 1.4214 Phenvtoin Cmax 1.6700 1.5507 1.7984 AVCO-< 1.8417 1.6906, 2.0062 Carbamazepine (YKP3089C011) Cmax 0.6634 0.6234, 0.7058 AVCO-< 0.6547 0.6183, 0.6932 Carbamazevine (YK.P3089C014) Cmax 0.7691 0.7142, 0.8283
AVCO-< 0.7646 0.7118, 0.8214
Effect of Cenobamate on CYP450 Substrates
Effect of cenobamate on CYP450 probe substrntes (CYP2B6 - Bupropion, CYP3A - Midazolam, CYP2C9 - Warfarin, CYP2C19 - Omeprazole) were evaluated in a single DDI study using cocktail approach. Multiple doses of cenobamate were administered according to the following schedule below.
Days: Days 13-26 Days 27-40 Days 41-54 Days 71-84 Days 55-70 Days 85-110
Single 12.5 mg Single 25 mg Single Single Single Single dose dose 50mg dose 150mg 100 mg dose 200 mg dose
Dose dose (1 x 12.5 mg (1 x 25 mg (1 x50 mg (3 x 50 mg ( l x lOOmg (2 x 100 mg tablet) tablet) tablet) tablets) tablet) tablets)
Probe substrates were administered according to the following schedule below. • Bupropion (1 tablet of 150 mg) on Day 1 and Day 99 • Midazolam (2 mg/mL oral syrnp) on Day 7, Day 69 and Day 105 • Warfarin (1 tablet of 5 mg) on Day 7 and Day 105
19
Reference ID 4488162

20
• Omeprazole (1 delayed-release tablet of 20 mg) on Day 7 and Day 105 Effect of Cenobamate at 100 mg/day and 200 mg/day on CYP450 Probes (CYP2B6 - Bupropion, CYP3A - Midazolam, CYP2C9 - Warfarin, CYP2C19 - Omeprazole) Based on AUC0-t. Following forest plot describes the magnitude of DDI using the GMR (with/without cenobamate) of the Cmax and theAUC0-tlast for each probe substrates.
• Bupropion (CYP2B6): In the presence (Day 99) or absence (Day 1) of chronic 200 mg doses of cenobamate, AUC0-tlast values for R-, S-bupropion and total bupropion decreased by 39%, 31%, and 39% respectively and mean Cmax values decreased for R-bupropion and total bupropion by 24% and 23%. The 90% CI of the GMR for R-, S-bupropion, and total bupropion AUC0-tlast, and R-bupropion and total bupropion Cmax were outside of the no effect boundaries (80-125%). These results showed that cenobamate induced CYP2B6 isoenzyme. Doses of bupropion and other CYP2B6 substrates may need to be increased when co-administered with 200 mg cenobamate. The drug-drug interaction effect at 400 mg cenobamate is unknown. • Midazolam (CYP3A): In the presence (Day 69) or absence (Day 7) of multiple 100 mg doses of cenobamate, the observed AUC0-tlast and Cmax values decreased by 27%. The 90% CI of the GMR AUC0-tlast and Cmax were outside the no effect boundaries (80-125%). The inducing effects of cenobamate on CYP3A isoenzyme appeared to be limited using the 100mg/day dosing.
Reference ID: 4488162

21
In addition, in the presence (Day 105) or absence (Day 7) of multiple 200 mg doses of cenobamate, the GMR for AUC0-tlast and Cmax values for midazolam decreased by 72% and 61%, respectively. The 90% CI of the GMR AUC0-tlast and Cmax were also outside and below the no effect boundaries (80-125%). These results showed that cenobamate induced CYP3A isoenzyme at 200 mg/day dosing. Midazolam or CYP3A sensitive substrates should be avoided andor increase in dose of CYP3A4 substrates should be considered. • Warfarin (CYP2C9): In the presence (Day 105) or absence (Day 7) of multiple 200 mg doses of cenobamate, the 90% CI of the GMR for S-warfarin Cmax were within the no effect boundaries (80-125%). The S-warfarin AUC0-tlast ratio and 90% CI lied entirely above 100%, but they still remained within the no-effect boundaries. These results suggest that no significant effect of cenobamate is expected on CYP2C9. No dose adjustments necessary for warfarin or any CYP2C9 substrates. • Omeprazole (CYP2C19): In the presence (Day 105) or absence (Day 7) of multiple 200 mg doses of cenobamate, the GMR for AUC0-tlast and Cmax increased by 83% and 107%, respectively. The 90% CI of the GMR for omeprazole AUC0-tlast and Cmax were above the no effect boundaries (80-125%). These results showed that cenobamate inhibited CYP2C19 isoenzyme. Doses of omeprazole and other CYP2C19 substrates should be decreased when co-administered with cenobamate. Interaction with Oral Contraceptives The effect of oral contraceptives (OC) on the PK of cenobamate was studied in Study YKP3089C006. The co-administration of Ortho-Novum 1/35® with cenobamate 100 mg/day had no effect on the PK of cenobamate. The co-administration of cenobamate 100 mg/day with Ortho-Novum 1/35® had no effect on the PK of ethinyl estradiol. The co-administration of cenobamate 100 mg/day with Ortho-Novum increased the exposure to norethindrone (+37% for AUC0-τ). The effect of 400 mg cenobamate on OC is unknown. Effectiveness of hormonal oral contraceptives is reduced by CYP3A4 inducers. Since cenobamate is a potent inducer of CYP3A4 women of reproductive potential concomitantly using oral contraceptives should use additional or alternative non-hormonal birth control. Note: The DDI study conducted using 100 mg/day cenobamate dose with oral contraceptives was inconclusive. Midazolam study resulted in approximately 70% decrease when administered concomitantly with 200 mg cenobamate. A maintenance dose of maximum 400 mg per day is proposed for POS. These studies do not indicate the maximum possible drug-drug interaction potential of cenobamate. Effect of Other Drugs on Cenobamate Effect of AEDs on Cenobamate PK The effect of valproate, phenobarbital, phenytoin and carbamazepine repeated dosing on the pharmacokinetics of cenobamate at steady-state were evaluated in several dedicated DDI studies in healthy male and female subjects. Plasma cenobamate multiple-dose exposure (Cmax, AUC) decreased with co-administration of
Reference ID: 4488162

phenytoin by 27 - 28%. However, repeated dosing of valproate, phenobarbital and carbamazepine repeated dosing did not have any significant impact on plasma cenobamate multiple-dose exposm e. The effects of concomitant AEDs on cenobamate on the PK are summarized in Table below.
Effect of Concomitant AEDs on PK of Cenobamate
Co-administered Drug PK Cenobamate + Parameter AED versus
Cenobamate 900/oCI
Alone Ratio
Divalproex
Cm ax 1.0000 0.9750, 1.0256
AVCO-< 1.0897 1.0620, 1.1182
Phenobarbital
Cmax 0.9027 0.8273, 0.9850
AVCO-< 0.8450 0.7739, 0.9227
Pheny toin
Cm ax 0.7306 0.6827, 0.7820
AVCO-< 0.7170 0.6725, 0.7644
Carbamazepine
Cm ax 0.9733 0.9366, 1.0115
AVCO-< 0.9736 0.9479, 1.0001
Effect of Concomitant AEDs on Cenobamate PK Based on Population PK Modeling As paii of the population PK model (Study SK16007), the effect of concomitant AEDs (including carbamazepine, clobazam, lacosamide, lamotrigine, levetiracetam, oxcai·bazepine, topiramate, and valproic acid) on the PK of cenobamate was assessed. The final PK model showed that cai·bamazepine and clobazam were both significantly affected the oral cleai·ance of cenobamate by a 15% increase and a 19% decrease, respectively. The other AEDs tested were not found to affect significantly the disposition of cenobamate.
The Applicant assessed the effect of cenobamate on the PK of oxcai·bazepine using population PK modeling. According to the cmTent Trileptal® ( oxcarbazepine) label, the phan nacological activity of Trileptal® is primarily exe1ied through the 10-monohydroxy metabolite (MHD) of oxcarbazepine. However, the concentration of MHD was not measmed by the bioanalytical assay and thus not evaluated in the popPK analysis. The cmTent Trileptal® label indicates that strong inducers of cytochrome P450 enzymes have been shown to decrease the plasma/sernm levels of MHD. Therefore, population PK analysis for oxcai·bazepine based on the pai·ent moiety is inconclusive in tenns of assessing whether cenobamate pe1petrates a clinical-relevant drng interaction against oxcarbazepine.
22
Reference ID 4488162

23
Due to the lack of MHD metabolite PK data, the reviewer investigated the potential for cenobamate to affect MHD PK with a graphical analysis of seizure rate by oxcarbazepine use. Figure 10, Figure 11, Figure 12, and Figure 13 in Appendix 4.5 present the % change from baseline seizure rate in subjects receiving cenobamate with concomitant oxcarbazepine versus subjects receiving cenobamate without concomitant oxcarbazepine by dose level and time period in trial c013 and trial c017. Overall, based on Figure 10, Figure 11, Figure 12, and Figure 13 there is no clear relationship between efficacy and concomitant use of oxcarbazepine in subjects treated with cenobamate in trial c013 or c017. As such, the efficacy data do not support the existence of a clinically-relevant interaction perpetrated by cenobamate against oxcarbazepine. For additional details, please refer to Appendix 4.5 Cenobamate is extensively metabolized in the liver, primarily mediated by glucuronidation via UDP-glucuronosyltransferase (UGT)2B7 and to a lesser extent by UGT2B4, and by oxidation via CYP enzymes.. Examples of the most commonly used concomitant UGT2B7 inhibitors include indomethacin, flunitrazepam (not approved in the US), ketoconazole (available for topical use only) andvalproate. These UGT2B7 inhibitors are nonspecific, they are involved in inhibition of other UGT isozymes. A drug-drug interaction study using valproate (VA) and zidovudine, a specific probe substrate for UGT2B7 resulted in 80% increase in AUC of zidovudine (ZDV) due to inhibition of glucuronidation (Retrovir® USPI). Literature search and University of Washington drug interaction database showed that the probenecid (a known UGT2B7 inhibitor) when coadministered with ZDV resulted in a maximum (~100%) increase in AUC of ZDV which is in the similar range with VA. There are no known strong and specific inhibitors of UGT2B7 marketed in the United States. When valproate was concomitantly administered with cenobamate the Cmax and AUC was not affected (see table above). Therefore, UGT2B7 inhibition may not result in significant DDIs. Effect of Alcohol The effect of alcohol on the PK of cenobamate was studied in Study YKP3089C029. The co-administration of ethanol and cenobamate did not lead to any PD interaction on CNS or PK interaction between these two products. In addition, cenobamate did not produce any clinically relevant impairment in CNS measures. Food Effect Food Effect using capsule formulation was evaluated in Study AA39450. This study was an open-label, randomized, single dose of 300 mg (3x100 mg capsules), 2-way crossover, 2-sequence comparative oral bioavailability study with a washout period of at least 21 days. The relative bioavailability of a single 300 mg dose of cenobamate using 100 mg capsules was not affected by the consumption of a high-fat high-calorie breakfast taken within 30 minutes prior to administration of cenobamate. All limits of the 90% CIs of the estimated geometric mean ratios for all of the comparisons (Cmax and AUC) fell within the 0.80 to 1.25.
Food Effect using tablet formulation was evaluated in Study YKP3089C032. The relative bioavailability of a single oral dose of 200 mg tablet strength of cenobamate was not affected by the consumption of a high-fat high-calorie breakfast taken within 30 minutes prior to administration of cenobamate. All limits of the 90% CIs of the estimated geometric mean ratios for all of the comparisons (Cmax and AUC) fell within the 0.80 to 1.25 boundaries.
Reference ID: 4488162

24
PK Parameter
(N=13)
Geometric LSM Geometric LSM Ratioa
90% CI
200 mg Fed
200 mg Fasting
Cmax (μg/mL) 4.70 5.21 0.902 0.853, 0.954
AUC0-t
(μg*h/mL) 372.8 379.5 0.982 0.952, 1.014
AUCinf
(μg*h/mL) 390.8 391.3 0.999 0.973, 1.025
3.3.5 Is the to-be-marketed formulation the same as the clinical trial formulation, and if not, are there bioequivalence data to support the to-be-marketed formulation?
The to-be-marketed (TBM) formulation will be an oral tablet of cenobamate. In early and late stage Phase 1 clinical pharmacology studies and first efficacy and safety study (Study YKP3089C013), the open-label extension of Study YKP3089C013, capsule formulation of cenobamate was used. In the second clinical study YKP3089C017 and its open-label extension, and the long-term safety study (Study YKP3089C021) TBM formulation was used. A relative BA (Study YKP3089C019) was conducted to establish PK bridge. The results of showed that the disposition of cenobamate was comparable between the 100 mg capsule and the 100 mg tablet of cenobamate bridging the early Phase 1 clinical pharmacology studies and clinical studies. Study YKP3089C032 was conducted to determine the relative bioavailability of the 50 mg or 200 mg tablet formulation in comparison to the 100 mg tablet formulation. These 3 oral tablet strengths showed to be bioequivalent.
PK Parameter
Geometric LSM Ratioa (90% CI)
100 mg Tablet (Test) versus 100 mg Capsule
(Reference)
2×50 mg Tablets (Test) versus 100 mg Tablet
(Reference)
200 mg Tablet (Test) versus 2×100 mg Tablets
(Reference)
Cmax (μg/mL) 1.02 (0.98, 1.07) 0.996 (0.93, 1.07) 1.01 (0.96, 1.06)
AUC0-t
(μg*h/mL) 0.94 (0.89, 1.00) 0.98 (0.95, 1.01) 0.98 (0.94, 1.02)
AUCinf
(μg*h/mL) 0.93(0.88, 0.99) 0.98644 (0.96, 1.02) 0.99 (0.93, 1.05)
Reference ID: 4488162

4. APPENDICES
4.1 Summary of Bioanalytical Method Validation and Performance
4.1.1 How are the active moieties identified and measured in the clinical pharmacology and biopharmaceutics studies?
A validated liquid chromatographic-tandem mass spectrometric (LC/MS/MS) bioanalytical method was used to quantify plasma concentrntions of cenobamate using phenacetin as an internal standard in human plasma.
4.1.2 What bioanalytical methods are used to assess cannabidiol concentrations? Briefly describe the methods and summarize the assay performance. Plasma cenobamate was measmed by a validated LC/MS/MS. The accmacy, precision, and other relevant parameters for the assay are described in Table below. This is sufficient to meet the requirements of the submitted studies.
Summary of Assay Validation Report
Infonnation Requested Data
Validation Summar y Validation Study ZZ01036-0l
Analyte YKP3089
Intemal Standard as) Phenacetin
Method Desc1·iption Protein precipitation with analysis/detection by LC-MS/MS
Limit of Quantitation (ue:/mL) 0.0200 1uz/mL
Average Recovery of Drug(% Mean) 110% at 0.0500 ~1g/mL 123% at 0.500 µg/mL 121% at 8.75 µg/mL
Average Recovery of IS (% Mean) 97%
Standard Curve Concentrations (~t.g/mL) 0.0200, 0.0500, 0.200, 0.500, 1.50, 5.00, 8.75, and 10.0 uQ/mL
QC Concentrations <mz/mL) LLOQ QC, 0.0600, 0.800, and 7.50 uQ/mL
QC Intra-batch Precision Range (% CV) 2 .0 to 11.4%
QC Intra-batch Accuracv Rane:e (% Bias) -7.5 to 7.5%
QC Inter -batch Precision R ange (% CV) 5.0 to 7.5%
QC Inte1·-batch Accuracy Range (% Bias) -4.5 to 2.0%
Bench-top Stability (Hrs) Sho1t -te1m Stability: 27 hours in polypropylene tubes at ambient temperature under white liizht
Stock Stability (Days) 214 days at approximately 1250 µg/mL in 50:50 methanol:water in a glass container at -20°C
Processed Stability (Hrs) Post-preparative Stability: 132 hours in a polypropylene 96 well plate at 5°C Processed Sample Integrity: 125 hours in a polypropylene 96 well plate at 5°C
Freeze-thaw Stability (Cycles) Freeze and Thaw Stability: 6 cycles in polypropylene tubes at -20°C under white liizht
25
Reference ID 4488162

Long-term Storage Stability (days) Long-term Stability: 205 days in polypropylene tubes at -20°C
Dilution Intee:i·ity up to 25 .0 Ltg/mL, diluted 5-fold
Selectivity No significant matrix effect was observed in any of the l 0 human plasma (heparin) lots that were spiked at the concentration of the LLOQ (0.0200 µg/mL) and at the concentration of the high QC (7.50 µg/mL) sample
Additional Info1·mation
Matrix (Anticoagulant) Human Plasma (Heparin)
Bioanalytic.al Method (BAM) SOP Number BAM SOP ZZ01036-01, v2
Detector AB I MDS Sciex API 4000
Assay Volume Required 0.100 mL
Regr ession Type Linear (1/concentration2)
Quantitation Method Peak Area Ratio
Co-administered Compound Evaluation Gabapentin (5.00 ~1g/mL) Levetiracetam (12.5 ~1g/mL)
Pregabalin (12.5 µg/mL)
Oualitv Control Samoles Precision (% CV) Accmacy (% Bias)
Inte1·-batch LLOQ 7.5 2 .0 Low 5.8 -4 .5 Medium 6.2 -3.5 High 5.0 -2.1
Intra-batch (Batch 15) LLOQ 5.9 0.5 Aliquot Method: Manual Low 2 .6 -7.5 Extraction Method: Automated Medium 2 .0 -2.3
High 3.6 - 1.7
Intra-batch (Batch 16) LLOQ 8.8 7.5 Aliquot Method: Manual Low 4.4 1.8 Extraction Method : Automated Medium 11.4 -5.3
High 7.5 -1.3
Intra-batch (Batch 17) LLOQ 4.9 -2.0 Aliquot Method: Manual and Low 5.7 -6.0 Automated Medium 3.9 -3.8 Extraction Method: Automated High 4.5 -3.2
Substock Solution Stability 162 days at 0.0800 µg/mL in 50:50 methanol:water in a glass container at -20°C
Internal Standard Stock Stability 159 days at approximately 1000 ~1g/mL in 50:50 methanol: water in a glass container at -20°C
Internal Standard Substock Stability 155 days at 1.00 µg/mL in 50:50 methanol: water in a glass container at -20°C
Automated Sample Aliquot Integtity/ samples aliquotted using automation at 0 .100 mL, stored in a Sample Aliquot F r ozen Stor age Integrity polypropylene 96 well plate at -20°C prior to extraction
Batch Size 192 injections
26
Reference ID 4488162

27
4.2 Population PK Analyses
The Applicant generated a population PK model to characterize the pharmacokinetics of cenobamate (YKP3089) in epilepsy patients and healthy volunteers. The objectives of these analyses were to describe the plasma concentration time profile, characterize PK variability, and identify covariates that may affect cenobamate PK. The population PK report sk-16007-pop-pk.pdf was submitted in sequence 0001 in module 5335. The Applicant proposed label statements based on the population PK model. In addition, the Applicant conducted PK simulations to compare monotherapy to adjunctive therapy with carbamazepine and adjunctive therapy with clobazam. 4.2.1 Applicant’s Population PK Model (report sk007-pop-pk.pdf) Summary of PK Data:
The analysis dataset included 8700 observations from 960 subjects over a cenobamate dose range from 5 to 750 mg (single dose) and from 50 to 600 mg/day (multiple dose). Most of the data was taken at 100 mg/day (14.2% of subjects), 200 mg/day (67.5%), and 400 mg/day (9.3%) cenobamate dose levels. These data came from 8 Phase I studies, 2 Phase II trials, and a single Phase III trial in epilepsy subjects. Information about the studies included in the Applicant’s population PK analyses is shown in the table below.
Reference ID: 4488162

28
Table 1: Description of the Clinical Studies Included in the Applicant’s PPK Analyses
Source: sequence 0001, module 5335, sk16007-pop-pk.pdf page 16 of 157
Rich PK samples were obtained from Phase 1 studies and sparse sampling was obtained from Phase 2 and Phase 2 studies.
Population PK Model
The base structural model was a 2‐compartment model, first‐order absorption, and absorption lag time. PK parameter include apparent clearance (CL/F, where F represents absolute oral bioavailability), ka, (first order absorption rate constant), apparent intercompartmental clearance (Q/F),
Reference ID: 4488162
29
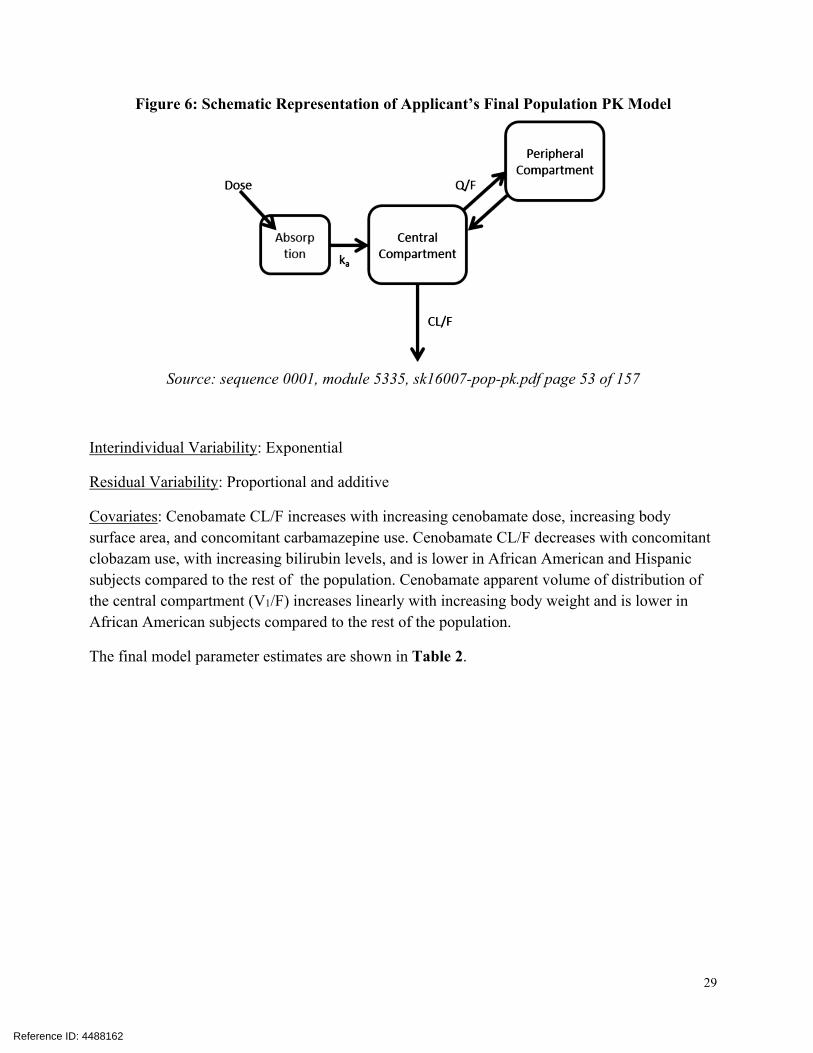
Figure 6: Schematic Representation of Applicant’s Final Population PK Model
Source: sequence 0001, module 5335, sk16007-pop-pk.pdf page 53 of 157
Interindividual Variability: Exponential
Residual Variability: Proportional and additive
Covariates: Cenobamate CL/F increases with increasing cenobamate dose, increasing body surface area, and concomitant carbamazepine use. Cenobamate CL/F decreases with concomitant clobazam use, with increasing bilirubin levels, and is lower in African American and Hispanic subjects compared to the rest of the population. Cenobamate apparent volume of distribution of the central compartment (V1/F) increases linearly with increasing body weight and is lower in African American subjects compared to the rest of the population.
The final model parameter estimates are shown in Table 2.
Reference ID: 4488162

30
Table 2: PK Parameter Estimates for Final PPK Model
Source: sequence 0001, module 5335, sk16007-pop-pk.pdf page 54 of 157
Model diagnostic are presented in the figures below.
Reference ID: 4488162

31
Figure 7: Diagnostic Plots of Observed Versus Predicted Exposure for Final Population PK Model
Source: sequence 0001, module 5335, sk16007-pop-pk.pdf page 55 and 56 of 157
Reference ID: 4488162

32
Figure 8: Diagnostic Plot of Conditional Weighted Residual Versus Time for Final Population PK Model
Source: sequence 0001, module 5335, sk16007-pop-pk.pdf page 55 and 56 of 157
[Reviewer comment: The diagnostic plots presented in Figure 7 and Figure 8 do not present systematic bias with respect to concentration value nor time.
The visual predictive check for the pooled phase 2 data (figure not shown) indicates that, overall, the model describes central tendency and variability of the phase 2 data well. Prediction is less accurate at the lowest exposures which is likely the result of being near the lower limit of quantification of the assay.
Overall, the population PK model is acceptable.]
4.2.2 Label Statements Based on PPK Modeling This section provides discussion of the label statements which are supported by population pharmacokinetic modeling. The final label language will reflect ongoing internal discussions and external discussions with the Applicant that may occur after this review is archived. The Applicant proposed the following label statements based on population PK modeling.
12.3 Pharmacokinetics
Specific Populations
Reference ID: 4488162
(b) (4)

33
[Reviewer comment: This statement is supported by the Applicant’s population PK analyses and is acceptable.]
4.2.3 Applicant’s Monotherapy PK Simulations (sk17009-monotherapy.pdf)
The Applicant conducted PK simulations to predict cenobamate PK when used in a monotherapy scenario. Report sk17009-monotherapy.pdf containing these PK simulations was submitted in sequence 0001 in module 5335.
The purpose of the PK simulations submitted in report 17009 is to provide support for monotherapy use in the label. The primary objective of the Applicant’s analysis was to assess whether cenobamate monotherapy may lead to a difference in plasma exposures which would have a relevant effect on the efficacy and/or the safety of cenobamate based on adjunctive therapy data.
The Applicant utilized the population PK model to conduct the PK simulations. The final population PK model included carbamazepine as a covariate on apparent clearance and clobazam as a covariate on apparent clearance. The Applicant simulated a monotherapy scenario (no concomitant medications utilized with cenobamate), a scenario of cenobamate with concomitant carbamazepine, and a scenario of cenobamate with concomitant clobazam. In each scenario, the Applicant simulated steady-state exposures at the maintenance dose levels of 100 mg/day, 200 mg/day, and 300 mg/day. A total of 1,000 virtual subjects were created in each simulation scenario by re-sampling individual sets of covariates from the dataset used to build the population PK model. Applicant performed 500 replicates of the PK simulations using this approach.
The Applicant initially performed the comparison of exposures between monotherapy scenario and adjunctive therapy scenarios by computing the ratio of log-transformed AUC values. On 2019/08/01, the Division sent an information request asking the Sponsor to provide, among other items, the AUC geometric mean (antilog of the mean of the logs) as well as the geometric mean ratio. These requests stemmed from the strategies presented in the Agency document “Guidance for Industry: Statistical Approaches to Establishing Bioequivalence”1.
On 2019/08/09, the Applicant responded to the information request by submitting an updated report sk17009-monotherapy.pdf in sequence 0020. The Applicant performed 1000 replicate simulations where each replicate included simulations from 1000 virtual subjects. The Applicant computed descriptive statistics across all virtual patients and across all replicates. The arithmetic mean and standard deviation for each scenario are presented in Table 3.
1 Statistical Approaches to Establishing Bioequivalence. https://www.fda.gov/regulatory‐information/search‐fda‐guidance‐documents/statistical‐approaches‐establishing‐bioequivalence. Last accessed 2019‐08‐16.
Reference ID: 4488162
(b) (4)

34
Table 3: Arithmetic Mean (SD) of Simulated Cenobamate Steady-State AUC values For Cenobamate Monotherapy, Cenobamate with Adjunctive Carbamazepine, and Cenobamate with Adjunctive Clobazam, by Cenobamate Maintenance Dose Level
AUC is expressed in units of μg*hr/mL
Source: sequence 0020, module 5335, sk17009-monotherapy.pdf, page 6 of 31.
The geometric mean, geometric mean ratio, and 90% confidence intervals are presented in Table 4.
Reference ID: 4488162

35
Table 4: Geometric Mean, Geometric Mean Ratio, and 90% Confidence Interval of Simulated Cenobamate Steady-State AUC values For Cenobamate Monotherapy Compared Against Cenobamate with Adjunctive Carbamazepine, and Cenobamate with Adjunctive Clobazam, by Cenobamate Maintenance Dose Level
AUC is expressed in units of μg*hr/mL
Source: sequence 0020, module 5335, sk17009-monotherapy.pdf, page 7 of 31.
The Applicant mentions that the 90% confidence interval is contained within the standard no-effect boundaries of 0.8 to 1.25 for carbamazepine and is slightly exceeded for clobazam (e.g. 1.3386 exceeds 1.25). The Applicant provides the following conclusions:
The decrease in cenobamate plasma exposure observed upon discontinuation of clobazam would produce a negligible decrease in efficacy.
The increase in cenobamate plasma exposure upon discontinuation of carbamazepine could confer an efficacy benefit, although the current population pharmacodynamics (PopPD) model suggests that doses of 200 or 400 mg/day are at the upper end of the dose-response curve. This expected slight increase in cenobamate plasma exposure is not likely to produce a significant effect on the safety profile of cenobamate.
Monotherapy should result in plasma exposures that have been demonstrated to be safe and effective when the drug is used as adjunctive therapy for the treatment of POS.
[Reviewer comment: The reviewer agrees with the Applicant that cenobamate monotherapy can be expected to result in exposures that have been demonstrated to be safety and effective when used as adjunctive therapy for treatment of POS. ]
Reference ID: 4488162

36
4.3 Exposure-Response Analyses
The Applicant conducted exposure-response analyses for both safety and efficacy. The exposure-response report sk16008-expo-res.pdf was submitted in sequence 0001 in module 5335.
4.3.1 Applicant’s Exposure-Efficacy Model (report sk16008-expo-res.pdf)
The Applicant generated an exposure-response model to characterize the relationship between cenobamate (YKP3089) plasma exposure and daily seizure count values in patients with epilepsy.
Summary of PK and PD Data:
The analysis data set had 104,037 seizure data records from a total of n=655 subjects. There were n=109 and n=113 subjects randomized to placebo and 200 mg/day, respectively, in Phase 2 trial c013. There were n=105, n=114, n=127, and n=70 subjects randomized to placebo, 100, 200, and 400 mg/day, respectively, in Phase 2 trial c017. Details regarding Phase 2 trial c013 and Phase 2 trial c017 can be found in Table 1. Individual predicted exposure values (Cmin, Cmax, AUC0-24h) were computed for each seizure time point using the final population PK model with dosing records and observed covariate distribution. The individual predicted exposure values were applied in the assessment of the exposure-response relationship. The response variable for these exposure-response analyses is daily partial seizure count.
Exposure-Response Model:
The final model utilized a generalized Poisson model which is parameterized in terms of a base rate (expected number of seizures occurring during a time interval) and the Poisson dispersion factor. The baseline seizure rate is modified by the North America site location as well as the treatment effect. The treatment effect on the base rate is related to plasma exposure via a power model.
The final model parameter estimates are shown in
Reference ID: 4488162

37
Table 5.
Reference ID: 4488162
APPEARS THIS WAY ON ORIGINAL

38
Table 5: Parameter Estimates for the Final Exposure-Response Model for Efficacy
Source: sequence 0001, module 5335, sk16008-expo-res.pdf page 41 of 161
The Applicant provided predictive check plots to assess the performance of the model. One such plot provided a comparison of the simulated change from placebo (CFP) in 50% responder rate (proportion of subjects with ≥ 50% reduction in baseline seizure count) across the 100, 200, and 400 mg/day arms in Phase 2 study c017 (see Figure 9).
Reference ID: 4488162

39
Figure 9: Simulated Change from Placebo in Proportion of Subjects with ≥ 50% Seizure Rate Reduction in The Maintenance Phase of Phase 2 Study c017
The y-axis represents the proportion of subjects that experience ≥ 50% seizure reduction in their respective arm compared to the placebo arm. The closed circles are the observed fractions from Phase 2 study c017. The blue line represents the model-predicted mean proportion. The shaded area represents the model-predicted 2.5th and 97.5th percentile bounds of the prediction interval.
Source: sequence 0001, module 5335, sk16008-expo-res.pdf page 60 of 161
[Reviewer comment: The predicted dose-response in Figure 9 reflects the overall trend from the observed data of increasing effectiveness with increasing dose level. The dose-response relationship presented in Figure 9 appears consistent with an Emax model. The change from placebo prediction is most accurate for the 200 mg dose level versus the 100 mg/day and 400 mg/day dose level. This may be due to there being approximately twice as many subjects randomized to the 200 mg/day dose level versus the 100 mg/day dose level and the 400 mg/day dose level. Overall, the Applicant’s exposure-response model is acceptable.]
Reference ID: 4488162

40
4.3.2 Applicant’s Exposure-Safety Model (report sk16008-expo-res.pdf)
The Applicant generated an exposure-response model to characterize the relationship between cenobamate (YKP3089) plasma exposure elevations in ALT as well as elevations in AST. The exposure-response analyses were not reviewed for the following reasons:
The Clinical team does not consider elevations in liver enzymes to be a major safety issue
There is a paucity of ALT/AST elevation events. For example, there were 7 cases of increased ALT and 6 cases of elevated AST across all subjects in all cenobamate arms (100, 200, 400 mg/day; n=442) as well as the placebo arm (n=216).
According to the Clinical review team, a major safety concern is DRESS risk. However, the paucity of DRESS occurrences (3 reported DRESS events) precludes a meaningful characterization of exposure-DRESS risk relationship. As such, the reviewer did not attempt assess the exposure-response relationship for DRESS events.
Please refer to the review from the medical officer for additional discussion regarding DRESS risk.
4.4 Reviewer’s Assessment of Titration Phase 2 Versus Proposed Titration
The Applicant proposed a titration regimen that is slower than the titration regimen that was utilized in the Phase 2 pivotal trial c017. The proposed slower titration regimen is 12.5 , 25, 50 mg once daily for each for two weeks; increase by 50 mg once daily every 2 weeks to a recommended maintenance dose of mg once daily.
The titration regimen applied in Phase 2 pivotal trial c017 is 50, 100, 150, 300, and 400 mg/day for Weeks 1, 2, 3, 4, 5 and 6.
To provide support for the proposed slower titration regimen the Applicant simulated the relationship between dose and predicted seizure frequency using the population and PK model and exposure-response model. The Applicant summarized the results in a plot which showed the predicted seizure rate as a function of the particular dose achieved throughout titration (see Figure 3 in section 3.3.2). However, this particular plot does not facilitate a comparison of the progression of therapeutic benefit over time for the proposed slower titration regimen versus the titration regimen used in Phase 2 trial c017.
The reviewer conducted independent analyses in order to illustrate the expected seizure reduction over time throughout the proposed slower titration regimen. For comparison, the reviewer utilized the titration regimen that was applied in Phase 2 trial c017.
Reference ID: 4488162
(b) (4)
(b) (4)
(b) (4)(b) (4)

41
The mean PK profiles for each titration regimen were generated for visual comparison. The mean PK profile was simulated using the Applicant’s population PK model with the typical structural parameter estimates. Covariates on PK parameters were computed using median body surface area (1.9 m2), median bilirubin level (5.13 μM), and median weight (77 kg). In addition, the PK simulations were configured with no concomitant carbamazepine use and no concomitant clobazam use. The predicted mean PK profile for the Phase 2 study c017 titration and proposed slower titration are shown in Figure 4 in section 3.3.2.
The resulting expected seizure reduction throughout each titration regimen was determined using the Applicant’s simulation of the expected seizure rate as a function of dose (see Figure 3 in section 3.3.2). The Applicant’s dose-response model was utilized by the Reviewer to determine the typical response expected for each dose level throughout titration. The resulting predicted % change from baselines seizure rate versus time throughout titration is presented in Figure 5 in section 3.3.2.
For comparison, the Reviewer generated plots of distribution of % change from baseline observed seizure rate versus time in Phase 2 trial c013 and Phase 2 trial c017 (see Figure 1 and
Figure 2 in section 3.3.2, respectively). Overall, the predicted change from baseline seizure rate generated by the reviewer is consistent with the plot of the observed change from baseline seizure rate in trial c017.
As expected, progression towards maximum therapeutic effect is slower for the slower titration proposed for the label compared to the titration applied in Phase 2. At the time that this review was archived, internal and external discussions are ongoing regarding selection of a titration regimen regarding the potential reduction in DRESS risk versus slower achievement of therapeutic response. Assuming this drug is approved, the final label will reflect subsequent ongoing internal discussions and external discussions.
4.5 Reviewer’s Assessment of Cenobamate’s Potential to Perpetrate an Interaction against Oxcarbazepine
The Applicant assessed of the effect of cenobamate on the PK of oxcarbazepine using population PK modeling. According to the current Trileptal® (oxcarbazepine) label, the pharmacological activity of Trileptal® is primarily exerted through the 10-monohydroxy metabolite (MHD) of oxcarbazepine. However, the concentration of MHD was not measured by the bioanalytical assay and thus not evaluated in the popPK analysis. The current Trileptal® label indicates that strong inducers of cytochrome P450 enzymes have been shown to decrease the plasma/serum levels of MHD. Therefore, population PK analysis for oxcarbazepine based on the parent moiety is inconclusive in terms of assessing whether cenobamate perpetrates a clinical-relevant drug interaction against oxcarbazepine. Due to the lack of MHD metabolite PK data, the reviewer investigated the potential for cenobamate to affect MHD PK. Graphical analyses were conducted to assess the effect of
Reference ID: 4488162

42
oxcarbazepine use on efficacy as expressed by % change from baselines seizure rate. Data from subjects treated with cenobamate in trials c013 and c017 were included in the analyses. The efficacy data were stratified by time period in each trial (e.g. baseline period, titration period, maintenance period, etc.) and by cenobamate dose level in trial c017. The results of these analyses are presented in Figure 10, Figure 11, Figure 12, and Figure 13. Figure 10: Percent Change From Baseline Monthly Seizure Frequency by Oxcarbazepine Use in the 200 mg Cenobamate Arm in Trial c013
Reference ID: 4488162

43
Figure 11: Percent Change From Baseline Monthly Seizure Frequency by Oxcarbazepine Use in the 100 mg Cenobamate Arm in Trial c017
Figure 12: Percent Change From Baseline Monthly Seizure Frequency by Oxcarbazepine Use in the 200 mg Cenobamate Arm in Trial c017
Reference ID: 4488162
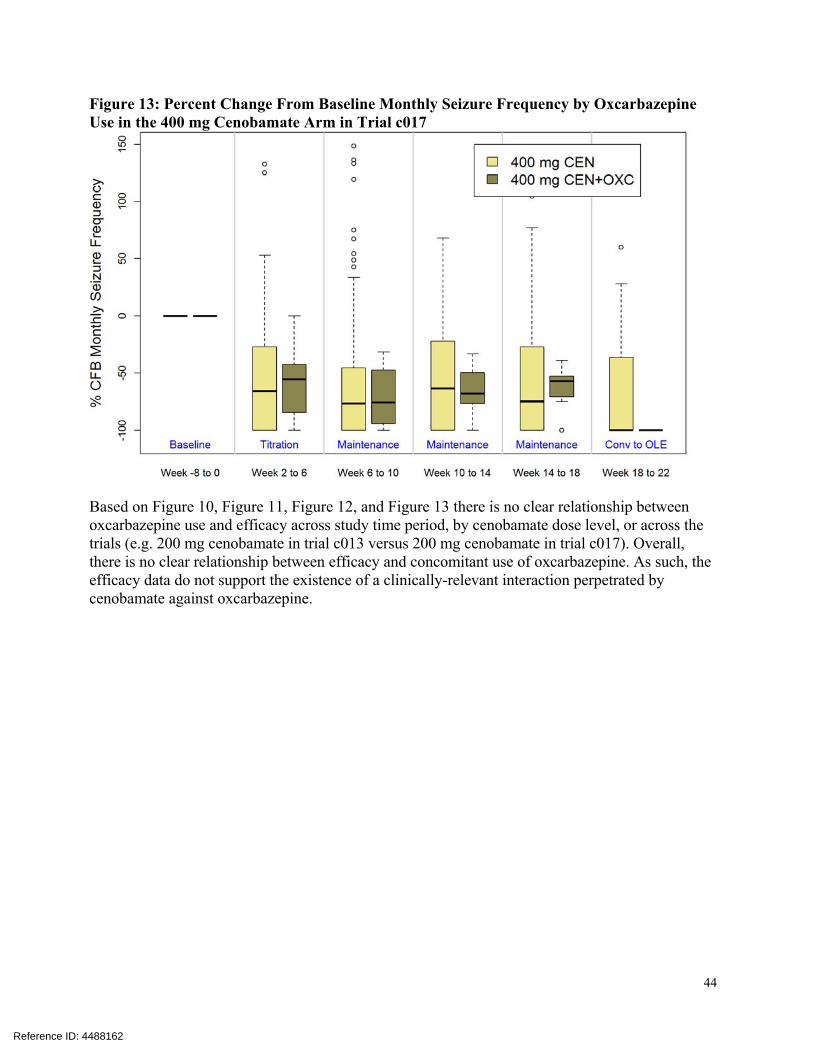
44
Figure 13: Percent Change From Baseline Monthly Seizure Frequency by Oxcarbazepine Use in the 400 mg Cenobamate Arm in Trial c017
Based on Figure 10, Figure 11, Figure 12, and Figure 13 there is no clear relationship between oxcarbazepine use and efficacy across study time period, by cenobamate dose level, or across the trials (e.g. 200 mg cenobamate in trial c013 versus 200 mg cenobamate in trial c017). Overall, there is no clear relationship between efficacy and concomitant use of oxcarbazepine. As such, the efficacy data do not support the existence of a clinically-relevant interaction perpetrated by cenobamate against oxcarbazepine.
Reference ID: 4488162

--------------------------------------------------------------------------------------------This is a representation of an electronic record that was signedelectronically. Following this are manifestations of any and allelectronic signatures for this electronic record.--------------------------------------------------------------------------------------------/s/------------------------------------------------------------
JAGAN MOHAN R PAREPALLY09/09/2019 09:36:39 AM
MICHAEL A BEWERNITZ09/09/2019 09:42:07 AM
VENKATESH A BHATTARAM09/09/2019 09:43:27 AM
YUXIN MEN09/09/2019 09:48:27 AM
MEHUL U MEHTA09/09/2019 11:56:56 AM
Signature Page 1 of 1
Reference ID: 4488162