Embed Size (px)
Citation preview

Clinical Performance Goals
2010-2011


Page 1
Clinical Performance Goals
2010-2011
Table of Contents
_____________________________________________________________________________
Table of Contents ...................................................................................................... 1 Health Care Quality Improvement Program ............................................................. 2 Clinical Performance Measures ................................................................................ 6 Chapter 1: Hemodialysis CPM Indicators ................................................................. 7
Adequacy of Dialysis .............................................................................................. 8 Anemia Management .......................................................................................... 11 Nutritional Status ................................................................................................. 14 Bone and Mineral Metabolism ............................................................................ 15 Vascular Access .................................................................................................... 17
Chapter 2: Peritoneal Dialysis CPM Indicators ....................................................... 19 Adequacy of Dialysis ............................................................................................ 20 Anemia Management .......................................................................................... 21 Nutritional Status ................................................................................................. 24 Bone and Mineral Metabolism ............................................................................ 25
Chapter 3: Other QAPI Initiatives ............................................................................ 27 Medical Injuries and Medical Errors Identification .............................................. 28 Hemodialyzer Reuse Program .............................................................................. 30 Patient Satisfaction and Grievances ..................................................................... 31 Health Outcomes: Physical and Mental Functioning and Patient Survival ........... 32 Infection Control .................................................................................................. 33
5-Diamond Patient Safety Program ........................................................................ 35 Additional Information ........................................................................................... 37
Page 2
Health Care Quality Improvement Program
_____________________________________________________________________________
The Centers for Medicare & Medicaid Services (CMS), which oversees the Medicare program, contracts with 18 ESRD Network Organizations throughout the United States. The ESRD Networks perform oversight activities to assure appropriateness of services and protection for ESRD patients. This approach has been named the ESRD Health Care Quality Improvement Program (HCQIP). The ESRD HCQIP is based on the assumption that most health care
providers need and welcome both information, and where necessary, help in applying the tools and techniques of quality management. The Network has established performance goals based on past performance, CMS thresholds and the NKF-K/DOQI Clinical Practice Guidelines. With the new Conditions for Coverage, the expectation is that facilities develop an internal Quality Assessment and Performance (QAPI) plan to promote continuous improvement.
Page 3
Health Care Quality Improvement Program
_____________________________________________________________________________
Excerpt from the Conditions for Coverage
§494.110 The dialysis facility must develop, implement, maintain, and evaluate an effective, data-driven, quality assessment and performance improvement (QAPI) program with participation by the professional members of the interdisciplinary team. The program must reflect the complexity of the dialysis facility’s organization and services (including those services provided under arrangement), and must focus on indicators related to improved health outcomes and the prevention and reduction of medical errors. The dialysis facility must maintain and demonstrate evidence of its quality improvement and performance improvement program for review by CMS.
The Measures Assessment Tool (MAT) is a reference for community-accepted standards and values for listed elements of QAPI required in the Conditions for Coverage. Facilities are expected to use the community-accepted standards and values associated with clinical outcomes as referenced on the MAT. Facilities are also expected to use the “fourth-quarter Lab Data”, CROWNWeb (when it becomes available), and Dialysis Facility Reports to determine comparison or “average” values associated with clinical outcomes.
Page 4
Health Care Quality Improvement Program
_____________________________________________________________________________
You can access the latest MAT by going to the Network websites:
www.therenalnetwork.org – click the “Conditions for Coverage” link
www.esrdnetwork4.org -- click the “Conditions (CfC)” link This Clinical Performance Goals document provides measures (based on the MAT requirements) to assess facility-level patient care processes and outcomes, and to identify opportunities for improvement. The goal of the Network is to combine efforts with renal facilities to improve performance in the delivery of quality patient care.
Page 5
Format of this Booklet
_____________________________________________________________________________
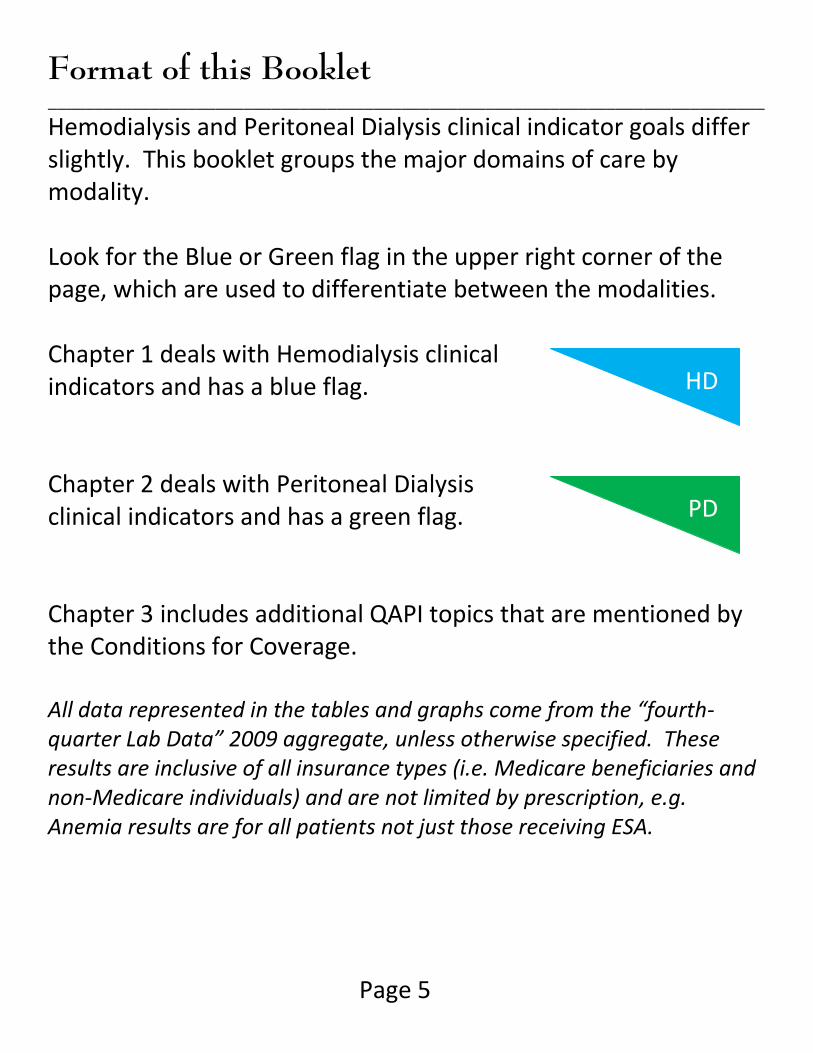
Hemodialysis and Peritoneal Dialysis clinical indicator goals differ slightly. This booklet groups the major domains of care by modality. Look for the Blue or Green flag in the upper right corner of the page, which are used to differentiate between the modalities. Chapter 1 deals with Hemodialysis clinical indicators and has a blue flag. Chapter 2 deals with Peritoneal Dialysis clinical indicators and has a green flag. Chapter 3 includes additional QAPI topics that are mentioned by the Conditions for Coverage. All data represented in the tables and graphs come from the “fourth-quarter Lab Data” 2009 aggregate, unless otherwise specified. These results are inclusive of all insurance types (i.e. Medicare beneficiaries and non-Medicare individuals) and are not limited by prescription, e.g. Anemia results are for all patients not just those receiving ESA.
HD
PD
Page 6
Clinical Performance Measures
___________________________________________________________________________
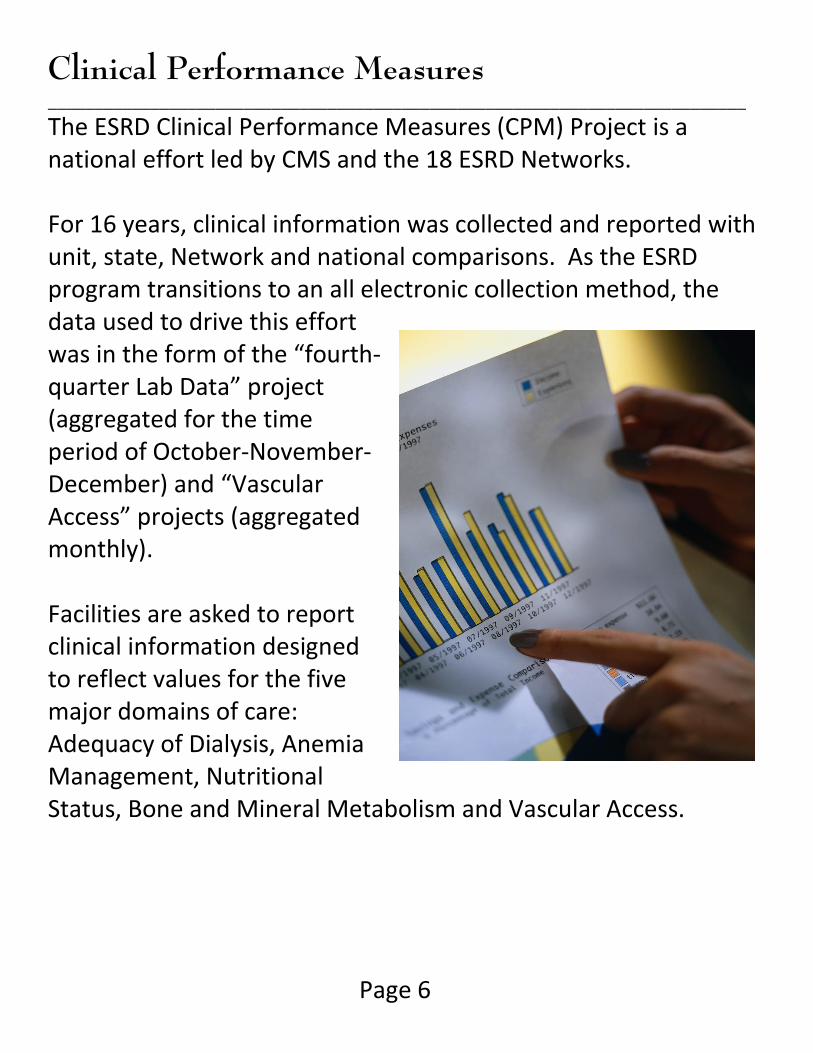
The ESRD Clinical Performance Measures (CPM) Project is a national effort led by CMS and the 18 ESRD Networks. For 16 years, clinical information was collected and reported with unit, state, Network and national comparisons. As the ESRD program transitions to an all electronic collection method, the data used to drive this effort was in the form of the “fourth-quarter Lab Data” project (aggregated for the time period of October-November-December) and “Vascular Access” projects (aggregated monthly). Facilities are asked to report clinical information designed to reflect values for the five major domains of care: Adequacy of Dialysis, Anemia Management, Nutritional Status, Bone and Mineral Metabolism and Vascular Access.

Page 7
Chapter 1: Hemodialysis CPM Indicators
___________________________________________________________________________
Topics included in this section:
Adequacy of Dialysis including Kt/V and URR Anemia Management Nutritional Status Bone & Mineral Metabolism Vascular Access

Page 8
Adequacy of Dialysis
___________________________________________________________________________
Numerous outcome studies have demonstrated a correlation between the delivered dose of hemodialysis and patient mortality and morbidity. The intent of QAPI in addressing adequacy of dialysis is to maximize the number of patients who achieve the goals for adequate dialysis, which includes both successful fluid volume management and clearance of toxins. Urea Reduction Ratio (URR)
Pre- and post-dialysis blood urea nitrogen (BUN) levels were drawn and reported to calculate URR results. The Renal Network has a goal to maintain the URR rate of 96% of patients with a URR ≥ 65%. The results provided by the 2009 Lab Data Collection project show that each of our three Networks are above the national mean with compliance to this measure; however, we are below our target.
Network Outcomes and Process Goals Each patient should be measured for adequacy every month. ≥ 96% of unit’s hemodialysis patient population (3x/week) achieve URR ≥ 65 … OR … ≥ 96% of unit’s hemodialysis patient population (3x/week) achieve Kt/V Daugirdas II ≥ 1.2
HD

Page 9
Adequacy of Dialysis
_____________________________________________________________________________
URR Data
PA DE NW4 IN KY OH NW9 IL
NW10 U.S. Our
Goal
Mean URR 73 74 73 74 73 73 73 73 ≥ 65
% Patients with mean URR ≥ 65
91.6 91.2 91.6 91.3 90.0 91.3 91.1 91.2 91.0 96.0
Compliance to the URR Measure
91.6% 91.1% 91.2% 91.0% 96.0%
0.0%
50.0%
100.0%
URR
Net 4
Net 9
Net 10
U.S.
Our Goal
HD
Page 10
Adequacy of Dialysis
___________________________________________________________________________
Kt/V
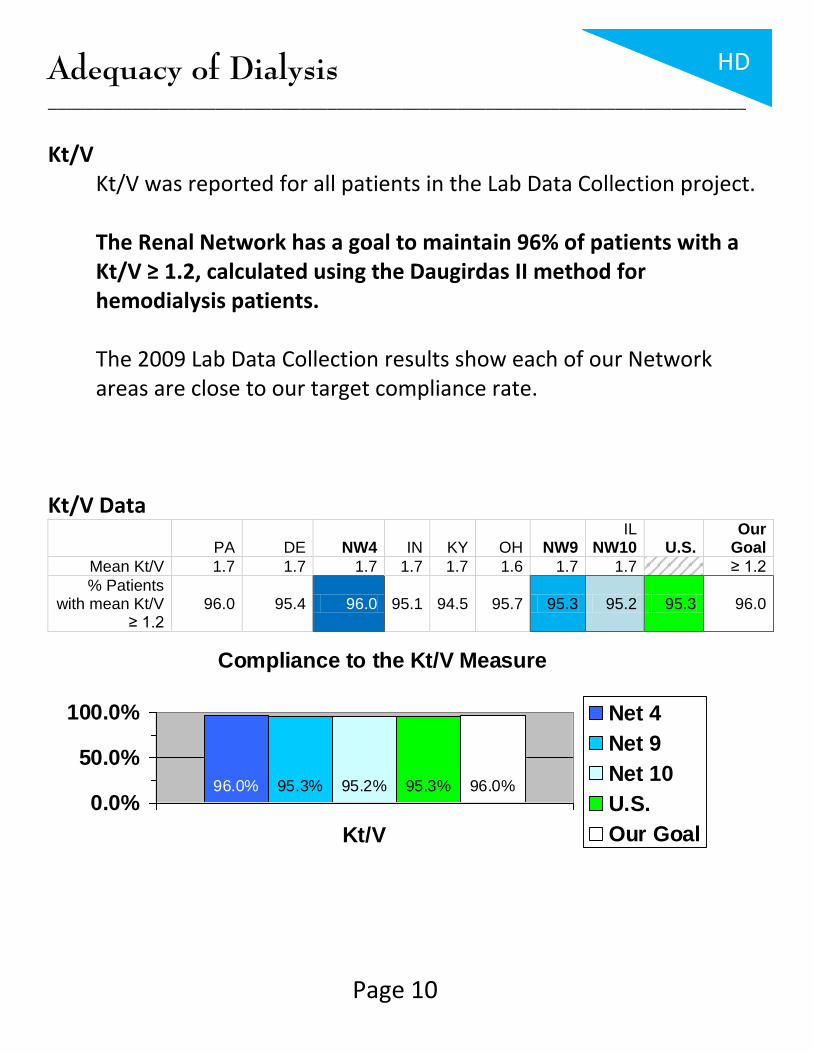
Kt/V was reported for all patients in the Lab Data Collection project. The Renal Network has a goal to maintain 96% of patients with a Kt/V ≥ 1.2, calculated using the Daugirdas II method for hemodialysis patients. The 2009 Lab Data Collection results show each of our Network areas are close to our target compliance rate.
Kt/V Data
PA DE NW4 IN KY OH NW9 IL
NW10 U.S. Our
Goal
Mean Kt/V 1.7 1.7 1.7 1.7 1.7 1.6 1.7 1.7 ≥ 1.2
% Patients with mean Kt/V
≥ 1.2 96.0 95.4 96.0 95.1 94.5 95.7 95.3 95.2 95.3 96.0
Compliance to the Kt/V Measure
96.0% 95.3% 95.2% 95.3% 96.0%
0.0%
50.0%
100.0%
Kt/V
Net 4
Net 9
Net 10
U.S.
Our Goal
HD
Page 11
Anemia Management
_____________________________________________________________________________
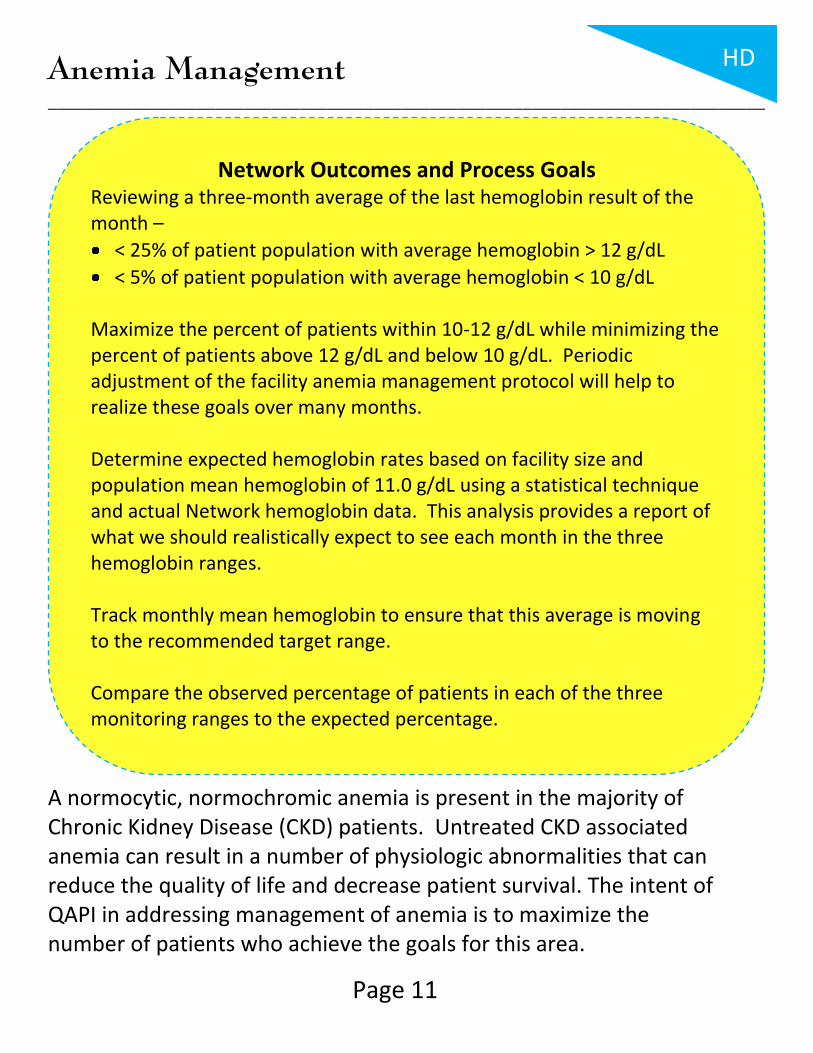
A normocytic, normochromic anemia is present in the majority of Chronic Kidney Disease (CKD) patients. Untreated CKD associated anemia can result in a number of physiologic abnormalities that can reduce the quality of life and decrease patient survival. The intent of QAPI in addressing management of anemia is to maximize the number of patients who achieve the goals for this area.
Network Outcomes and Process Goals Reviewing a three-month average of the last hemoglobin result of the month –
< 25% of patient population with average hemoglobin > 12 g/dL
< 5% of patient population with average hemoglobin < 10 g/dL Maximize the percent of patients within 10-12 g/dL while minimizing the percent of patients above 12 g/dL and below 10 g/dL. Periodic adjustment of the facility anemia management protocol will help to realize these goals over many months. Determine expected hemoglobin rates based on facility size and population mean hemoglobin of 11.0 g/dL using a statistical technique and actual Network hemoglobin data. This analysis provides a report of what we should realistically expect to see each month in the three hemoglobin ranges. Track monthly mean hemoglobin to ensure that this average is moving to the recommended target range. Compare the observed percentage of patients in each of the three monitoring ranges to the expected percentage.
HD

Page 12
Anemia Management
_____________________________________________________________________________
Hemoglobin (Hgb): CMS’s goal for dialysis units is to maintain 70% of patients with a Hgb in the range of 10-12 g/dL. The Renal Network established goals to decrease the number of patients with a Hgb > 12 and < 10 g/dL.
Hemoglobin Data (g/dL)
PA DE NW4 IN KY OH NW9 IL
NW10 U.S. Our
Goal
Mean Hgb 11.6 11.6 11.6 11.6 11.5 11.5 11.5 11.6
% Patients with mean Hgb < 10
5.9 4.7 5.8 7.0 7.1 7.6 7.3 7.1 6.2 < 5.0
% Patients with mean Hgb in 10-12
63.1 63.9 63.2 59.2 66.1 64.1 63.1 61.0 61.5 70.0
% Patients with mean Hgb > 12
30.9 31.5 30.9 33.8 26.9 28.3 29.7 31.9 32.4 < 25.0
5.8% 7.3% 7.1% 6.2% 5.0%
0.0%5.0%
10.0%15.0%
Hgb < 10
Net 4
Net 9
Net 10
U.S.
Our Goal
63.2% 63.1% 61.0% 61.5% 70.0%
0.0%
50.0%
100.0%
Hgb 10-12
Net 4
Net 9
Net 10
U.S.
Our Goal
30.9% 29.7% 31.9% 32.4% 25.0%
0.0%
20.0%
40.0%
Hgb > 12
Net 4
Net 9
Net 10
U.S.
Our Goal
HD

Page 13
Anemia Management
_____________________________________________________________________________
Iron Studies: Iron deficiency is an additional factor that may contribute to CKD-associated anemia, since Iron is critical for hemoglobin synthesis. The Renal Network does not have an established goal for these assays; however, it is recommended to increase the number of patients with a Ferritin level ≥ 200 ng and ≤ 800 ng (HD patients), and increase the number of patients who achieve a TSAT ≥ 20% and ≤ 50%. Ferritin Data (ng)
PA DE NW4 IN KY OH NW9 IL
NW10 U.S.
Mean Ferritin 616.6 767.3 628.6 664.8 643.9 623.1 638.2 683.8 % Patients with
mean Ferritin within range
63.8 50.8 62.7 59.8 60.0 67.1 63.9 60.6 60.8
TSAT Data
PA DE NW4 IN KY OH NW9 IL
NW10 U.S.
Mean TSAT 29.2 28.9 29.1 29.2 29.7 29.1 29.2 29.5 % Patients with
mean TSAT within range
83.6 85.6 83.7 84.0 84.4 82.6 83.3 85.8 85.2
If your facility uses a standardized anemia management guideline or algorithm, an evaluation of the efficacy of this tool is needed if facility QAPI goals for anemia management are not achieved over consecutive evaluation periods.
HD
Page 14
Nutritional Status
_____________________________________________________________________________
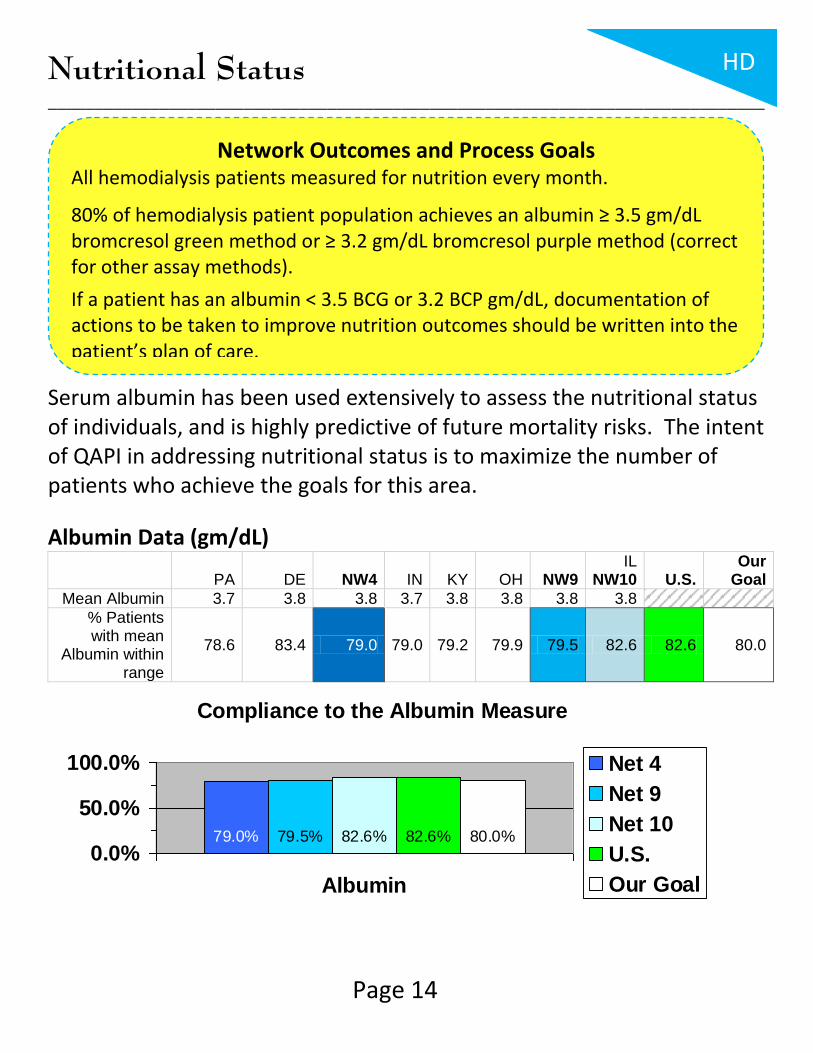
Serum albumin has been used extensively to assess the nutritional status of individuals, and is highly predictive of future mortality risks. The intent of QAPI in addressing nutritional status is to maximize the number of patients who achieve the goals for this area.
Albumin Data (gm/dL)
PA DE NW4 IN KY OH NW9 IL
NW10 U.S. Our
Goal
Mean Albumin 3.7 3.8 3.8 3.7 3.8 3.8 3.8 3.8
% Patients with mean
Albumin within range
78.6 83.4 79.0 79.0 79.2 79.9 79.5 82.6 82.6 80.0
Compliance to the Albumin Measure
79.0% 79.5% 82.6% 82.6% 80.0%
0.0%
50.0%
100.0%
Albumin
Net 4
Net 9
Net 10
U.S.
Our Goal
Network Outcomes and Process Goals All hemodialysis patients measured for nutrition every month.
80% of hemodialysis patient population achieves an albumin ≥ 3.5 gm/dL bromcresol green method or ≥ 3.2 gm/dL bromcresol purple method (correct for other assay methods).
If a patient has an albumin < 3.5 BCG or 3.2 BCP gm/dL, documentation of actions to be taken to improve nutrition outcomes should be written into the patient’s plan of care.
HD

Page 15
Bone and Mineral Metabolism
_____________________________________________________________________________
Disorders of mineral metabolism with CKD have been associated with a high mortality rate. Regulation of calcium and phosphorous levels are essential components of the management of bone and mineral disorders. The intent of QAPI in addressing management of CKD mineral and bone disorder is to maximize the number of patients who achieve the goals for this area. Dialysis facilities should strive to maintain Calcium levels to avoid hypercalcemia. Phosphorus levels should be maintained at a level ≤ 5.5 mg/dL. Calcium Data (mg/dL)
PA DE NW4 IN KY OH NW9 IL
NW10 U.S.
Mean Calcium 9.0 9.0 9.0 9.0 9.0 9.0 9.0 9.1
% Patients with mean Calcium
8.4-10.2 mg/dL 83.2 83.5 83.2 81.6 81.9 82.9 82.4 83.0 82.9
Phosphorus Data (mg/dL)
PA DE NW4 IN KY OH NW9 IL
NW10 U.S. Our
Goal
Mean Phos 5.2 5.3 5.2 5.3 5.5 5.3 5.4 5.3
% Patients with mean
Phos 3.5-5.5 mg/dL
57.2 54.5 57.0 54.2 51.1 54.6 53.9 54.0 54.1 60.0
Network Outcomes and Process Goals Reviewing a three-month average of the last serum phosphorus level of the month, 60% of hemodialysis patient population will have a serum phosphorus ≤ 5.5 gm/dL. Review other recommendations from the NKF-K/DOQI Clinical Practice Guidelines for Bone Metabolism and Disease in Chronic Kidney Disease.
HD

Page 16
Bone and Mineral Metabolism
_____________________________________________________________________________
Compliance to the Calcium Measure
83.2% 82.4% 83.0% 82.9%
0.0%
50.0%
100.0%
Calcium
Net 4
Net 9
Net 10
U.S.
Compliance to the Phosphorus Measure
57.0% 53.9% 54.0% 54.1% 60.0%
0.0%
50.0%
100.0%
Phosphorus
Net 4
Net 9
Net 10
U.S.
Our Goal
HD

Page 17
Vascular Access
_____________________________________________________________________________
An ideal vascular access delivers a flow rate adequate for the dialysis prescription, has a long use-life and minimal complications. Studies demonstrate that the native AV fistula comes closest to achieving these optimum outcomes. Access morbidity may be significantly reduced with the use of native AV fistula. The intent of QAPI in addressing vascular access is first, to improve the rate of use and preservation of fistulas; second, to decrease the inappropriate use of catheters; and finally, to improve the care provided for all types of vascular access. The CMS and the Network goal is to achieve a fistula rate of 66% in the prevalent in-center hemodialysis patient population. Dialysis facilities also need to develop a catheter reduction plan and to adopt strategies for improved access management practices with timely interventions. The Network & CMS follow the NKF-K/DOQI catheter guideline: Less than 10% of the adult hemodialysis population should
be maintained on catheters 90 days or longer.
Network Outcomes and Process Goals ≥ 66% prevalent fistula use rate ≤ 10% catheter only in use for ≥ 90 days
HD

Page 18
Vascular Access
_____________________________________________________________________________
Vascular Access Data – Prevalent Fistula Use Rates – March 2010
PA DE NW4 IN KY OH NW9 IL
NW10 U.S. Our
Goal
% Patients 53.3 63.5 54.1 47.9 57.9 50.5 51.1 54.1 55.2 ≥ 66%
Vascular Access Data – Long Term Catheter Use Rates – March 2010
PA DE NW4 IN KY OH NW9 IL
NW10 U.S. Our
Goal
% Patients 12.4 9.6 12.2 12.5 7.2 11.0 10.2 11.5 10.8 ≤ 10%
How is Your Facility Monitoring Venous Stenosis? According to the NKF-K/DOQI Guidelines, every dialysis facility should be monitoring vascular accesses for venous stenosis monthly. Early intervention can extend the life of an access, especially if stenosis can be identified before the access completely fails. There are several methods of monitoring for venous stenosis:
Physical Assessment Duplex Ultrasound Intra-Access Flow Urea Recirculation Static Venous Pressures Unexplained decrease in URR
HD

Page 19
Chapter 2: Peritoneal Dialysis CPM Indicators
Topics included in this section:
Adequacy of Dialysis Anemia Management Nutritional Status Bone & Mineral Metabolism

Page 20
Adequacy of Dialysis
___________________________________________________________________________
Kt/V The Renal Network’s goal is to maintain 85% of patients with a Kt/V ≥ 1.7. The results provided by the 2009 Lab Data Collection project show that each of our three Networks are above our target; however, we are below the national compliance rate.
Kt/V Data
PA DE NW4 IN KY OH NW9 IL
NW10 U.S. Our
Goal
Mean Kt/V 2.3 2.3 2.3 2.3 2.3 2.3 2.3 2.3 ≥ 1.7
% Patients with mean Kt/V
≥ 1.7 88.0 90.9 88.3 88.5 86.1 86.1 86.9 87.9 88.7 85.0
Compliance to the Kt/V Measure
88.3% 86.9% 87.9% 88.7% 85.0%
0.0%
50.0%
100.0%
Kt/V
Net 4
Net 9
Net 10
U.S.
Our Goal
Network Outcomes and Process Goals Each patient should be measured for adequacy every 4 months. ≥ 85% of unit’s peritoneal dialysis patient population achieve a weekly Kt/Vurea ≥ 1.7.
PD

Page 21
Anemia Management
_____________________________________________________________________________
A normocytic, normochromic anemia is present in the majority of Chronic Kidney Disease (CKD) patients. Untreated CKD associated anemia can result in a number of physiologic abnormalities that can reduce the quality of life and decrease patient survival. The intent of QAPI in addressing management of anemia is to maximize the number of patients who achieve the goals for this area.
Network Outcomes and Process Goals Reviewing a three-month average of the last hemoglobin result of the month –
< 25% of patient population with average hemoglobin > 12 g/dL
< 5% of patient population with average hemoglobin < 10 g/dL Maximize the percent of patients within 10-12 g/dL while minimizing the percent of patients above 12 g/dL and below 10 g/dL. Periodic adjustment of the facility anemia management protocol will help to realize these goals over many months. Determine expected hemoglobin rates based on facility size and population mean hemoglobin of 11.0 g/dL using a statistical technique and actual Network hemoglobin data. This analysis provides a report of what we should realistically expect to see each month in the three hemoglobin ranges. Track monthly mean hemoglobin to ensure that this average is moving to the recommended target range. Compare the observed percentage of patients in each of the three monitoring ranges to the expected percentage.
PD

Page 22
Anemia Management
_____________________________________________________________________________
Hemoglobin (Hgb): CMS’s goal for dialysis units is to maintain 70% of patients with a Hgb in the range of 10-12 g/dL. The Renal Network established goals to decrease the number of patients with a Hgb > 12 and < 10 g/dL.
Hemoglobin Data (g/dL)
PA DE NW4 IN KY OH NW9 IL
NW10 U.S. Our
Goal
Mean Hgb 11.5 11.7 11.5 11.6 11.6 11.5 11.6 11.4
% Patients with mean Hgb < 10
12.1 11.1 12.0 8.3 8.0 10.7 9.5 12.6 10 < 5.0
% Patients with mean Hgb in 10-12
56.9 47.6 56.3 57.9 57.4 57.5 57.7 57.4 56.9 70.0
% Patients with mean Hgb > 12
31.0 41.3 31.6 33.8 34.7 31.8 32.7 30.0 33.1 < 25.0
12.0% 9.5% 12.6% 10.0% 5.0%
0.0%5.0%
10.0%15.0%
Hgb < 10
Net 4
Net 9
Net 10
U.S.
Our Goal
56.3% 57.7% 57.4% 56.9% 70.0%
0.0%
50.0%
100.0%
Hgb 10-12
Net 4
Net 9
Net 10
U.S.
Our Goal
31.6% 32.7% 30.0% 33.1% 25.0%
0.0%
20.0%
40.0%
Hgb > 12
Net 4
Net 9
Net 10
U.S.
Our Goal
PD

Page 23
Anemia Management
_____________________________________________________________________________
Iron Studies: Iron deficiency is an additional factor that may contribute to CKD-associated anemia, since Iron is critical for hemoglobin synthesis. The Renal Network does not have an established goal for these assays; however, it is recommended to increase the number of patients with a Ferritin level ≥ 100 ng and ≤ 800 ng (PD patients), and increase the number of patients who achieve a TSAT > 20% and ≤ 50%. Ferritin Data (ng)
PA DE NW4 IN KY OH NW9 IL
NW10 U.S.
Mean Ferritin 457.8 478.1 459.1 511.5 499.5 476.1 490.8 511.8 % Patients with
mean Ferritin within range
57.2 54.2 57.0 60.5 59.3 57.6 58.9 57.4 57.4
TSAT Data
PA DE NW4 IN KY OH NW9 IL
NW10 U.S.
Mean TSAT 30.6 32.0 30.7 31.5 30.4 29.8 30.4 30.6 % Patients with
mean TSAT within range
84.7 90.5 85.2 88.2 84.1 85.3 86.0 84.7 87.6
If your facility uses a standardized anemia management guideline or algorithm, an evaluation of the efficacy of this tool is needed if facility QAPI goals for anemia management are not achieved over consecutive evaluation periods.
PD

Page 24
Nutritional Status
_____________________________________________________________________________
Serum albumin has been used extensively to assess the nutritional status of individuals, and is highly predictive of future mortality risks. The intent of QAPI in addressing nutritional status is to maximize the number of patients who achieve the goals for this area.
Albumin Data (gm/dL)
PA DE NW4 IN KY OH NW9 IL
NW10 U.S. Our
Goal
Mean Albumin 3.5 3.6 3.5 3.5 3.5 3.5 3.5 3.5
% Patients with mean
Albumin within range
57.9 66.7 58.4 61.3 55.1 59.3 59.2 56.7 61.4 60.0
Compliance to the Albumin Measure
58.4% 59.2% 56.7% 61.4% 60.0%
0.0%
50.0%
100.0%
Albumin
Net 4
Net 9
Net 10
U.S.
Our Goal
Network Outcomes and Process Goals All peritoneal dialysis patients measured for nutrition every month of PD clinic visit.
60% of peritoneal dialysis patient population achieves an albumin ≥ 3.5 gm/dL bromcresol green method or ≥ 3.2 gm/dL bromcresol purple method (correct for other assay methods).
If a patient has an albumin < 3.5 BCG or 3.2 BCP gm/dL, documentation of actions to be taken to improve nutrition outcomes should be written into the patient’s plan of care.
PD

Page 25
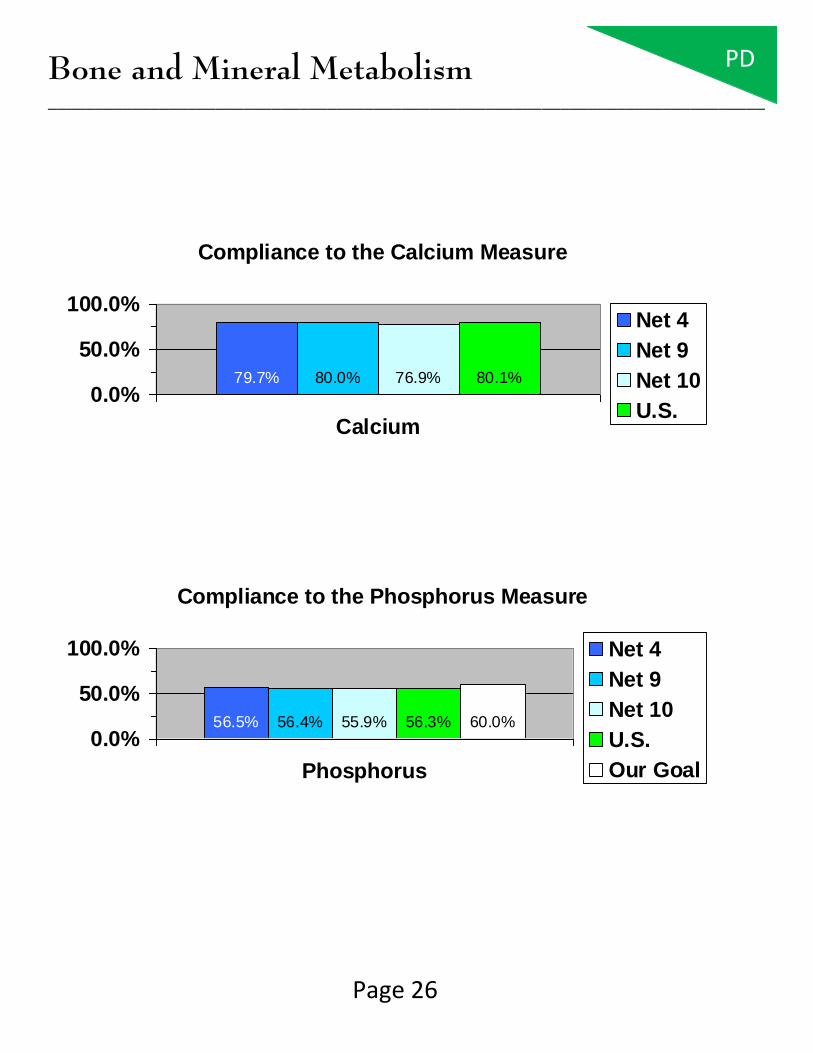
Bone and Mineral Metabolism
_____________________________________________________________________________
Disorders of mineral metabolism with CKD have been associated with a high mortality rate. Regulation of calcium and phosphorous levels are essential components of the management of bone and mineral disorders. The intent of QAPI in addressing management of CKD mineral and bone disorder is to maximize the number of patients who achieve the goals for this area. Dialysis facilities should strive to maintain Calcium levels to avoid hypercalcemia. Phosphorus levels should be maintained at a level ≤ 5.5 mg/dL. Calcium Data (mg/dL)
PA DE NW4 IN KY OH NW9 IL
NW10 U.S.
Mean Calcium 9.0 8.9 9.0 9.0 9.0 9.0 9.0 9.0
% Patients with mean Calcium
8.4-10.2 mg/dL 80.2 73.0 79.7 80.3 80.7 79.5 80.0 76.9 80.1
Phosphorus Data (mg/dL)
PA DE NW4 IN KY OH NW9 IL
NW10 U.S. Our
Goal
Mean Phos 5.3 5.3 5.3 5.1 5.2 5.2 5.2 5.3
% Patients with mean
Phos 3.5-5.5 mg/dL
56.4 58.7 56.5 57.7 59.1 54.9 56.4 55.9 56.3 60.0
Network Outcomes and Process Goals Reviewing a three-month average of the last serum phosphorus level of the month, 60% of peritoneal dialysis patient population will have a serum phosphorus ≤ 5.5 gm/dL. Review other recommendations from the NKF-K/DOQI Clinical Practice Guidelines for Bone Metabolism and Disease in Chronic Kidney Disease.
PD
Page 26
Bone and Mineral Metabolism
_____________________________________________________________________________
Compliance to the Calcium Measure
79.7% 80.0% 76.9% 80.1%
0.0%
50.0%
100.0%
Calcium
Net 4
Net 9
Net 10
U.S.
Compliance to the Phosphorus Measure
56.5% 56.4% 55.9% 56.3% 60.0%
0.0%
50.0%
100.0%
Phosphorus
Net 4
Net 9
Net 10
U.S.
Our Goal
PD

Page 27
Chapter 3: Other QAPI Initiatives
Topics included in this section:
Medical Injuries and Medical Errors Identification Hemodialysis Reuse Program Patient Satisfaction and Grievances Health Outcomes: Physical and Mental Functioning and Patient Survival Infection Control
Page 28
Medical Injuries and Medical Errors Identification
_____________________________________________________________________________
The intent of QAPI in addressing medical injuries and identification of medical errors is to minimize the number of occurrences and limit the number of patients and staff who are adversely affected by such occurrences.
The facility must compile events and the QAPI team must review reports and complaints related to any patient or staff injuries, and treatment or medication errors. The Renal Network invites you to participate in the 5-Diamond Patient Safety Program. There are currently 12 topics under this program, two of which may be used in this area: “Sharps Safety” and “Slips, Trips and Falls”. Visit our URL for more information: http://www.therenalnetwork.org/5Diamond/5Diamond.php Turn to Page 35 for more information on the 5-Diamond Patient Safety Program.

Page 29
Medical Injuries and Medical Errors Identification
_____________________________________________________________________________
Part of the QAPI activity is to trend any injuries or errors to identify the prevalence of occurrences, commonalities, and causes. Examples include but are not limited to:
Patient falls
Treatment prescription errors
Medication error or omission
Equipment related injury
Intradialytic morbidities
Intradialytic events as seizures, chest pain, hypotension or cardiac arrest
Deaths
Acute allergic-type reactions
Blood loss >100 ml
Patient transfer to a hospital emergency room
Staff needle sticks
Page 30
Hemodialyzer Reuse Program
_____________________________________________________________________________
If a facility has a dialyzer reuse program, it must be compliant with the quality assurance requirements specific to reuse, located in the Conditions for Coverage, V300-V368. These requirements outline periodic reuse process and practice audits which must be conducted and documented to ensure that the reuse program remains safe and effective. Any adverse outcomes or patient complaints related to dialyzer reuse must be properly investigated. Reuse audits must be performed on the required schedule and reported in the QAPI activities. For many of the audits, there is a two-tier system of review required: the review of the process by the person assigned (i.e. reprocessing by the reuse technician), and oversight of that review by another person qualified to do so (i.e. the technical supervisor observing the reuse technician performing reprocessing).

Page 31
Patient Satisfaction and Grievances
_____________________________________________________________________________
The intent of QAPI in this area is to use patient satisfaction surveys and patient grievance investigations as a means to identify opportunities to improve care.
Report and analyze complaints and grievances for trends
Conduct satisfaction surveys annually
Develop resolutions Facilities must monitor and track patient grievance reports and outcomes as required in the Conditions for Coverage V765.

Page 32
Health Outcomes: Physical and Mental
Functioning and Patient Survival
_____________________________________________________________________________
The program must include, but not be limited to, an ongoing program that achieves measurable improvement in health outcomes and patient survival.
NKF-K/DOQI 36 Quality of Life (QOL) or similar survey recommended annually
CMS and Network recommends a facility Standard Mortality Ratio (SMR ) < 1.0. Facilities are expected to use Dialysis Facility Reports to determine comparison or “average” values associated with clinical outcomes.

Page 33
Infection Control
_____________________________________________________________________________
The intent of QAPI in addressing infection control is to minimize the number of patients and staff who are exposed to or acquire infectious diseases at the facility. This requires facilities to:
(A) Analyze and document the incidence of infection to identify trends and establish baseline information on infection incidence;
(B) Develop recommendations and action plans to minimize
infection transmission, and promote immunization; and
(C) Take actions to reduce future incidents.

Page 34
Infection Control
_____________________________________________________________________________
CMS and the Network recommend that surveillance information is available for review, and should include, but not be limited to:
Patients’ vaccination status (Hepatitis B, pneumococcal pneumonia, and influenza vaccines)
Viral hepatitis serologies and seroconversions for HBV (and HCV and ALT, if known)
Bacteremia episodes
Pyrogenic reactions
Vascular access infections and vascular access loss due to infection
Page 35
5-Diamond Patient Safety Program
_____________________________________________________________________________
The Renal Network, Inc. believes it is important for each dialysis facility to incorporate patient safety into their organizational culture. To help promote patient safety values, TRN is implementing the 5-Diamond Patient Safety Program. The goal of this program is to help dialysis facilities better implement patient safety principles among both staff and patients. This interactive program is designed so that each dialysis facility that completes a module and submits documentation is awarded a diamond. Many of these modules can be integrated into your QAPI efforts.

Page 36
5-Diamond Patient Safety Program
_____________________________________________________________________________
Current 5-Diamond Patient Safety modules include:
Patient Safety Principles* Decreasing Patient & Provider Conflict Emergency Preparedness Flu Vaccination Hand Hygiene (Infection Control) Health Literacy Medication Reconciliation Missed Treatments Patient Self-Managed Care Sharps Safety Slips, Trips, & Falls Stenosis Surveillance
* Required Module For more information and to register for this program, visit our 5-Diamond Patient Safety website: http://www.therenalnetwork.org/5Diamond/5Diamond.php

Page 37
Additional Information
_____________________________________________________________________________
If a facility has areas of QAPI that do not meet target levels (per MAT) or areas where the facility performance is below average (per data reports), the facility is expected to take action toward improving those outcomes. The important aspects of the QAPI program are appropriately monitoring data/information; prioritizing areas for improvement; determining potential root causes; and developing, implementing, evaluating, and revising plans that result in improvements in care. Records of QAPI activities including minutes or another method of demonstrating this analysis and action must be available for review. Additional resources can be located on the Network websites at:
www.therenalnetwork.org *click on the “Conditions for Coverage” link+
Or
www.esrdnetwork4.org
[click on the “Conditions (CfC)” link]

Page 38
Additional Information
_____________________________________________________________________________
Contact your regional Network office if you have any questions. ESRD Network 4 (Serving Pennsylvania and Delaware)
40 24th Street, Suite 410 Pittsburgh, PA 15222 Phone: 412.325.2250 Fax: 412.325.1811
ESRD Networks 9 & 10 (Serving Indiana, Kentucky, Ohio and Illinois)
911 East 86th Street, Suite 202 Indianapolis, IN 46240 Phone: 317.257.8265 Fax: 317.257.8291
This publication was published and distributed under Contract Numbers HHSM-500-2006-NW004C, HHSM-500-2006-NW009C and HHSM-500-2006-NW010C with the Centers for Medicare & Medicaid Services (CMS). The contents presented do not necessarily reflect CMS policy. The Renal Network, Inc. Publication Number: CPG-2010-2011