Embed Size (px)
Citation preview
Speech and Language Goals in Clinical Settings for Young Children who are
Deaf/Hard of Hearing
Laura Smith
Susan Wiley
Jareen Meinzen-Derr
Sandra Grether
Funded by HRSA R40MC2153
EHDI Conference
April 2014
Laura Smith, MPH, Susan Wiley, MD & Sandra Grether, PhDCincinnati Children’s Hospital Medical Center
Disclosure:
• Neither we nor any member of our immediate family has a financial relationship or interest (currently or within the past 12 months) with any entity producing, marketing, re-selling, or distributing health care goods or services consumed by, or used on, patients.
• We do not intend to discuss an unapproved/investigative use of a commercial product/device.
Learning Objectives
• Describe the language needs in young children who are Deaf/hard of hearing (Deaf/HH)
• Recognize the importance of including pragmatic/social skills goals for children receiving speech/pathology services.
Background
• Despite advances in early identification and intervention, our understanding of functional communication skills in children who are deaf/hard of hearing (deaf/HH) is limited.
• Furthermore, our understanding of how speech and language goals for these children link to functional communication outcomes is also limited.
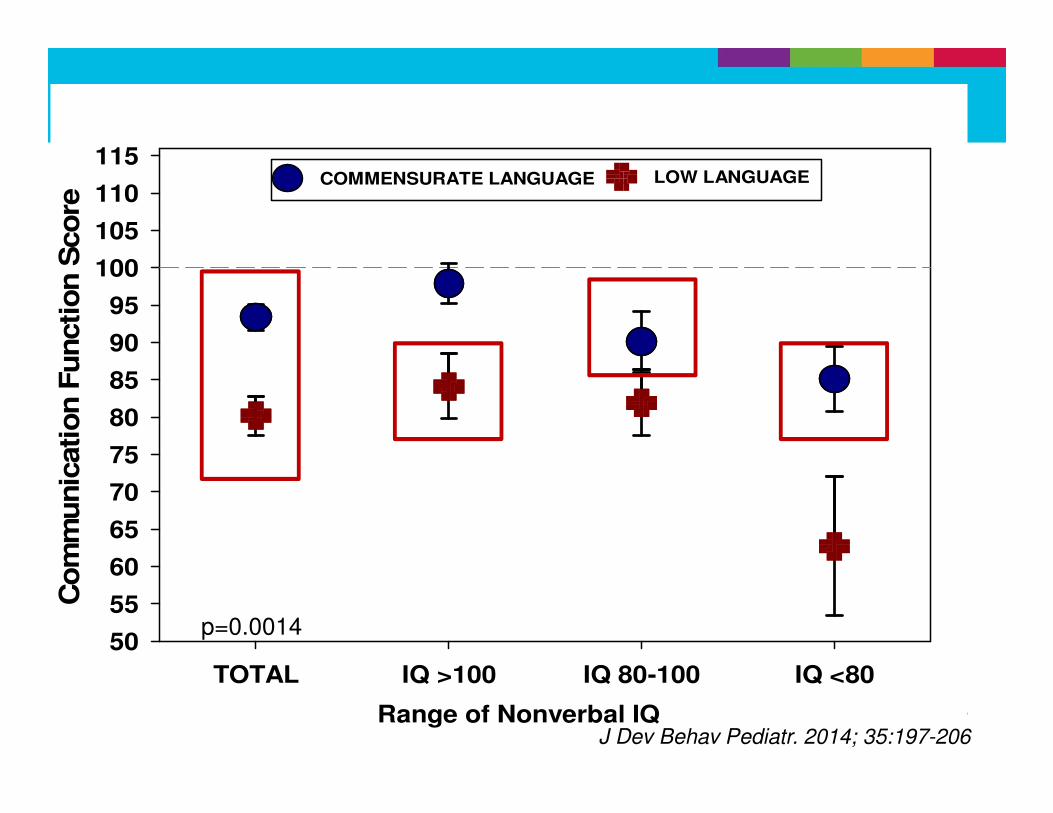
Range of Nonverbal IQ
TOTAL IQ >100 IQ 80-100 IQ <80
Co
mm
unic
ati
on
Fu
ncti
on
Sco
re
50
55
60
65
70
75
80
85
90
95
100
105
110
115LOW LANGUAGECOMMENSURATE LANGUAGE
p=0.0014
J Dev Behav Pediatr. 2014; 35:197-206
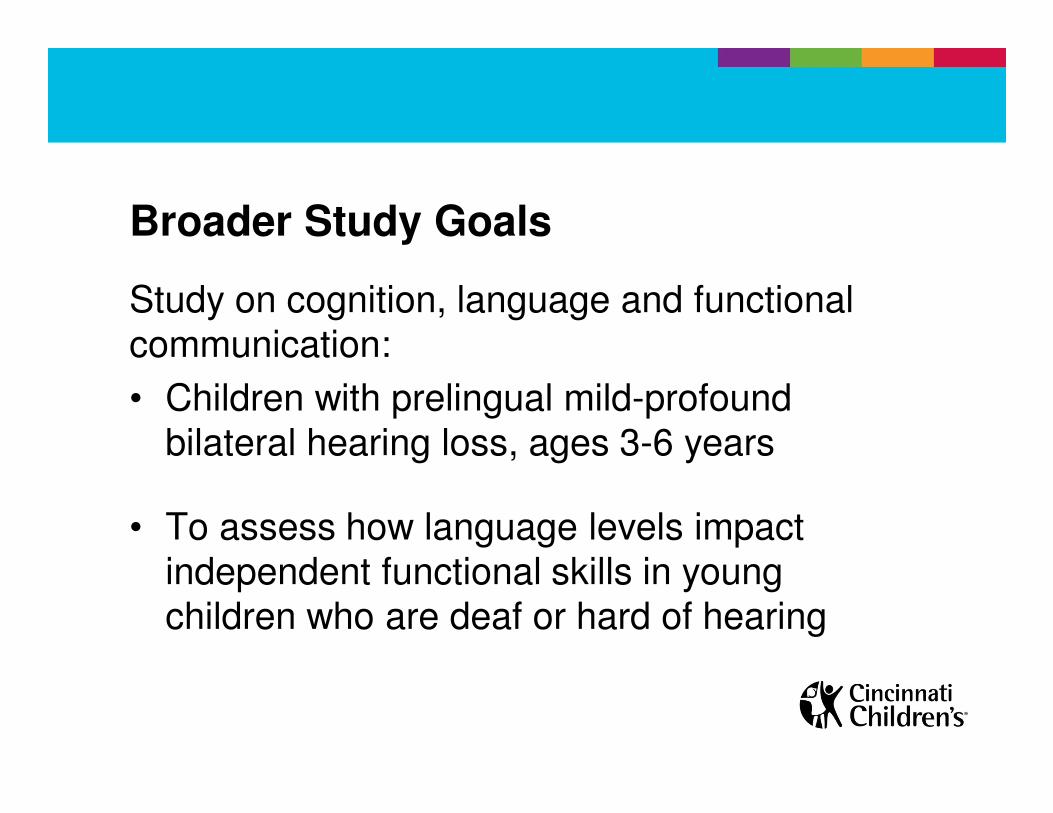
Broader Study Goals
Study on cognition, language and functional communication:
• Children with prelingual mild-profound bilateral hearing loss, ages 3-6 years
• To assess how language levels impact independent functional skills in young children who are deaf or hard of hearing
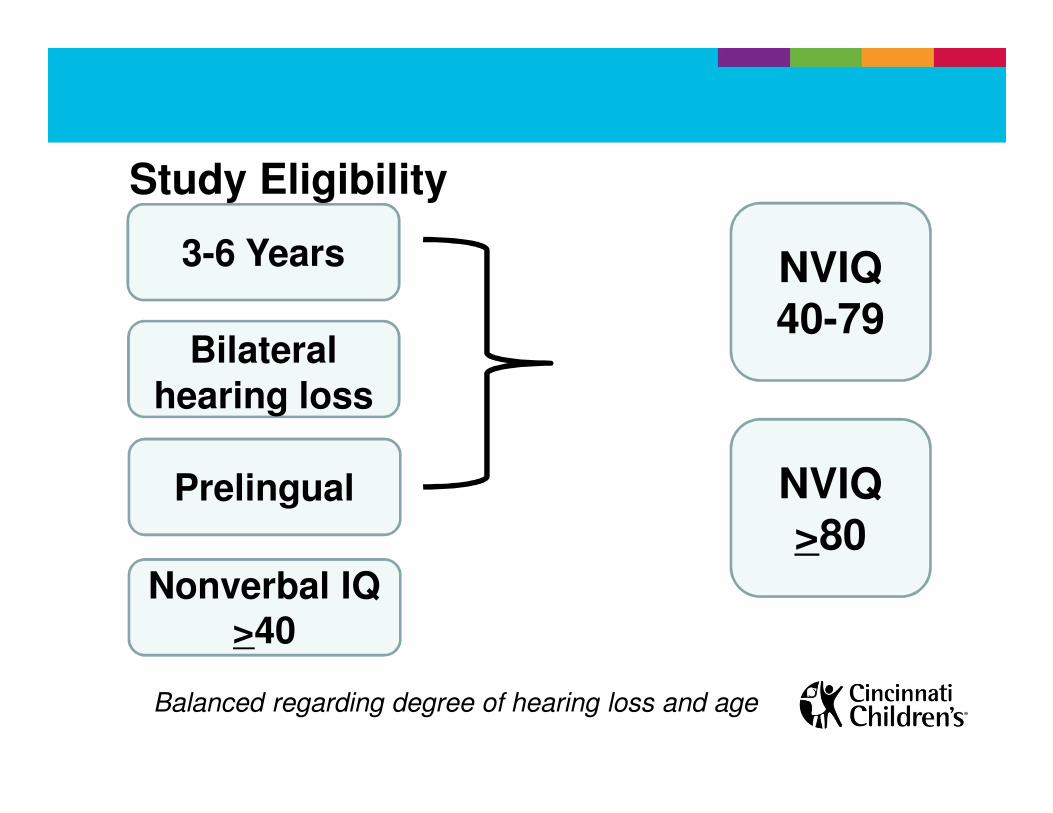
Study Eligibility
Balanced regarding degree of hearing loss and age
3-6 Years
Bilateral
hearing loss
Prelingual
Nonverbal IQ >40
NVIQ40-79
NVIQ>80
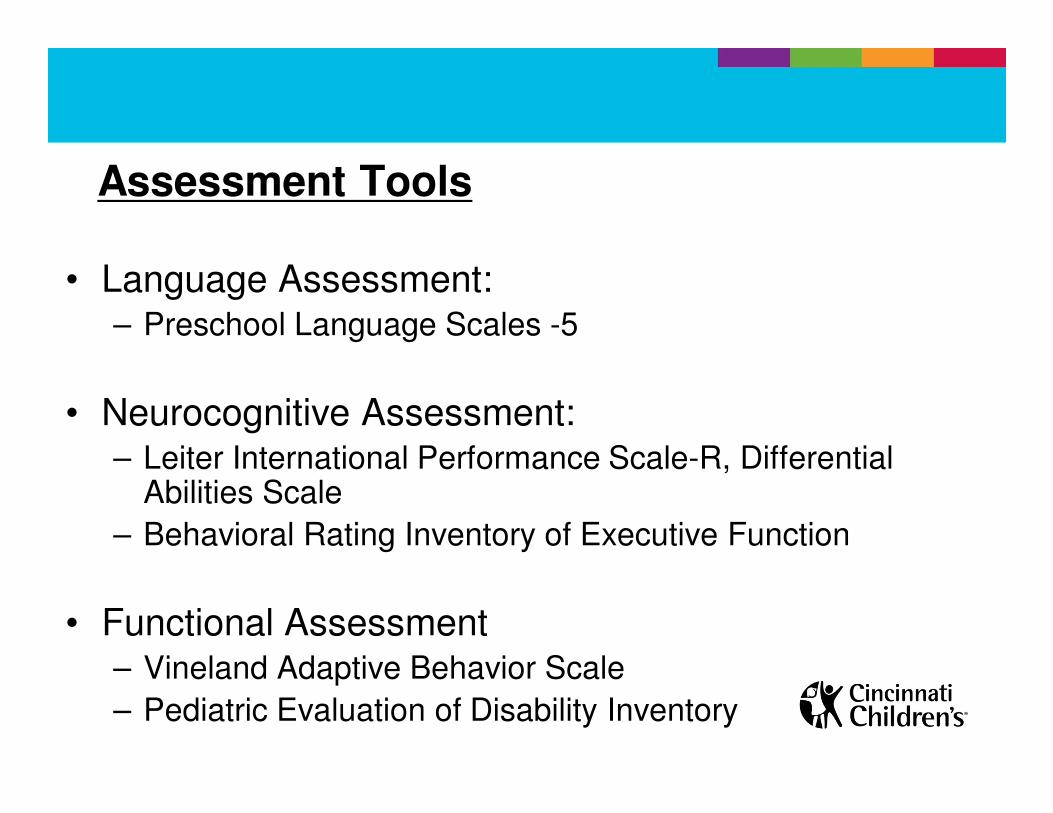
Assessment Tools
• Language Assessment:– Preschool Language Scales -5
• Neurocognitive Assessment: – Leiter International Performance Scale-R, Differential
Abilities Scale
– Behavioral Rating Inventory of Executive Function
• Functional Assessment– Vineland Adaptive Behavior Scale
– Pediatric Evaluation of Disability Inventory
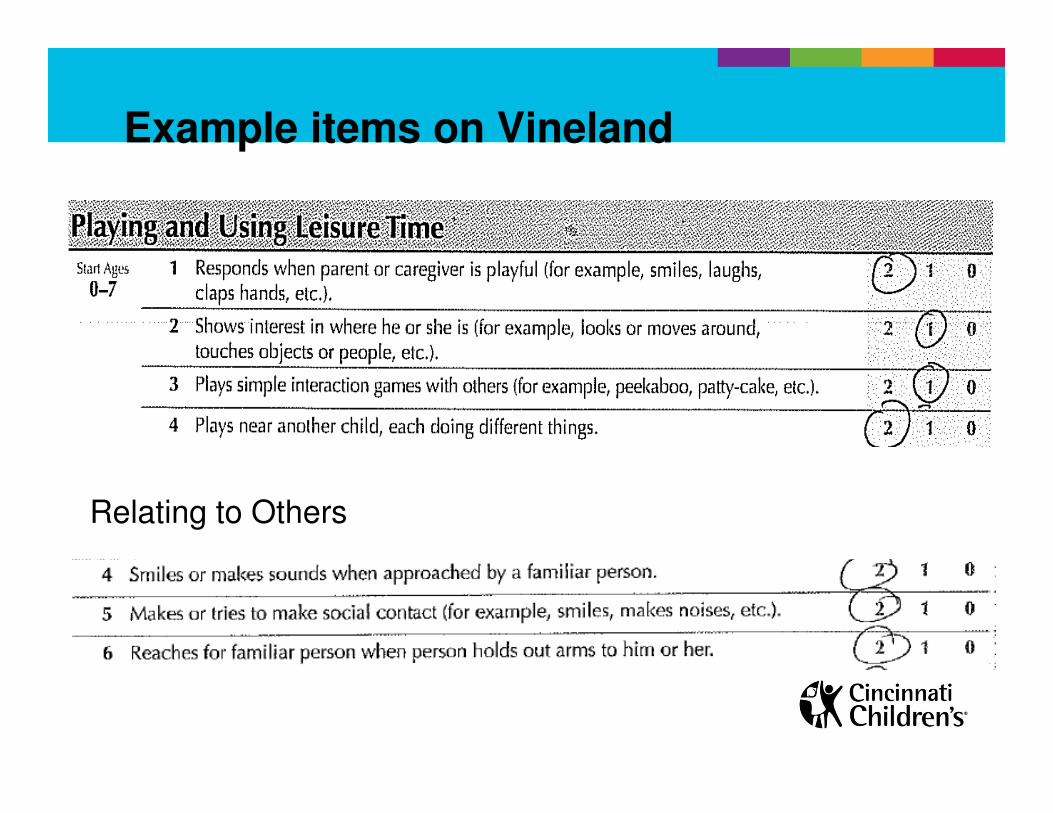
Relating to Others
Example items on Vineland
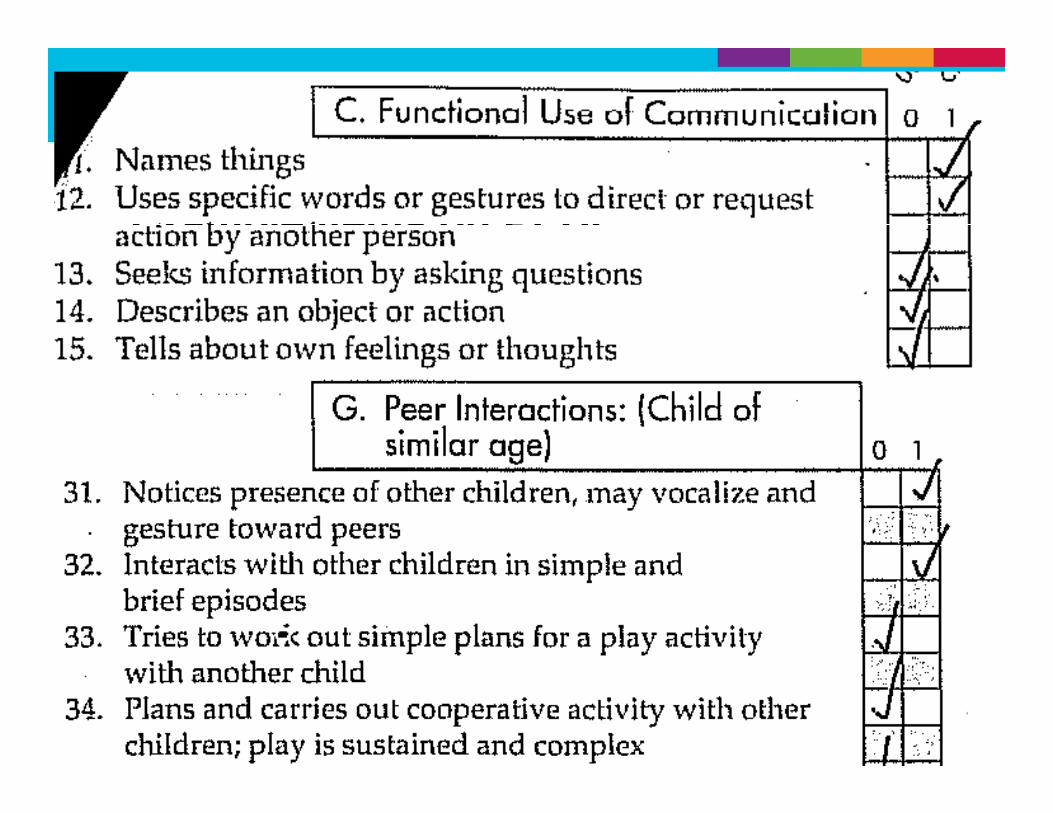
Example items on PEDI
Objectives of this exploratory study
• To assess the types of speech and language goals set during therapy
• To explore the association between goals and functional communication and social skills
• Interested in exploring the relationship between pragmatic goals and social functioning
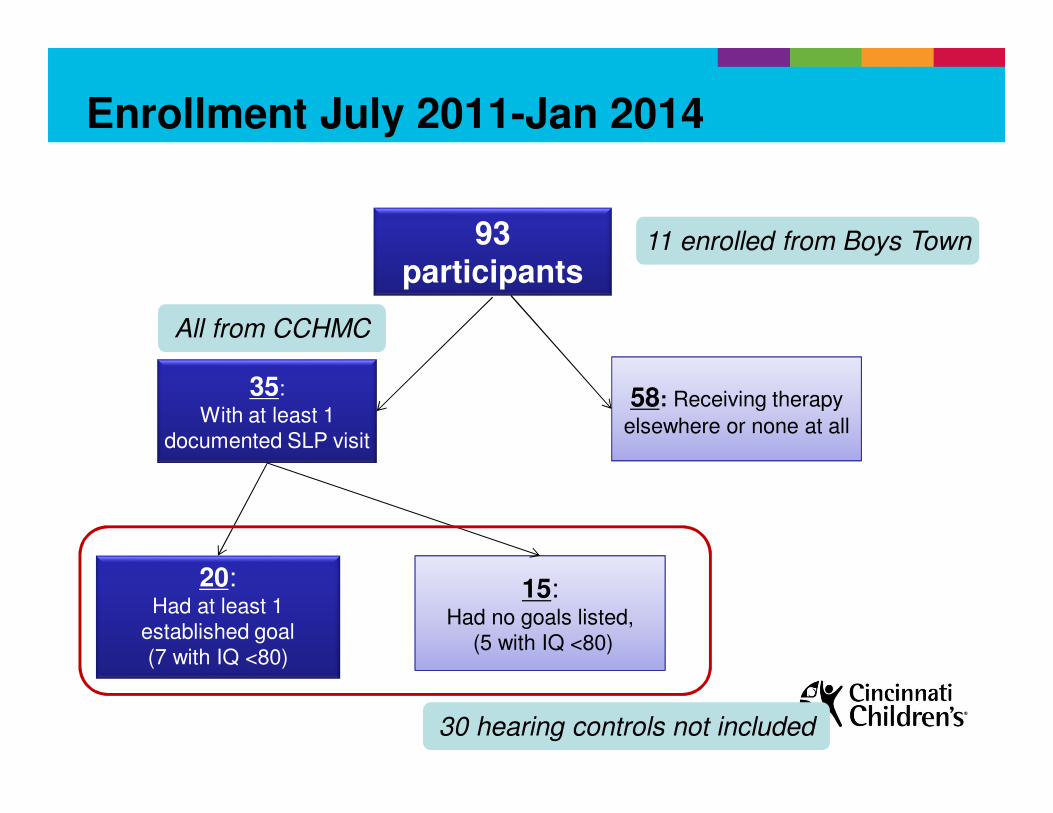
Enrollment July 2011-Jan 2014
93 participants
35:
With at least 1 documented SLP visit
58: Receiving therapy
elsewhere or none at all
15: Had no goals listed,
(5 with IQ <80)
20: Had at least 1
established goal(7 with IQ <80)
11 enrolled from Boys Town
All from CCHMC
30 hearing controls not included
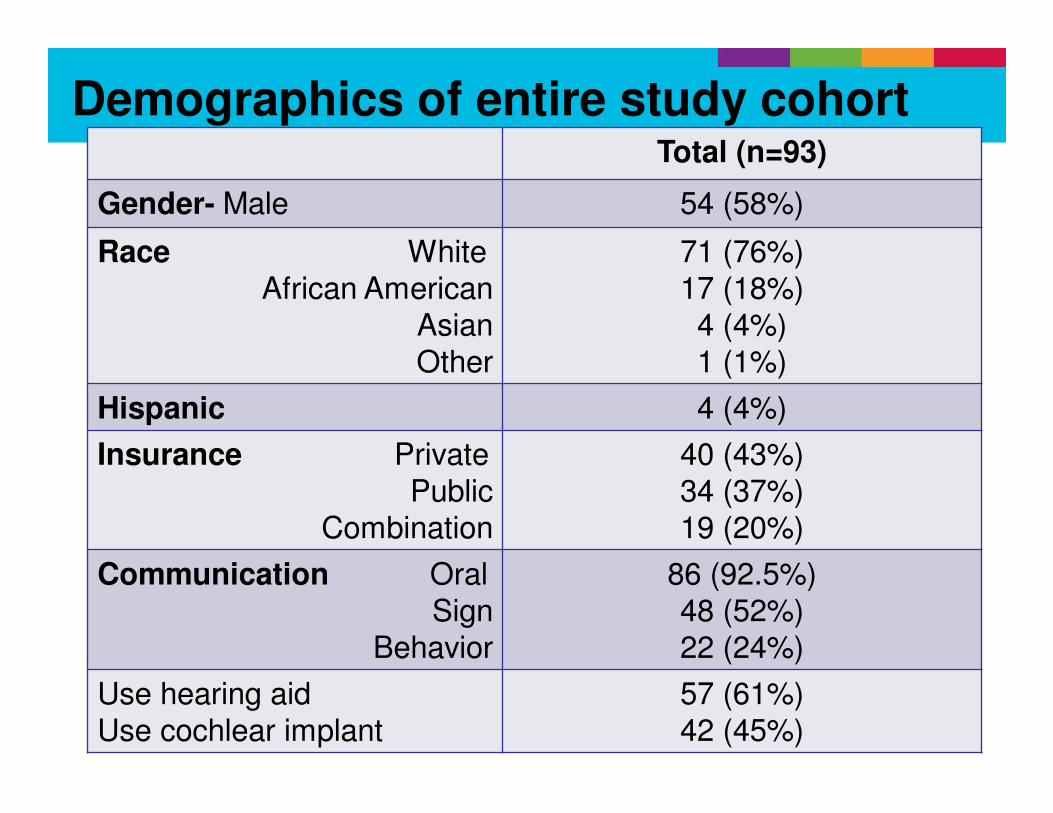
Total (n=93)
Gender- Male 54 (58%)
Race WhiteAfrican American
AsianOther
71 (76%)17 (18%)4 (4%)1 (1%)
Hispanic 4 (4%)
Insurance PrivatePublic
Combination
40 (43%)34 (37%)19 (20%)
Communication OralSign
Behavior
86 (92.5%)48 (52%)22 (24%)
Use hearing aid Use cochlear implant
57 (61%)42 (45%)
Demographics of entire study cohort
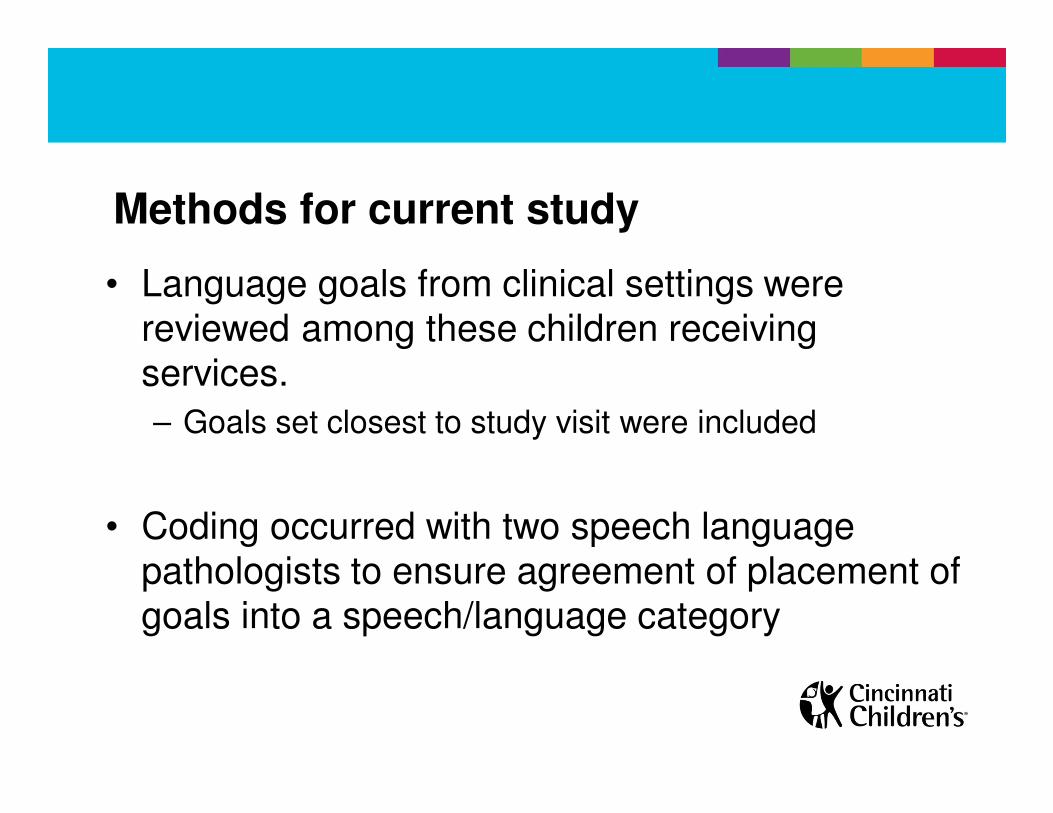
Methods for current study
• Language goals from clinical settings were reviewed among these children receiving services.
– Goals set closest to study visit were included
• Coding occurred with two speech language pathologists to ensure agreement of placement of goals into a speech/language category
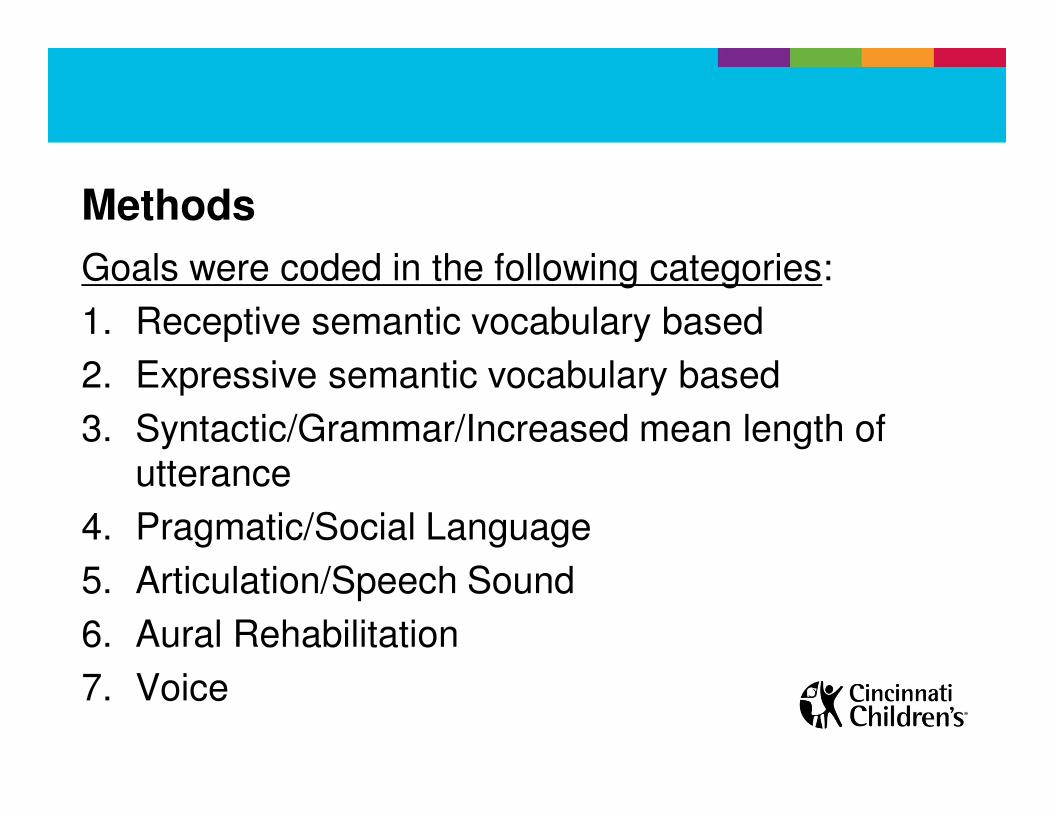
Methods
Goals were coded in the following categories:
1. Receptive semantic vocabulary based
2. Expressive semantic vocabulary based
3. Syntactic/Grammar/Increased mean length of utterance
4. Pragmatic/Social Language
5. Articulation/Speech Sound
6. Aural Rehabilitation
7. Voice
Methods-Additional information
• Demographics
– Insurance, maternal/paternal education, income
• Therapy information
– Number of different types of therapies
– Frequency of therapies (per week or per month)
– Hours per week in therapy
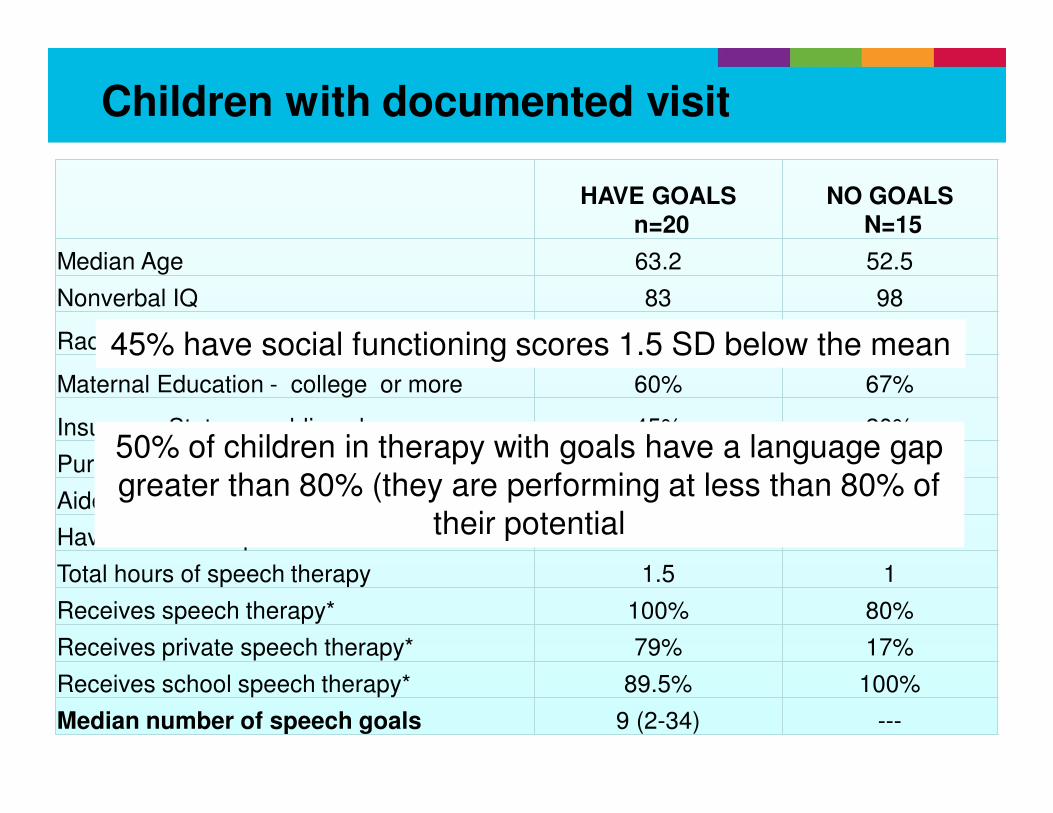
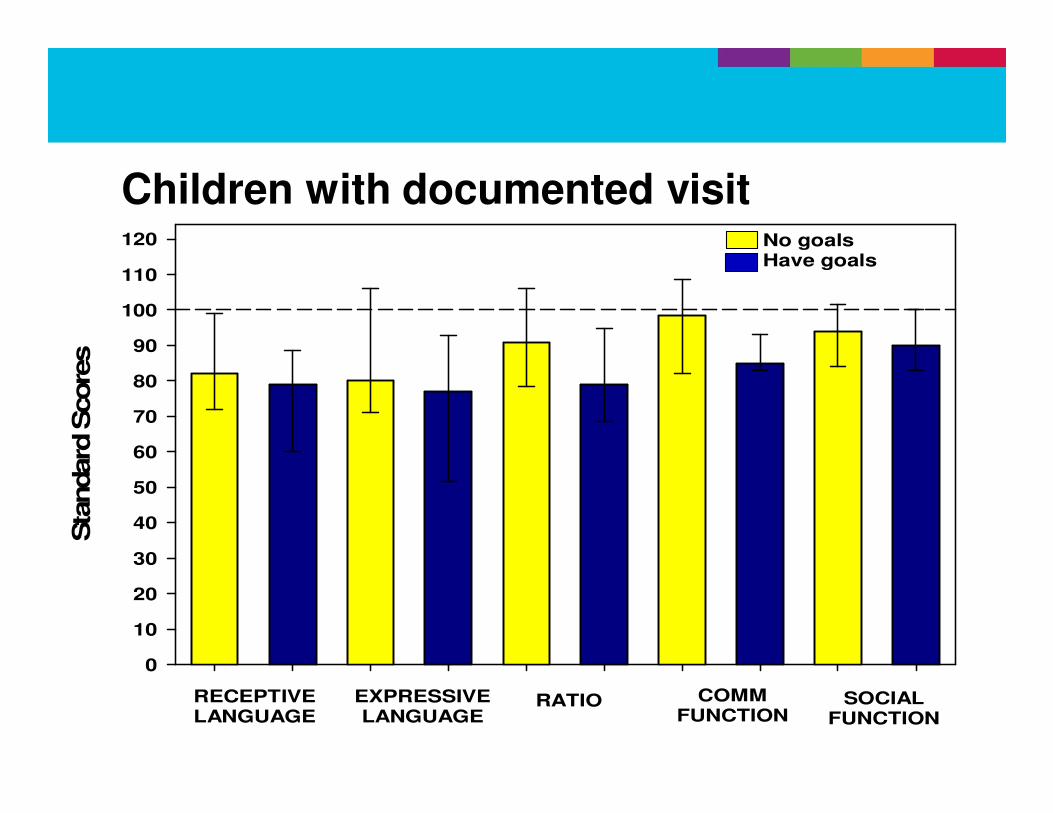
Children with documented visit
HAVE GOALSn=20
NO GOALSN=15
Median Age 63.2 52.5
Nonverbal IQ 83 98
Race - White 60% 80%
Maternal Education - college or more 60% 67%
Insurance Status – public only 45% 20%
Pure Tone Average 65.3 116
Aided SRT/SAT 20 25
Have cochlear Implant 50% 60%
Total hours of speech therapy 1.5 1
Receives speech therapy* 100% 80%
Receives private speech therapy* 79% 17%
Receives school speech therapy* 89.5% 100%
Median number of speech goals 9 (2-34) ---
45% have social functioning scores 1.5 SD below the mean
50% of children in therapy with goals have a language gap
greater than 80% (they are performing at less than 80% of
their potential
Sta
ndard
Score
s
0
10
20
30
40
50
60
70
80
90
100
110
120
RECEPTIVELANGUAGE
EXPRESSIVELANGUAGE
RATIO COMMFUNCTION
SOCIALFUNCTION
No goalsHave goals
Children with documented visit
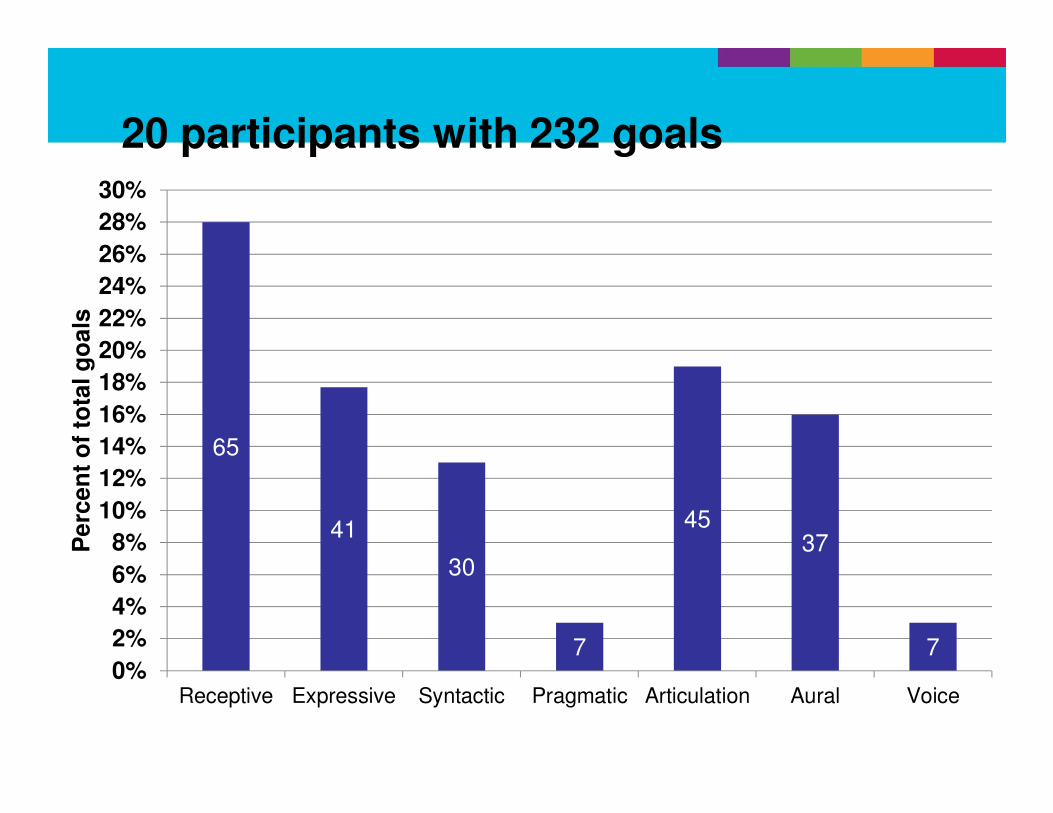
20 participants with 232 goals
65
41
30
7
4537
70%
2%
4%
6%
8%
10%
12%
14%
16%
18%
20%
22%
24%
26%
28%
30%
Receptive Expressive Syntactic Pragmatic Articulation Aural Voice
Pe
rce
nt
of
tota
l g
oa
ls
0%
10%
20%
30%
40%
50%
60%
70%
80%
90%
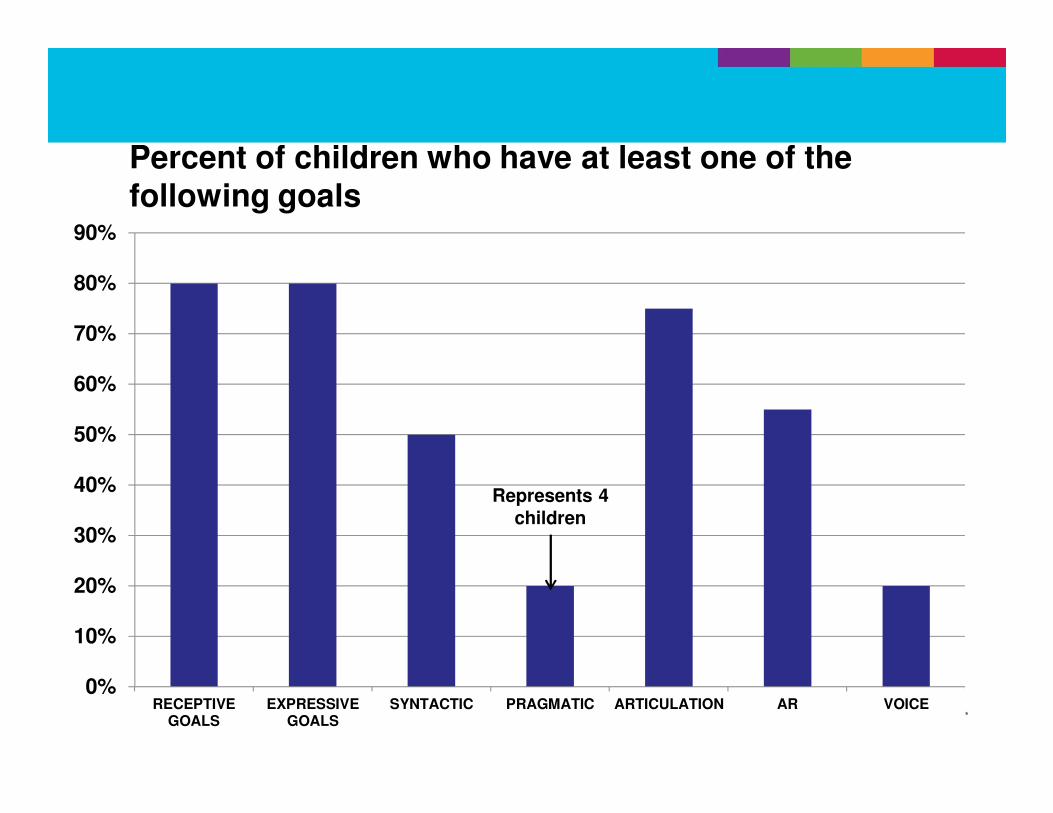
RECEPTIVEGOALS
EXPRESSIVEGOALS
SYNTACTIC PRAGMATIC ARTICULATION AR VOICE
Represents 4
children
Percent of children who have at least one of the following goals
Results
• The number of total speech goals per child ranged from 2-34 (median 9).
• Appropriately, there were more receptive goals (n=65) than any other
– Median # goals =3 (range 0-10)
• Number of total goals did not vary by age and degree of hearing loss.
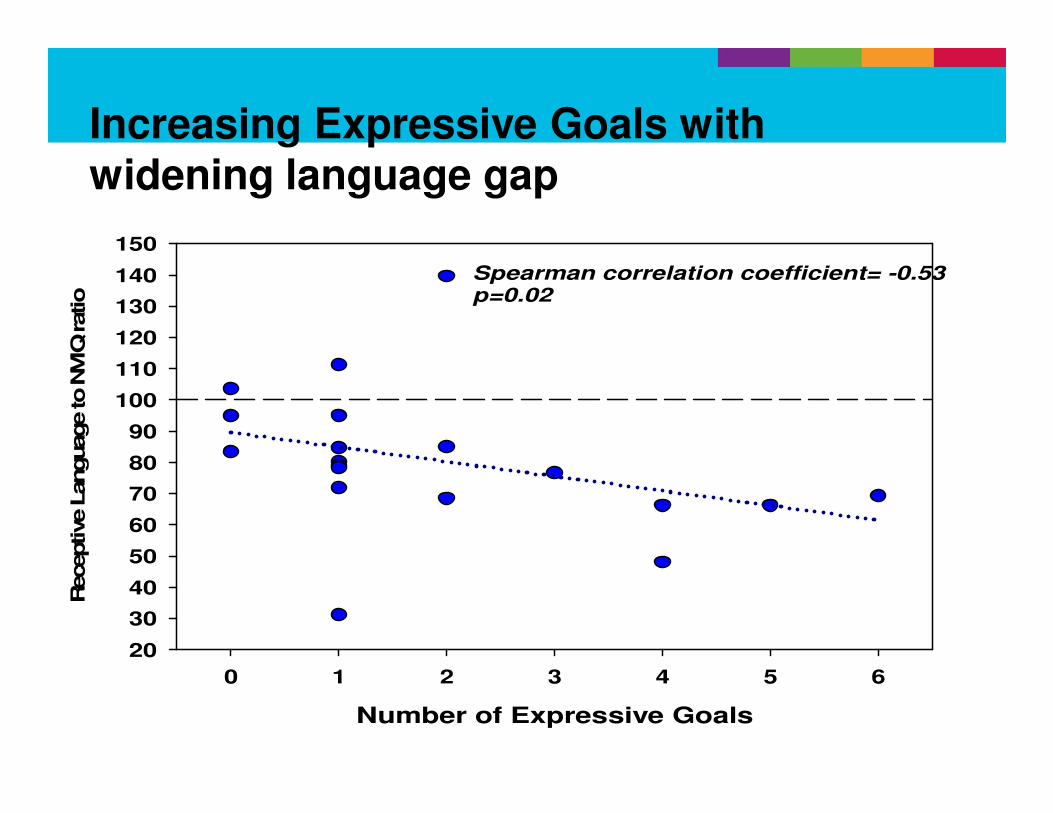
Number of Expressive Goals
0 1 2 3 4 5 6
Receptive L
anguage to N
VIQ
ratio
20
30
40
50
60
70
80
90
100
110
120
130
140
150
Spearman correlation coefficient= -0.53p=0.02
Increasing Expressive Goals with widening language gap
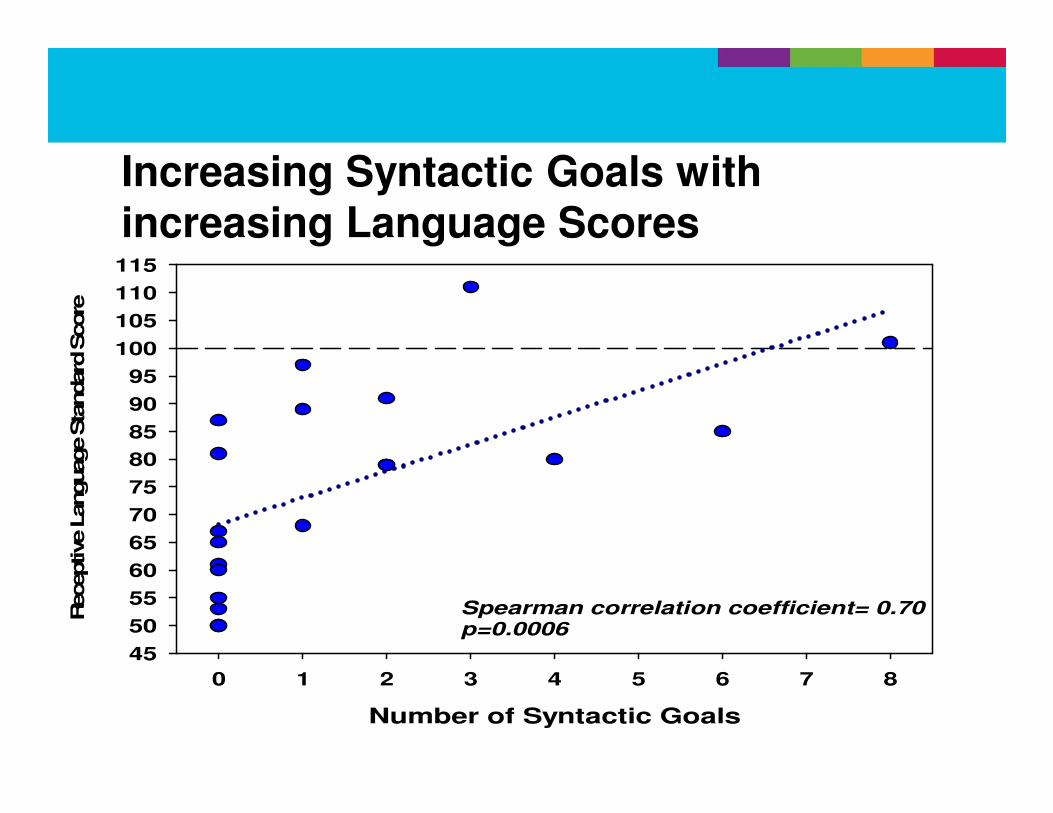
Number of Syntactic Goals
0 1 2 3 4 5 6 7 8
Receptive L
anguage S
tandard
Score
45
50
55
60
65
70
75
80
85
90
95
100
105
110
115
Spearman correlation coefficient= 0.70p=0.0006
Increasing Syntactic Goals with increasing Language Scores
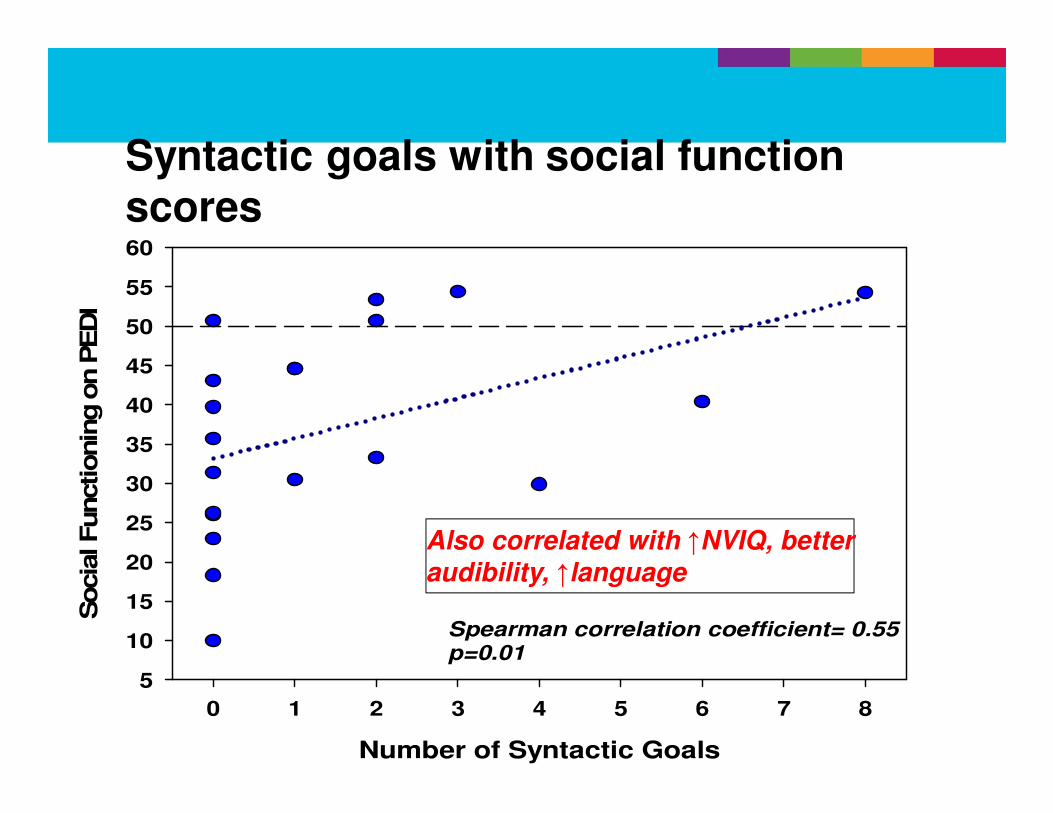
Number of Syntactic Goals
0 1 2 3 4 5 6 7 8
Socia
l Functionin
g o
n P
ED
I
5
10
15
20
25
30
35
40
45
50
55
60
Spearman correlation coefficient= 0.55p=0.01
Syntactic goals with social function scores
Also correlated with ↑NVIQ, better
audibility, ↑language

Results: Pragmatic goals, language, IQ and HL Severity
Child 1 Child 2 Child 3 Child 4
Age (months) 48 65 79 42
Total Goals 14 9 5 19
Pragmatic
Goals
3 2 1 1
Receptive
Language (SS)
91 61 60 80
Expressive
Language (SS)
97 50 50 76
IQ 107 73 76 <70
Severity of HL Mild Sev/Pro Sev/Pro Mild
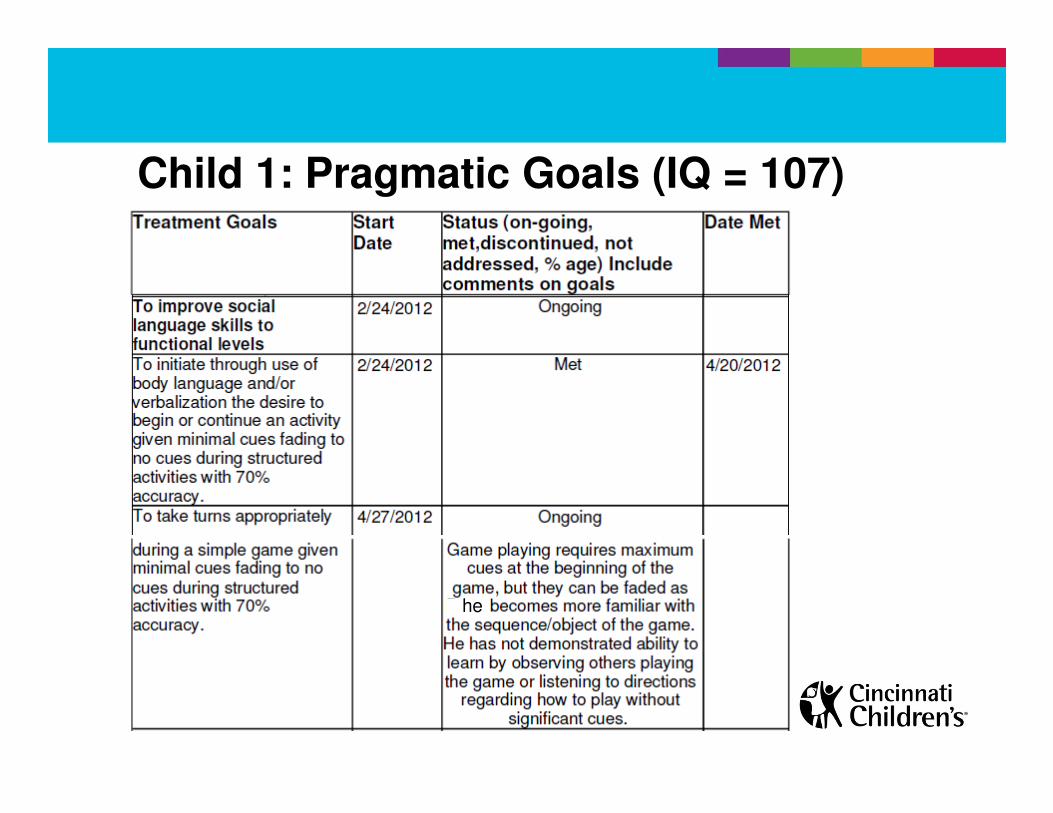
Child 1: Pragmatic Goals (IQ = 107)
he
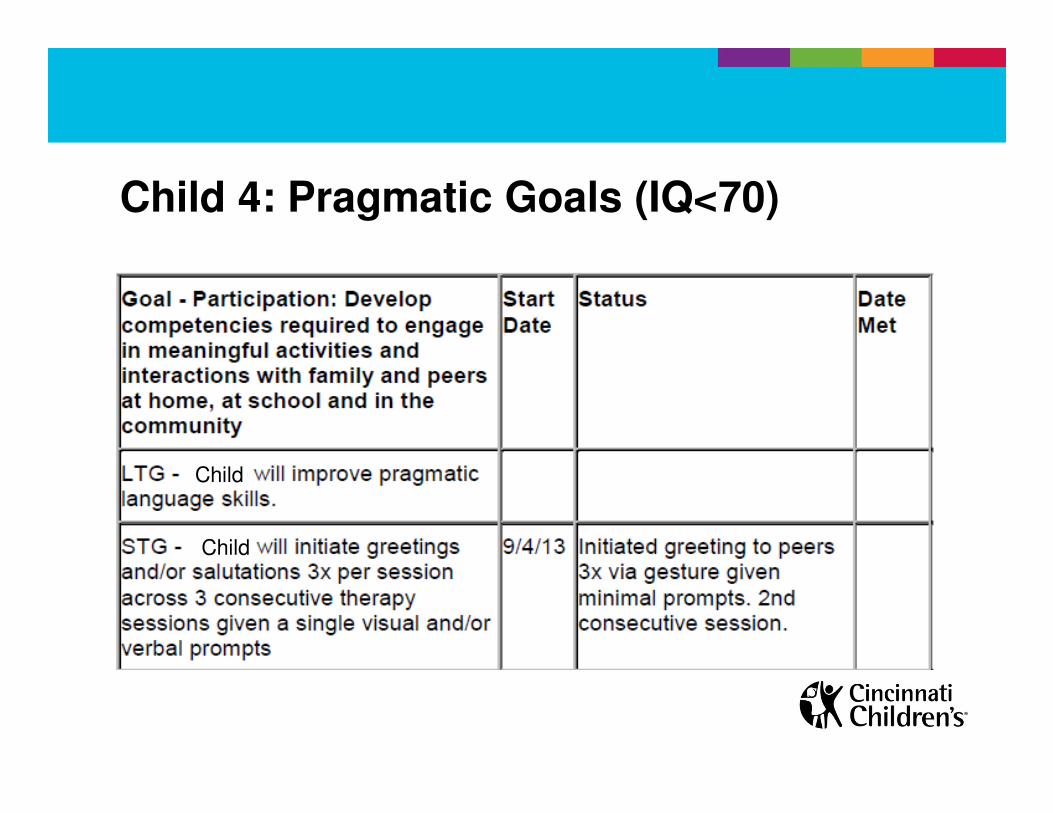
Child 4: Pragmatic Goals (IQ<70)
Child
Child
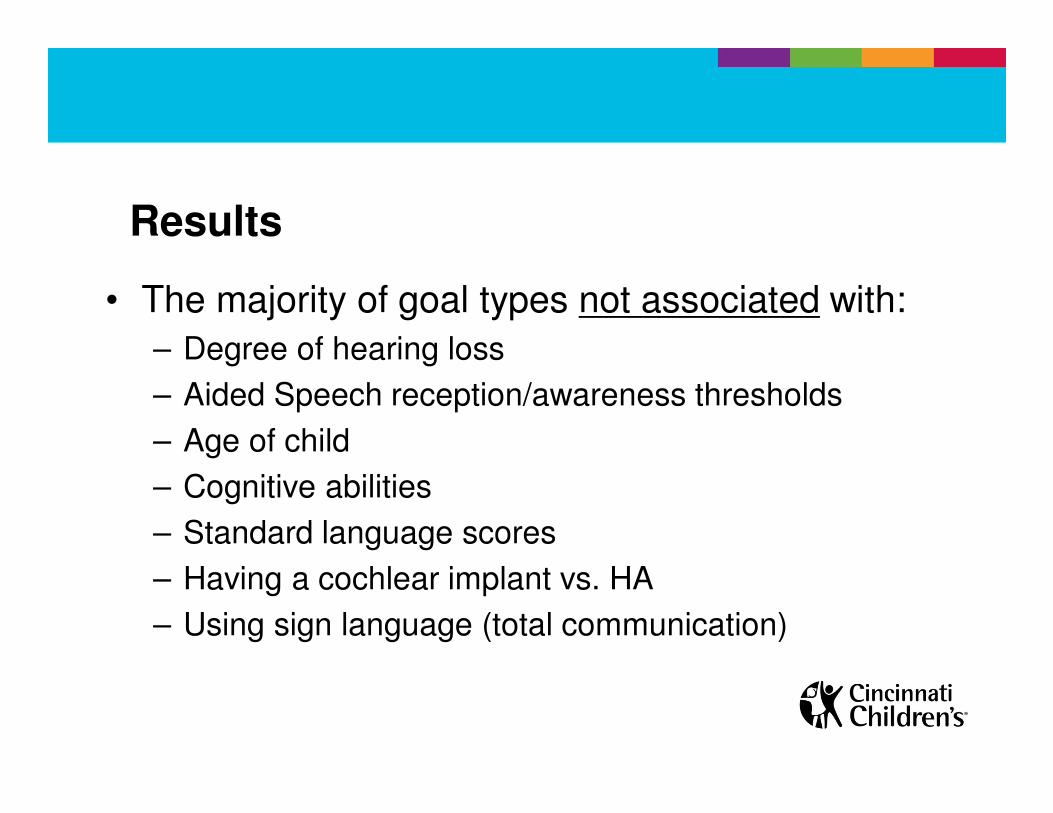
Results
• The majority of goal types not associated with:
– Degree of hearing loss
– Aided Speech reception/awareness thresholds
– Age of child
– Cognitive abilities
– Standard language scores
– Having a cochlear implant vs. HA
– Using sign language (total communication)
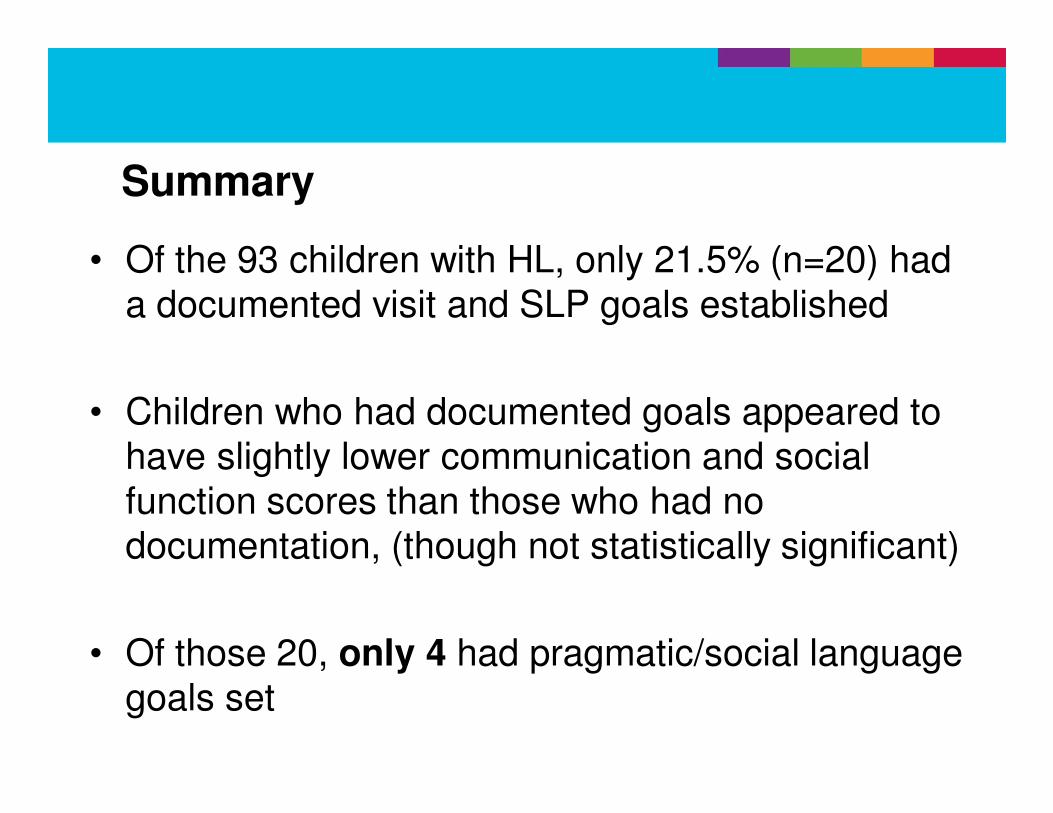
Summary
• Of the 93 children with HL, only 21.5% (n=20) had a documented visit and SLP goals established
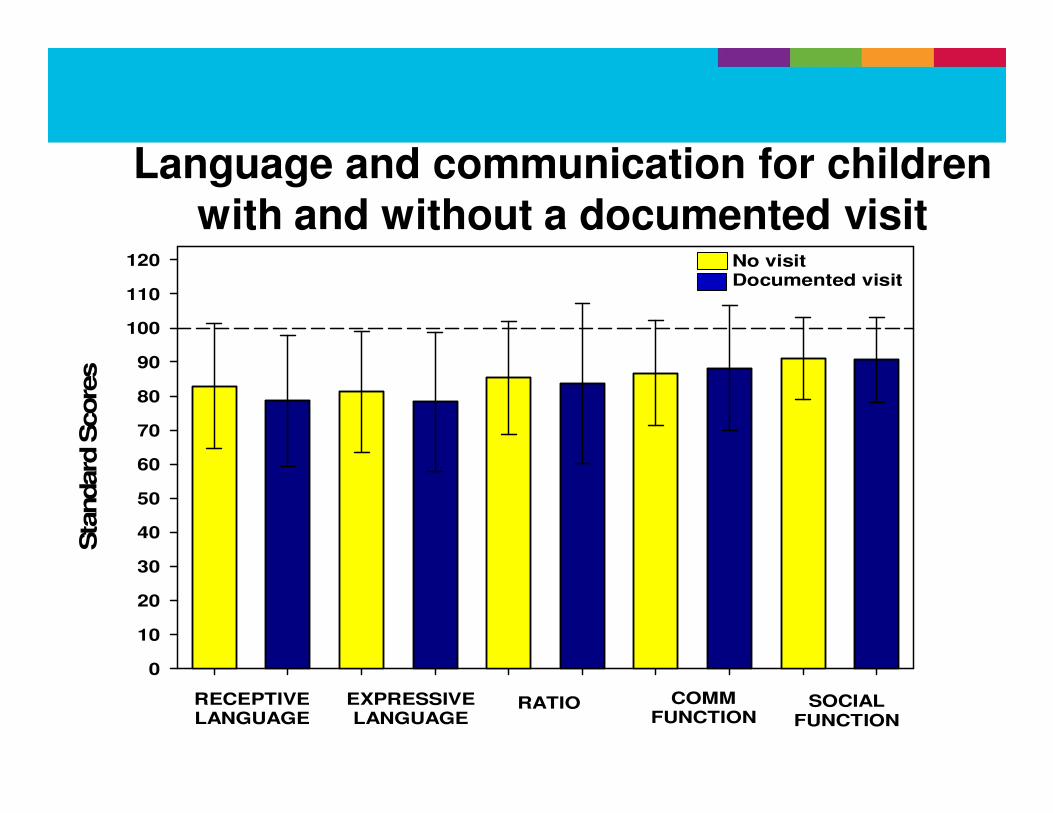
• Children who had documented goals appeared to have slightly lower communication and social function scores than those who had no documentation, (though not statistically significant)
• Of those 20, only 4 had pragmatic/social language goals set
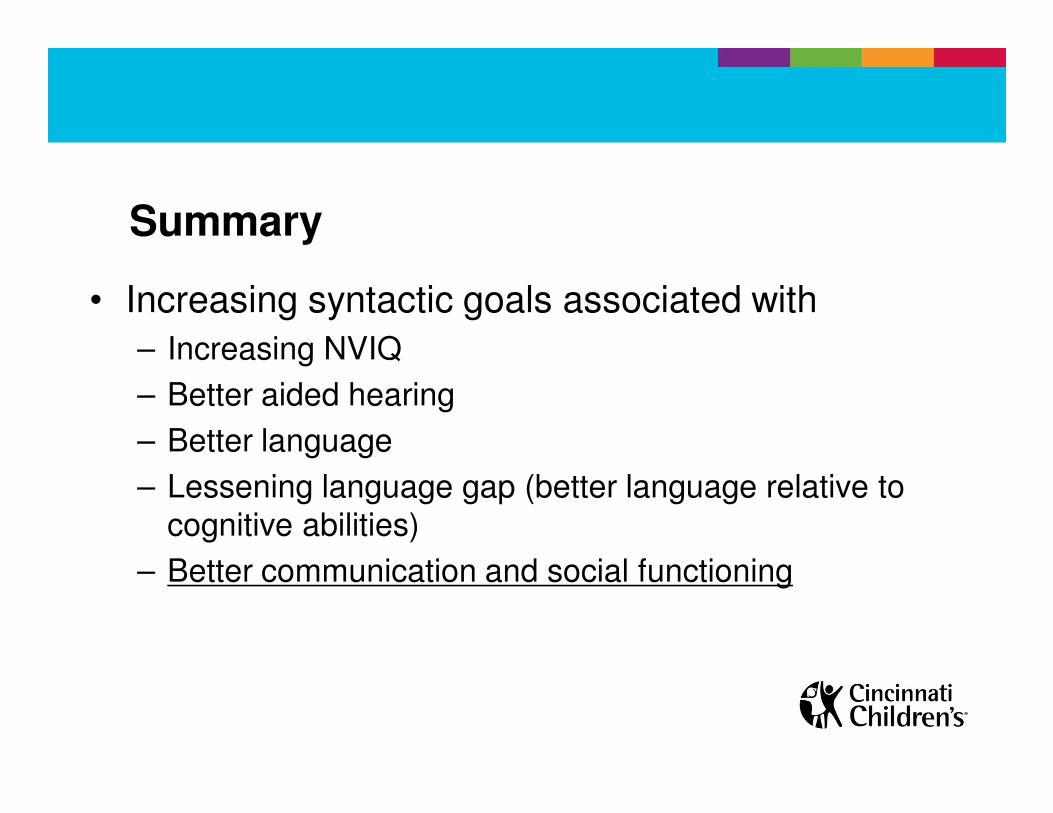
Summary
• Increasing syntactic goals associated with
– Increasing NVIQ
– Better aided hearing
– Better language
– Lessening language gap (better language relative to
cognitive abilities)
– Better communication and social functioning
Summary
• Lower social functional skill scores suggest a possible need for more pragmatic goals for those receiving speech therapy
Limitations
• Very small sample size at a single institution
– Many children received therapy in school settings
• We were only able to evaluate documentation of goals, not process for prioritizing goals nor time in therapy dedicated to different goals
– Didn’t determine length of time to achieve goals
• We did not assess the quality of the goals
– Are they appropriate for child’s cognitive abilities
Conclusions
• Social skills and pragmatic concerns were not included within the priorities of out-patient clinical settings, despite considerable under-performance on functional communication measures
• Pragmatic goals need to be identified and established sooner and more often
Acknowledgements
Thanks to:
• The participating families and children
• Julie Hibner, MA CCC-SLP
• Sandra Bechtol, RN
• Collaborators at Boys Town National Research
– Mary Pat Moeller, PhD
– Barbara Peterson
Questions?
Extra
Vineland Adaptive Behavior Scale (VABS)• 383 items
– usually (2), sometimes/partially (1), never (0)
• Communication, Daily living skills, socialization, motor skills
– Communication: receptive, expressive, written
communication skills
– Socialization: play and leisure time, interpersonal
relationships, coping skills
• Standard scores (mean 100+15)
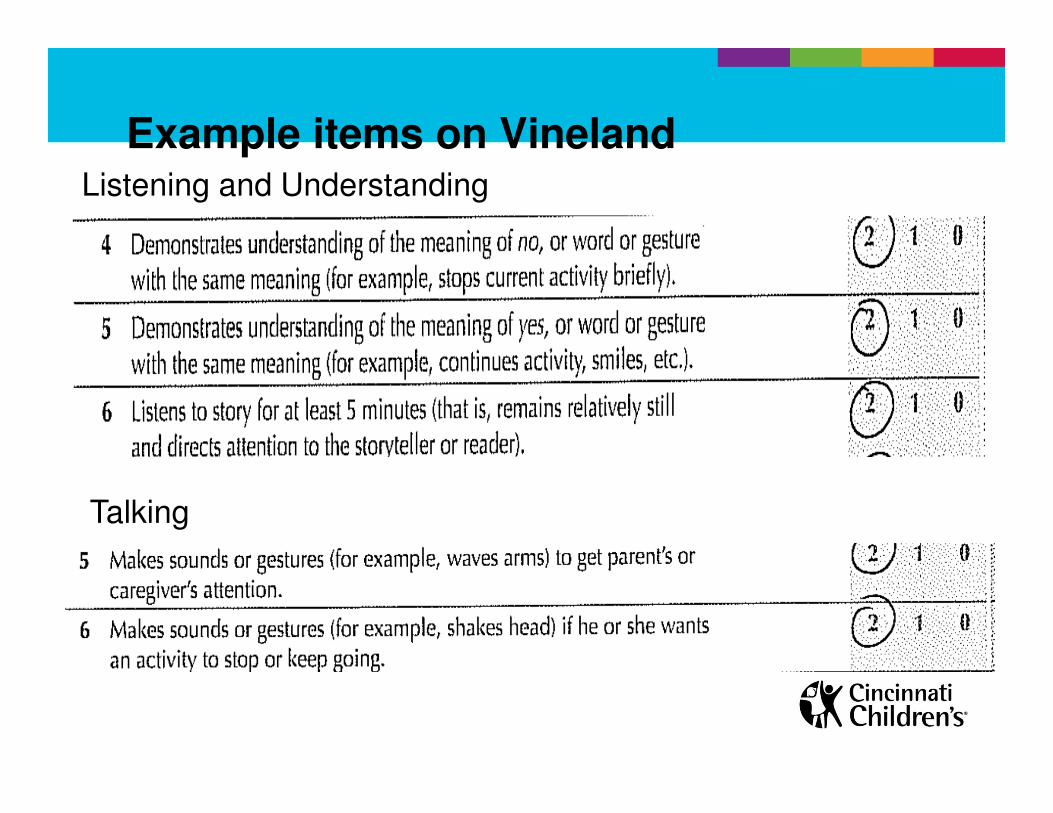
Listening and Understanding
Talking
Example items on Vineland
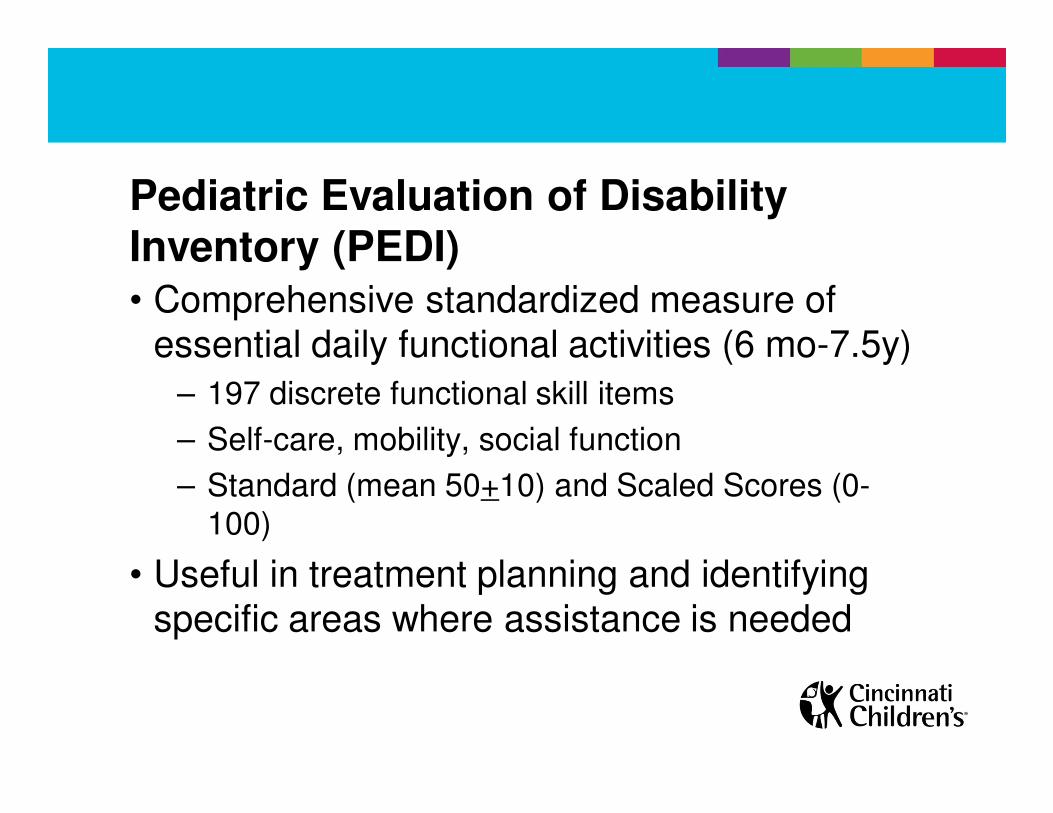
Pediatric Evaluation of Disability Inventory (PEDI)• Comprehensive standardized measure of
essential daily functional activities (6 mo-7.5y)
– 197 discrete functional skill items
– Self-care, mobility, social function
– Standard (mean 50+10) and Scaled Scores (0-
100)
• Useful in treatment planning and identifying specific areas where assistance is needed
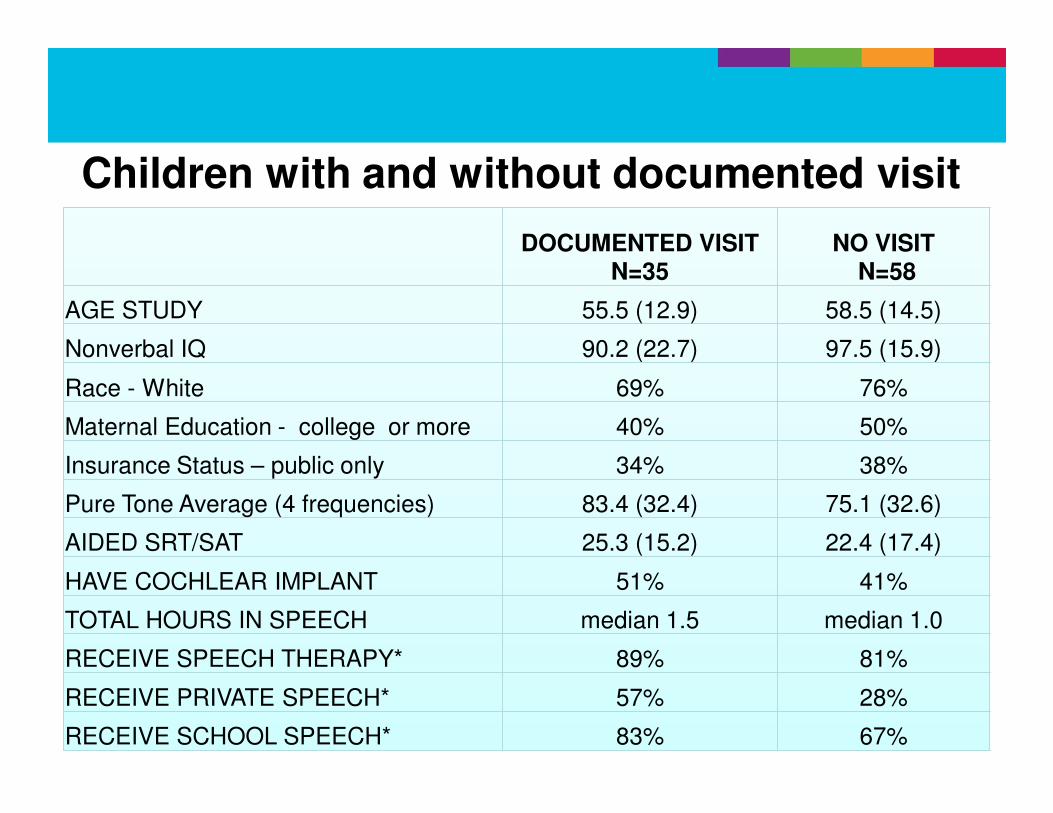
Children with and without documented visit
DOCUMENTED VISIT N=35
NO VISITN=58
AGE STUDY 55.5 (12.9) 58.5 (14.5)
Nonverbal IQ 90.2 (22.7) 97.5 (15.9)
Race - White 69% 76%
Maternal Education - college or more 40% 50%
Insurance Status – public only 34% 38%
Pure Tone Average (4 frequencies) 83.4 (32.4) 75.1 (32.6)
AIDED SRT/SAT 25.3 (15.2) 22.4 (17.4)
HAVE COCHLEAR IMPLANT 51% 41%
TOTAL HOURS IN SPEECH median 1.5 median 1.0
RECEIVE SPEECH THERAPY* 89% 81%
RECEIVE PRIVATE SPEECH* 57% 28%
RECEIVE SCHOOL SPEECH* 83% 67%
Sta
ndard
Score
s
0
10
20
30
40
50
60
70
80
90
100
110
120
RECEPTIVELANGUAGE
EXPRESSIVELANGUAGE
RATIO COMMFUNCTION
SOCIALFUNCTION
No visitDocumented visit
Language and communication for children with and without a documented visit
Implications
• Children at single word utterance level - 15-30 mos. development (Brown’s Stage I) should be:
– Using “yes” to affirm and “no” to refuse
– Asking “what” questions
– Describing & Requesting (big, hot, more, cold, come,
eat, go, help)
Implications
• What if child is nonverbal or speech not understood?
– Are we supporting other strategies for
communicating? (Eye Gaze/Facial Expression;
Vocalization; Gestures/Sign Language; Pointing
to: objects, photographs, line drawings, symbols;
Speech Generating Devices/Mobile technologies
such as Ipads, Tablets, Androids)
Pragmatics involve three major communication skills:
• Using language for different purposes
• Changing language according to the needs of a listener or situation
• Following rules for conversations and storytelling
• ASHA Development Chart
Reference: http://www.asha.org/public/speech/development/chart/


![MANUAL - Garmin · General settings and Training settings General settings In the menu left click on [Settings]. The General settings are for the general display. Language The standard](https://img.pdfslide.us/doc/110x75/5f9ad8bee7f94767a440344e/manual-garmin-general-settings-and-training-settings-general-settings-in-the-menu.jpg)