Embed Size (px)
Citation preview
Vue PACS MR Perfusion User Guide Unrestricted Internal Use
AE9362 C Uncontrolled unless otherwise indicated Page: 1 of 43
Vue PACS MR Perfusion User Guide - AE9362.docx
Clinical Collaboration Platform
Vue PACS MR Diffusion and MR Perfusion
User Guide
Part # AE9362 2017-05-17
Vue PACS MR Perfusion User Guide Unrestricted Internal Use
AE9362 C Uncontrolled unless otherwise indicated Page: 2 of 43
Vue PACS MR Perfusion User Guide - AE9362.docx
Table of Contents 1. Acronym list ..................................................................................................................................... 6
2. Introduction ...................................................................................................................................... 9
3. Application Workflow ...................................................................................................................... 11
4. Loading the Study .......................................................................................................................... 12 5. Initial Display .................................................................................................................................. 14
5.1 Basic Image Manipulation ..................................................................................................... 14
5.2 Tool Ribbon ........................................................................................................................... 14
6. Viewing Diffusion Series ................................................................................................................ 16
6.1 DWI Images ........................................................................................................................... 16
6.2 DTI Images ............................................................................................................................ 17 6.3 Using the Brain Mask Correction Tool .................................................................................. 20
6.3.1 Displaying the Brain Mask ................................................................................................. 20
6.3.2 Adding Brain Mask ............................................................................................................ 20
6.3.3 Erasing Brain Mask ........................................................................................................... 21
6.4 Adding an ROI ....................................................................................................................... 21
6.5 Determining the Display ........................................................................................................ 21 7. Perfusion Series ............................................................................................................................. 22
7.1 Initial Layout .......................................................................................................................... 22
7.2 Calculating Perfusion Input Values ....................................................................................... 25
7.2.1 Identifying the AIF and VOF .............................................................................................. 25
7.2.2 Adding Arteries and Veins ................................................................................................. 25 7.2.3 Using the Artery and Vein Segmentation Tool .................................................................. 25
7.2.4 Using the Brain Mask Correction Tool .............................................................................. 27
7.2.5 Correcting the Brain Centerline ......................................................................................... 27
7.2.6 Using Motion Correction .................................................................................................... 27
7.3 Working with Perfusion Maps ................................................................................................ 28
7.3.1 Initiating Map Calculation .................................................................................................. 28 7.3.2 Analyzing Perfusion Calculation Results .......................................................................... 28
7.4 Displaying a Fused Image ..................................................................................................... 32
8. Selecting a Layout ......................................................................................................................... 33
9. Using Settings ................................................................................................................................ 34
10. Opening a Report ....................................................................................................................... 39
11. Exporting the Perfusion Analysis ............................................................................................... 40 12. Accuracy and Limitations ........................................................................................................... 41
13. References ................................................................................................................................. 42
Vue PACS MR Perfusion User Guide Unrestricted Internal Use
AE9362 C Uncontrolled unless otherwise indicated Page: 3 of 43
Vue PACS MR Perfusion User Guide - AE9362.docx
Preface Trademark and Copyright Information CARESTREAM is a trademark of Carestream Health.
This document is copyrighted with all rights reserved.
Under the copyright laws, this document may not be copied, in whole or in part, without the written consent of Carestream Health, Inc. Under the law, copying includes translating into another language or format.
All names or identities used in this document are fictitious.
Caution: Federal law restricts this device to sale to, by, or on order of a physician.
The information contained herein is based on the experience and knowledge relating to the subject matter gained by Carestream Health, Inc. prior to publication. No patent license is granted by this information.
Carestream Health, Inc. reserves the right to change this information without notice and makes no warranty, express or implied, with respect to this information.
Carestream Health, Inc. shall not be liable for any loss or damage, including consequential or special damages, resulting from the use of this information, even if loss or damage is caused by Carestream Health, Inc.'s negligence or other fault.
FCC Compliance This equipment has been tested and found to comply with the limits for a Class A digital device, pursuant to Part 15 of the FCC Rules.
These limits are designed to provide reasonable protection against harmful interference when the equipment is operated in a commercial environment. This equipment generates, uses, and can radiate radio frequency energy and, if not installed and used in accordance with the instruction manual, may cause harmful interference to radio communications.
Operation of this equipment in a residential area is likely to cause harmful interference in which case users will be required to correct the interference at their own expense.
Regulatory Information AUTHORIZED REPRESENTATIVE (European Union)
Carestream Health France 1 rue Galilée 93192 Noisy Le Grand cedex France
Importer for European Union Carestream Health Netherlands B.V. Bramenberg 12 3755 BZ Eemnes
The Netherlands
Vue PACS MR Perfusion User Guide Unrestricted Internal Use
AE9362 C Uncontrolled unless otherwise indicated Page: 4 of 43
Vue PACS MR Perfusion User Guide - AE9362.docx
Safety Guidelines This product was designed and manufactured to ensure maximum safety of operation. It must be operated and maintained in strict compliance with the safety precautions and operating instructions described.
• This product must be installed, maintained and serviced according to Carestream Health Inc.'s maintenance procedures by Carestream Health, Inc. personnel, or other qualified maintenance personnel approved in writing by Carestream Health, Inc.
• The system, in whole or in any part, may not be modified in any way without prior written approval from Carestream Health.
• Unauthorized personnel must be prevented from accessing the system. • If the system does not operate properly, or if it fails to respond to the controls described in this
manual, contact the nearest Carestream Health, Inc. field service office to report the incident and await further instructions.
• The images and tools provided by this system are intended as tools for the competent user only. They are explicitly not to be regarded as a sole incontrovertible basis for clinical diagnoses. Operators are encouraged to study the literature and reach their own professional conclusions regarding the utility of the system.
• The operator must be aware of the product specifications and of the system accuracy and limitations. These limitations must be considered before making a decision based on quantitative values. When in doubt, consult the nearest Carestream Health, Inc. field service office.
Hazard Warnings CAUTION: To prevent serious personal injury and damage to the system, strictly follow the instructions provided in these hazard warnings. Always remain alert when operating this equipment. If a malfunction occurs, do not use the equipment until qualified personnel correct the problem.
ELECTRICAL SHOCK HAZARD
Do not remove or open system panels, covers or plugs. The internal system circuits use high voltages that can cause serious injury or death from electrical shock.
EXPLOSION HAZARD
Do not operate the equipment in the presence of flammable or explosive liquids, vapors or gases. Do not plug in or turn on the system if hazardous substances are detected in the environment.
If flammable substances are detected after the system has been turned on, do not attempt to turn off the system or unplug it. Evacuate and ventilate the area before turning off the system.
OVERHEATING
Do not block the ventilation ports of the electronic equipment. Always maintain at least 6 inches (15 cm) clearance around the ventilation ports to prevent overheating and damage to the electronic hardware.
EMERGENCIES
Do not use the system if unsafe conditions are known to exist. In the event of hardware failure that could cause hazardous conditions (smoke, fire, and so on), turn the power OFF and unplug the power cords for both the monitor and the desktop unit.
ELECTRICAL FIRES
Conductive fluids that seep into the active circuit components of the system may cause short circuits that can result in an electrical fire. Therefore, do not place fluids or food on any part of the system.
To avoid electrical shocks and burns caused by the use of the wrong type of fire extinguisher, ensure that the fire extinguisher at the site has been approved for use on electrical fires.
Vue PACS MR Perfusion User Guide Unrestricted Internal Use
AE9362 C Uncontrolled unless otherwise indicated Page: 5 of 43
Vue PACS MR Perfusion User Guide - AE9362.docx
POTENTIAL PACEMAKER HAZARD
Although the possibility of interference with pacemakers is slight, the operator should be alert to such a potential hazard from any equipment using high-frequency electrical signals.
INDICATIONS FOR USE
The CARESTREAM Vue PACS is an image management system whose intended use is to provide completely scalable local and wide area PACS solutions for hospital and related institutions/sites, which will archive, distribute, retrieve and display images and data from all hospital modalities and information systems. The system is to be used by trained professionals including, but not limited to, physicians and medical technicians.
The system contains interactive tools in order to ease the process of analyzing and comparing three dimensional (3D) images. It is a single system that integrates review, dictation and reporting tools to create a productive work environment for the radiologists and physicians.
The system contains a Perfusion module with interactive tools to analyze and compare Computed Tomography Perfusion (CTP) and MR Perfusion (MRP) images of adult patients. Blood perfusion parameters are automatically calculated and displayed as a set of perfusion maps and perfusion tables. The perfusion tables include the calculation of parameters related to tissue flow (perfusion) and tissue blood volume.
The system contains a Diffusion Module with interactive tools to ease the process of analyzing and comparing MR Diffusion Weighted images (DWI) and MR Diffusion Tensor Imaging (DTI) of adult patients. This module is used to visualize local water diffusion properties from the analysis of diffusion- weighted MRI data.
The system supports Subtraction with interactive tools to aid with the analysis of Digital Subtraction Angiography (DSA) images in both interventional radiology and cardiology. Subtraction automatically subtracts a mask from contrast frames of an X-Ray Angiography study for visualization of vascular anatomy and pathology of adult patients.
Vue PACS MR Perfusion User Guide Unrestricted Internal Use
AE9362 C Uncontrolled unless otherwise indicated Page: 6 of 43
Vue PACS MR Perfusion User Guide - AE9362.docx
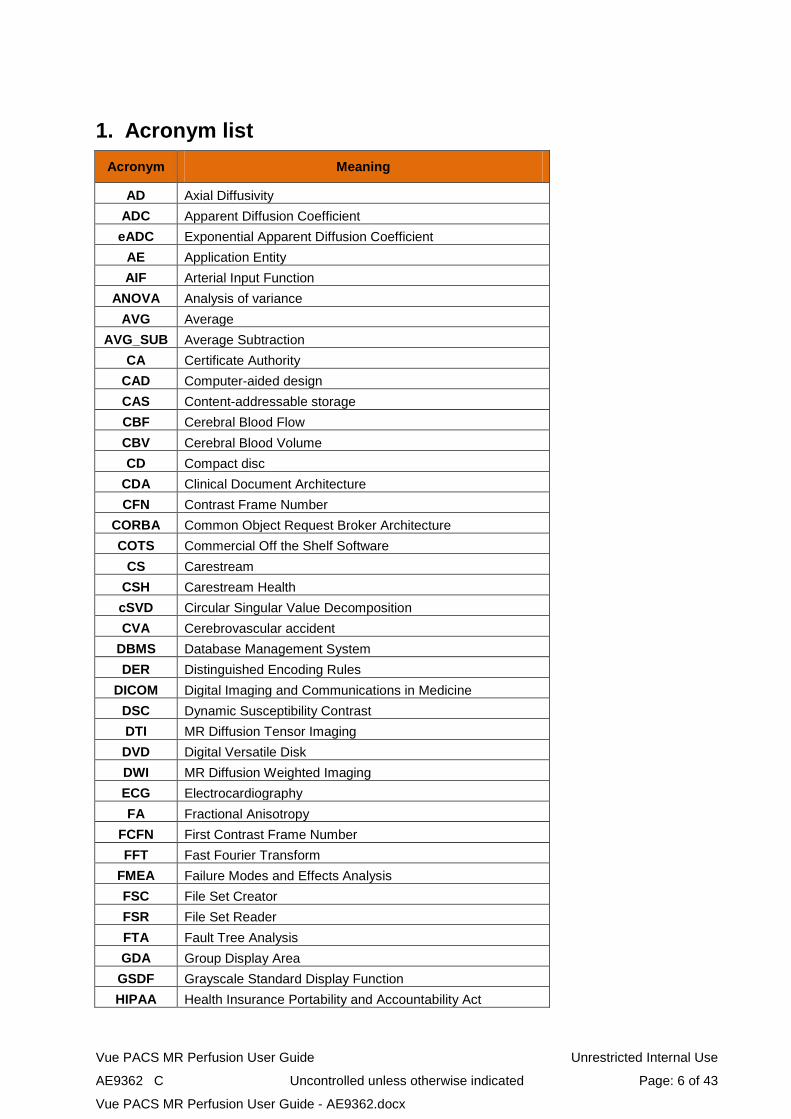
1. Acronym list Acronym Meaning
AD Axial Diffusivity ADC Apparent Diffusion Coefficient eADC Exponential Apparent Diffusion Coefficient
AE Application Entity AIF Arterial Input Function
ANOVA Analysis of variance AVG Average
AVG_SUB Average Subtraction CA Certificate Authority
CAD Computer-aided design CAS Content-addressable storage CBF Cerebral Blood Flow CBV Cerebral Blood Volume CD Compact disc
CDA Clinical Document Architecture CFN Contrast Frame Number
CORBA Common Object Request Broker Architecture COTS Commercial Off the Shelf Software
CS Carestream CSH Carestream Health cSVD Circular Singular Value Decomposition CVA Cerebrovascular accident
DBMS Database Management System DER Distinguished Encoding Rules
DICOM Digital Imaging and Communications in Medicine DSC Dynamic Susceptibility Contrast DTI MR Diffusion Tensor Imaging DVD Digital Versatile Disk DWI MR Diffusion Weighted Imaging ECG Electrocardiography FA Fractional Anisotropy
FCFN First Contrast Frame Number FFT Fast Fourier Transform
FMEA Failure Modes and Effects Analysis FSC File Set Creator FSR File Set Reader FTA Fault Tree Analysis GDA Group Display Area
GSDF Grayscale Standard Display Function HIPAA Health Insurance Portability and Accountability Act
Vue PACS MR Perfusion User Guide Unrestricted Internal Use
AE9362 C Uncontrolled unless otherwise indicated Page: 7 of 43
Vue PACS MR Perfusion User Guide - AE9362.docx
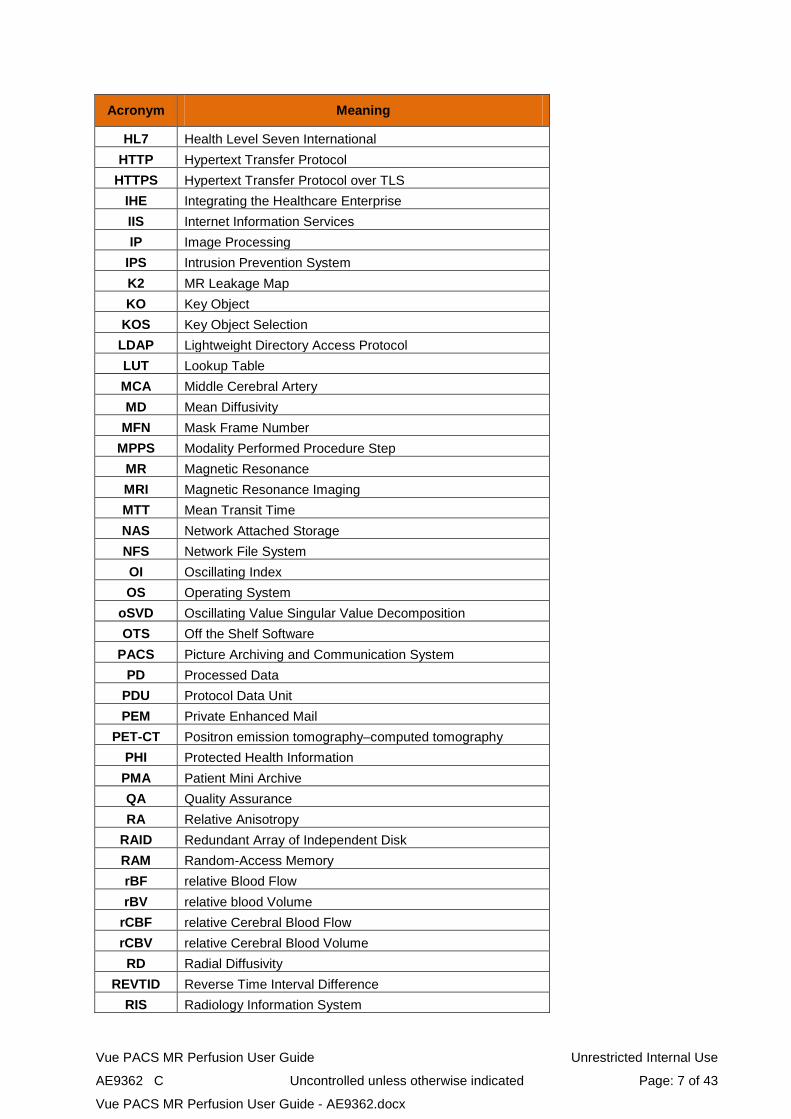
Acronym Meaning
HL7 Health Level Seven International HTTP Hypertext Transfer Protocol
HTTPS Hypertext Transfer Protocol over TLS IHE Integrating the Healthcare Enterprise IIS Internet Information Services IP Image Processing
IPS Intrusion Prevention System K2 MR Leakage Map KO Key Object
KOS Key Object Selection LDAP Lightweight Directory Access Protocol LUT Lookup Table MCA Middle Cerebral Artery MD Mean Diffusivity
MFN Mask Frame Number MPPS Modality Performed Procedure Step
MR Magnetic Resonance MRI Magnetic Resonance Imaging MTT Mean Transit Time NAS Network Attached Storage NFS Network File System OI Oscillating Index OS Operating System
oSVD Oscillating Value Singular Value Decomposition OTS Off the Shelf Software
PACS Picture Archiving and Communication System PD Processed Data
PDU Protocol Data Unit PEM Private Enhanced Mail
PET-CT Positron emission tomography–computed tomography PHI Protected Health Information PMA Patient Mini Archive QA Quality Assurance RA Relative Anisotropy
RAID Redundant Array of Independent Disk RAM Random-Access Memory rBF relative Blood Flow rBV relative blood Volume
rCBF relative Cerebral Blood Flow rCBV relative Cerebral Blood Volume RD Radial Diffusivity
REVTID Reverse Time Interval Difference RIS Radiology Information System
Vue PACS MR Perfusion User Guide Unrestricted Internal Use
AE9362 C Uncontrolled unless otherwise indicated Page: 8 of 43
Vue PACS MR Perfusion User Guide - AE9362.docx
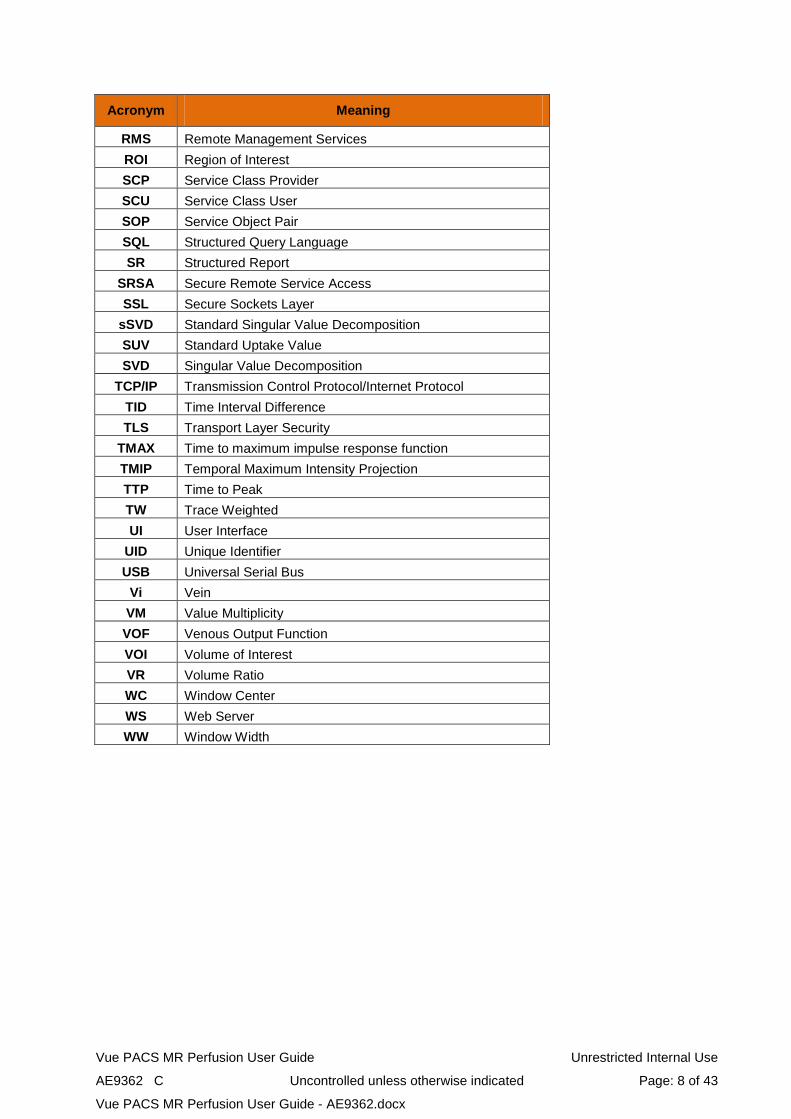
Acronym Meaning
RMS Remote Management Services ROI Region of Interest SCP Service Class Provider SCU Service Class User SOP Service Object Pair SQL Structured Query Language SR Structured Report
SRSA Secure Remote Service Access SSL Secure Sockets Layer
sSVD Standard Singular Value Decomposition SUV Standard Uptake Value SVD Singular Value Decomposition
TCP/IP Transmission Control Protocol/Internet Protocol TID Time Interval Difference TLS Transport Layer Security
TMAX Time to maximum impulse response function TMIP Temporal Maximum Intensity Projection TTP Time to Peak TW Trace Weighted UI User Interface
UID Unique Identifier USB Universal Serial Bus
Vi Vein VM Value Multiplicity VOF Venous Output Function VOI Volume of Interest VR Volume Ratio WC Window Center WS Web Server WW Window Width
Vue PACS MR Perfusion User Guide Unrestricted Internal Use
AE9362 C Uncontrolled unless otherwise indicated Page: 9 of 43
Vue PACS MR Perfusion User Guide - AE9362.docx
2. Introduction The MR Diffusion and MR Perfusion modules are clinical tools for evaluating water diffusion and blood perfusion parameters in the brain.
The applications use as input a collection of images produced by a Magnetic Resonance (MR) scanner. Diffusion Weighted Imaging (DWI) MR and Diffusion Tensor Imaging (DTI) MR series are used for calculating the rate and direction of water diffusion in the brain, while DSC series serve to calculate blood flow, blood volume, and permeability.
Based on the input data and on the calculation of water and blood supply parameters, the application produces maps that help diagnose the clinical question at hand.
The diffusion module provides1:
• Automatic calculation of a brain mask • Ability to add or subtract mask areas manually • Automatic calculation of DWI maps based on input data, including:
• ADC
• eADC
• Automatic calculation of DTI maps based on input data, including:
• ADC
• eADC
• DWI iso
• Axial diff
• Rad diff
• FA
• VR
• FA dir
• Ability to add ROIs • Show calculated information in tabular form
The perfusion module provides2,3,4,5,6:
• Automatic calculation of a brain mask • Ability to add or subtract mask areas manually • Ability to add or subtract segmented arteries • Ability to add or subtract segmented veins • Automatic calculation of the average of all potential AIF points • Automatic calculation of the average of all potential VOF points • Automatic calculation of the brain symmetry plane • Automatic motion correction • Automatic calculation of DSC perfusion maps based on input data, including:
• rCBV
• rCBF
• TTP
• MTT
Vue PACS MR Perfusion User Guide Unrestricted Internal Use
AE9362 C Uncontrolled unless otherwise indicated Page: 10 of 43
Vue PACS MR Perfusion User Guide - AE9362.docx
• TMAX
• Calculation of a k2 permeability map • Corrected maps based on the k2 maps
For further details on the diffusion and perfusion maps, see Section 5 Viewing Diffusion Series and Section 6.3 Working with Perfusion Maps.
• Ability to add ROIs • Automatic selection of the affected hemisphere of the brain • Segmentation of two ischemic regions marked as Lesion and Hypoperfusion. The
segmentation of each region is based on thresholds and parameters configurable by the user. • Show calculated information in tabular form
NOTE: The values for blood volume and blood flow are shown in relative units up to an arbitrary multiplicative constant. Relative units are used because partial volume effects and other measurement limitations prevent absolute quantification.
Vue PACS MR Perfusion User Guide Unrestricted Internal Use
AE9362 C Uncontrolled unless otherwise indicated Page: 11 of 43
Vue PACS MR Perfusion User Guide - AE9362.docx
3. Application Workflow An MR study may include diffusion series, perfusion series, or both diffusion and perfusion series.
For the diffusion series, the following steps are performed:
1. Automatic calculation of the brain mask—Executed automatically by the application while allowing manual corrections by the user.
2. Displaying of the original image data and calculated maps—executed automatically by the application.
For DWI series—ADC and eADC maps + the original data
For DTI series—ADC, eADC, DWI, Ax diff, Rad diff, FA, VR, and FA dir maps + the original data
NOTE: The specific maps that appear are configurable. Contact your system administrator to specify which maps will be displayed.
3. Calculation of diffusion parameters for ROIs drawn manually by the operator. These measurements are displayed in a table.
For the perfusion series, the application segments the arteries and veins in order to calculate AIF and VOF signals, identifies the brain centerline, and marks the results on a standard Temporal Minimum Intensity Projection (TMIN) series.
Based on this data, the user can initiate the perfusion calculations, the results of which are displayed in a set of maps. Measurements of parameters for specific Regions of Interest (ROIs) are presented in tables.
Finally, a segmentation of the Lesion and Hypoperfusion areas is marked on the TMIN image.
A typical workflow includes the following automatic and manual steps:
1. Loading of the study to the MR Perfusion application—executed by the user.
2. AIF Indication—Executed automatically by the application while allowing manual corrections by the user.
3. VOF Indication—Executed automatically by the application while allowing manual corrections by the user.
4. Identification of the brain center line—Executed automatically by the application while allowing manual corrections by the user (calculated and shown already for the diffusion series).
5. Automatic calculation of a brain mask (calculated and shown already for the diffusion series).
6. Automatic calculation of a TMIN series.
7. Motion correction.
8. Calculation of the perfusion parameters—rCBV, rCBF, TTP, MTT, TMAX and k2.
The parameters are calculated automatically by the application and displayed as a set of perfusion maps.
9. Measurement of the above parameters for ROIs drawn manually by the operator. These measurements are displayed in a table.
10. Segmentation of two ischemic regions marked as Lesion and Hypoperfusion. The segmentation of each region is based on thresholds and parameters configurable by the user (see Section 8 Using Settings).
Vue PACS MR Perfusion User Guide Unrestricted Internal Use
AE9362 C Uncontrolled unless otherwise indicated Page: 12 of 43
Vue PACS MR Perfusion User Guide - AE9362.docx
4. Loading the Study To load an MR perfusion study –
1. In the Vue PACS client, highlight the study in the Archive Explorer.
2. Select one of the following from the right-click menu:
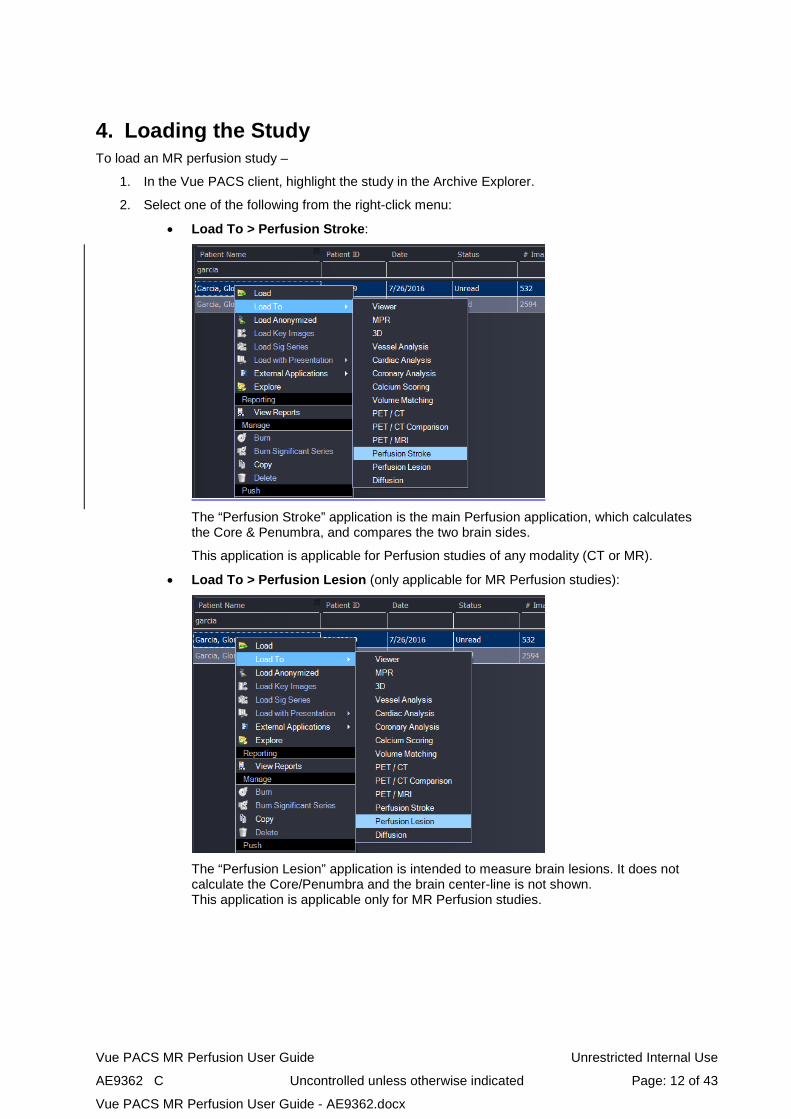
• Load To > Perfusion Stroke:
The “Perfusion Stroke” application is the main Perfusion application, which calculates the Core & Penumbra, and compares the two brain sides.
This application is applicable for Perfusion studies of any modality (CT or MR).
• Load To > Perfusion Lesion (only applicable for MR Perfusion studies):
The “Perfusion Lesion” application is intended to measure brain lesions. It does not calculate the Core/Penumbra and the brain center-line is not shown. This application is applicable only for MR Perfusion studies.
Vue PACS MR Perfusion User Guide Unrestricted Internal Use
AE9362 C Uncontrolled unless otherwise indicated Page: 13 of 43
Vue PACS MR Perfusion User Guide - AE9362.docx
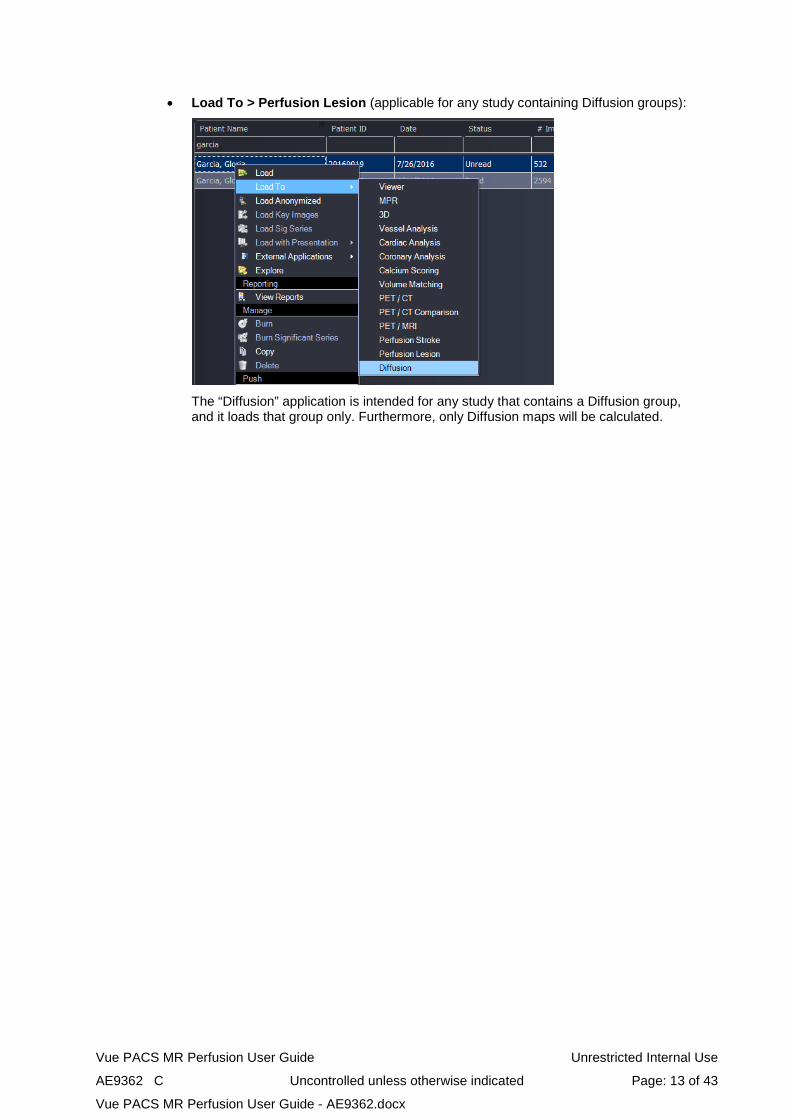
• Load To > Perfusion Lesion (applicable for any study containing Diffusion groups):
The “Diffusion” application is intended for any study that contains a Diffusion group, and it loads that group only. Furthermore, only Diffusion maps will be calculated.
Vue PACS MR Perfusion User Guide Unrestricted Internal Use
AE9362 C Uncontrolled unless otherwise indicated Page: 14 of 43
Vue PACS MR Perfusion User Guide - AE9362.docx
5. Initial Display When the study loads, the screen displays the perfusion and/or diffusion data (depending on whether the study contains perfusion series only, diffusion series only, or diffusion and perfusion series) as well as a ribbon with tools to help you control the workflow and add manual calculations.
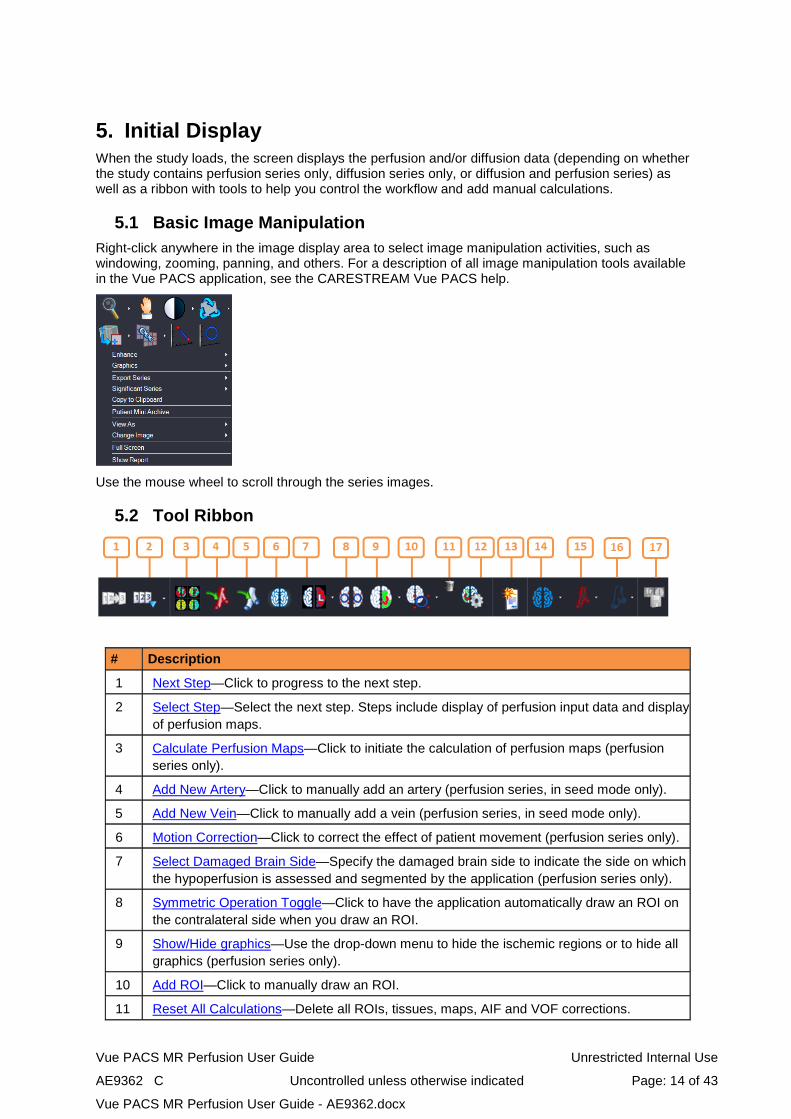
5.1 Basic Image Manipulation Right-click anywhere in the image display area to select image manipulation activities, such as windowing, zooming, panning, and others. For a description of all image manipulation tools available in the Vue PACS application, see the CARESTREAM Vue PACS help.
Use the mouse wheel to scroll through the series images.
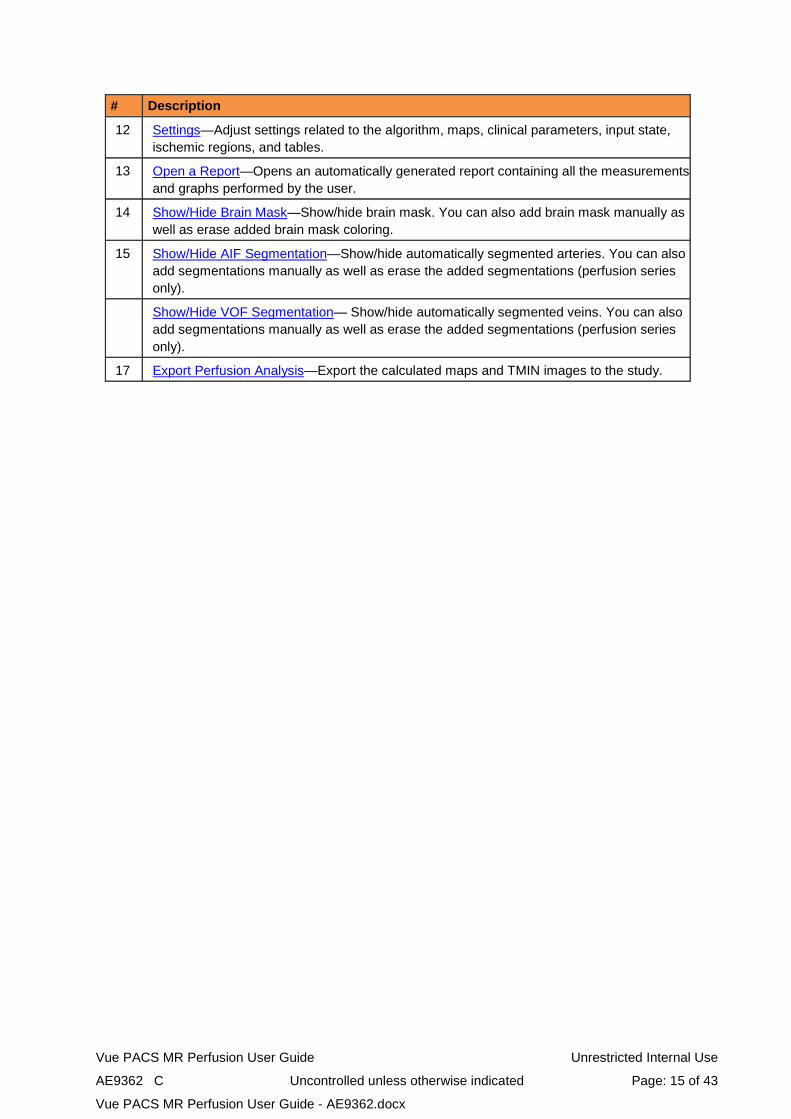
5.2 Tool Ribbon
# Description
1 Next Step—Click to progress to the next step.
2 Select Step—Select the next step. Steps include display of perfusion input data and display of perfusion maps.
3 Calculate Perfusion Maps—Click to initiate the calculation of perfusion maps (perfusion series only).
4 Add New Artery—Click to manually add an artery (perfusion series, in seed mode only).
5 Add New Vein—Click to manually add a vein (perfusion series, in seed mode only).
6 Motion Correction—Click to correct the effect of patient movement (perfusion series only).
7 Select Damaged Brain Side—Specify the damaged brain side to indicate the side on which the hypoperfusion is assessed and segmented by the application (perfusion series only).
8 Symmetric Operation Toggle—Click to have the application automatically draw an ROI on the contralateral side when you draw an ROI.
9 Show/Hide graphics—Use the drop-down menu to hide the ischemic regions or to hide all graphics (perfusion series only).
10 Add ROI—Click to manually draw an ROI.
11 Reset All Calculations—Delete all ROIs, tissues, maps, AIF and VOF corrections.
Vue PACS MR Perfusion User Guide Unrestricted Internal Use
AE9362 C Uncontrolled unless otherwise indicated Page: 15 of 43
Vue PACS MR Perfusion User Guide - AE9362.docx
# Description
12 Settings—Adjust settings related to the algorithm, maps, clinical parameters, input state, ischemic regions, and tables.
13 Open a Report—Opens an automatically generated report containing all the measurements and graphs performed by the user.
14 Show/Hide Brain Mask—Show/hide brain mask. You can also add brain mask manually as well as erase added brain mask coloring.
15 Show/Hide AIF Segmentation—Show/hide automatically segmented arteries. You can also add segmentations manually as well as erase the added segmentations (perfusion series only).
Show/Hide VOF Segmentation— Show/hide automatically segmented veins. You can also add segmentations manually as well as erase the added segmentations (perfusion series only).
17 Export Perfusion Analysis—Export the calculated maps and TMIN images to the study.
Vue PACS MR Perfusion User Guide Unrestricted Internal Use
AE9362 C Uncontrolled unless otherwise indicated Page: 16 of 43
Vue PACS MR Perfusion User Guide - AE9362.docx
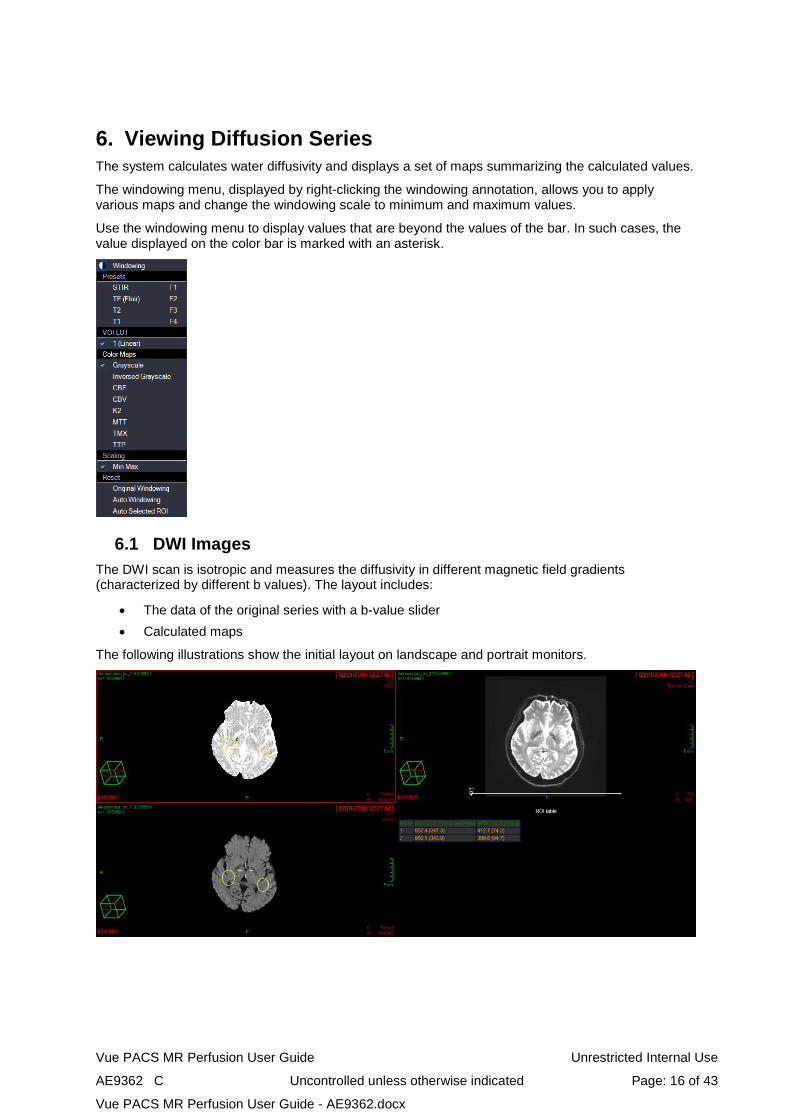
6. Viewing Diffusion Series The system calculates water diffusivity and displays a set of maps summarizing the calculated values.
The windowing menu, displayed by right-clicking the windowing annotation, allows you to apply various maps and change the windowing scale to minimum and maximum values.
Use the windowing menu to display values that are beyond the values of the bar. In such cases, the value displayed on the color bar is marked with an asterisk.
6.1 DWI Images The DWI scan is isotropic and measures the diffusivity in different magnetic field gradients (characterized by different b values). The layout includes:
• The data of the original series with a b-value slider • Calculated maps
The following illustrations show the initial layout on landscape and portrait monitors.
Vue PACS MR Perfusion User Guide Unrestricted Internal Use
AE9362 C Uncontrolled unless otherwise indicated Page: 17 of 43
Vue PACS MR Perfusion User Guide - AE9362.docx
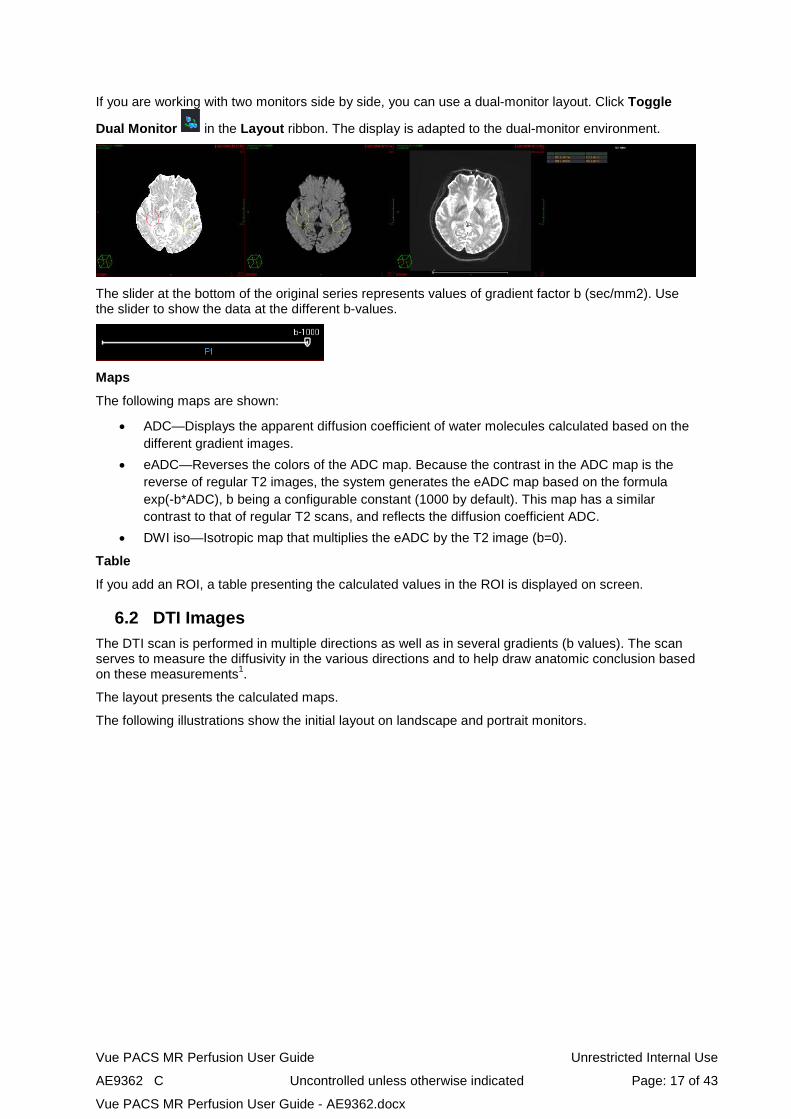
If you are working with two monitors side by side, you can use a dual-monitor layout. Click Toggle
Dual Monitor in the Layout ribbon. The display is adapted to the dual-monitor environment.
The slider at the bottom of the original series represents values of gradient factor b (sec/mm2). Use the slider to show the data at the different b-values.
Maps
The following maps are shown:
• ADC—Displays the apparent diffusion coefficient of water molecules calculated based on the different gradient images.
• eADC—Reverses the colors of the ADC map. Because the contrast in the ADC map is the reverse of regular T2 images, the system generates the eADC map based on the formula exp(-b*ADC), b being a configurable constant (1000 by default). This map has a similar contrast to that of regular T2 scans, and reflects the diffusion coefficient ADC.
• DWI iso—Isotropic map that multiplies the eADC by the T2 image (b=0).
Table
If you add an ROI, a table presenting the calculated values in the ROI is displayed on screen.
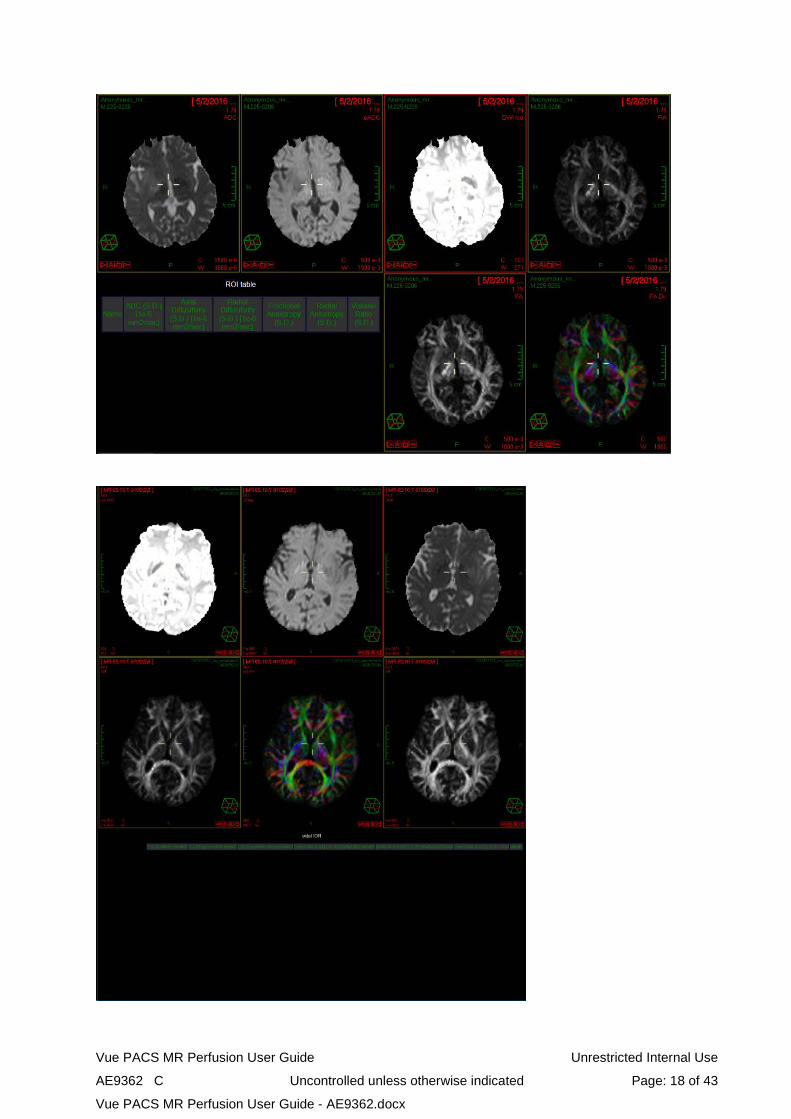
6.2 DTI Images The DTI scan is performed in multiple directions as well as in several gradients (b values). The scan serves to measure the diffusivity in the various directions and to help draw anatomic conclusion based on these measurements1.
The layout presents the calculated maps.
The following illustrations show the initial layout on landscape and portrait monitors.
Vue PACS MR Perfusion User Guide Unrestricted Internal Use
AE9362 C Uncontrolled unless otherwise indicated Page: 18 of 43
Vue PACS MR Perfusion User Guide - AE9362.docx
Vue PACS MR Perfusion User Guide Unrestricted Internal Use
AE9362 C Uncontrolled unless otherwise indicated Page: 19 of 43
Vue PACS MR Perfusion User Guide - AE9362.docx
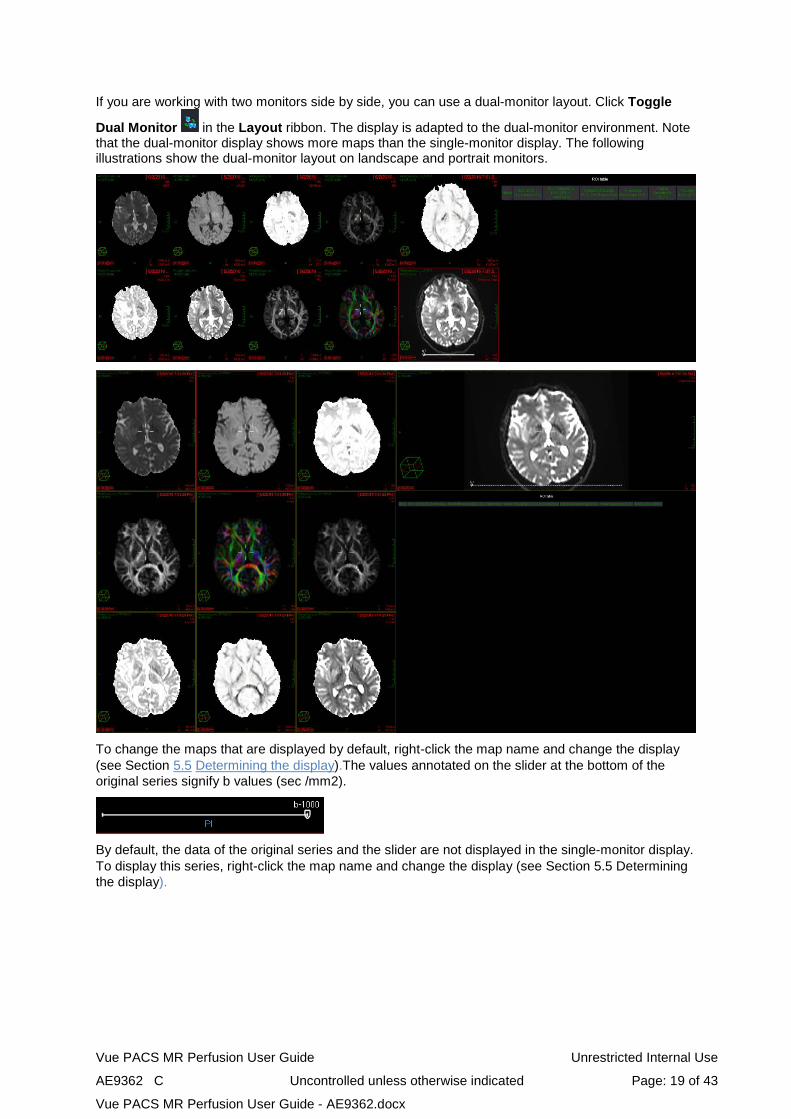
If you are working with two monitors side by side, you can use a dual-monitor layout. Click Toggle
Dual Monitor in the Layout ribbon. The display is adapted to the dual-monitor environment. Note that the dual-monitor display shows more maps than the single-monitor display. The following illustrations show the dual-monitor layout on landscape and portrait monitors.
To change the maps that are displayed by default, right-click the map name and change the display (see Section 5.5 Determining the display).The values annotated on the slider at the bottom of the original series signify b values (sec /mm2).
By default, the data of the original series and the slider are not displayed in the single-monitor display. To display this series, right-click the map name and change the display (see Section 5.5 Determining the display).

Vue PACS MR Perfusion User Guide Unrestricted Internal Use
AE9362 C Uncontrolled unless otherwise indicated Page: 20 of 43
Vue PACS MR Perfusion User Guide - AE9362.docx
Maps
Based on the various diffusivity measures, the system generates a diffusion tensor and calculates the tensor’s eigenvalues λ1, λ 2, λ 3 (λ 1 > λ 2 > λ 3) and eigenvectors V1, V2, V3 respectively.
The following maps are shown:
Maps reflecting isotropic diffusivity1
• ADC—Simulates the isotropic scan and is equal to the average of the eigenvalues (λ1+λ2+λ3)/3.
• eADC—Calculated by exp(-b*ADC) for a prefixed b value. • DWI—Isotropic map that multiplies the eADC by the T2 image (b=0) or by a T2 extrapolation
(in cases when there is no b=0 image or when there are several such images).
Maps reflecting anisotropic diffusivity1
• Ax diff—The largest eigenvalue (λ1) • Rad diff—The average of the two smaller eigenvalues (λ2+λ3))/2 • FA—Measures the difference between the isotropic diffusion measurement and the
directional measurement. • RA—Measures the ratio of the isotropic diffusion measurement to the directional
measurement. • FA dir—A color map, showing the color coding of the main direction of diffusivity (V1) relative
to the main axes X, Y, Z. Red indicates the main direction X, green indicates the main direction Y, and blue indicates the main direction Z. At each point, the displayed color may be either a mixture of red, green, and blue, based on the diffusion component, or only red, only green, or only blue, based on the component of the maximal value. The system may be configured to display the colors by one of these coloring options. See your system administrator to change the coloring option.
Table
• If you add an ROI, a table presenting the calculated values in the ROI is displayed on screen.
6.3 Using the Brain Mask Correction Tool You can display and hide the brain mask in the displayed input images.
6.3.1 Displaying the Brain Mask
To display the brain mask, click the brain mask icon in the Correction Tools section of the Perfusion ribbon. The brain mask is displayed both on the TMIP and the dynamic images.
6.3.2 Adding Brain Mask To manually add brain mask on the displayed image –
1. Click Add Brain Mask in the drop-down menu of the Show/Hide Brain Mask icon.
2. Click the left mouse button at the point where you wish to start adding brain mask to the
image.
3. Drag the mouse to add brain mask.
4. Left-click the mouse again to end the brain mask addition.
Vue PACS MR Perfusion User Guide Unrestricted Internal Use
AE9362 C Uncontrolled unless otherwise indicated Page: 21 of 43
Vue PACS MR Perfusion User Guide - AE9362.docx
6.3.3 Erasing Brain Mask To erase added brain mask marking –
1. Click Erase Brain Mask in the drop-down menu of the Show/Hide Brain Mask icon.
2. Click the left mouse button at the point where you wish to start erasing brain mask which you added manually.
3. Drag the mouse to erase brain mask.
4. Left-click the mouse again to end the erasing.
NOTE: Brain mask can be manually added in all orientations.
6.4 Adding an ROI You can add an ROI on any of the maps to further investigate the diffusion parameters in specific areas.
To draw an ROI:
1. Click Add ROI .
The cursor changes to .
2. Click the image at the intended place of the ROI and then drag the mouse to draw the ellipse.
NOTE: See the system administrator for configuration of whether the initial click on the image marks the center of the ROI or a point on its perimeter.
3. Click to complete the drawing.
The calculated values of the ROI are presented in the ROI table.
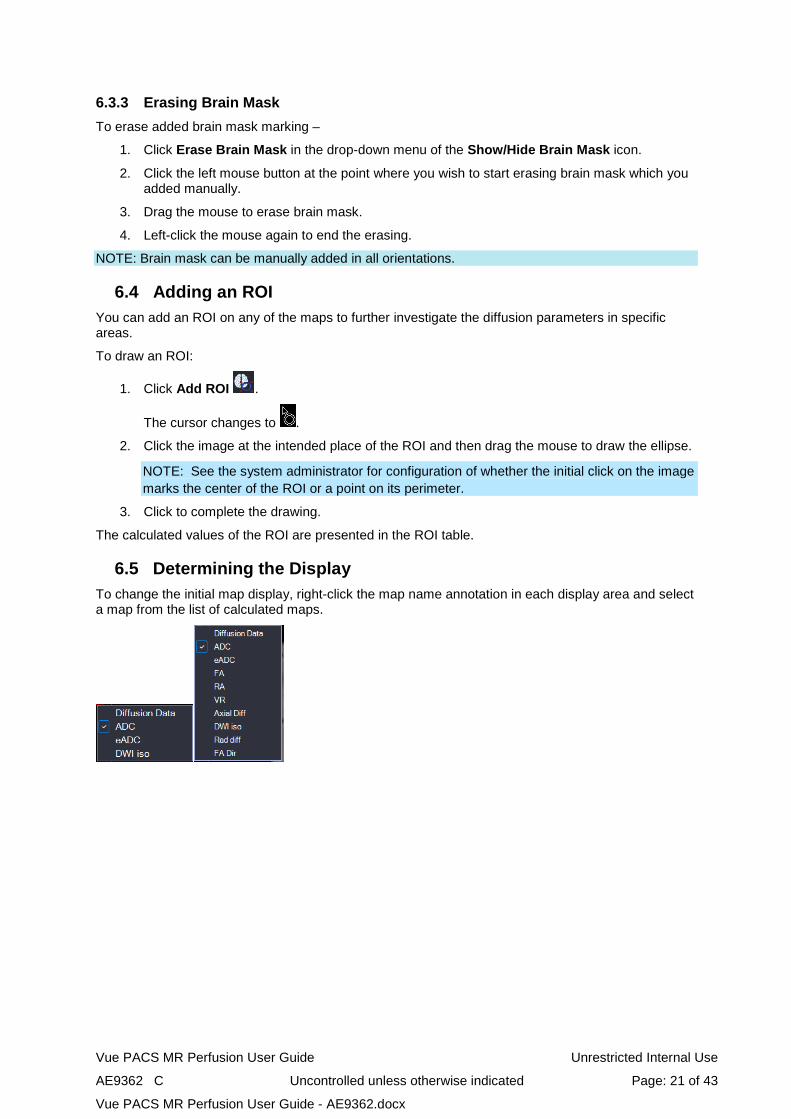
6.5 Determining the Display To change the initial map display, right-click the map name annotation in each display area and select a map from the list of calculated maps.
Vue PACS MR Perfusion User Guide Unrestricted Internal Use
AE9362 C Uncontrolled unless otherwise indicated Page: 22 of 43
Vue PACS MR Perfusion User Guide - AE9362.docx
7. Perfusion Series When a perfusion series is loaded, the perfusion input data is displayed first, and then you continue to map calculation.
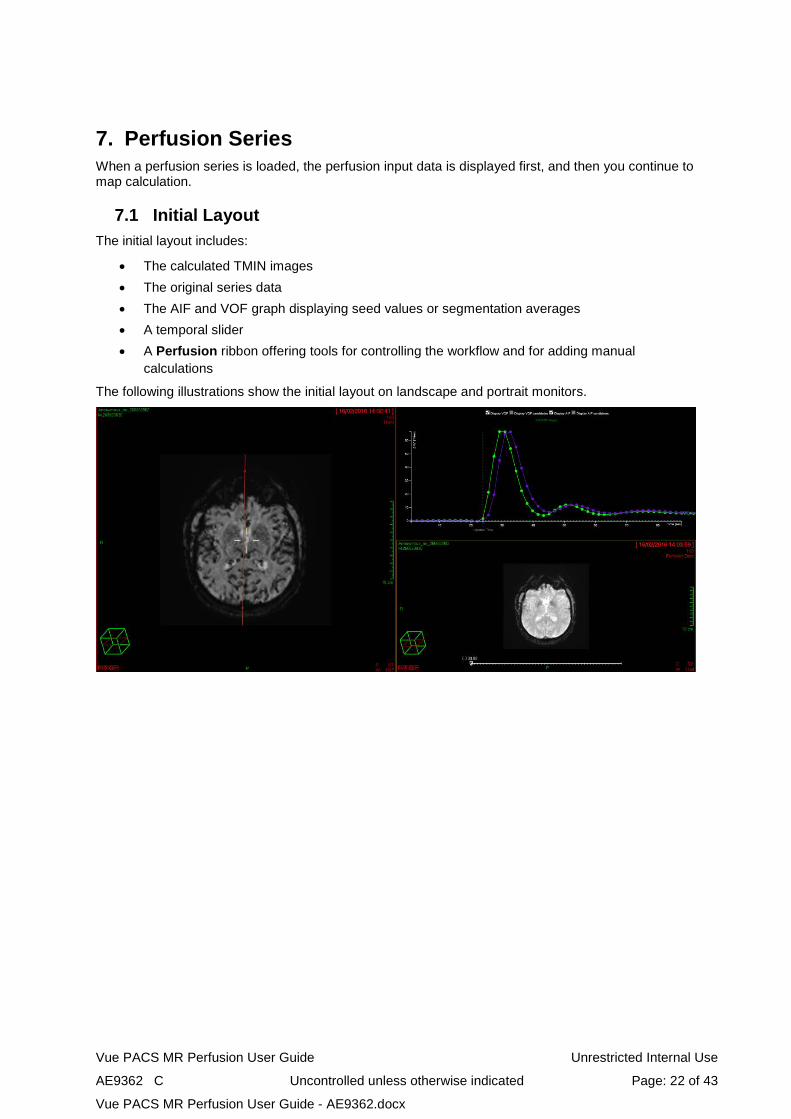
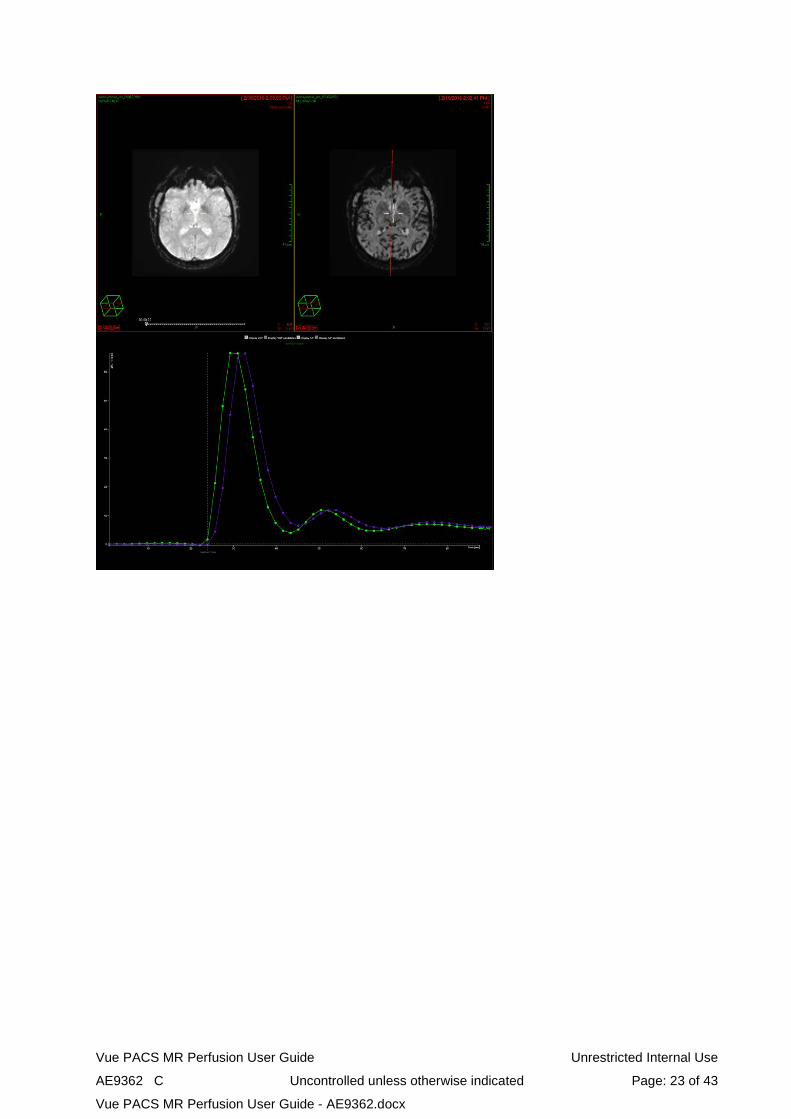
7.1 Initial Layout The initial layout includes:
• The calculated TMIN images • The original series data • The AIF and VOF graph displaying seed values or segmentation averages • A temporal slider • A Perfusion ribbon offering tools for controlling the workflow and for adding manual
calculations
The following illustrations show the initial layout on landscape and portrait monitors.
Vue PACS MR Perfusion User Guide Unrestricted Internal Use
AE9362 C Uncontrolled unless otherwise indicated Page: 23 of 43
Vue PACS MR Perfusion User Guide - AE9362.docx
Vue PACS MR Perfusion User Guide Unrestricted Internal Use
AE9362 C Uncontrolled unless otherwise indicated Page: 24 of 43
Vue PACS MR Perfusion User Guide - AE9362.docx
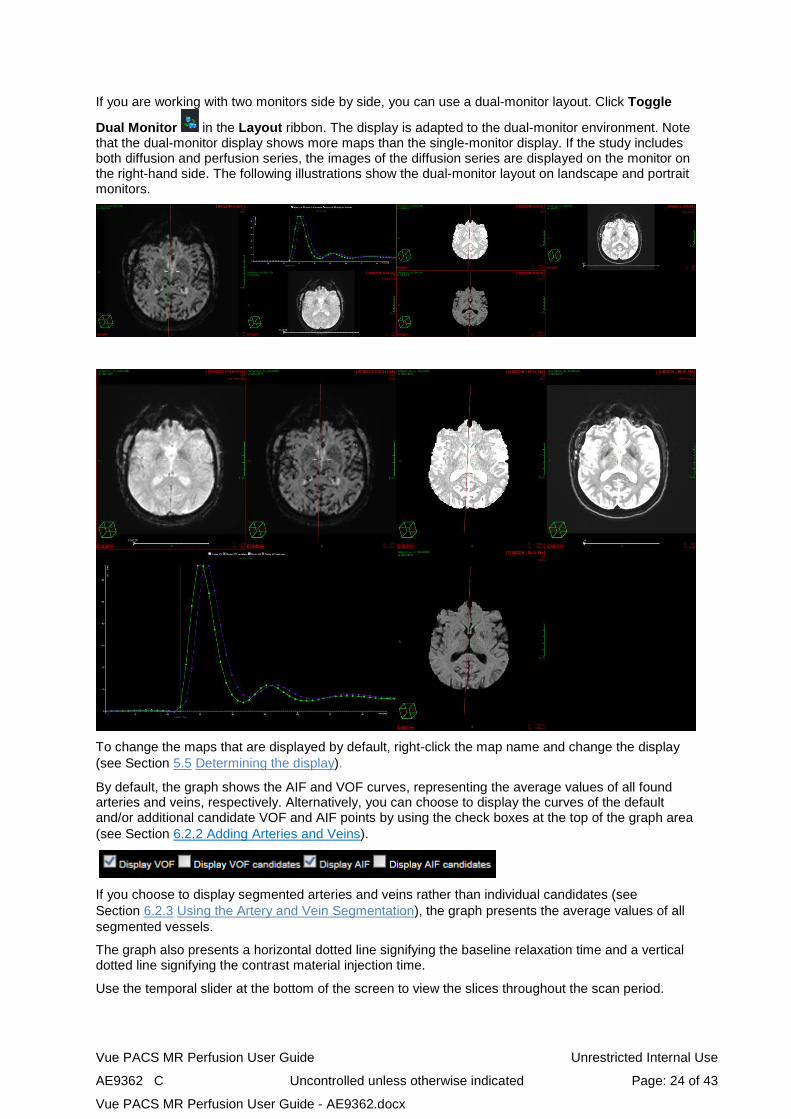
If you are working with two monitors side by side, you can use a dual-monitor layout. Click Toggle
Dual Monitor in the Layout ribbon. The display is adapted to the dual-monitor environment. Note that the dual-monitor display shows more maps than the single-monitor display. If the study includes both diffusion and perfusion series, the images of the diffusion series are displayed on the monitor on the right-hand side. The following illustrations show the dual-monitor layout on landscape and portrait monitors.
To change the maps that are displayed by default, right-click the map name and change the display (see Section 5.5 Determining the display).
By default, the graph shows the AIF and VOF curves, representing the average values of all found arteries and veins, respectively. Alternatively, you can choose to display the curves of the default and/or additional candidate VOF and AIF points by using the check boxes at the top of the graph area (see Section 6.2.2 Adding Arteries and Veins).
If you choose to display segmented arteries and veins rather than individual candidates (see Section 6.2.3 Using the Artery and Vein Segmentation), the graph presents the average values of all segmented vessels.
The graph also presents a horizontal dotted line signifying the baseline relaxation time and a vertical dotted line signifying the contrast material injection time.
Use the temporal slider at the bottom of the screen to view the slices throughout the scan period.
Vue PACS MR Perfusion User Guide Unrestricted Internal Use
AE9362 C Uncontrolled unless otherwise indicated Page: 25 of 43
Vue PACS MR Perfusion User Guide - AE9362.docx
7.2 Calculating Perfusion Input Values When you initially load the study, the application automatically calculates values that serve as a basis for the perfusion calculation. You can manually correct the results to improve your reading accuracy.
7.2.1 Identifying the AIF and VOF The application automatically segments arteries and veins to identify candidate AIF and VOF curves that are to be used for the analysis5.
NOTE: The artery and vein marks do not necessarily appear on the same slice.
The graph shows the deviation of the spin-spin relaxation rate (ΔR2) from its baseline value throughout the scan for each marked artery (Ai) and vein (Vi), as well as the average graph for the resulting AIF and VOF2,3,4.
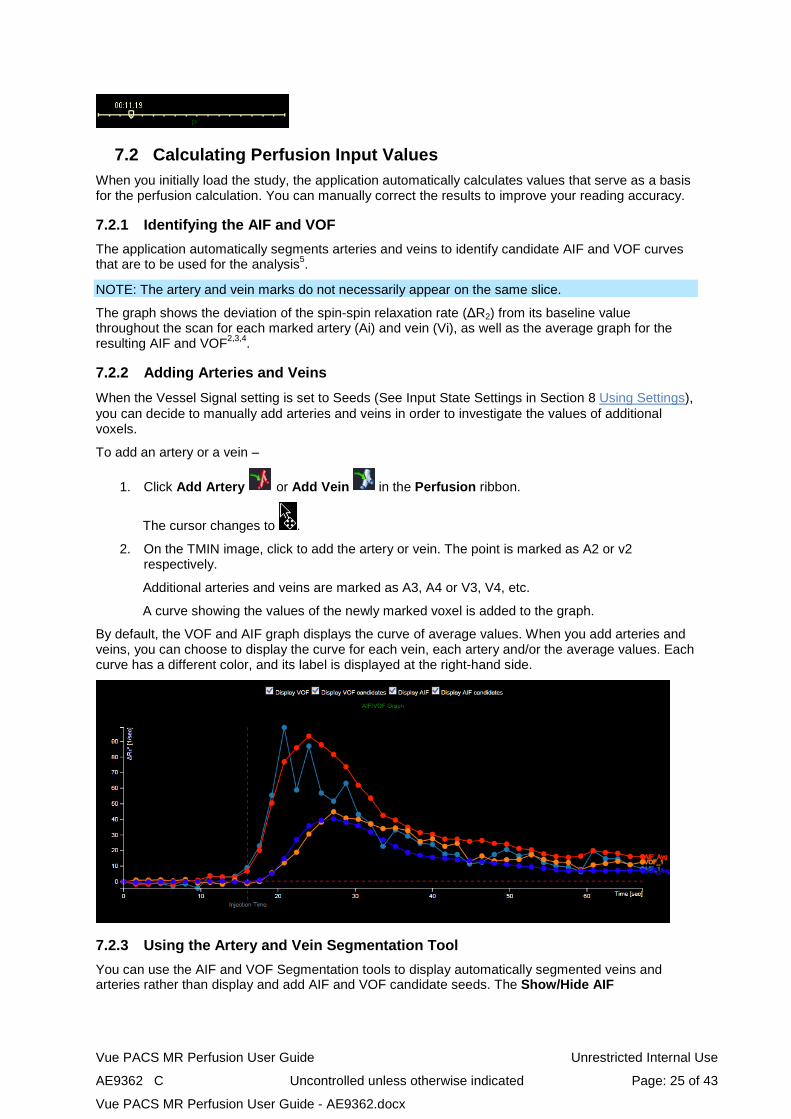
7.2.2 Adding Arteries and Veins When the Vessel Signal setting is set to Seeds (See Input State Settings in Section 8 Using Settings), you can decide to manually add arteries and veins in order to investigate the values of additional voxels.
To add an artery or a vein –
1. Click Add Artery or Add Vein in the Perfusion ribbon.
The cursor changes to .
2. On the TMIN image, click to add the artery or vein. The point is marked as A2 or v2 respectively.
Additional arteries and veins are marked as A3, A4 or V3, V4, etc.
A curve showing the values of the newly marked voxel is added to the graph.
By default, the VOF and AIF graph displays the curve of average values. When you add arteries and veins, you can choose to display the curve for each vein, each artery and/or the average values. Each curve has a different color, and its label is displayed at the right-hand side.
7.2.3 Using the Artery and Vein Segmentation Tool You can use the AIF and VOF Segmentation tools to display automatically segmented veins and arteries rather than display and add AIF and VOF candidate seeds. The Show/Hide AIF
Vue PACS MR Perfusion User Guide Unrestricted Internal Use
AE9362 C Uncontrolled unless otherwise indicated Page: 26 of 43
Vue PACS MR Perfusion User Guide - AE9362.docx
Segmentation and Show/Hide VOF Segmentation icons in the Perfusion ribbon are enabled when the Segmentation option is selected in the Input State settings (See Section 8 Using Settings)
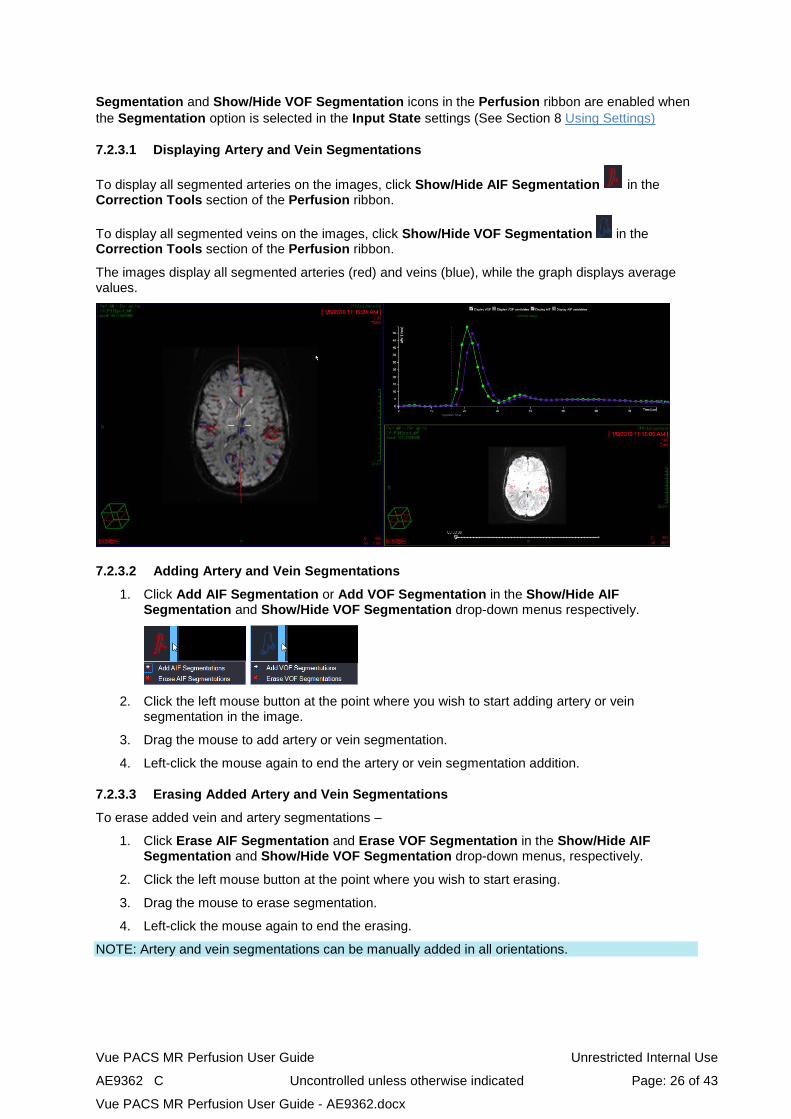
7.2.3.1 Displaying Artery and Vein Segmentations
To display all segmented arteries on the images, click Show/Hide AIF Segmentation in the Correction Tools section of the Perfusion ribbon.
To display all segmented veins on the images, click Show/Hide VOF Segmentation in the Correction Tools section of the Perfusion ribbon.
The images display all segmented arteries (red) and veins (blue), while the graph displays average values.
7.2.3.2 Adding Artery and Vein Segmentations
1. Click Add AIF Segmentation or Add VOF Segmentation in the Show/Hide AIF Segmentation and Show/Hide VOF Segmentation drop-down menus respectively.
2. Click the left mouse button at the point where you wish to start adding artery or vein
segmentation in the image.
3. Drag the mouse to add artery or vein segmentation.
4. Left-click the mouse again to end the artery or vein segmentation addition.
7.2.3.3 Erasing Added Artery and Vein Segmentations
To erase added vein and artery segmentations –
1. Click Erase AIF Segmentation and Erase VOF Segmentation in the Show/Hide AIF Segmentation and Show/Hide VOF Segmentation drop-down menus, respectively.
2. Click the left mouse button at the point where you wish to start erasing.
3. Drag the mouse to erase segmentation.
4. Left-click the mouse again to end the erasing.
NOTE: Artery and vein segmentations can be manually added in all orientations.
Vue PACS MR Perfusion User Guide Unrestricted Internal Use
AE9362 C Uncontrolled unless otherwise indicated Page: 27 of 43
Vue PACS MR Perfusion User Guide - AE9362.docx
7.2.4 Using the Brain Mask Correction Tool You can display and hide the brain mask in the input images. Additionally, you can correct the displayed brain mask by manually adding to the brain mask display as well as erasing the addition.
7.2.4.1 Displaying the Brain Mask
To display the brain mask, click the brain mask icon in the Correction Tools section of the Perfusion ribbon. The brain mask is displayed both on the TMIP and the dynamic images.
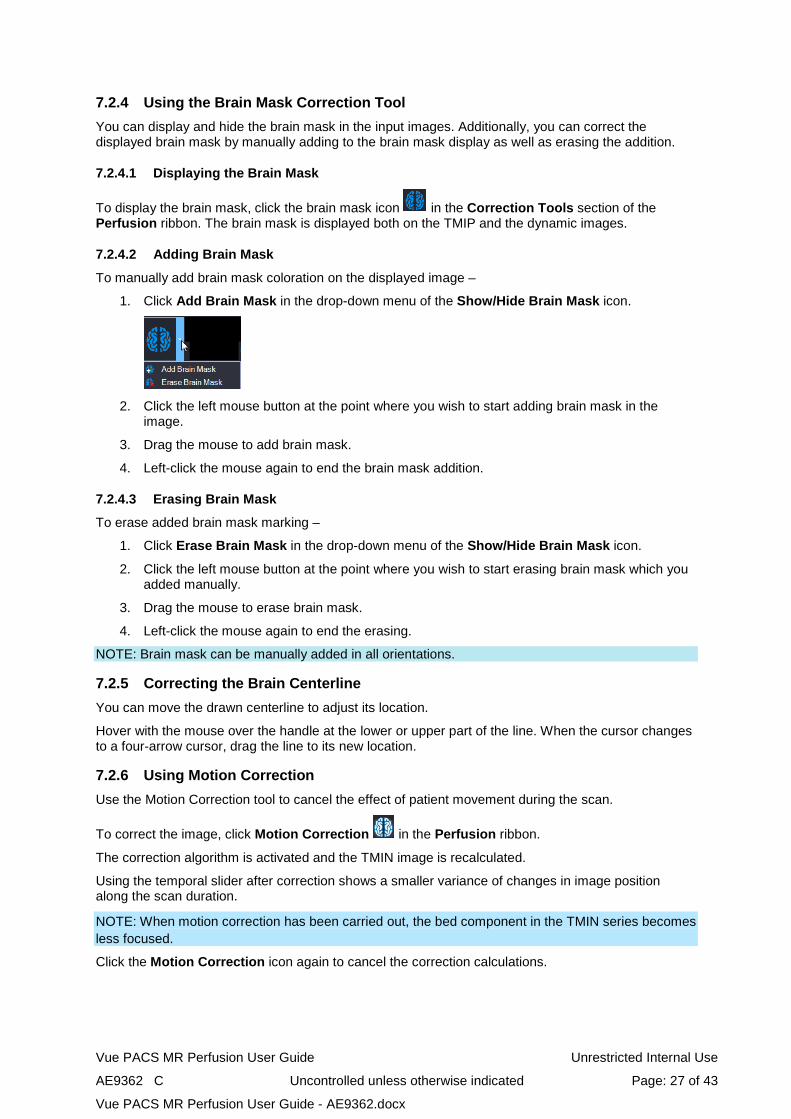
7.2.4.2 Adding Brain Mask
To manually add brain mask coloration on the displayed image –
1. Click Add Brain Mask in the drop-down menu of the Show/Hide Brain Mask icon.
2. Click the left mouse button at the point where you wish to start adding brain mask in the
image.
3. Drag the mouse to add brain mask.
4. Left-click the mouse again to end the brain mask addition.
7.2.4.3 Erasing Brain Mask
To erase added brain mask marking –
1. Click Erase Brain Mask in the drop-down menu of the Show/Hide Brain Mask icon.
2. Click the left mouse button at the point where you wish to start erasing brain mask which you added manually.
3. Drag the mouse to erase brain mask.
4. Left-click the mouse again to end the erasing.
NOTE: Brain mask can be manually added in all orientations.
7.2.5 Correcting the Brain Centerline You can move the drawn centerline to adjust its location.
Hover with the mouse over the handle at the lower or upper part of the line. When the cursor changes to a four-arrow cursor, drag the line to its new location.
7.2.6 Using Motion Correction Use the Motion Correction tool to cancel the effect of patient movement during the scan.
To correct the image, click Motion Correction in the Perfusion ribbon.
The correction algorithm is activated and the TMIN image is recalculated.
Using the temporal slider after correction shows a smaller variance of changes in image position along the scan duration.
NOTE: When motion correction has been carried out, the bed component in the TMIN series becomes less focused.
Click the Motion Correction icon again to cancel the correction calculations.
Vue PACS MR Perfusion User Guide Unrestricted Internal Use
AE9362 C Uncontrolled unless otherwise indicated Page: 28 of 43
Vue PACS MR Perfusion User Guide - AE9362.docx
7.3 Working with Perfusion Maps
7.3.1 Initiating Map Calculation When all the required data is available, the application is ready to perform the perfusion calculations and yield the perfusion maps and table data.
To initiate the perfusion calculations, do one of the following:
• Click Select Step in the Perfusion ribbon and then click the Display Maps option in the drop-down menu.
• Click Next Step in the Perfusion ribbon.
• Click Calculate Perfusion Maps in the Perfusion ribbon.
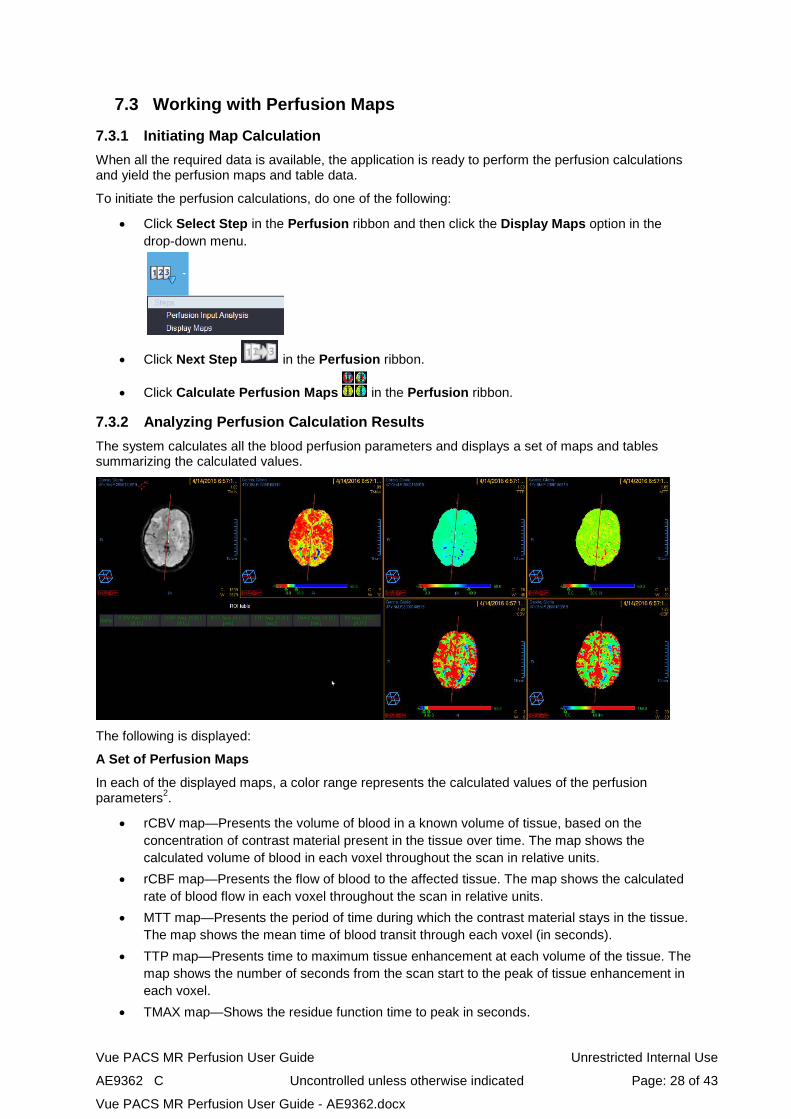
7.3.2 Analyzing Perfusion Calculation Results The system calculates all the blood perfusion parameters and displays a set of maps and tables summarizing the calculated values.
The following is displayed:
A Set of Perfusion Maps
In each of the displayed maps, a color range represents the calculated values of the perfusion parameters2.
• rCBV map—Presents the volume of blood in a known volume of tissue, based on the concentration of contrast material present in the tissue over time. The map shows the calculated volume of blood in each voxel throughout the scan in relative units.
• rCBF map—Presents the flow of blood to the affected tissue. The map shows the calculated rate of blood flow in each voxel throughout the scan in relative units.
• MTT map—Presents the period of time during which the contrast material stays in the tissue. The map shows the mean time of blood transit through each voxel (in seconds).
• TTP map—Presents time to maximum tissue enhancement at each volume of the tissue. The map shows the number of seconds from the scan start to the peak of tissue enhancement in each voxel.
• TMAX map—Shows the residue function time to peak in seconds.
Vue PACS MR Perfusion User Guide Unrestricted Internal Use
AE9362 C Uncontrolled unless otherwise indicated Page: 29 of 43
Vue PACS MR Perfusion User Guide - AE9362.docx
• k2 map—Shows a measure which is proportional to the rate of contrast material permeability across the capillaries' blood-brain barrier to the extravascular extracellular space (EES). Calculation of the map values is based on the Boxerman-Weisskoff model1. (Calculated k2 values are taken into consideration in the calculation of all other perfusion maps. You can choose to exclude k2 calculations from all perfusion calculations (see Section 8 Using Settings).
The color bar at the bottom of each map displays the minimum and maximum data values for that specific map. Two sliders represent the current windowing and allow you to change the range of displayed values.
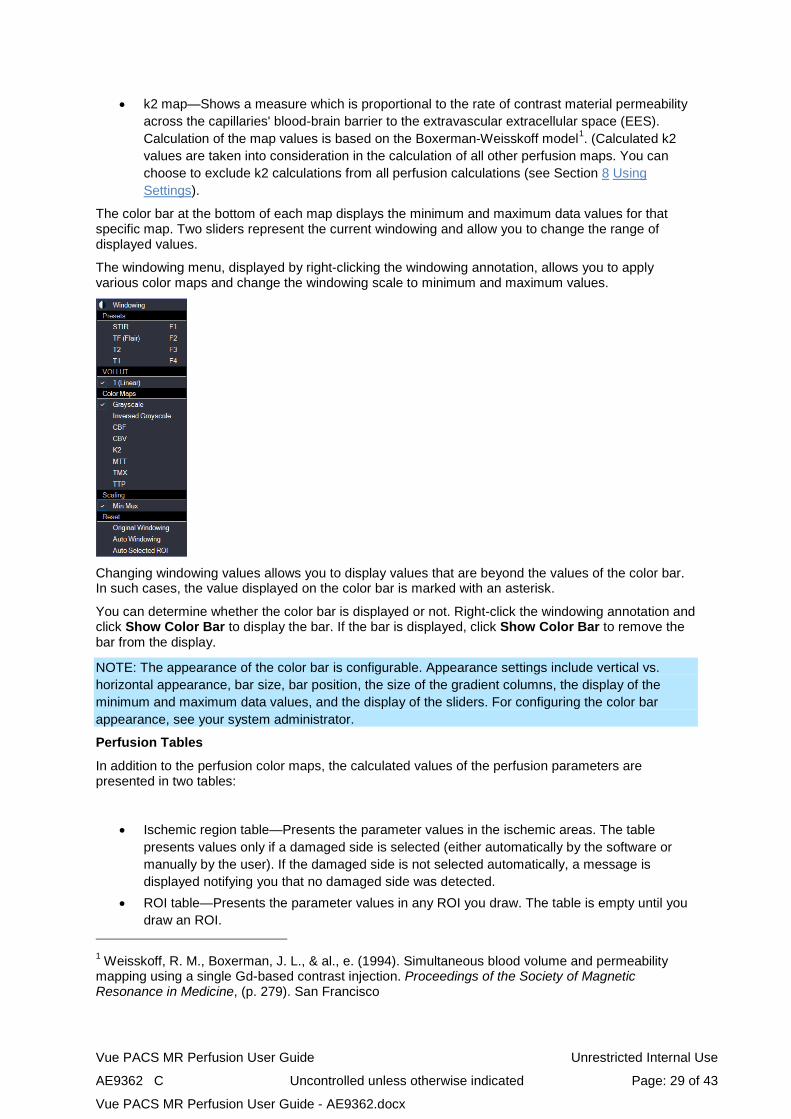
The windowing menu, displayed by right-clicking the windowing annotation, allows you to apply various color maps and change the windowing scale to minimum and maximum values.
Changing windowing values allows you to display values that are beyond the values of the color bar. In such cases, the value displayed on the color bar is marked with an asterisk.
You can determine whether the color bar is displayed or not. Right-click the windowing annotation and click Show Color Bar to display the bar. If the bar is displayed, click Show Color Bar to remove the bar from the display.
NOTE: The appearance of the color bar is configurable. Appearance settings include vertical vs. horizontal appearance, bar size, bar position, the size of the gradient columns, the display of the minimum and maximum data values, and the display of the sliders. For configuring the color bar appearance, see your system administrator.
Perfusion Tables
In addition to the perfusion color maps, the calculated values of the perfusion parameters are presented in two tables:
• Ischemic region table—Presents the parameter values in the ischemic areas. The table presents values only if a damaged side is selected (either automatically by the software or manually by the user). If the damaged side is not selected automatically, a message is displayed notifying you that no damaged side was detected.
• ROI table—Presents the parameter values in any ROI you draw. The table is empty until you draw an ROI.
1 Weisskoff, R. M., Boxerman, J. L., & al., e. (1994). Simultaneous blood volume and permeability mapping using a single Gd-based contrast injection. Proceedings of the Society of Magnetic Resonance in Medicine, (p. 279). San Francisco
Vue PACS MR Perfusion User Guide Unrestricted Internal Use
AE9362 C Uncontrolled unless otherwise indicated Page: 30 of 43
Vue PACS MR Perfusion User Guide - AE9362.docx
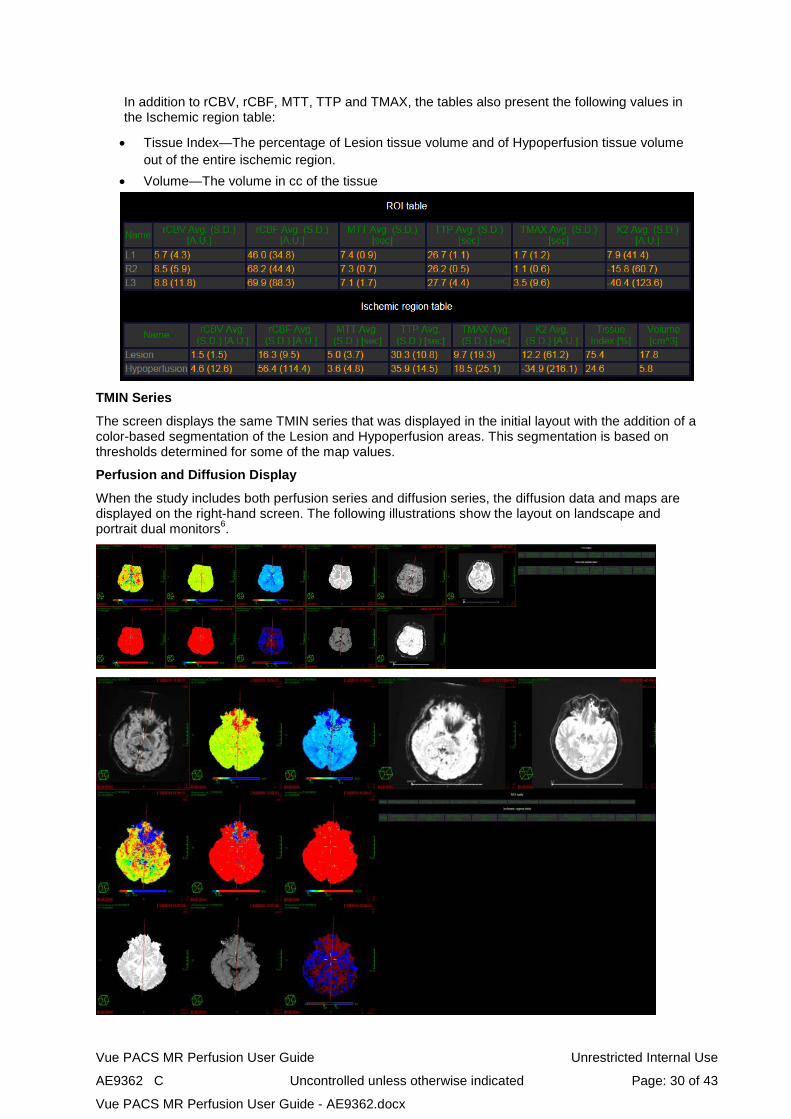
In addition to rCBV, rCBF, MTT, TTP and TMAX, the tables also present the following values in the Ischemic region table:
• Tissue Index—The percentage of Lesion tissue volume and of Hypoperfusion tissue volume out of the entire ischemic region.
• Volume—The volume in cc of the tissue
TMIN Series
The screen displays the same TMIN series that was displayed in the initial layout with the addition of a color-based segmentation of the Lesion and Hypoperfusion areas. This segmentation is based on thresholds determined for some of the map values.
Perfusion and Diffusion Display
When the study includes both perfusion series and diffusion series, the diffusion data and maps are displayed on the right-hand screen. The following illustrations show the layout on landscape and portrait dual monitors6.
Vue PACS MR Perfusion User Guide Unrestricted Internal Use
AE9362 C Uncontrolled unless otherwise indicated Page: 31 of 43
Vue PACS MR Perfusion User Guide - AE9362.docx
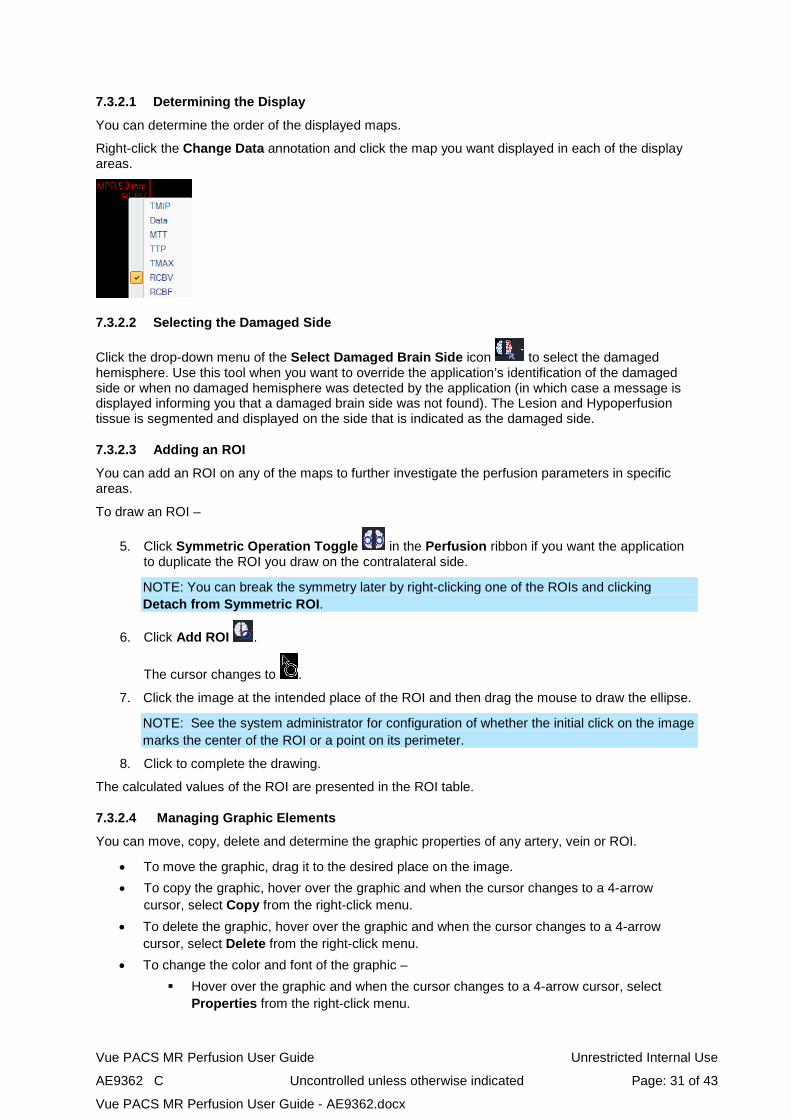
7.3.2.1 Determining the Display
You can determine the order of the displayed maps.
Right-click the Change Data annotation and click the map you want displayed in each of the display areas.
7.3.2.2 Selecting the Damaged Side
Click the drop-down menu of the Select Damaged Brain Side icon to select the damaged hemisphere. Use this tool when you want to override the application’s identification of the damaged side or when no damaged hemisphere was detected by the application (in which case a message is displayed informing you that a damaged brain side was not found). The Lesion and Hypoperfusion tissue is segmented and displayed on the side that is indicated as the damaged side.
7.3.2.3 Adding an ROI
You can add an ROI on any of the maps to further investigate the perfusion parameters in specific areas.
To draw an ROI –
5. Click Symmetric Operation Toggle in the Perfusion ribbon if you want the application to duplicate the ROI you draw on the contralateral side.
NOTE: You can break the symmetry later by right-clicking one of the ROIs and clicking Detach from Symmetric ROI.
6. Click Add ROI .
The cursor changes to .
7. Click the image at the intended place of the ROI and then drag the mouse to draw the ellipse.
NOTE: See the system administrator for configuration of whether the initial click on the image marks the center of the ROI or a point on its perimeter.
8. Click to complete the drawing.
The calculated values of the ROI are presented in the ROI table.
7.3.2.4 Managing Graphic Elements
You can move, copy, delete and determine the graphic properties of any artery, vein or ROI.
• To move the graphic, drag it to the desired place on the image. • To copy the graphic, hover over the graphic and when the cursor changes to a 4-arrow
cursor, select Copy from the right-click menu. • To delete the graphic, hover over the graphic and when the cursor changes to a 4-arrow
cursor, select Delete from the right-click menu. • To change the color and font of the graphic –
Hover over the graphic and when the cursor changes to a 4-arrow cursor, select Properties from the right-click menu.
Vue PACS MR Perfusion User Guide Unrestricted Internal Use
AE9362 C Uncontrolled unless otherwise indicated Page: 32 of 43
Vue PACS MR Perfusion User Guide - AE9362.docx
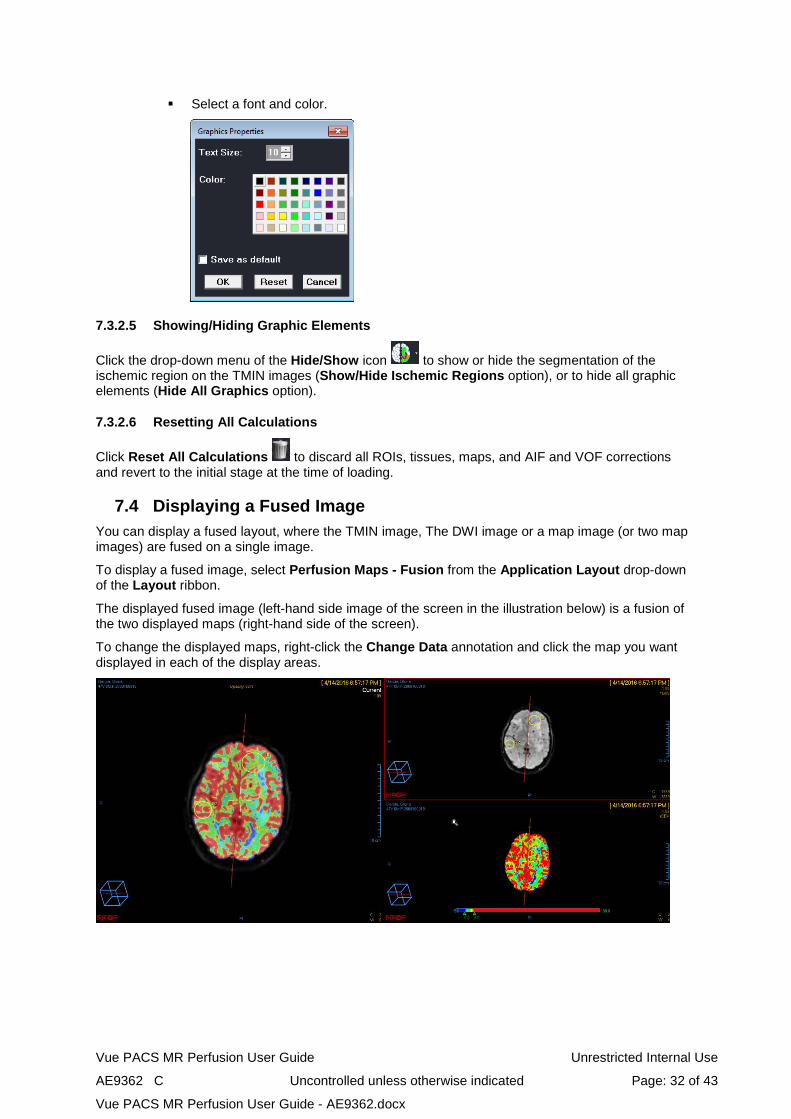
Select a font and color.
7.3.2.5 Showing/Hiding Graphic Elements
Click the drop-down menu of the Hide/Show icon to show or hide the segmentation of the ischemic region on the TMIN images (Show/Hide Ischemic Regions option), or to hide all graphic elements (Hide All Graphics option).
7.3.2.6 Resetting All Calculations
Click Reset All Calculations to discard all ROIs, tissues, maps, and AIF and VOF corrections and revert to the initial stage at the time of loading.
7.4 Displaying a Fused Image You can display a fused layout, where the TMIN image, The DWI image or a map image (or two map images) are fused on a single image.
To display a fused image, select Perfusion Maps - Fusion from the Application Layout drop-down of the Layout ribbon.
The displayed fused image (left-hand side image of the screen in the illustration below) is a fusion of the two displayed maps (right-hand side of the screen).
To change the displayed maps, right-click the Change Data annotation and click the map you want displayed in each of the display areas.
Vue PACS MR Perfusion User Guide Unrestricted Internal Use
AE9362 C Uncontrolled unless otherwise indicated Page: 33 of 43
Vue PACS MR Perfusion User Guide - AE9362.docx
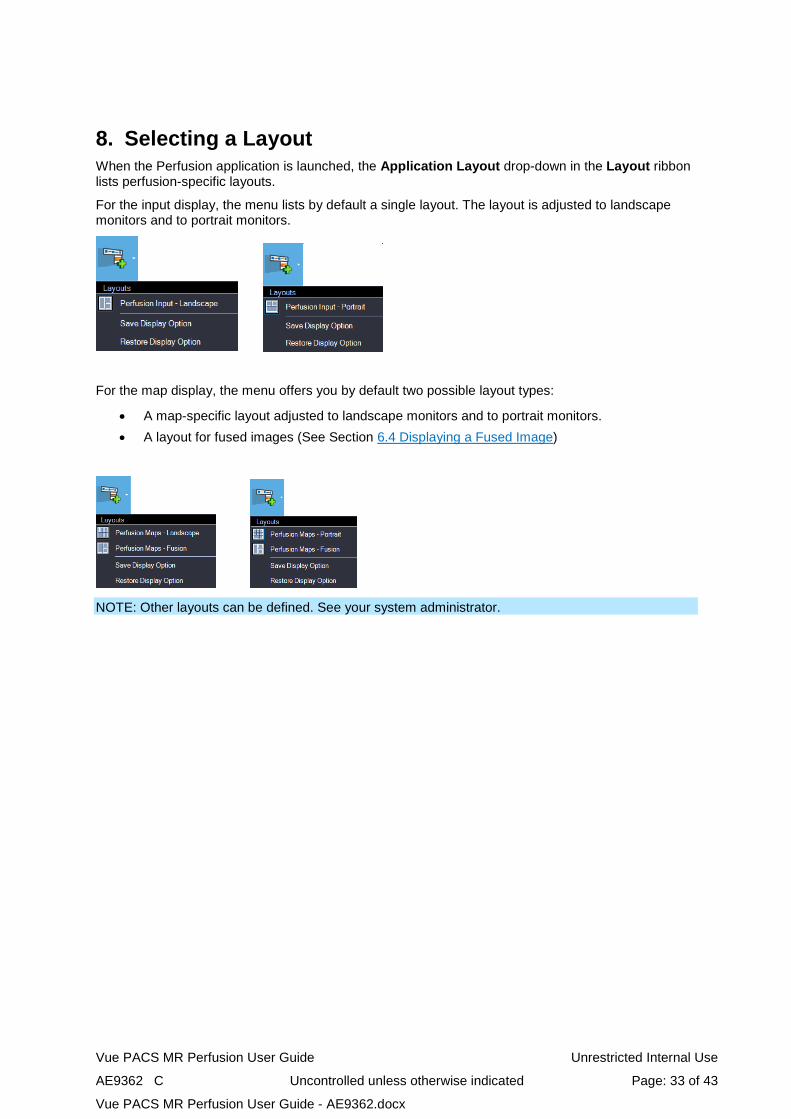
8. Selecting a Layout When the Perfusion application is launched, the Application Layout drop-down in the Layout ribbon lists perfusion-specific layouts.
For the input display, the menu lists by default a single layout. The layout is adjusted to landscape monitors and to portrait monitors.
For the map display, the menu offers you by default two possible layout types:
• A map-specific layout adjusted to landscape monitors and to portrait monitors. • A layout for fused images (See Section 6.4 Displaying a Fused Image)
NOTE: Other layouts can be defined. See your system administrator.
Vue PACS MR Perfusion User Guide Unrestricted Internal Use
AE9362 C Uncontrolled unless otherwise indicated Page: 34 of 43
Vue PACS MR Perfusion User Guide - AE9362.docx
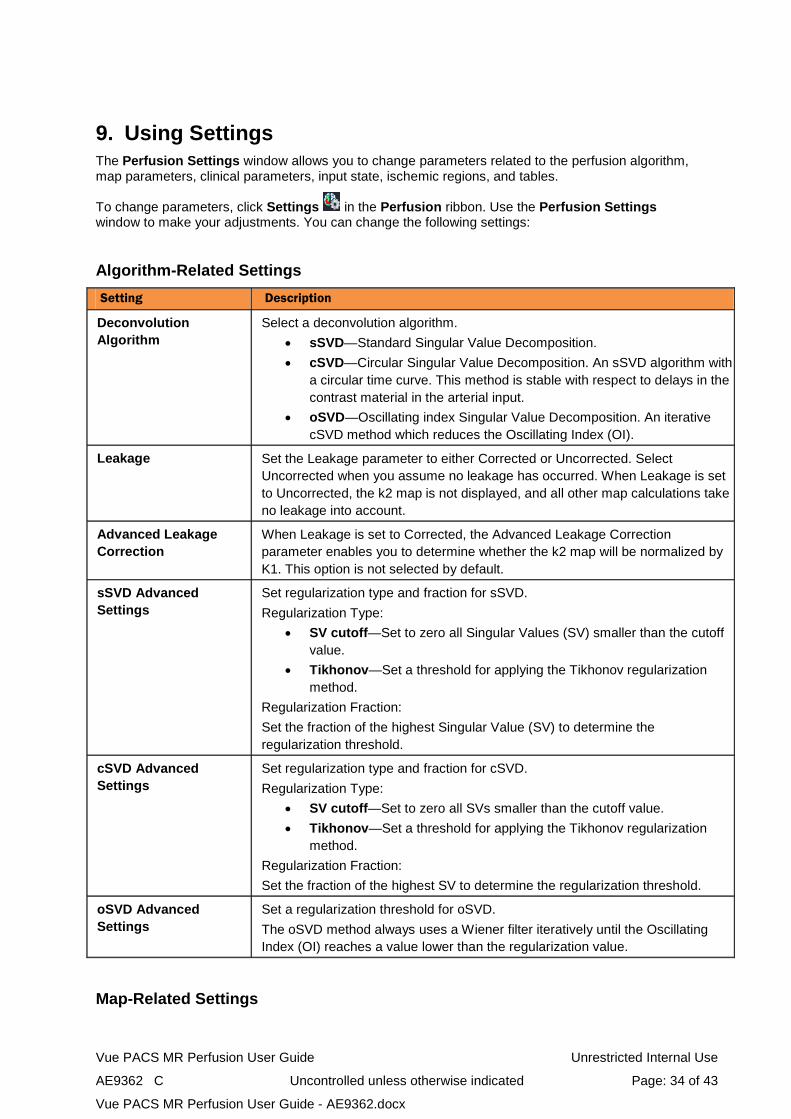
9. Using Settings The Perfusion Settings window allows you to change parameters related to the perfusion algorithm, map parameters, clinical parameters, input state, ischemic regions, and tables.
To change parameters, click Settings in the Perfusion ribbon. Use the Perfusion Settings window to make your adjustments. You can change the following settings:
Algorithm-Related Settings Setting Description
Deconvolution Algorithm
Select a deconvolution algorithm. • sSVD—Standard Singular Value Decomposition. • cSVD—Circular Singular Value Decomposition. An sSVD algorithm with
a circular time curve. This method is stable with respect to delays in the contrast material in the arterial input.
• oSVD—Oscillating index Singular Value Decomposition. An iterative cSVD method which reduces the Oscillating Index (OI).
Leakage Set the Leakage parameter to either Corrected or Uncorrected. Select Uncorrected when you assume no leakage has occurred. When Leakage is set to Uncorrected, the k2 map is not displayed, and all other map calculations take no leakage into account.
Advanced Leakage Correction
When Leakage is set to Corrected, the Advanced Leakage Correction parameter enables you to determine whether the k2 map will be normalized by K1. This option is not selected by default.
sSVD Advanced Settings
Set regularization type and fraction for sSVD. Regularization Type:
• SV cutoff—Set to zero all Singular Values (SV) smaller than the cutoff value.
• Tikhonov—Set a threshold for applying the Tikhonov regularization method.
Regularization Fraction: Set the fraction of the highest Singular Value (SV) to determine the regularization threshold.
cSVD Advanced Settings
Set regularization type and fraction for cSVD. Regularization Type:
• SV cutoff—Set to zero all SVs smaller than the cutoff value. • Tikhonov—Set a threshold for applying the Tikhonov regularization
method. Regularization Fraction: Set the fraction of the highest SV to determine the regularization threshold.
oSVD Advanced Settings
Set a regularization threshold for oSVD. The oSVD method always uses a Wiener filter iteratively until the Oscillating Index (OI) reaches a value lower than the regularization value.
Map-Related Settings
Vue PACS MR Perfusion User Guide Unrestricted Internal Use
AE9362 C Uncontrolled unless otherwise indicated Page: 35 of 43
Vue PACS MR Perfusion User Guide - AE9362.docx
Setting Description
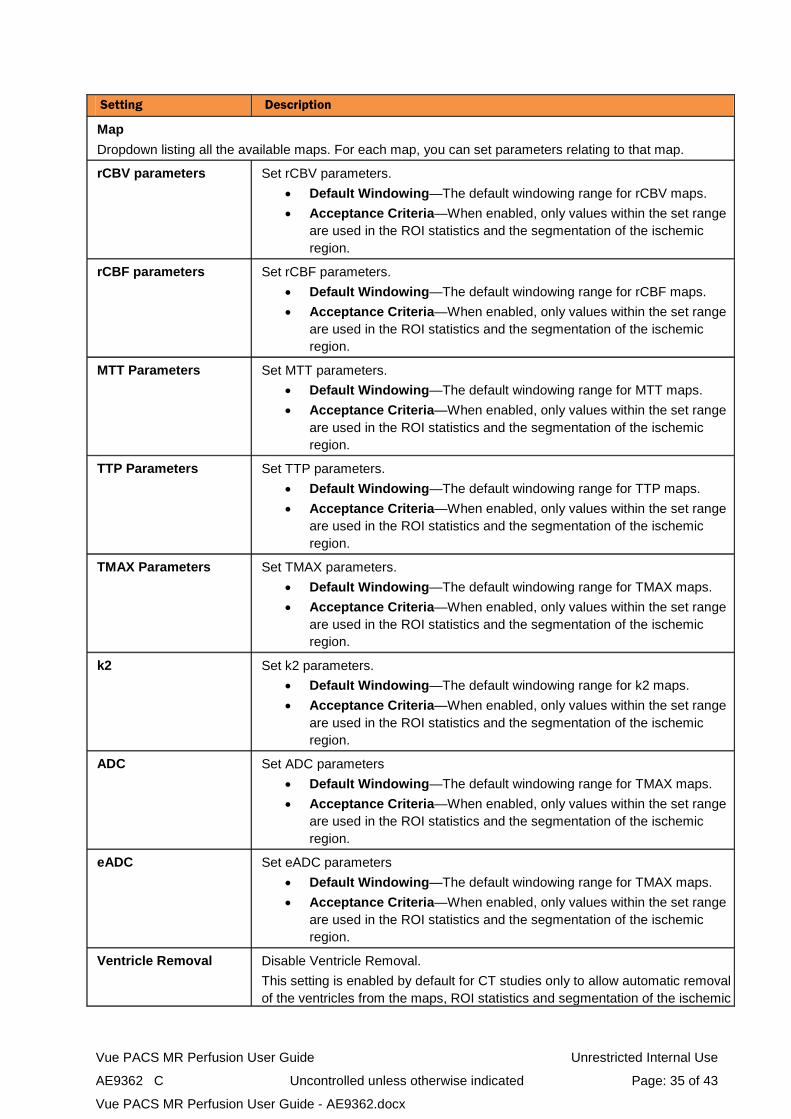
Map Dropdown listing all the available maps. For each map, you can set parameters relating to that map.
rCBV parameters Set rCBV parameters. • Default Windowing—The default windowing range for rCBV maps. • Acceptance Criteria—When enabled, only values within the set range
are used in the ROI statistics and the segmentation of the ischemic region.
rCBF parameters Set rCBF parameters. • Default Windowing—The default windowing range for rCBF maps. • Acceptance Criteria—When enabled, only values within the set range
are used in the ROI statistics and the segmentation of the ischemic region.
MTT Parameters Set MTT parameters. • Default Windowing—The default windowing range for MTT maps. • Acceptance Criteria—When enabled, only values within the set range
are used in the ROI statistics and the segmentation of the ischemic region.
TTP Parameters Set TTP parameters. • Default Windowing—The default windowing range for TTP maps. • Acceptance Criteria—When enabled, only values within the set range
are used in the ROI statistics and the segmentation of the ischemic region.
TMAX Parameters Set TMAX parameters. • Default Windowing—The default windowing range for TMAX maps. • Acceptance Criteria—When enabled, only values within the set range
are used in the ROI statistics and the segmentation of the ischemic region.
k2 Set k2 parameters. • Default Windowing—The default windowing range for k2 maps. • Acceptance Criteria—When enabled, only values within the set range
are used in the ROI statistics and the segmentation of the ischemic region.
ADC Set ADC parameters • Default Windowing—The default windowing range for TMAX maps. • Acceptance Criteria—When enabled, only values within the set range
are used in the ROI statistics and the segmentation of the ischemic region.
eADC Set eADC parameters • Default Windowing—The default windowing range for TMAX maps. • Acceptance Criteria—When enabled, only values within the set range
are used in the ROI statistics and the segmentation of the ischemic region.
Ventricle Removal Disable Ventricle Removal. This setting is enabled by default for CT studies only to allow automatic removal of the ventricles from the maps, ROI statistics and segmentation of the ischemic
Vue PACS MR Perfusion User Guide Unrestricted Internal Use
AE9362 C Uncontrolled unless otherwise indicated Page: 36 of 43
Vue PACS MR Perfusion User Guide - AE9362.docx
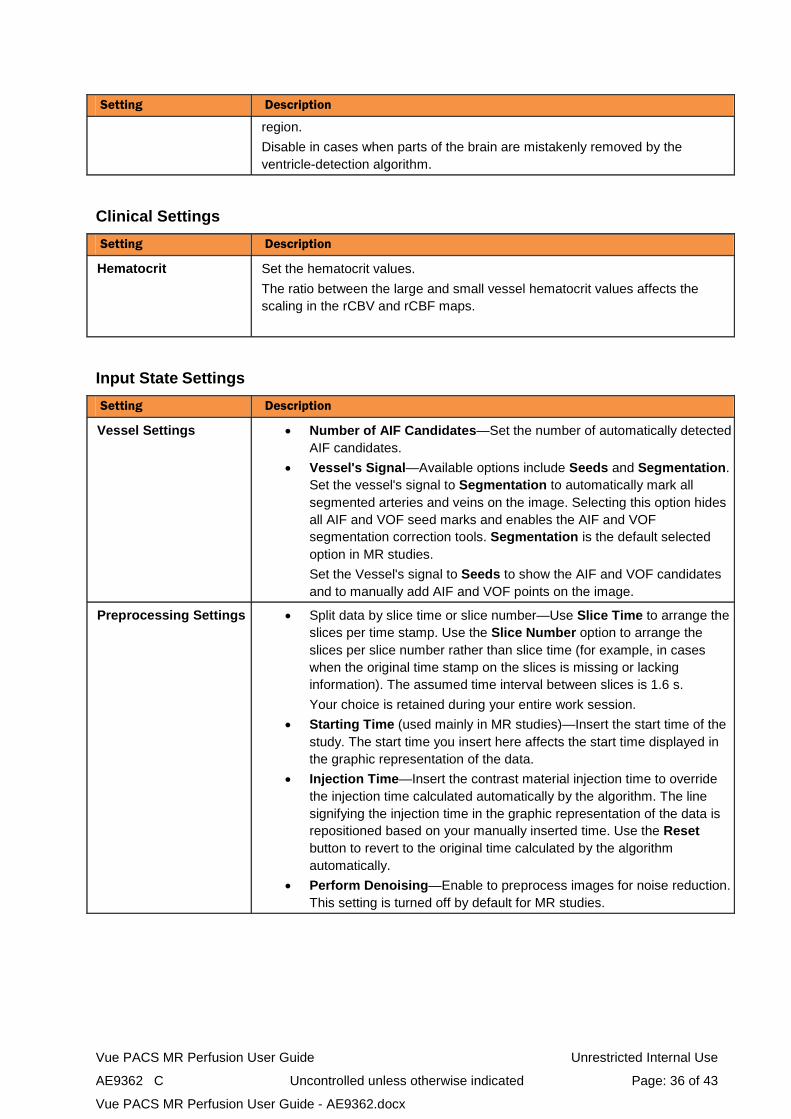
Setting Description
region. Disable in cases when parts of the brain are mistakenly removed by the ventricle-detection algorithm.
Clinical Settings
Setting Description
Hematocrit Set the hematocrit values. The ratio between the large and small vessel hematocrit values affects the scaling in the rCBV and rCBF maps.
Input State Settings
Setting Description
Vessel Settings • Number of AIF Candidates—Set the number of automatically detected AIF candidates.
• Vessel's Signal—Available options include Seeds and Segmentation. Set the vessel's signal to Segmentation to automatically mark all segmented arteries and veins on the image. Selecting this option hides all AIF and VOF seed marks and enables the AIF and VOF segmentation correction tools. Segmentation is the default selected option in MR studies. Set the Vessel's signal to Seeds to show the AIF and VOF candidates and to manually add AIF and VOF points on the image.
Preprocessing Settings • Split data by slice time or slice number—Use Slice Time to arrange the slices per time stamp. Use the Slice Number option to arrange the slices per slice number rather than slice time (for example, in cases when the original time stamp on the slices is missing or lacking information). The assumed time interval between slices is 1.6 s. Your choice is retained during your entire work session.
• Starting Time (used mainly in MR studies)—Insert the start time of the study. The start time you insert here affects the start time displayed in the graphic representation of the data.
• Injection Time—Insert the contrast material injection time to override the injection time calculated automatically by the algorithm. The line signifying the injection time in the graphic representation of the data is repositioned based on your manually inserted time. Use the Reset button to revert to the original time calculated by the algorithm automatically.
• Perform Denoising—Enable to preprocess images for noise reduction. This setting is turned off by default for MR studies.
Vue PACS MR Perfusion User Guide Unrestricted Internal Use
AE9362 C Uncontrolled unless otherwise indicated Page: 37 of 43
Vue PACS MR Perfusion User Guide - AE9362.docx
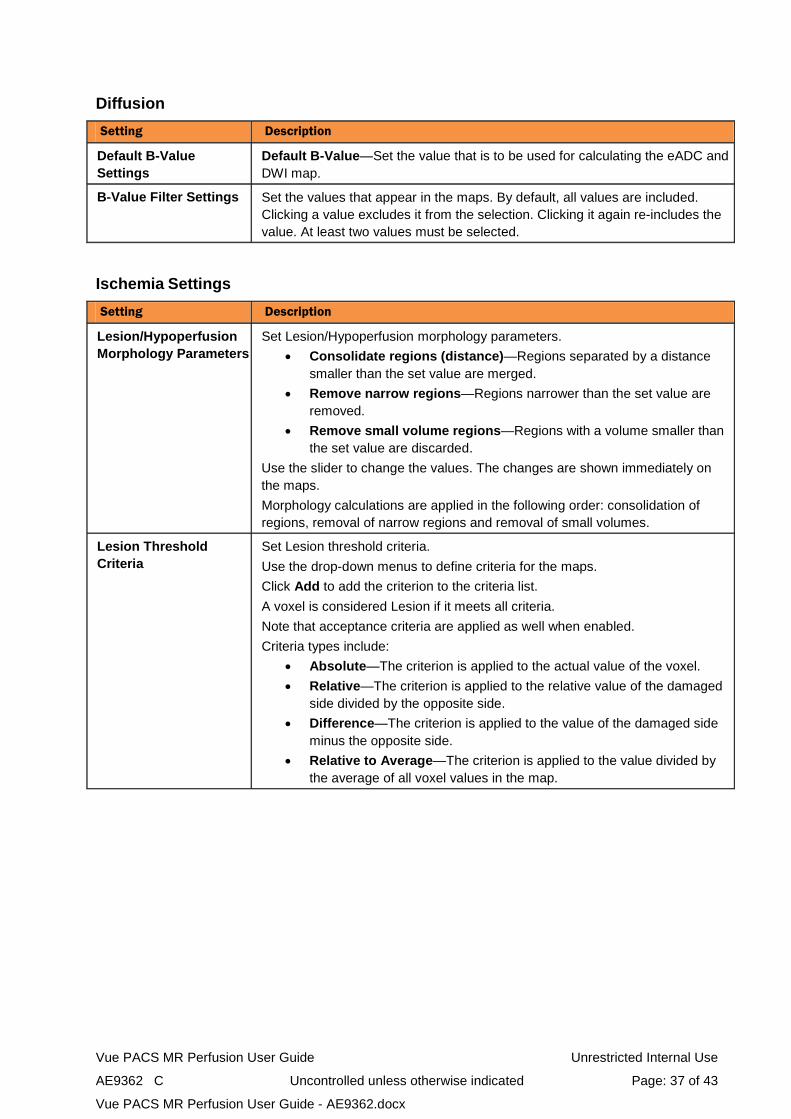
Diffusion Setting Description
Default B-Value Settings
Default B-Value—Set the value that is to be used for calculating the eADC and DWI map.
B-Value Filter Settings Set the values that appear in the maps. By default, all values are included. Clicking a value excludes it from the selection. Clicking it again re-includes the value. At least two values must be selected.
Ischemia Settings
Setting Description
Lesion/Hypoperfusion Morphology Parameters
Set Lesion/Hypoperfusion morphology parameters. • Consolidate regions (distance)—Regions separated by a distance
smaller than the set value are merged. • Remove narrow regions—Regions narrower than the set value are
removed. • Remove small volume regions—Regions with a volume smaller than
the set value are discarded. Use the slider to change the values. The changes are shown immediately on the maps. Morphology calculations are applied in the following order: consolidation of regions, removal of narrow regions and removal of small volumes.
Lesion Threshold Criteria
Set Lesion threshold criteria. Use the drop-down menus to define criteria for the maps. Click Add to add the criterion to the criteria list. A voxel is considered Lesion if it meets all criteria. Note that acceptance criteria are applied as well when enabled. Criteria types include:
• Absolute—The criterion is applied to the actual value of the voxel. • Relative—The criterion is applied to the relative value of the damaged
side divided by the opposite side. • Difference—The criterion is applied to the value of the damaged side
minus the opposite side. • Relative to Average—The criterion is applied to the value divided by
the average of all voxel values in the map.
Vue PACS MR Perfusion User Guide Unrestricted Internal Use
AE9362 C Uncontrolled unless otherwise indicated Page: 38 of 43
Vue PACS MR Perfusion User Guide - AE9362.docx
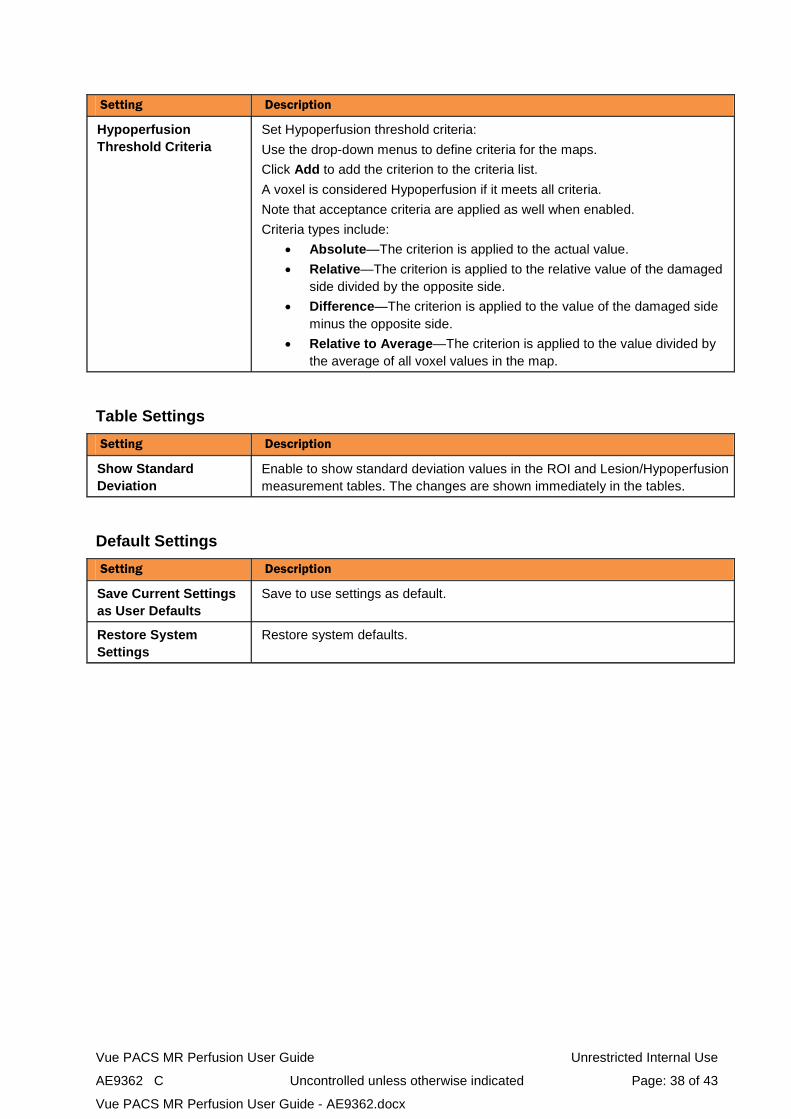
Setting Description
Hypoperfusion Threshold Criteria
Set Hypoperfusion threshold criteria: Use the drop-down menus to define criteria for the maps. Click Add to add the criterion to the criteria list. A voxel is considered Hypoperfusion if it meets all criteria. Note that acceptance criteria are applied as well when enabled. Criteria types include:
• Absolute—The criterion is applied to the actual value. • Relative—The criterion is applied to the relative value of the damaged
side divided by the opposite side. • Difference—The criterion is applied to the value of the damaged side
minus the opposite side. • Relative to Average—The criterion is applied to the value divided by
the average of all voxel values in the map.
Table Settings
Setting Description
Show Standard Deviation
Enable to show standard deviation values in the ROI and Lesion/Hypoperfusion measurement tables. The changes are shown immediately in the tables.
Default Settings Setting Description
Save Current Settings as User Defaults
Save to use settings as default.
Restore System Settings
Restore system defaults.
Vue PACS MR Perfusion User Guide Unrestricted Internal Use
AE9362 C Uncontrolled unless otherwise indicated Page: 39 of 43
Vue PACS MR Perfusion User Guide - AE9362.docx
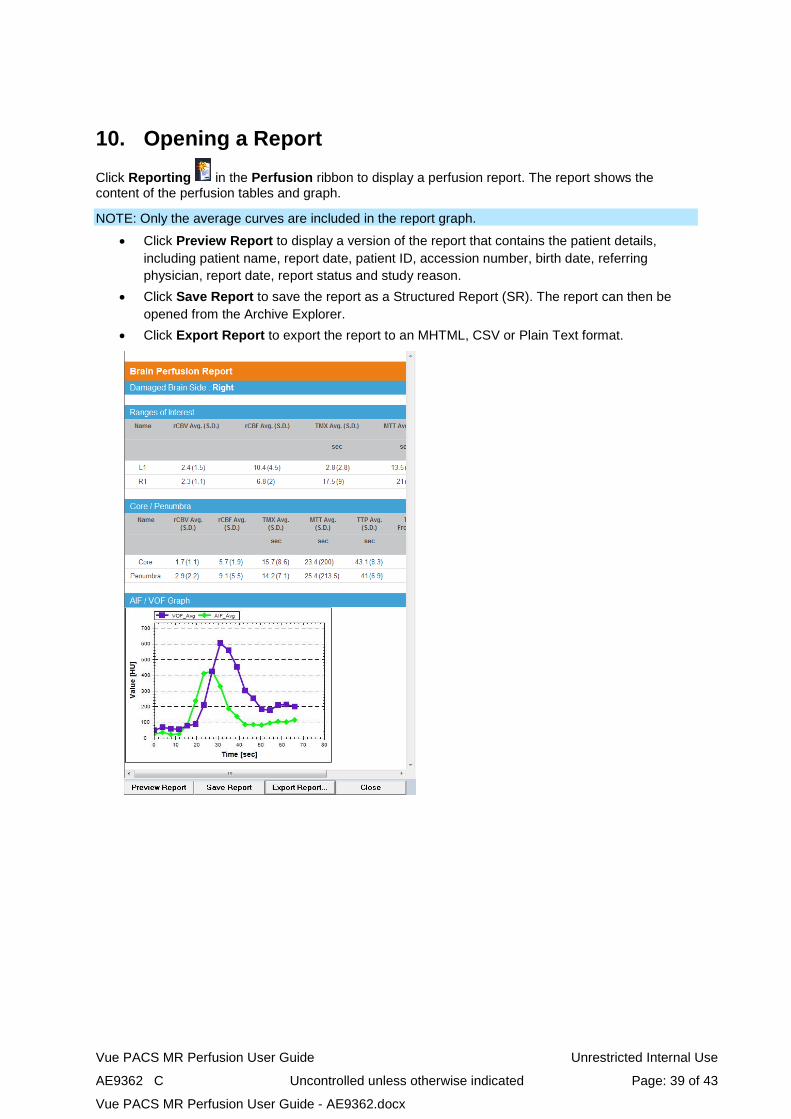
10. Opening a Report Click Reporting in the Perfusion ribbon to display a perfusion report. The report shows the content of the perfusion tables and graph.
NOTE: Only the average curves are included in the report graph.
• Click Preview Report to display a version of the report that contains the patient details, including patient name, report date, patient ID, accession number, birth date, referring physician, report date, report status and study reason.
• Click Save Report to save the report as a Structured Report (SR). The report can then be opened from the Archive Explorer.
• Click Export Report to export the report to an MHTML, CSV or Plain Text format.
Vue PACS MR Perfusion User Guide Unrestricted Internal Use
AE9362 C Uncontrolled unless otherwise indicated Page: 40 of 43
Vue PACS MR Perfusion User Guide - AE9362.docx
11. Exporting the Perfusion Analysis Click Export in the Perfusion ribbon to export the calculated maps and TMIN images, including the ischemic regions segmentation, the center line indication and the added ROIs. The maps are exported in their original plane. The exported images are saved with the study, with each map constituting a separate series.
NOTE: The exported series cannot be reloaded to the Perfusion application
Vue PACS MR Perfusion User Guide Unrestricted Internal Use
AE9362 C Uncontrolled unless otherwise indicated Page: 41 of 43
Vue PACS MR Perfusion User Guide - AE9362.docx
12. Accuracy and Limitations • Image quality—The calculation of perfusion parameters is limited by the scan quality.
Excessive noise, patient movement or image artifacts in the original images will ultimately have an impact on the perfusion analysis and the calculated maps. The user should inspect original data and verify that the images are of diagnostic quality and that any patient movement has been corrected using the motion correction algorithm. If image artifacts are present in the original images, the same areas on the maps may not contain valid values.
• Relative units—Some of the values are quoted in relative values (rCBV, rCBF). As such, the values extracted from these maps are valid up to arbitrary constants and therefore should not be confused with absolute measurements. Moreover, the units of these relative values are not normally associated with CBV or CBF measurements.
• Accuracy of values— In places where the standard deviation is given along with the average value, the user is encouraged to examine these values. A large standard deviation compared with acceptable values may indicate noise or artifact in the images.
• Temporal resolution—Preferably, the temporal resolution should not be lower than the resolution of one image per 4 seconds. In general, the better the resolution, the more accurate the deconvolution algorithm.
• Contrast material—The scan duration should allow the contrast material to wash into the different tissues and then wash out of the tissues, with a possible recirculation. This can be verified by visually inspecting the raw images.
• AIF—The MR perfusion application assumes that the AIF describes a well-defined signal originating in the contrast agent injection. The signal should start from a baseline value, climb to a maximum value and show a gradual drop to low values, possibly showing recirculation effects. It is the user's responsibility to review the AIF graph and ascertain that a correct AIF signal is used.
• Spatial resolution—The resolution does not affect the deconvolution algorithm itself. However, a low spatial resolution might introduce partial volume effects. The user is advised to view the TMIN image to assess partial volume effects.
• Scan duration—The scan duration should allow the contrast material to pass through the arteries, into the tissue and out of the veins enabling correct assessment of the perfusion parameters. Therefore, the user should examine both AIF and VOF and verify that both exhibit a rise and fall of the contrast material.
Vue PACS MR Perfusion User Guide Unrestricted Internal Use
AE9362 C Uncontrolled unless otherwise indicated Page: 42 of 43
Vue PACS MR Perfusion User Guide - AE9362.docx
13. References
1. Diffusion MRI. (n.d.). Retrieved from Wikipedia: https://en.wikipedia.org/wiki/Diffusion_MRI
2. Fieselmann, A., Kowarschik, M., Ganguly, A., Hornegger, J., & Fahrig, R. (2011). Deconvolution-Based CT and MR Brain Perfusion Measurements: Theoretical Model Revisited and Practical Implementation Details. International Journal of Biomedical Imaging, 2011, 20.
3. Gobbel, G., & Fike, J. (1994). A deconvolution method for evaluating indicator-dilution curves. Physics in Medicine and Biology, 39, 1833-1854.
4. Liao, P.-S., Chen, T.-S., & Chung, P.-C. (2001). A Fast Algorithm for Multilevel Thresholding. Journal of Information Science and Engineering, 17, 713-727.
5. Perona, P., & Malik, J. (1990). Scale-Space and Edge Detection Using Anisotropic Diffusion. IEEE Transactions on Pattern Analysis and Machine Intelligence, 12(7), 629-639.
6. Weisskoff, R., Boxerman, J., Sorensen, A., Kulke, S., Campbell, T., & Rosen, B. (1994). Simultaneous blood volume and permeability mapping using a single Gd-based contrast injection. 2nd Annual Meeting of SMRM, (p. 279). San Francisco.

Vue PACS MR Perfusion User Guide Unrestricted Internal Use
AE9362 C Uncontrolled unless otherwise indicated Page: 43 of 43
Vue PACS MR Perfusion User Guide - AE9362.docx
150 Verona Street Rochester, NY USA, 14608
© Carestream Health, 2017
CARESTREAM is a trademark of Carestream Health.
Made in the USA