Embed Size (px)
Citation preview
Ibis
(2007),
149
, 836–847
© 2007 The Authors Journal compilation © 2007 British Ornithologists’ Union
Blackwell Publishing Ltd
Climatic effects on arrival and laying dates in a long-distance migrant, the Collared Flycatcher
Ficedula albicollis
KAREL WEIDINGER
1
* & MIROSLAV KRÁL
2
1
Laboratory of Ornithology, Palacky University, tr. Svobody 26, 771 46 Olomouc, Czech Republic
2
Val
ß
ovsk
y
z
leb 499, 783 86 Dlouhá Lou
ç
ka, Czech Republic
Long-distance migrants may respond to climate change in breeding, wintering or staging areaby changing their phenology. The geographical variation in such responses (e.g. coastal vs.continental Europe) and the relative importance of climate at different spatial scales remainunclear. Here we analysed variation in first arrival dates (FADs) and laying dates of theCollared Flycatcher
Ficedula albicollis
in a central European population, from 1973 to 2002.The North Atlantic Oscillation (NAO) index correlated weakly with local temperatureduring the laying period. Decreasing spring temperatures until 1980 were associated witha trend towards later laying. The rate of warming (0.2
°
C per year) and laying advancement(0.4 days per year) since 1980 are amongst the highest values reported elsewhere. Thislong-term trend in laying date was largely explained by the change in climatic factors. Thenegative effect of local spring temperature on laying was relatively stronger than that ofNAO. The number of clutches initiated on a particular day was marginally affected by thetemperature 3 days prior to laying and the response of females to daily variation in temperaturedid not change over years. Correspondence between the average population-level and theindividual-level responses of laying date to climate variation suggests that the advancementof laying was due to phenotypic plasticity. Despite warmer springs and advanced laying,FADs did not change over years and were not correlated with local spring temperature.Marginal evidence suggests later departure from wintering grounds and faster migrationacross staging areas in warmer conditions. Advancement of arrival was probably constrainedby low local temperatures in early spring just before arrival that have not changed over years.The interval between first arrival and laying has declined since 1980 (0.5 days per year), butthe increasing temperature during that period may have kept the food supply approximatelyunchanged.
Good evidence exists for global warming, especiallyduring the past two decades (Watkinson
et al
. 2004).Many bird species have responded to rising tem-perature by changing their phenology (Crick 2004),although such adjustments are not always sufficientto cope with change in phenology of food supply(Visser & Both 2005). The best documentedresponses include earlier spring migration and arrivaltimes (Tryjanowski
et al
. 2002, Hüppop & Hüppop2003, Hubálek 2004, Sparks
et al
. 2005) and layingdates (Crick & Sparks 1999), but effects on breedingsuccess (Both & Visser 2001, Saino
et al
. 2004a,
Weatherhead 2005), morphology (Kanu
s
c
ák
et al
.2004), covariation of multiple life-history traits (Both& Visser 2005), demography (Sæther
et al
. 2003, Both
et al
. 2006) and interspecific competition (Sætre
et al
. 1999) also have been reported. The degree ofsuch responses varies not only among species (Crick& Sparks 1999, Torti & Dunn 2005), but also withinspecies (Sanz 2003, Visser
et al
. 2003, Both
et al
.2004), the latter being partly attributable to spatialvariation in rates of warming. Birds respond to climatevariation at different spatial scales and during differentparts of their life cycle. Increasing evidence suggeststhat conditions at wintering grounds (Saino
et al
.2004a, 2004b, Gordo
et al
. 2005) and along themigratory flyways (Ahola
et al
. 2004, Both
et al
.
*Corresponding author.Email: [email protected]
© 2007 The AuthorsJournal compilation © 2007 British Ornithologists’ Union
Climate and phenology in the Collared Flycatcher
837
2005, Hüppop & Winkel 2006, Zalakevicius
et al
.2006) also influence phenology and breeding inlong-distance migrants.
Although the overall patterns of climate variationand the associated changes in avian phenology arenow reasonably well documented for many species,several aspects deserve more attention. Because therate of climatic change is not uniform (Hurrell 1995,Watkinson
et al
. 2004), we expect that phenologydata may not be adequately described by singlelinear trends over the long term, but quantitativetests of this are rare (e.g. McCleery & Perrins 1998,Crick & Sparks 1999). Little is known about therelative importance of climate variation at differentspatial scales because most previous studies haverelated phenology or breeding performance to eitherlocal weather or large-scale climate phenomena,such as the North Atlantic Oscillation (NAO). TheNAO-index is a good predictor of local climate incoastal areas over northwest Europe (Stenseth
et al
.2003), where the majority of studies have beenperformed and where the influence of NAO may differfrom that in more continental locations (Sanz 2003,Menzel
et al
. 2005). Another problem associatedwith some previous analyses is the use of simplecorrelations to assess effects of multiple weathervariables, while not accounting for their possibleinteractions. Little explored is whether the responseof birds to within-season variation in temperature(Saino
et al
. 2004c) has changed over the years(Nussey
et al
. 2005). Finally, only a few studies havetried to discriminate between the two potentialmechanisms of adjustment to climate – phenotypicplasticity (Przybylo
et al
. 2000, Saino
et al
. 2004a,Both & Visser 2005) and microevolutionary change(Berthold
et al
. 1992).Here we analyse variation in arrival and laying
dates recorded over a 30-year period in a centralEuropean population of Collared Flycatcher
Ficedulaalbicollis
. Compared with its congener, the PiedFlycatcher
F. hypoleuca
, the demography of theCollared Flycatcher is more strongly influenced byclimate variation (Sætre
et al
. 1999). Yet, its phenologyhas received less attention, possibly because itsgeographical range is confined to central and easternEurope, where long-term datasets are scarce (Bauer2006). These two flycatcher species represent asuitable model offering new insights into climaticeffects on phenology of long-distance migrants. Ourgoal was to extend the previous studies by askingwhether the phenology patterns reported frompopulations of Pied Flycatchers across northwest
(coastal) Europe apply to Collared Flycatchers in amore continental location. Specifically, we examined:(1) simultaneous effects of a large-scale climaticfactor (NAO) and local temperature at breeding,wintering and staging areas on arrival and laying date;(2) correspondence between the average population-level and the individual-level responses of layingdate to climatic factors; and (3) responses of layingfemales to day-to-day variation in ambient temper-ature and long-term changes in these responses.
MATERIALS AND METHODS
Study species and area
The Collared Flycatcher is a small (13-g), hole-nesting,insectivorous passerine breeding in deciduous forestsof central and eastern Europe. The species is a long-distance migrant wintering in Africa south of theequator (Cramp & Perrins 1993). All data werecollected in 1973–2002 during a long-term nestboxstudy running in central Moravia (49
°
50
′
N, 17
°
15
′
E),Czech Republic. The study plots are situated onSE–NW slopes at an altitude of 300–480 m. Thearea is mainly a managed deciduous forest (conifers< 1%) with trees 45–120 years old, dominated byOak
Quercus petraea
(40%) and Beech
Fagus sylvatica
(40%). Plots were established in 1973 and thenumber of nestboxes increased steadily throughoutthe study period from 43 to 192 (annual mean 156).Nestboxes were provided at a density of about 6boxes/ha, well above the breeding density of Flycatcherpairs (mean occupation rate 23%). Density variedfrom 0.9 to 2.0 pairs/ha (mean = 1.4) and did notshow a directional trend over the years (
r = –
0.12,
n
= 30,
P
= 0.52). Breeding in natural holes was notrecorded after providing nestboxes, but occurredregularly outside the study plots at a density of about0.1 pairs/ha. For details of the breeding biology ofthe local population see Král (1982).
Field methods
Arrival dates were recorded each year by standard-ized daily visits to study plots from 10 April onward.The whole study area was checked less frequentlybefore that date. For subsequent analyses we usedonly the first arrival date (FAD = the date when thefirst male was recorded, regardless of its activity),because we do not have quantitative data on theprogress of arrival and territory occupation. Casualrepeated captures of marked individuals revealed
838
K. Weidinger & M. Král
© 2007 The Authors Journal compilation © 2007 British Ornithologists’ Union
that many moved around the study area, including innon-forest habitats, during the first days after arrival.Contents of nestboxes were checked at least onceevery 5 days and the date of clutch initiation wasthen back-calculated from the number of eggs on theassumption that one egg was laid every day. In theanalyses we included only first clutches; we excludedrepeated clutches of the same female and repeatedclutches in the same nestbox. We used the first lay-ing date (FLD = the date when the first clutch inthat year was initiated), the median laying date(MLD = median initiation date of the first clutches)and the length of FAD–FLD interval for each year.All nestlings and a variable proportion (limited byresearchers’ capacity) of breeding adults were markedeach year with an individually numbered aluminiumring. The fieldwork was done by the same person(M.K.) and all field procedures were kept unchangedso we do not anticipate any systematic bias inaccuracy of data over the study period.
Weather data
Local temperature was obtained from the weatherstation at Paseka (3 km from the centre of the studyarea, altitude 370 m). To evaluate landscape-scalerepresentativeness of these local data we comparedthem with records from another weather station(Smr
z
ice, 37 km south of the study area, altitude250 m) representing the same geographical unit ofthe upper part of the Morava river basin. In theanalyses we used either daily means or their averagesover a defined period. We determined the breedingtemperature (
T
BREED
) as the average daily tempera-ture for the 30 days before the mean of the medianlaying date in the first 5 years of the study (Both
et al
. 2004). This period (16 April–15 May)included the FAD and MLD in 26 and 27 years,respectively, during the 30-year study. The intervaltemperature (
T
mean FAD–FLD
) was defined as meandaily temperature averaged over the FAD–FLDinterval each year. We used the sum of mean dailytemperatures above 5
°
C over the FAD–FLD interval(day-degrees;
T
sum FAD–FLD
) as a rough measure ofpotential development of vegetation and Flycatchers’invertebrate prey (Laaksonen
et al
. 2006). Tempera-ture at FAD, FLD and MLD (
T
FAD,FLD,MLD
) wasdefined as mean daily temperature averaged over5 days (days –4 to 0) before the focal date (day = 0)each year. Temperature data for the wintering area(
T
WIN
) and migration route (
T
MIG
) for the period1973–2000 were obtained as mean country values
(http://www.cru.uea.ac.uk/~timm/cty/obs/TYN_CY_1_1.html). We averaged February temperature forMalawi, Tanzania, Zambia and Zimbabwe, to representthe conditions in the wintering area (east-centralAfrica, south of the equator to about 20
°
S; Cramp &Perrins 1993) just prior to departure. We averagedMarch temperature for Egypt and Libya to representthe conditions encountered during the spring migra-tion through the eastern Mediterranean. We cannotuse more site-specific weather data because theexact wintering area and the migratory route ofour population is unknown. The eastern route andthe wintering areas in eastern Africa are generallyless explored than those for the Pied Flycatcherbecause of the low recovery rates of ringed birds.Finally, we used the standardized NAO index(ftp://ftp.cpc.ncep.noaa.gov/wd52dg/data/indices/tele_index.nh) averaged over the months December–March to represent large-scale climatic patterns forthe region. The NAO is a natural, large-scale atmos-pheric fluctuation between the subtropical and thesubpolar North Atlantic region. Positive values of thewinter NAO-index are associated with relativelywarm, moist winters in western and northernEurope, whereas negative values are associated withcold, dry winters in that region (Stenseth
et al
.2003). We used winter NAO-index (1) becauseNAO is most pronounced during winter with long-lasting effects on subsequent spring conditions, and(2) to ensure comparability with previous studies(e.g. Przybylo
et al
. 2000).
Analyses
We performed simple linear regressions to evaluatetrends in phenology and climatic variables over theyears of the study. To assess whether the data wereadequately described by a single linear trend, we firstestimated potential breakpoints by fitting piecewiselinear regression models (Neter
et al
. 1985) withfour parameters (common intercept, two separateslopes, breakpoint). Next we refitted the piecewisemodel with a fixed value of the estimated breakpoint(i.e. with three estimable parameters) and testedimprovement of its fit against the simple linearregression (two estimable parameters). Apart fromthis, we present separate linear regression analysesfor both the entire study period (1973–2002) andthe period after 1980, for the following reasons.First, climate change has become more pronouncedsince about 1980 (Hurrell 1995); secondly, trendestimates are sensitive to the starting point of data
© 2007 The AuthorsJournal compilation © 2007 British Ornithologists’ Union
Climate and phenology in the Collared Flycatcher
839
series (Sparks & Tryjanowski 2005) and our analysessuggested a change in the linear trend around 1980for some variables; thirdly, previous analyses of othermajor datasets considered only the period after 1980(Both
et al
. 2004); fourthly, by restricting analysis tothe latter period we eliminated possible bias becausethe phenology of a newly established nestbox popu-lation may have differed from the phenology of anestablished population.
We used multiple linear regression to assessrelationships between each phenology variable andyear together with the four climate variables (
T
WIN
,
T
MIG
,
T
BREED
, NAO). The relative effect of year andeach climate variable, controlled for effects of theremaining variables, was expressed by the partialcorrelation coefficient. We did not include breedingdensity as an additional predictor, but we presentsimple correlations between phenology variables anddensity. All the above analyses are cross-sectionalusing composite data from the population of CollaredFlycatchers present in each year. To evaluate whethersimilar patterns were observed within individuals asthose found at the population level, we conducted alongitudinal analysis of laying dates of individuallymarked birds by fitting a general linear mixed model(Proc Mixed; SAS Institute Inc. 2005). Details andadvantages of this method over cross-sectionalanalysis are discussed by Przybylo
et al
. (2000). Theresponse variable in our model was individual layingdate, and the fixed effect predictors were the climatevariables (
T
BREED
and NAO-index) and individualage (to control for possible age dependence of layingdate). We modelled the random intercept for eachfemale (to account for individual properties) andyear of study (to account for the non-independenceof observations from the same years) by enteringindividual identity and year as random effects,assuming variance-component covariance structure.In order to keep the model simple, we did not includethe climate variables (
T
WIN
,
T
MIG
) that showed weakrelationships with MLD in cross-sectional analysis.Of the original dataset (1051 laying dates) weincluded only those females that bred at least twiceduring 1980–2002 (119 females, 298 laying dates).
To visualize the link between phenology andwithin-season variation in mean daily temperaturewe calculated for each day a ‘backward’ 5-dayrunning average (average for that day and the fourpreceding days). Before examining average trendacross years, we centred days within each year at thefocal day analysed (FAD/FLD/MLD = 0). To assessthe effect of temperature on the number of first
clutches initiated on each particular day during thelaying period, we fitted generalized linear mixedmodels with a Poisson error distribution and log linkfunction (Proc Glimmix; SAS Institute Inc. 2005).The fixed effect predictors were the mean tempera-ture for the laying period (period between the firstand the last initiation date of the first clutches in agiven year), daily temperature (centred at the aboveannual mean) and interaction of these effects(removed from the final model because of non-significance; see Results). Included as fixed effectswere the linear and squared terms of date, to accountfor seasonal unimodal distribution of clutch initiationdates, resulting from factors other than temperature.We modelled random intercepts and temperatureslopes for each year of study by entering year andyear
×
daily temperature interaction as the randomeffects, assuming an unstructured covariance matrix.Because we had no
a priori
predictions on the daysbefore clutch initiation at which temperature has aneffect, we fitted separate models for the temperatureon individual days from day –1 (0 = clutch initiation)to day –5 and a model for temperature averaged overthese 5 days. To assess the possibility that femalesrespond to trend in temperature variation over thepast days rather than its mean, we fitted a modelwhere the predictor variable was the slope of linearregression of daily temperature on days –5 to –1.
Given the large number of examined relationshipsand a few
a priori
hypotheses, our analysis waslargely exploratory and entirely correlational. Wereport unadjusted
P
-values for consistency withother studies, but we focus more on the values ofcorrelation and regression coefficients as descriptivestatistics. We do not adopt a step-wise approach tomodel building. Instead we present results for themodels containing all predictors selected
a priori
onthe basis of their potential biological significance.
RESULTS
Variation in climate
Correlations between climate variables measured atdifferent spatial scales were generally weak (
n
= 28–30, all
P
> 0.25): NAO vs.
T
WIN
(
r = –
0.07), NAOvs.
T
MIG
(
r = –
0.18), NAO vs.
T
BREED
(
r =
0.20),
T
WIN
vs.
T
MIG
(
r = –
0.22),
T
WIN
vs. TBREED (r = 0.02),TMIG vs. TBREED (r = –0.21). Locally, a strong corre-lation existed between spring temperatures at thetwo weather stations close to our study area, bothbetween years (1980–2000, April: r = 0.89, May:
840 K. Weidinger & M. Král
© 2007 The Authors Journal compilation © 2007 British Ornithologists’ Union
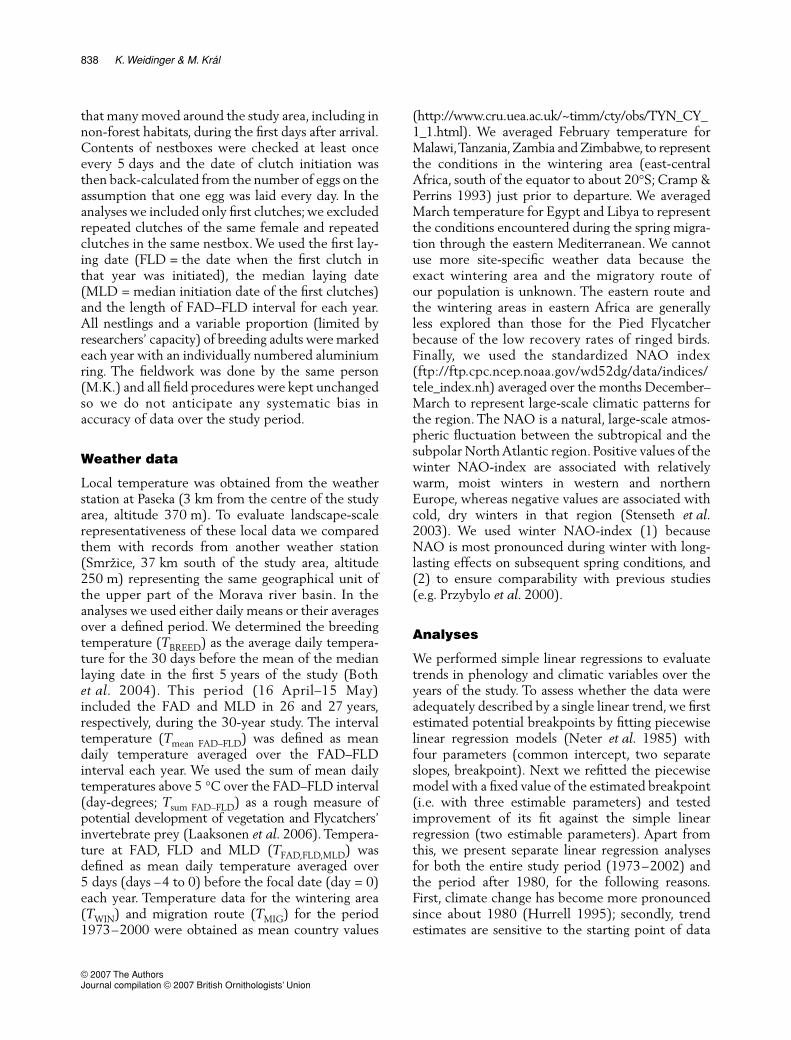
r = 0.81; n = 21, both P < 0.001) and within years(April and May: r > 0.9, n = 61, P < 0.001 for allyears). Temperature in the wintering area and alongthe migration route did not show directional trends.Temperature in the breeding area showed an increasingtrend over the study, which was more pronounced
after 1980 (Tables 1 & 2). We examined the long-term trends in local temperature and correlationwith NAO index for all overlapping 5-day periodsfrom March to May. We found that the period(16 April–15 May) defined a priori to representtemperature at the breeding area (TBREED; seeMethods) coincided with a period of marked warm-ing over the years (Fig. 1b). Temperature before andafter this period did not show any clear directionaltrend. NAO-index was a weak correlate of thelocal temperatures during the period of egg-laying(Fig. 1c).
Variation in phenology
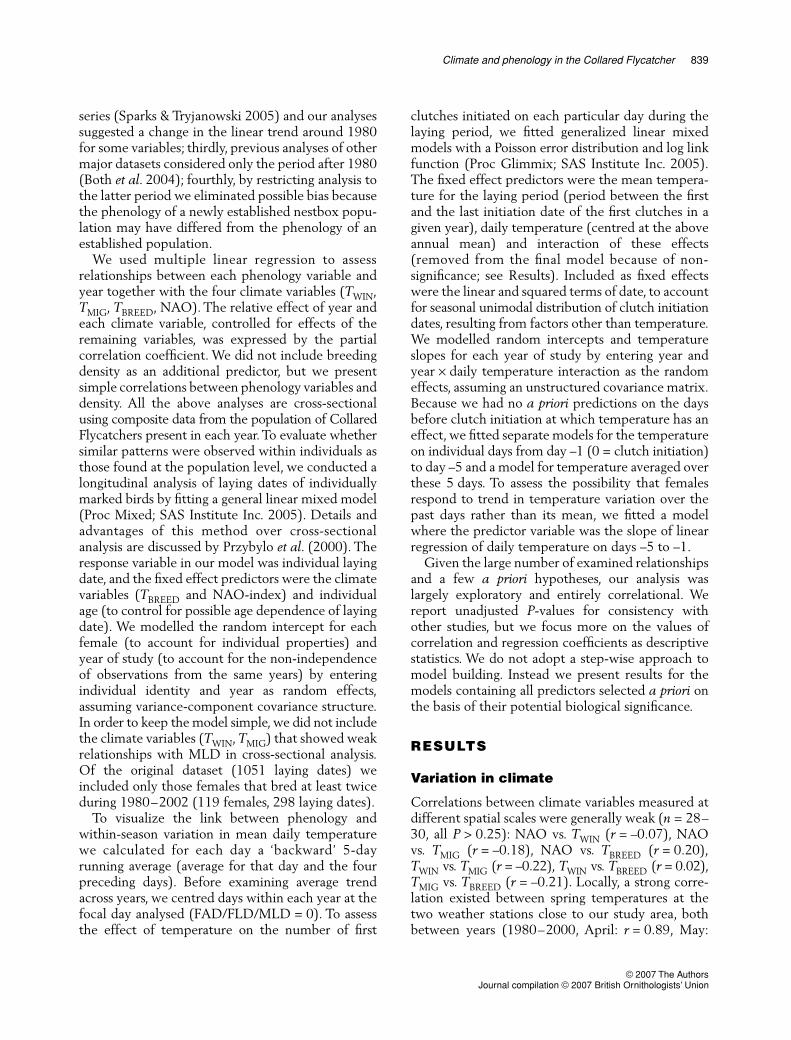
The FAD (13–30 April, median/mean = 23/22 April)did not show a directional trend over the years(Tables 1 & 2, Fig. 2), but was negatively correlatedwith annual population density (1973–2002: r = –0.52,n = 30, P = 0.003; 1980–2002: r = –0.67, n = 23,P < 0.001). FLD (27 April–16 May, median/mean = 5/6 May) and MLD (3–20 May, median/mean = 11 May) showed a trend over the years thatchanged from delaying to advancing in 1980 (Tables 1& 2, Fig. 2) and were not correlated with populationdensity (r = 0.19, n = 23 or 30, all P > 0.37).Because no trend existed in FAD, the length of theFAD–FLD interval (6–28 days, median/mean = 12/13) showed a trend over the years similar to that forFLD (Tables 1 & 2, Fig. 2). FAD correlated weaklywith FLD (r = 0.34, n = 30, P = 0.068) but not withMLD (r = 0.14, n = 30, P = 0.48); FLD correlatedstrongly with MLD (r = 0.80, n = 30, P < 0.001).
Table 1. Piecewise linear regression of phenology andtemperature variables against year. Dependent variables were:first arrival date (FAD), first laying date (FLD), median laying date(MLD), interval between the dates (FAD–FLD), meantemperature (T ) at wintering/migration/breeding area, meantemperatures during the interval, sum of daily temperaturesabove 5 °C during the interval, mean temperature on days –4 to0 relative to FAD, FLD and MLD (day = 0). n = 30 (1973–2002)except for TWIN and TMIG, where n = 28 (1973–2000). An overallfit of the model was tested against the simple linear regression.P-values < 0.05 are shown in bold type.
VariableBreakpoint
year
Regression slope
P rbefore after
FAD 1976 –2.351 –0.036 0.102 0.38FLD 1979 0.861 –0.488 0.033 0.65MLD 1979 1.379 –0.408 0.001 0.67FAD–FLD 1980 1.475 –0.514 0.002 0.61TWIN 1982 0.082 –0.007 0.074 0.45TMIG 1985 0.032 –0.043 0.431 0.18TBREED 1980 –0.177 0.210 0.123 0.62Tmean FAD–FLD 1980 –0.338 0.236 0.086 0.54Tsum FAD–FLD 1985 1.797 0.195 0.449 0.32TFAD 1989 0.128 –0.152 0.215 0.24TFLD 1985 0.127 0.033 0.721 0.22TMLD 1999 0.062 2.047 0.043 0.51
Table 2. Simple linear regression of phenology and temperature variables against year for the entire study period and the period after1980. Dependent variables as in Table 1. n = 28 (1973–2000) and 21 (1980–2000) for TWIN and TMIG. P-values < 0.05 are shown in bold type.
Variable
1973–2002 (n = 30) 1980–2002 (n = 23)
r P Slope se r P Slope se
FAD –0.24 0.202 –0.121 0.093 0.03 0.885 0.022 0.148FLD –0.57 0.001 –0.326 0.090 –0.65 0.001 –0.488 0.124MLD –0.41 0.024 –0.193 0.081 –0.66 0.001 –0.412 0.101FAD–FLD –0.33 0.078 –0.205 0.112 –0.60 0.002 –0.510 0.148TWIN 0.30 0.118 0.017 0.011 –0.07 0.777 –0.005 0.017TMIG –0.10 0.619 –0.012 0.023 –0.14 0.553 –0.022 0.036TBREED 0.57 0.001 0.150 0.041 0.58 0.003 0.213 0.064Tmean FAD–FLD 0.45 0.012 0.146 0.054 0.51 0.012 0.234 0.085Tsum FAD–FLD 0.29 0.120 0.797 0.498 0.15 0.485 0.587 0.826TFAD 0.03 0.870 0.009 0.055 0.02 0.931 0.008 0.091TFLD 0.21 0.273 0.068 0.061 0.20 0.370 0.093 0.101TMLD 0.37 0.047 0.136 0.065 0.33 0.128 0.148 0.094
© 2007 The AuthorsJournal compilation © 2007 British Ornithologists’ Union
Climate and phenology in the Collared Flycatcher 841
Population-level response to climate
FAD was not significantly correlated with any of theclimate variables, when these were analysed simulta-neously by controlling for each other (Table 3). Thestrongest effect on FAD was that of TWIN, which wasalso shown by a conventional simple correlation
Figure 1. Seasonal variation in (a) mean daily temperature atthe study area, (b) rate of its change over the years and (c)strength of its correlation with the annual winter NAO-index.Shown in (a) is the mean and interquartile range calculatedacross years; horizontal bars delimit the annual variation intiming of first arrival date (FAD), first laying date (FLD) andmedian laying date (MLD), and the fixed 30-day period (16 April–15 May) defining the temperature at the breeding area (TBREED).Coefficients shown in (b) and (c) were calculated from 5-dayrunning average of daily temperature and were plotted againstthe middle day of the overlapping periods; analysis wasperformed separately for the years 1973–2002 (n = 30, open circles)and 1980–2002 (n = 23, filled circles). Julian date 60 = 1 March.
Figure 2. Annual variation in (a) timing of the first arrival date(FAD), first laying date (FLD) and median laying date (MLD), (b)length of the FAD–FLD interval, (c) mean daily temperatureduring the FAD–FLD interval and (d) sum of daily temperaturesabove 5 °C during the FAD–FLD interval. Shown is the piecewiselinear regression line (dashed); parameters of the fitted modelsare summarized in Table 1.
842 K. Weidinger & M. Král
© 2007 The Authors Journal compilation © 2007 British Ornithologists’ Union
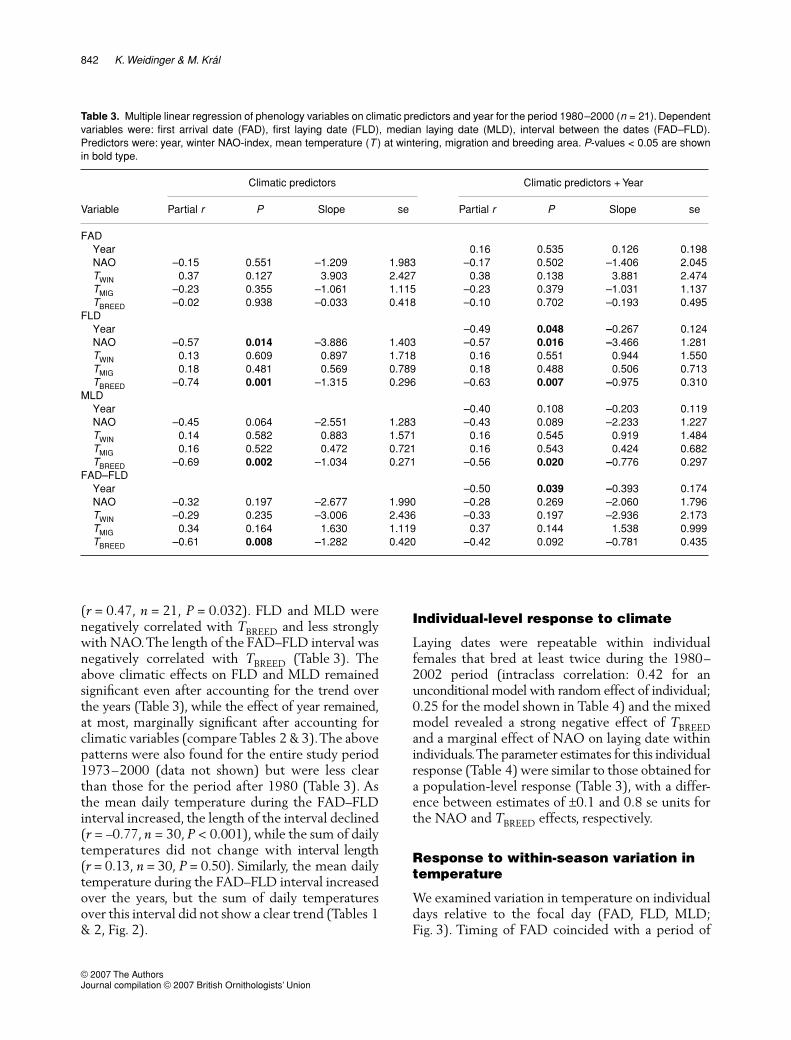
(r = 0.47, n = 21, P = 0.032). FLD and MLD werenegatively correlated with TBREED and less stronglywith NAO. The length of the FAD–FLD interval wasnegatively correlated with TBREED (Table 3). Theabove climatic effects on FLD and MLD remainedsignificant even after accounting for the trend overthe years (Table 3), while the effect of year remained,at most, marginally significant after accounting forclimatic variables (compare Tables 2 & 3). The abovepatterns were also found for the entire study period1973–2000 (data not shown) but were less clearthan those for the period after 1980 (Table 3). Asthe mean daily temperature during the FAD–FLDinterval increased, the length of the interval declined(r = –0.77, n = 30, P < 0.001), while the sum of dailytemperatures did not change with interval length(r = 0.13, n = 30, P = 0.50). Similarly, the mean dailytemperature during the FAD–FLD interval increasedover the years, but the sum of daily temperaturesover this interval did not show a clear trend (Tables 1& 2, Fig. 2).
Individual-level response to climate
Laying dates were repeatable within individualfemales that bred at least twice during the 1980–2002 period (intraclass correlation: 0.42 for anunconditional model with random effect of individual;0.25 for the model shown in Table 4) and the mixedmodel revealed a strong negative effect of TBREEDand a marginal effect of NAO on laying date withinindividuals. The parameter estimates for this individualresponse (Table 4) were similar to those obtained fora population-level response (Table 3), with a differ-ence between estimates of ±0.1 and 0.8 se units forthe NAO and TBREED effects, respectively.
Response to within-season variation in temperature
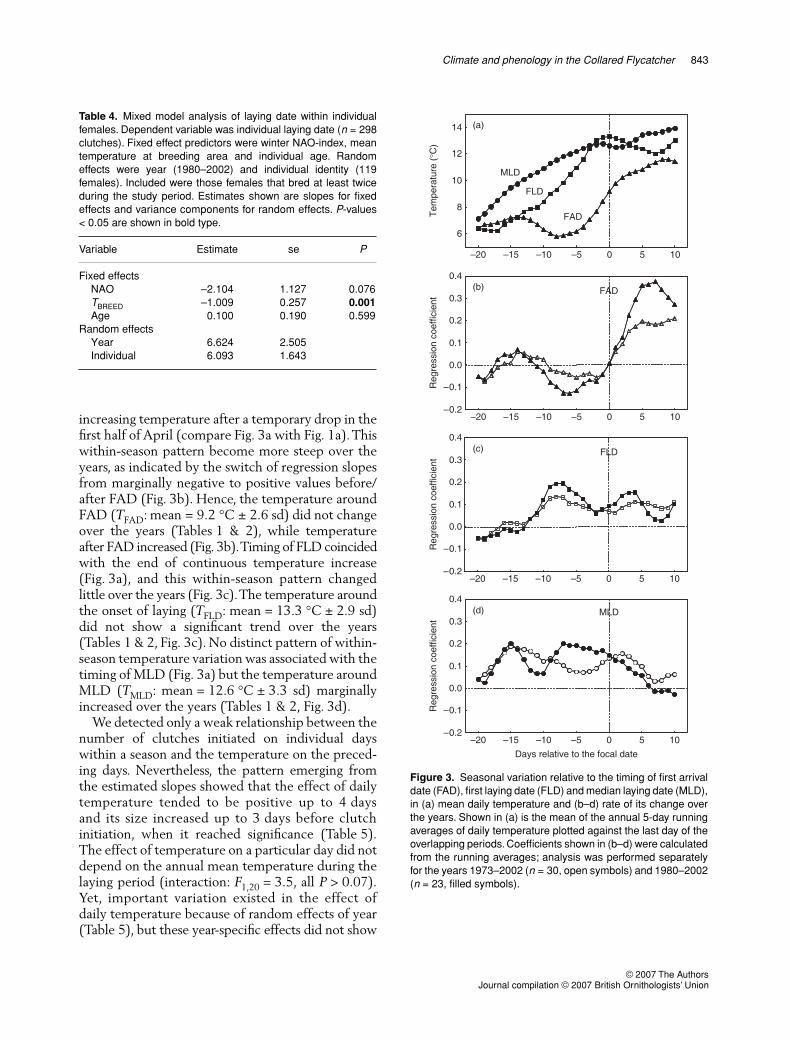
We examined variation in temperature on individualdays relative to the focal day (FAD, FLD, MLD;Fig. 3). Timing of FAD coincided with a period of
Table 3. Multiple linear regression of phenology variables on climatic predictors and year for the period 1980–2000 (n = 21). Dependentvariables were: first arrival date (FAD), first laying date (FLD), median laying date (MLD), interval between the dates (FAD–FLD).Predictors were: year, winter NAO-index, mean temperature (T ) at wintering, migration and breeding area. P-values < 0.05 are shownin bold type.
Variable
Climatic predictors Climatic predictors + Year
Partial r P Slope se Partial r P Slope se
FADYear 0.16 0.535 0.126 0.198NAO –0.15 0.551 –1.209 1.983 –0.17 0.502 –1.406 2.045TWIN 0.37 0.127 3.903 2.427 0.38 0.138 3.881 2.474TMIG –0.23 0.355 –1.061 1.115 –0.23 0.379 –1.031 1.137TBREED –0.02 0.938 –0.033 0.418 –0.10 0.702 –0.193 0.495
FLDYear –0.49 0.048 –0.267 0.124NAO –0.57 0.014 –3.886 1.403 –0.57 0.016 –3.466 1.281TWIN 0.13 0.609 0.897 1.718 0.16 0.551 0.944 1.550TMIG 0.18 0.481 0.569 0.789 0.18 0.488 0.506 0.713TBREED –0.74 0.001 –1.315 0.296 –0.63 0.007 –0.975 0.310
MLDYear –0.40 0.108 –0.203 0.119NAO –0.45 0.064 –2.551 1.283 –0.43 0.089 –2.233 1.227TWIN 0.14 0.582 0.883 1.571 0.16 0.545 0.919 1.484TMIG 0.16 0.522 0.472 0.721 0.16 0.543 0.424 0.682TBREED –0.69 0.002 –1.034 0.271 –0.56 0.020 –0.776 0.297
FAD–FLDYear –0.50 0.039 –0.393 0.174NAO –0.32 0.197 –2.677 1.990 –0.28 0.269 –2.060 1.796TWIN –0.29 0.235 –3.006 2.436 –0.33 0.197 –2.936 2.173TMIG 0.34 0.164 1.630 1.119 0.37 0.144 1.538 0.999TBREED –0.61 0.008 –1.282 0.420 –0.42 0.092 –0.781 0.435
© 2007 The AuthorsJournal compilation © 2007 British Ornithologists’ Union
Climate and phenology in the Collared Flycatcher 843
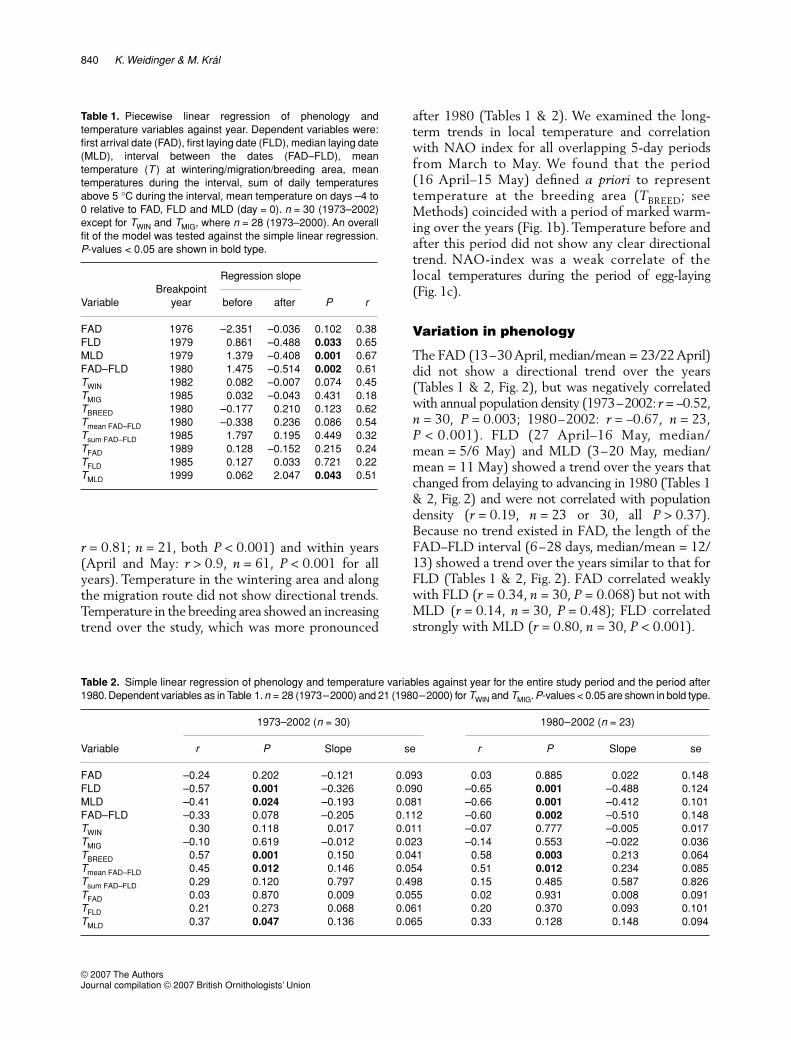
increasing temperature after a temporary drop in thefirst half of April (compare Fig. 3a with Fig. 1a). Thiswithin-season pattern become more steep over theyears, as indicated by the switch of regression slopesfrom marginally negative to positive values before/after FAD (Fig. 3b). Hence, the temperature aroundFAD (TFAD: mean = 9.2 °C ± 2.6 sd) did not changeover the years (Tables 1 & 2), while temperatureafter FAD increased (Fig. 3b). Timing of FLD coincidedwith the end of continuous temperature increase(Fig. 3a), and this within-season pattern changedlittle over the years (Fig. 3c). The temperature aroundthe onset of laying (TFLD: mean = 13.3 °C ± 2.9 sd)did not show a significant trend over the years(Tables 1 & 2, Fig. 3c). No distinct pattern of within-season temperature variation was associated with thetiming of MLD (Fig. 3a) but the temperature aroundMLD (TMLD: mean = 12.6 °C ± 3.3 sd) marginallyincreased over the years (Tables 1 & 2, Fig. 3d).
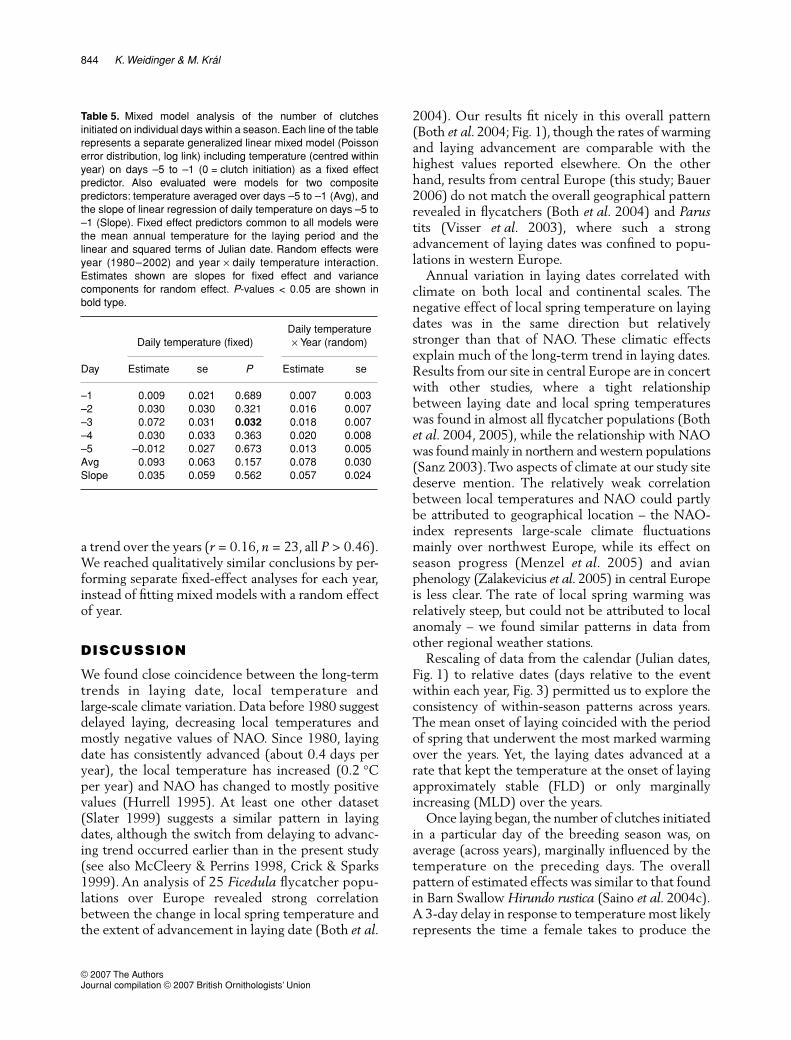
We detected only a weak relationship between thenumber of clutches initiated on individual dayswithin a season and the temperature on the preced-ing days. Nevertheless, the pattern emerging fromthe estimated slopes showed that the effect of dailytemperature tended to be positive up to 4 daysand its size increased up to 3 days before clutchinitiation, when it reached significance (Table 5).The effect of temperature on a particular day did notdepend on the annual mean temperature during thelaying period (interaction: F1,20 = 3.5, all P > 0.07).Yet, important variation existed in the effect ofdaily temperature because of random effects of year(Table 5), but these year-specific effects did not show
Table 4. Mixed model analysis of laying date within individualfemales. Dependent variable was individual laying date (n = 298clutches). Fixed effect predictors were winter NAO-index, meantemperature at breeding area and individual age. Randomeffects were year (1980–2002) and individual identity (119females). Included were those females that bred at least twiceduring the study period. Estimates shown are slopes for fixedeffects and variance components for random effects. P-values< 0.05 are shown in bold type.
Variable Estimate se P
Fixed effectsNAO –2.104 1.127 0.076TBREED –1.009 0.257 0.001Age 0.100 0.190 0.599
Random effectsYear 6.624 2.505Individual 6.093 1.643
Figure 3. Seasonal variation relative to the timing of first arrivaldate (FAD), first laying date (FLD) and median laying date (MLD),in (a) mean daily temperature and (b–d) rate of its change overthe years. Shown in (a) is the mean of the annual 5-day runningaverages of daily temperature plotted against the last day of theoverlapping periods. Coefficients shown in (b–d) were calculatedfrom the running averages; analysis was performed separatelyfor the years 1973–2002 (n = 30, open symbols) and 1980–2002(n = 23, filled symbols).
844 K. Weidinger & M. Král
© 2007 The Authors Journal compilation © 2007 British Ornithologists’ Union
a trend over the years (r = 0.16, n = 23, all P > 0.46).We reached qualitatively similar conclusions by per-forming separate fixed-effect analyses for each year,instead of fitting mixed models with a random effectof year.
DISCUSSION
We found close coincidence between the long-termtrends in laying date, local temperature andlarge-scale climate variation. Data before 1980 suggestdelayed laying, decreasing local temperatures andmostly negative values of NAO. Since 1980, layingdate has consistently advanced (about 0.4 days peryear), the local temperature has increased (0.2 °Cper year) and NAO has changed to mostly positivevalues (Hurrell 1995). At least one other dataset(Slater 1999) suggests a similar pattern in layingdates, although the switch from delaying to advanc-ing trend occurred earlier than in the present study(see also McCleery & Perrins 1998, Crick & Sparks1999). An analysis of 25 Ficedula flycatcher popu-lations over Europe revealed strong correlationbetween the change in local spring temperature andthe extent of advancement in laying date (Both et al.
2004). Our results fit nicely in this overall pattern(Both et al. 2004; Fig. 1), though the rates of warmingand laying advancement are comparable with thehighest values reported elsewhere. On the otherhand, results from central Europe (this study; Bauer2006) do not match the overall geographical patternrevealed in flycatchers (Both et al. 2004) and Parustits (Visser et al. 2003), where such a strongadvancement of laying dates was confined to popu-lations in western Europe.
Annual variation in laying dates correlated withclimate on both local and continental scales. Thenegative effect of local spring temperature on layingdates was in the same direction but relativelystronger than that of NAO. These climatic effectsexplain much of the long-term trend in laying dates.Results from our site in central Europe are in concertwith other studies, where a tight relationshipbetween laying date and local spring temperatureswas found in almost all flycatcher populations (Bothet al. 2004, 2005), while the relationship with NAOwas found mainly in northern and western populations(Sanz 2003). Two aspects of climate at our study sitedeserve mention. The relatively weak correlationbetween local temperatures and NAO could partlybe attributed to geographical location – the NAO-index represents large-scale climate fluctuationsmainly over northwest Europe, while its effect onseason progress (Menzel et al. 2005) and avianphenology (Zalakevicius et al. 2005) in central Europeis less clear. The rate of local spring warming wasrelatively steep, but could not be attributed to localanomaly – we found similar patterns in data fromother regional weather stations.
Rescaling of data from the calendar (Julian dates,Fig. 1) to relative dates (days relative to the eventwithin each year, Fig. 3) permitted us to explore theconsistency of within-season patterns across years.The mean onset of laying coincided with the periodof spring that underwent the most marked warmingover the years. Yet, the laying dates advanced at arate that kept the temperature at the onset of layingapproximately stable (FLD) or only marginallyincreasing (MLD) over the years.
Once laying began, the number of clutches initiatedin a particular day of the breeding season was, onaverage (across years), marginally influenced by thetemperature on the preceding days. The overallpattern of estimated effects was similar to that foundin Barn Swallow Hirundo rustica (Saino et al. 2004c).A 3-day delay in response to temperature most likelyrepresents the time a female takes to produce the
Table 5. Mixed model analysis of the number of clutchesinitiated on individual days within a season. Each line of the tablerepresents a separate generalized linear mixed model (Poissonerror distribution, log link) including temperature (centred withinyear) on days –5 to –1 (0 = clutch initiation) as a fixed effectpredictor. Also evaluated were models for two compositepredictors: temperature averaged over days –5 to –1 (Avg), andthe slope of linear regression of daily temperature on days –5 to–1 (Slope). Fixed effect predictors common to all models werethe mean annual temperature for the laying period and thelinear and squared terms of Julian date. Random effects wereyear (1980–2002) and year × daily temperature interaction.Estimates shown are slopes for fixed effect and variancecomponents for random effect. P-values < 0.05 are shown inbold type.
Day
Daily temperature (fixed)Daily temperature× Year (random)
Estimate se P Estimate se
–1 0.009 0.021 0.689 0.007 0.003–2 0.030 0.030 0.321 0.016 0.007–3 0.072 0.031 0.032 0.018 0.007–4 0.030 0.033 0.363 0.020 0.008–5 –0.012 0.027 0.673 0.013 0.005Avg 0.093 0.063 0.157 0.078 0.030Slope 0.035 0.059 0.562 0.057 0.024
© 2007 The AuthorsJournal compilation © 2007 British Ornithologists’ Union
Climate and phenology in the Collared Flycatcher 845
first egg, a process that once started is inevitable. Ourlong-term study permitted us to include year as arandom factor in the analysis, which revealed significantvariation among years in the effect of daily temper-ature. This means that the effect was detectable(significant) in some years but not in others, a factthat may have serious implications for the conclusionsof short-term studies (Sparks & Tryjanowski 2005).The mean temperature during the laying periodentered in the model as a year-level covariate did notexplain the variation among years. Most importantly,no temporal trend existed in the year-specifictemperature effects, suggesting that the responses offemales to day-to-day variation in ambient tempera-ture during the egg-laying season did not changesystematically over the years. We suspect, however,that analyses of this kind are confounded by varia-tion in laying dates that is not related to ambienttemperature, and which is not sufficiently controlledfor by including an overall seasonal trend (linear andquadratic effect of date) in the analysis as a covariate.
We found close correspondence between theaverage population-level and the individual-levelresponses of laying date to climate variation at bothlocal and continental scales. Although results of ourcross-sectional analysis (and majority of otherpublished studies) may have been partly influencedby uncontrolled variation (unknown age of manyfemales) and pseudoreplication (multiple nestingattempts by the same female in different years), webelieve that this does not invalidate our conclusions.First, we found only weak age-dependence of layingdates in the sample of aged females. Secondly, para-meter estimates are not affected by pseudoreplicationas much as their variances. Hence, we conclude fromthe similarity of estimated effect sizes that thepopulation-level advancement of laying dates maybe attributable to phenotypic plasticity – adjustmentof laying dates by individual females to variableclimatic conditions encountered during their life.Additional support for phenotypic plasticity comesfrom the fact that the long-term trend in laying dateswas largely attributable to climatic variation amongyears. The evidence in favour of phenotypic plasticity,as opposed to microevolutionary change, is in linewith other studies of laying dates in long-distancemigrants (Przybylo et al. 2000, Sheldon et al. 2003,Saino et al. 2004a, Both & Visser 2005).
Despite the trend towards warmer springs at thebreeding area, we found no long-term trend inarrival dates and no correlation between FADs andlocal spring temperature, which is in agreement with
findings in several central European Pied Flycatcherpopulations (Hüppop & Winkel 2006). Tempera-tures at wintering and migration grounds did notchange over the years (this study) or may even havedecreased (Gordo et al. 2005), and their annualvariation only weakly correlated with FADs. Althoughnot significant, the direction of these correlationssupports the idea of relatively later departure fromequatorial Africa in warmer years (Kanuscák et al.2004, Saino et al. 2004b, Gordo et al. 2005) andfaster spring migration across warmer staging areas(Ahola et al. 2004, Both et al. 2005, Hüppop &Winkel 2006). The progression of spring migrationin Pied Flycatchers was shown to correlate with tem-perature encountered along the different migrationroutes within Europe (Hüppop & Winkel 2006). Asthe rate of climatic change varies both in space(among migration routes) and in time (among differentperiods of spring), it has been hypothesized thatmigrants along the eastern route may not benefitfrom increasing average spring temperatures asmuch as their western counterparts (Hüppop &Winkel 2006). Although the exact migration routeof Collared Flycatchers from central Europe is as yetunknown (see Methods), our data support the ideaof environmental constraints upon arrival timethrough local climatic barriers. By rescaling arrivaltimes from calendar to relative dates we found thatFADs coincided with the period showing a within-season warming but no long-term trend. Becauseflycatchers arrive just at a period of warming, andtemperature in the preceding period did not changeor even decreased, they may pay a considerable costif they had advanced their arrival date.
We acknowledge that FADs are prone to method-ological bias (Tryjanowski et al. 2005) and may notrepresent the whole population (Hüppop & Hüppop2003). Recently, FADs were shown to correlate withthe shape of arrival distribution (Ahola et al. 2004,Sparks et al. 2005), which prevents us from extra-polating trends from FADs to the whole population.However, because FADs generally change morerapidly than population quantiles (Töttrup et al.2006) and because FADs in our study did not changeover the years, it is unlikely that the whole popu-lation arrival time had undergone a marked directionalchange. FADs in our study were negatively correlatedwith annual breeding density (note that breedingdensity may not represent density during the arrivalperiod). We argue, however, that this fact alonecannot prove methodological artefacts (increasedprobability of early observation with higher density;
846 K. Weidinger & M. Král
© 2007 The Authors Journal compilation © 2007 British Ornithologists’ Union
Tryjanowski & Sparks 2001). Moreover, becausebreeding density in our study area remained stable,our basic argument that FADs did not change overthe years remains valid.
Advancement of laying dates despite a lack of aparallel trend in arrival dates means that the arrival–laying interval declined over the years (about0.5 days per year). If we assume that FADs reasonablyreflect arrival of the entire population (but seeabove), then the time between arrival and laying hasdecreased. Flycatchers are income breeders; theirability to breed depends on food obtained afterarrival at the breeding area. We have no data on foodavailability during the pre-laying period and itsvariation over years, but indirect evidence (see alsoBauer 2006) suggests that a similar amount of foodmay be available during a shorter period. The devel-opment of vegetation and invertebrate prey dependson the warmth sum above some physiologicalthreshold rather than on the mean temperature(Visser & Holleman 2001). We found that thedecline of the arrival–laying interval was partlycompensated for by the increasing mean temperature,which kept the sum of daily temperatures approxi-mately stable over the years.
Although the birds were able to lay, on average,shortly after arrival, it is not clear whether theresulting advancement of laying date was sufficientto maintain synchronization between offspring needsand a possibly advanced peak in food supply. Evidencefrom other flycatcher populations (Both & Visser2001, Both et al. 2004, 2006) and organisms ingeneral (Both & Visser 2005) suggests that this maynot be the case. Whether the stable arrival time inour Flycatcher population is a constraint uponfurther adjustment of laying date to climate changeand whether birds can potentially adjust their arrivaldates (Both et al. 2005) are open to further study.
Data analysis and writing of this paper was supportedby the Grant Agency of the Czech Republic (GA$R206/07/0483) and by the Ministry of Education of theCzech Republic (MSM6198959212). Data on migrationwere kindly provided by the Ringing station of theNational Museum, Prague. We thank P. Adamík, M. Krist,V. Remes and S. Bures for comments on the manuscript.The work complies with the current laws of the CzechRepublic.
REFERENCES
Ahola, M., Laaksonen, T., Sippola, K., Eeva, T., Rainio, K. &Lehikoinen, E. 2004. Variation in climate warming along the
migration route uncouples arrival and breeding dates. GlobalChange Biol. 10: 1610–1617.
Bauer, Z. 2006. The phenological trends of the components offloodplain forests of South Moravia in the case of Ulmi-fraxinetacarpini in the period from 1961 to 2000. Part II: The phenologyof herbs and birds. Meteorogické Zprávy (Meteor. Bull.) 59:113–117.
Berthold, P., Helbig, A.J., Mohr, G. & Querner, U. 1992. Rapidmicroevolution of migratory behaviour in a wild bird species.Nature 360: 668–670.
Both, C. & Visser, M.E. 2001. Adjustment to climate change isconstrained by arrival date in a long-distance migrant bird.Nature 411: 296–298.
Both, C. & Visser, M.E. 2005. The effect of climate change onthe correlation between avian life-history traits. GlobalChange Biol. 11: 1606–1613.
Both, C., Artemyev, A.V., Blaauw, B., Cowie, R.J., Dekhuijzen,A.J., Eeva, T., Enemar, A., Gustafsson, L., Ivankina, E.V.,Jarvinen, A., Metcalfe, N.B., Nyholm, N.E.I., Potti, J.,Ravussin, P.A., Sanz, J.J., Silverin, B., Slater, F.M.,Sokolov, L.V., Torok, J., Winkel, W., Wright, J., Zang, H. &Visser, M.E. 2004. Large-scale geographical variationconfirms that climate change causes birds to lay earlier.Proc. R. Soc. Lond. B 271: 1657–1662.
Both, C., Bijlsma, R.G. & Visser, M.E. 2005. Climatic effects ontiming of spring migration and breeding in a long-distancemigrant, the Pied Flycatcher Ficedula hypoleuca. J. AvianBiol. 36: 368–373.
Both, C., Bouwhuis, S., Lessells, C.M. & Visser, M.E. 2006.Climate change and population declines in a long-distancemigratory bird. Nature 441: 81–83.
Cramp, S. & Perrins, C.M. (eds) 1993. The Birds of the WesternPalearctic, Vol. 7. Oxford: Oxford University Press.
Crick, H.Q.P. 2004. The impact of climate change on birds.Ibis 146 (Suppl. 1): 48–56.
Crick, H.Q.P. & Sparks, T.H. 1999. Climate change related toegg-laying trends. Nature 399: 423–424.
Gordo, O., Brotons, L., Ferrer, X. & Comas, P. 2005. Dochanges in climate patterns in wintering areas affect thetiming of the spring arrival of trans-Saharan migrant birds?Global Change Biol. 11: 12–21.
Hubálek, Z. 2004. Global weather variability affects avianphenology: a long-term analysis, 1881–2001. Folia Zool. 53:227–236.
Hüppop, O. & Hüppop, K. 2003. North Atlantic Oscillation andtiming of spring migration in birds. Proc. R. Soc. Lond. B 270:233–240.
Hüppop, O. & Winkel, W. 2006. Climate change and timing ofspring migration in the long-distance migrant Ficedulahypoleuca in central Europe: the role of spatially differenttemperature changes along migration routes. J. Ornithol.147: 344–353.
Hurrell, J.W. 1995. Decadal trends in the North AtlanticOscillation: regional temperatures and precipitation. Science269: 676–679.
Kanus5ák, P., Hromada, M., Tryjanowski, P. & Sparks, T.2004. Does climate at different scales influence the phenologyand phenotype of the River Warbler Locustella fluviatilis?Oecologia 141: 158–163.
Král, M. 1982. P®íspEvek k hnízdní bionomii lejska bElokrkého(Ficedula albicollis) v Nízkém Jeseníku. Zpravy MOS 40: 7–42.
© 2007 The AuthorsJournal compilation © 2007 British Ornithologists’ Union
Climate and phenology in the Collared Flycatcher 847
Laaksonen, T., Ahola, M., Eeva, T., Vaisanen, R.A. &Lehikoinen, E. 2006. Climate change, migratory connectivityand changes in laying date and clutch size of the piedflycatcher. Oikos 114: 277–290.
McCleery, R.H. & Perrins, C.M. 1998. Temperature and egg-layingtrends. Nature 391: 30–31.
Menzel, A., Sparks, T.H., Estrella, N. & Eckhardt, S. 2005. ‘SWto NNE’ – North Atlantic Oscillation affects the progressof seasons across Europe. Global Change Biol. 11: 909–918.
Neter, J., Wasserman, W. & Kutner, M.H. 1985. Applied LinearStatistical Models: Regression, Analysis of Variance andExperimental Designs. Homewood, IL: Irwin.
Nussey, D.H., Postma, E., Gienapp, P. & Visser, M.E. 2005.Selection on heritable phenotypic plasticity in a wild birdpopulation. Science 310: 304–306.
Przybylo, R., Sheldon, B.C. & Merila, J. 2000. Climatic effectson breeding and morphology: evidence for phenotypicplasticity. J. Anim. Ecol. 69: 395–403.
Sæther, B.E., Engen, S., Møller, A.P., Matthysen, E.,Adriaensen, F., Fiedler, W., Leivits, A., Lambrechts, M.M.,Visser, M.E., Anker-Nilssen, T., Both, C., Dhondt, A.A.,McCleery, R.H., McMeeking, J., Potti, J., Rostad, O.W. &Thomson, D. 2003. Climate variation and regional gradientsin population dynamics of two hole-nesting passerines. Proc.R. Soc. Lond. B 270: 2397–2404.
Sætre, G.P., Post, E. & Král, M. 1999. Can environmentalfluctuation prevent competitive exclusion in sympatricflycatchers? Proc. R. Soc. Lond. B 266: 1247–1251.
Saino, N., Szep, T., Ambrosini, R., Romano, M. & Møller, A.P.2004a. Ecological conditions during winter affect sexualselection and breeding in a migratory bird. Proc. R. Soc.Lond. B 271: 681–686.
Saino, N., Szep, T., Romano, M., Rubolini, D., Spina, F. &Møller, A.P. 2004b. Ecological conditions during winterpredict arrival date at the breeding quarters in a trans-Saharanmigratory bird. Ecol. Lett. 7: 21–25.
Saino, N., Romano, M., Ambrosini, R., Ferrari, R.P. & Møller, A.P.2004c. Timing of reproduction and egg quality covarywith temperature in the insectivorous Barn Swallow, Hirundorustica. Funct. Ecol. 18: 50–57.
Sanz, J.J. 2003. Large-scale effect of climate change onbreeding parameters of pied flycatchers in Western Europe.Ecography 26: 45–50.
SAS institute Inc. 2005. SAS OnLine Doc. Cary, NC: SASInstitute Inc.
Sheldon, B.C., Kruuk, L.E.B. & Merila, J. 2003. Naturalselection and inheritance of breeding time and clutch size inthe collared flycatcher. Evolution 57: 406–420.
Slater, F.M. 1999. First-egg date fluctuations for the PiedFlycatcher Ficedula hypoleuca in the woodlands of mid-Walesin the twentieth century. Ibis 141: 497–499.
Sparks, T.H. & Tryjanowski, P. 2005. The detection of climateimpacts: some methodological considerations. Int. J. Climatol.25: 271–277.
Sparks, T.H., Bairlein, F., Bojarinova, J.G., Hüppop, O.,Lehikoinen, E.A., Rainio, K., Sokolov, L.V. & Walker, D.2005. Examining the total arrival distribution of migratorybirds. Global Change Biol. 11: 22–30.
Stenseth, N.C., Ottersen, G., Hurrell, J.W., Mysterud, A.,Lima, M., Chan, K.S., Yoccoz, N.G. & Adlandsvik, B. 2003.Studying climate effects on ecology through the use ofclimate indices: the North Atlantic Oscillation, El Niño SouthernOscillation and beyond. Proc. R. Soc. Lond. B 270: 2087–2096.
Torti, V.M. & Dunn, P.O. 2005. Variable effects of climatechange on six species of North American birds. Oecologia145: 486–495.
Töttrup, A.P., Thorup, K. & Rahbek, C. 2006. Patterns ofchange in timing of spring migration in North Europeansongbird populations. J. Avian Biol. 37: 84–92.
Tryjanowski, P. & Sparks, T.H. 2001. Is the detection of the firstarrival date of migrating birds influenced by populationsize? A case study of the red-backed shrike Lanius collurio.Int. J. Biometeorol. 45: 217–219.
Tryjanowski, P., Kuzniak, S. & Sparks, T. 2002. Earlier arrival ofsome farmland migrants in western Poland. Ibis 144: 62–68.
Tryjanowski, P., Kuzniak, S. & Sparks, T.H. 2005. What affectsthe magnitude of change in first arrival dates of migrantbirds? J. Ornithol. 146: 200–205.
Visser, M.E. & Both, C. 2005. Shifts in phenology due to globalclimate change: the need for a yardstick. Proc. R. Soc. Lond.B 272: 2561–2569.
Visser, M.E. & Holleman, L.J.M. 2001. Warmer springs disruptthe synchrony of oak and winter moth phenology. Proc. R.Soc. Lond. B 268: 289–294.
Visser, M.E., Adriaensen, F., van Balen, J.H., Blondel, J.,Dhondt, A.A., van Dongen, S.F., Ivankina, E.V., Kerimov,A.B., de Laet, J., Matthysen, E., McCleery, R., Orell, M. &Thomson, D.L. 2003. Variable responses to large-scaleclimate change in European Parus populations. Proc. R. Soc.Lond. B 270: 367–372.
Watkinson, A.R., Gill, J.A. & Hulme, M. 2004. Flying in the faceof climate change: a review of climate change, past, presentand future. Ibis 146 (Suppl. 1): 4–10.
Weatherhead, P.J. 2005. Effects of climate variation on timing ofnesting, reproductive success, and offspring sex ratios ofred-winged blackbirds. Oecologia 144: 168–175.
Zalakevicius, M., Bartkeviciene, G., Raudonikis, L. &Janulaitis, J. 2006. Spring arrival response to climatechange in birds: a case study from eastern Europe. J. Ornithol.147: 326–343.
Received 22 November 2006; revision accepted 17 April 2007.