Embed Size (px)
Citation preview
167
Chapter 8 Nauru
168 Climate Variability, Extremes and Change in the Western Tropical Pacific: New Science and Updated Country Reports
8.1.1 Current Climate• Over the past half century it is likely
that there has been a warming air temperature trend at Nauru which is partly associated with warming ocean temperatures.
• Annual and half-year rainfall trends from 1927 show little change at Nauru.
• Variability of wind-waves at Nauru is characterised by trade winds seasonally, and the El Niño–Southern Oscillation (ENSO) interannually. Available data are not suitable for assessing long-term trends (see Section 1.3).
8.1.2 Climate Projections• For the period to 2100, the latest
global climate model (GCM) projections and climate science findings indicate:
• El Niño and La Niña events will continue to occur in the future (very high confidence), but there is little consensus on whether these events will change in intensity or frequency;
• Annual mean temperatures and extremely high daily temperatures will continue to rise (very high confidence);
• Mean rainfall is projected to increase (medium confidence), along with more extreme rain events (high confidence);
• Droughts are projected to decline in frequency (medium confidence);
• Ocean acidification is expected to continue (very high confidence);
• The risk of coral bleaching will increase in the future (very high confidence);
• Sea level will continue to rise (very high confidence); and
• Wave height and period are projected to decrease in December–March (low confidence). No significant changes are projected in June–September (low confidence).
8.1 Climate Summary
8.2 Data Availability
Currently, meteorological observations are taken by two automatic weather stations (AWS; data from the Bureau of Meteorology ‘ARC-2’ AWS are available from July 2003) and a manual rain gauge near Yaren. There is also a sub-daily rain gauge near the centre of the island which has been operational since October 2009. Nauru data are available from 1893 to present for rainfall and 1951 to present
for air temperature; however there are significant gaps in both records. Monthly rainfall data, homogeneous from 1927 has been used in this report. There are insufficient air temperature data for trend analyses. The search for historical hard copy and digitised climate data for Nauru is ongoing.
Wind-wave data from buoys are particularly sparse in the Pacific region, with very short records. Model and reanalysis data are therefore required to detail the wind-wave climate of the region. Reanalysis surface wind data have been used to drive a wave model over the period 1979–2009 to generate a hindcast of the historical wind-wave climate.
169Chapter 8: Nauru
Information on temperature and rainfall seasonal cycles can be found in Australian Bureau of Meteorology and CSIRO (2011).
8.3.1 Wind-driven WavesSurface wind-wave driven processes can impact on many aspects of Pacific Island coastal environments, including: coastal flooding during storm wave events; coastal erosion, both during episodic storm events and due to long-term changes in integrated wave climate; characterisation of reef morphology and marine habitat/species distribution; flushing and circulation of lagoons; and potential shipping and renewable wave energy solutions. The surface offshore wind-wave climate can be described by characteristic wave heights, lengths or periods, and directions.
8.3 Seasonal Cycles
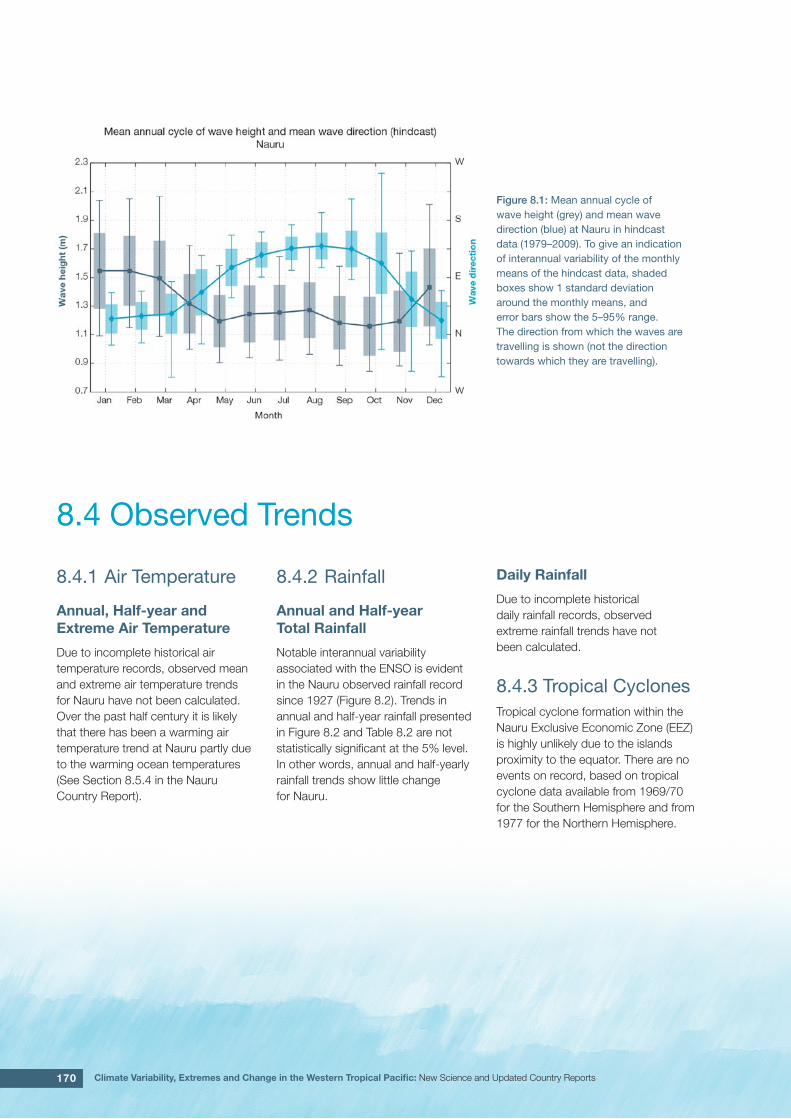
The wind-wave climate of Nauru is strongly characterised by the seasonal trade winds. On the west coast of Nauru, waves are directed from the south-east during June–September, and are directed from the north-east, and are slightly larger and longer than in the dry months, during December–March (Table 8.1, Figure 8.1). In June–September, swell waves are incident from the south resulting from extra-tropical storms, while in December–March waves are also observed from the west due to monsoon systems and from the north due to North Pacific extra-tropical storms. Waves larger than 2.3 m (99th percentile) occur predominantly during the wet season, generated by North Pacific extra-tropical storms and are observed as long, northerly and north-westerly swell. Some large westerly waves, thought to be generated by Philippine typhoons based on their wavelength
and direction, have been observed in other months (August and November). The height of a 1-in-50 year wave event on the west coast is calculated to be 5.0 m.
No suitable dataset is available to assess long-term historical trends in the Nauru wave climate. However, interannual variability may be assessed in the hindcast record. The wind-wave climate displays strong interannual variability at Nauru, varying strongly with the El Niño–Southern Oscillation (ENSO). During La Niña years, wave power is approximately 30% greater than during El Niño years in June–September, and waves are more strongly directed from the east year round, associated with increased trade wind speeds.
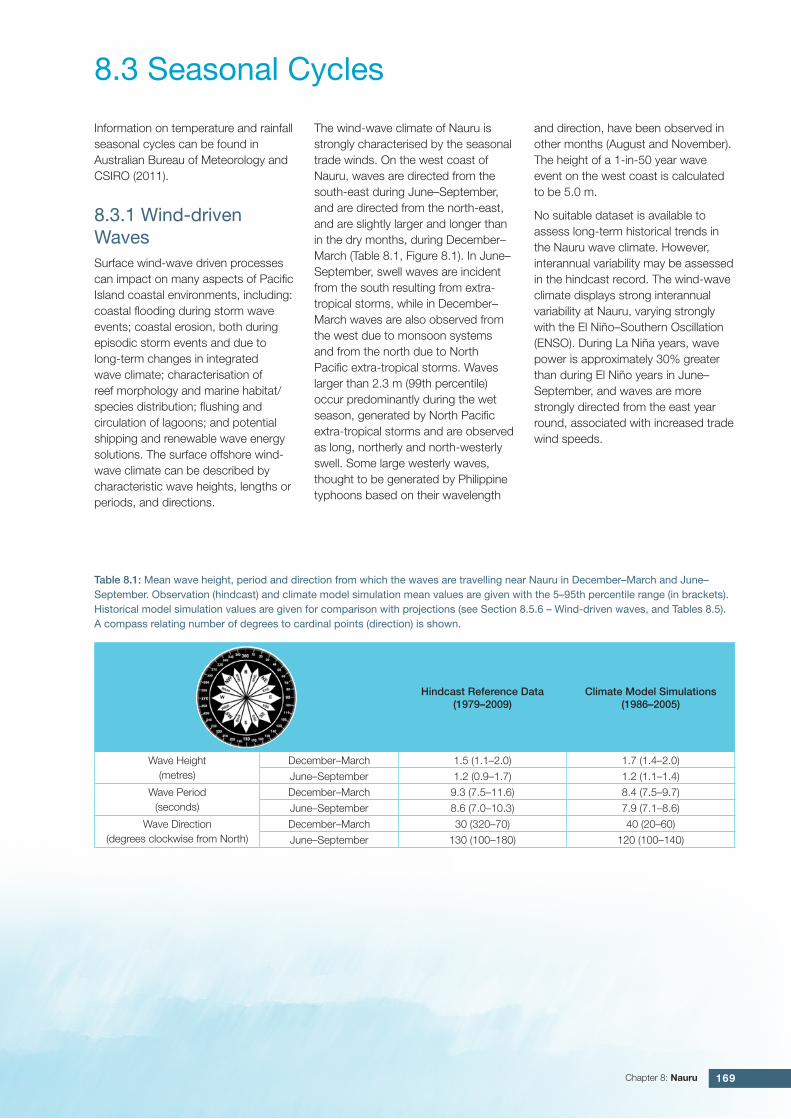
Table 8.1: Mean wave height, period and direction from which the waves are travelling near Nauru in December–March and June–September. Observation (hindcast) and climate model simulation mean values are given with the 5–95th percentile range (in brackets). Historical model simulation values are given for comparison with projections (see Section 8.5.6 – Wind-driven waves, and Tables 8.5). A compass relating number of degrees to cardinal points (direction) is shown.
Hindcast Reference Data (1979–2009)
Climate Model Simulations (1986–2005)
Wave Height(metres)
December–March 1.5 (1.1–2.0) 1.7 (1.4–2.0)
June–September 1.2 (0.9–1.7) 1.2 (1.1–1.4)
Wave Period(seconds)
December–March 9.3 (7.5–11.6) 8.4 (7.5–9.7)
June–September 8.6 (7.0–10.3) 7.9 (7.1–8.6)
Wave Direction(degrees clockwise from North)
December–March 30 (320–70) 40 (20–60)
June–September 130 (100–180) 120 (100–140)
170 Climate Variability, Extremes and Change in the Western Tropical Pacific: New Science and Updated Country Reports
8.4.1 Air Temperature
Annual, Half-year and Extreme Air Temperature
Due to incomplete historical air temperature records, observed mean and extreme air temperature trends for Nauru have not been calculated. Over the past half century it is likely that there has been a warming air temperature trend at Nauru partly due to the warming ocean temperatures (See Section 8.5.4 in the Nauru Country Report).
8.4.2 Rainfall
Annual and Half-year Total Rainfall
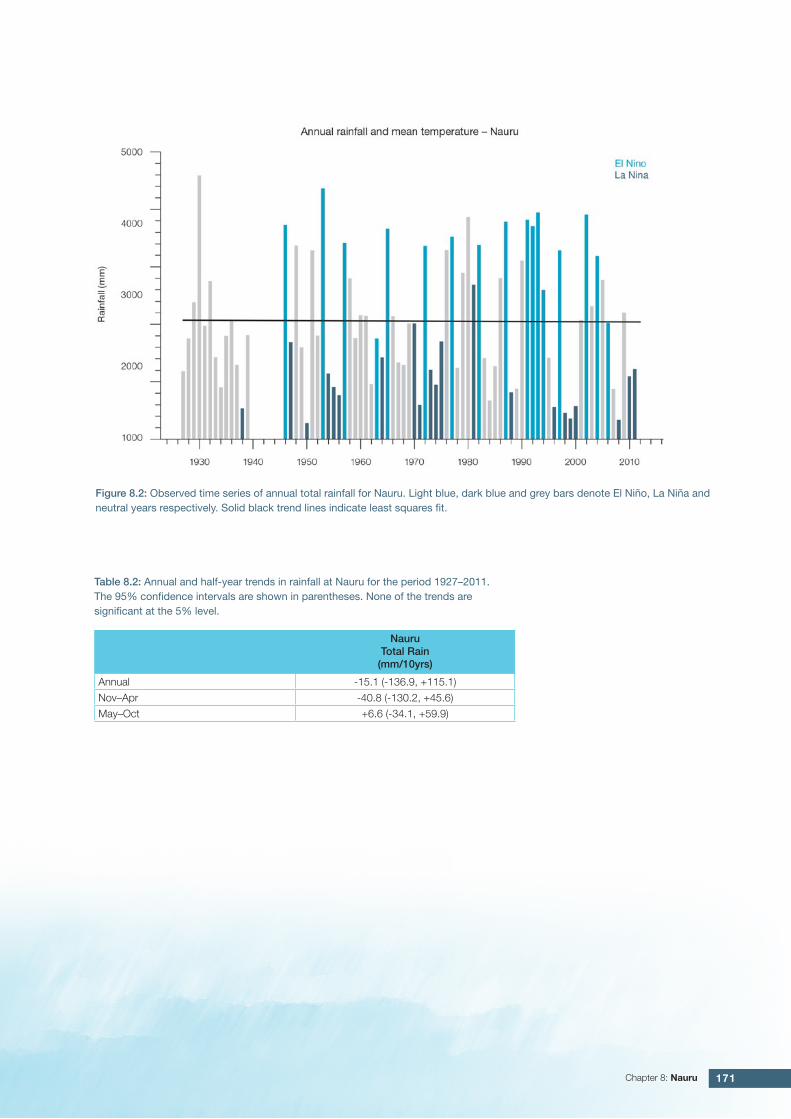
Notable interannual variability associated with the ENSO is evident in the Nauru observed rainfall record since 1927 (Figure 8.2). Trends in annual and half-year rainfall presented in Figure 8.2 and Table 8.2 are not statistically significant at the 5% level. In other words, annual and half-yearly rainfall trends show little change for Nauru.
Daily Rainfall
Due to incomplete historical daily rainfall records, observed extreme rainfall trends have not been calculated.
8.4.3 Tropical CyclonesTropical cyclone formation within the Nauru Exclusive Economic Zone (EEZ) is highly unlikely due to the islands proximity to the equator. There are no events on record, based on tropical cyclone data available from 1969/70 for the Southern Hemisphere and from 1977 for the Northern Hemisphere.
Figure 8.1: Mean annual cycle of wave height (grey) and mean wave direction (blue) at Nauru in hindcast data (1979–2009). To give an indication of interannual variability of the monthly means of the hindcast data, shaded boxes show 1 standard deviation around the monthly means, and error bars show the 5–95% range. The direction from which the waves are travelling is shown (not the direction towards which they are travelling).
8.4 Observed Trends
171Chapter 8: Nauru
Figure 8.2: Observed time series of annual total rainfall for Nauru. Light blue, dark blue and grey bars denote El Niño, La Niña and neutral years respectively. Solid black trend lines indicate least squares fit.
Table 8.2: Annual and half-year trends in rainfall at Nauru for the period 1927–2011. The 95% confidence intervals are shown in parentheses. None of the trends are significant at the 5% level.
Nauru Total Rain
(mm/10yrs)
Annual -15.1 (-136.9, +115.1)
Nov–Apr -40.8 (-130.2, +45.6)
May–Oct +6.6 (-34.1, +59.9)
172 Climate Variability, Extremes and Change in the Western Tropical Pacific: New Science and Updated Country Reports
The performance of the available Coupled Model Intercomparison Project (Phase 5) (CMIP5) climate models over the Pacific has been rigorously assessed (Brown et al., 2013a, b; Grose et al., 2014; Widlansky et al., 2013). The simulation of the key processes and features for the Nauru region is similar to the previous generation of CMIP3 models, with all the same strengths and many of the same weaknesses. The best-performing CMIP5 models used here have lower biases (differences between the simulated and observed climate data) than the best CMIP3 models, and there are fewer poorly-performing models. For Nauru, the most important model bias is that the models have an ocean that is too cold along the equator of the Pacific, known as the ‘cold-tongue bias’ (Chapter 1). This issue means
that the models underestimate the temperature and rainfall in the present day and this affects the confidence in the model projections. Out of 27 models assessed, three models were rejected for use in these projections due to biases in the mean climate and in the simulation of the SPCZ. Climate projections have been derived from up to 24 new global climate models (GCMs) in the CMIP5 database (the exact number is different for each scenario, Appendix A), compared with up to 18 models in the CMIP3 database reported in Australian Bureau of Meteorology and CSIRO (2011).
It is important to realise that the models used give different projections under the same scenario. This means there is not a single projected future for Nauru, but rather a range of possible futures for each emission scenario. This range is described below.
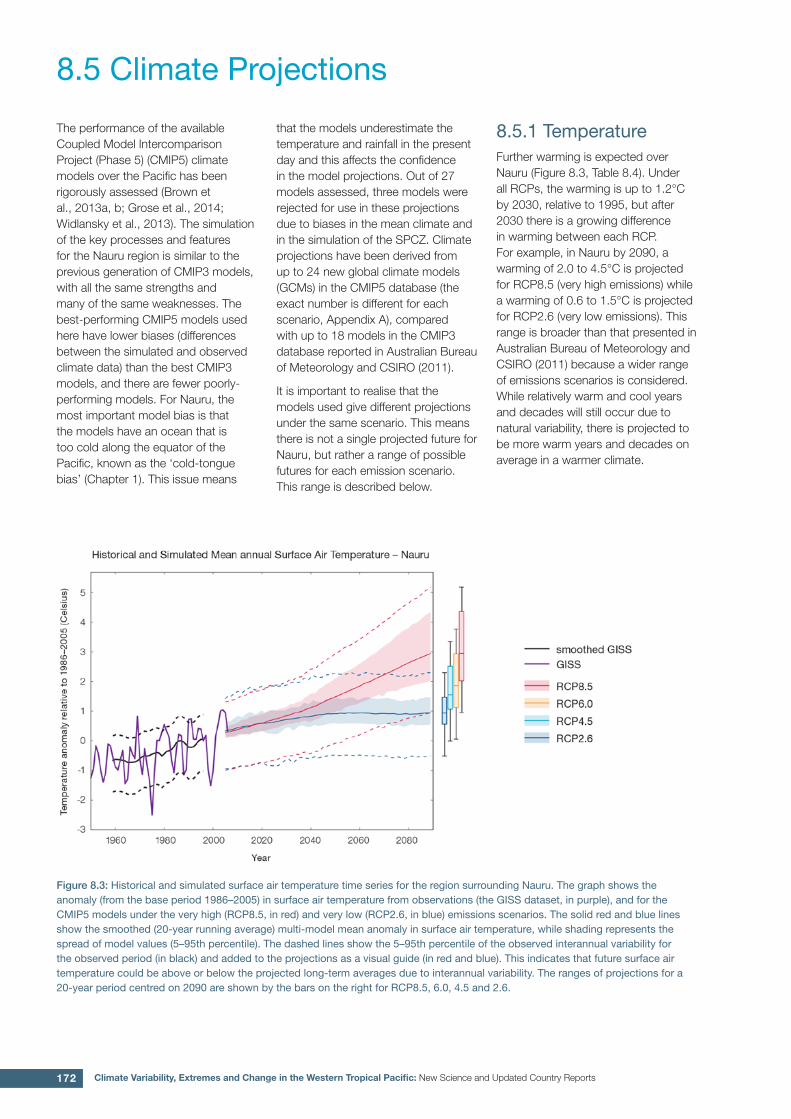
8.5.1 TemperatureFurther warming is expected over Nauru (Figure 8.3, Table 8.4). Under all RCPs, the warming is up to 1.2°C by 2030, relative to 1995, but after 2030 there is a growing difference in warming between each RCP. For example, in Nauru by 2090, a warming of 2.0 to 4.5°C is projected for RCP8.5 (very high emissions) while a warming of 0.6 to 1.5°C is projected for RCP2.6 (very low emissions). This range is broader than that presented in Australian Bureau of Meteorology and CSIRO (2011) because a wider range of emissions scenarios is considered. While relatively warm and cool years and decades will still occur due to natural variability, there is projected to be more warm years and decades on average in a warmer climate.
8.5 Climate Projections
Figure 8.3: Historical and simulated surface air temperature time series for the region surrounding Nauru. The graph shows the anomaly (from the base period 1986–2005) in surface air temperature from observations (the GISS dataset, in purple), and for the CMIP5 models under the very high (RCP8.5, in red) and very low (RCP2.6, in blue) emissions scenarios. The solid red and blue lines show the smoothed (20-year running average) multi-model mean anomaly in surface air temperature, while shading represents the spread of model values (5–95th percentile). The dashed lines show the 5–95th percentile of the observed interannual variability for the observed period (in black) and added to the projections as a visual guide (in red and blue). This indicates that future surface air temperature could be above or below the projected long-term averages due to interannual variability. The ranges of projections for a 20-year period centred on 2090 are shown by the bars on the right for RCP8.5, 6.0, 4.5 and 2.6.
173Chapter 8: Nauru
There is very high confidence that temperatures will rise because:
• It is known from theory and observations that an increase in greenhouse gases will lead to a warming of the atmosphere; and
• Climate models agree that the long-term average temperature will rise.
There is medium confidence in the model average temperature change shown in Table 8.4 because:
• The new models simulate the rate of temperature change of the recent past with reasonable accuracy; and
• Sea-surface temperatures near Nauru are too cold in most CMIP5 climate models in the current climate, and this affects the confidence in the projection into the future.
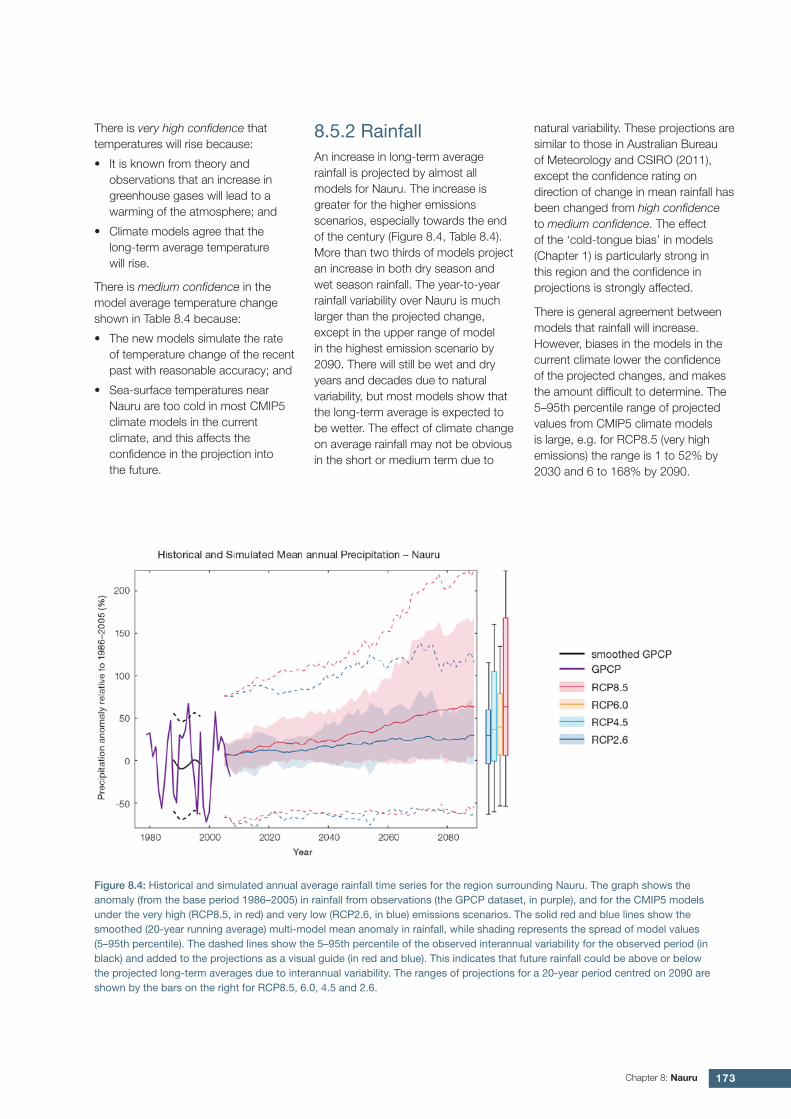
8.5.2 RainfallAn increase in long-term average rainfall is projected by almost all models for Nauru. The increase is greater for the higher emissions scenarios, especially towards the end of the century (Figure 8.4, Table 8.4). More than two thirds of models project an increase in both dry season and wet season rainfall. The year-to-year rainfall variability over Nauru is much larger than the projected change, except in the upper range of model in the highest emission scenario by 2090. There will still be wet and dry years and decades due to natural variability, but most models show that the long-term average is expected to be wetter. The effect of climate change on average rainfall may not be obvious in the short or medium term due to
natural variability. These projections are similar to those in Australian Bureau of Meteorology and CSIRO (2011), except the confidence rating on direction of change in mean rainfall has been changed from high confidence to medium confidence. The effect of the ‘cold-tongue bias’ in models (Chapter 1) is particularly strong in this region and the confidence in projections is strongly affected.
Figure 8.4: Historical and simulated annual average rainfall time series for the region surrounding Nauru. The graph shows the anomaly (from the base period 1986–2005) in rainfall from observations (the GPCP dataset, in purple), and for the CMIP5 models under the very high (RCP8.5, in red) and very low (RCP2.6, in blue) emissions scenarios. The solid red and blue lines show the smoothed (20-year running average) multi-model mean anomaly in rainfall, while shading represents the spread of model values (5–95th percentile). The dashed lines show the 5–95th percentile of the observed interannual variability for the observed period (in black) and added to the projections as a visual guide (in red and blue). This indicates that future rainfall could be above or below the projected long-term averages due to interannual variability. The ranges of projections for a 20-year period centred on 2090 are shown by the bars on the right for RCP8.5, 6.0, 4.5 and 2.6.
There is general agreement between models that rainfall will increase. However, biases in the models in the current climate lower the confidence of the projected changes, and makes the amount difficult to determine. The 5–95th percentile range of projected values from CMIP5 climate models is large, e.g. for RCP8.5 (very high emissions) the range is 1 to 52% by 2030 and 6 to 168% by 2090.
174 Climate Variability, Extremes and Change in the Western Tropical Pacific: New Science and Updated Country Reports
There is medium confidence that the long-term rainfall over Nauru will increase because:
• The majority of CMIP3 and CMIP5 models agree that the rainfall along the equator and in the ITCZ will increase under a warmer climate; and
• Changes in SPCZ rainfall are uncertain. The majority of CMIP5 models simulate increased rainfall in the western part of the SPCZ (Brown et al., 2013a), however rainfall changes are sensitive to sea-surface temperature gradients, which are not well simulated in many models (Widlansky et al., 2013). See Box in Chapter 1 for more details.
There is low confidence in the model average rainfall change shown in Table 8.4 because:
• The complex set of processes involved in tropical rainfall is challenging to simulate in models. This means that the confidence in the projection of rainfall is generally lower than for other variables such as temperature;
• The CMIP5 models are underestimate the present average rainfall of Nauru due to the ’cold-tongue bias’ (Chapter 1), similar to the previous CMIP3 models; and
• The future behaviour of the ENSO is unclear, and the ENSO strongly influences year-to-year rainfall variability.
8.5.3 Extremes
Extreme Temperature
The temperature on extremely hot days is projected to increase by about the same amount as average temperature. This conclusion is based on analysis of daily temperature data from a subset of CMIP5 models (Chapter 1). The frequency of extremely hot days is also expected to increase.
The temperature of the 1-in-20-year hot day is projected to increase by approximately 0.6°C by 2030 under the RCP2.6 (very low) scenario and by 0.9°C under the RCP8.5 (very high) scenario. By 2090 the projected increase is 0.8°C for RCP2.6 (very low) and 3°C for RCP8.5 (very high).
There is very high confidence that the temperature of extremely hot days and the temperature of extremely cool days will increase, because:
• A change in the range of temperatures, including the extremes, is physically consistent with rising greenhouse gas concentrations;
• This is consistent with observed changes in extreme temperatures around the world over recent decades; and
• All the CMIP5 models agree on an increase in the frequency and intensity of extremely hot days and a decrease in the frequency and intensity of cool days.
There is low confidence in the magnitude of projected change in extreme temperature because models generally underestimate the current intensity and frequency of extreme events, especially in this area, due to the ‘cold-tongue bias’ (Chapter 1). Changes to the particular driver of extreme temperatures affect whether the change to extremes is more or less than the change in the average temperature, and the changes to the drivers of extreme temperatures in Nauru are currently unclear. Also, while all models project the same direction of change there is a wide range in the projected magnitude of change among the models.
Extreme Rainfall
The frequency and intensity of extreme rainfall events are projected to increase. This conclusion is based on analysis of daily rainfall data from a subset of CMIP5 models using a similar method to that in Australian Bureau of Meteorology and CSIRO (2011) with some improvements (Chapter 1), so the results are slightly different to those in Australian Bureau of Meteorology and CSIRO (2011). The current 1-in-20-year daily rainfall amount is projected to increase by approximately 4 mm by 2030 for RCP2.6 and by 10 mm by 2030 for RCP8.5 (very high emissions). By 2090, it is projected to increase by approximately 16 mm for RCP2.6 and by 29 mm for RCP8.5 (very high emissions).The majority of models project the current 1-in-20-year daily rainfall event will become, on average, a 1-in-10-year event for RCP2.6 and a 1-in-5-year event for RCP8.5 (very high emissions) by 2090. These results are different to those found in Australian Bureau of Meteorology and CSIRO (2011) because of different methods used (Chapter 1).
175Chapter 8: Nauru
There is high confidence that the frequency and intensity of extreme rainfall events will increase because:
• A warmer atmosphere can hold more moisture, so there is greater potential for extreme rainfall (IPCC, 2012); and
• Increases in extreme rainfall in the Pacific are projected in all available climate models.
There is low confidence in the magnitude of projected change in extreme rainfall because:
• Models generally underestimate the current intensity of local extreme events, especially in this area due to the ‘cold-tongue bias’ (Chapter 1);
• Changes in extreme rainfall projected by models may be underestimated because models seem to underestimate the observed increase in heavy rainfall with warming (Min et al., 2011);
• GCMs have a coarse spatial resolution, so they do not adequately capture some of the processes involved in extreme rainfall events; and
• The Conformal Cubic Atmospheric Model (CCAM) downscaling model has finer spatial resolution and the CCAM results presented in Australian Bureau of Meteorology and CSIRO (2011) indicates a smaller increase in the number of extreme rainfall days, and there is no clear reason to accept one set of models over another.
Drought
Drought projections (defined in Chapter 1) are described in terms of changes in proportion of time in drought, frequency and duration by 2090 for very low and very high emissions (RCP2.6 and 8.5).
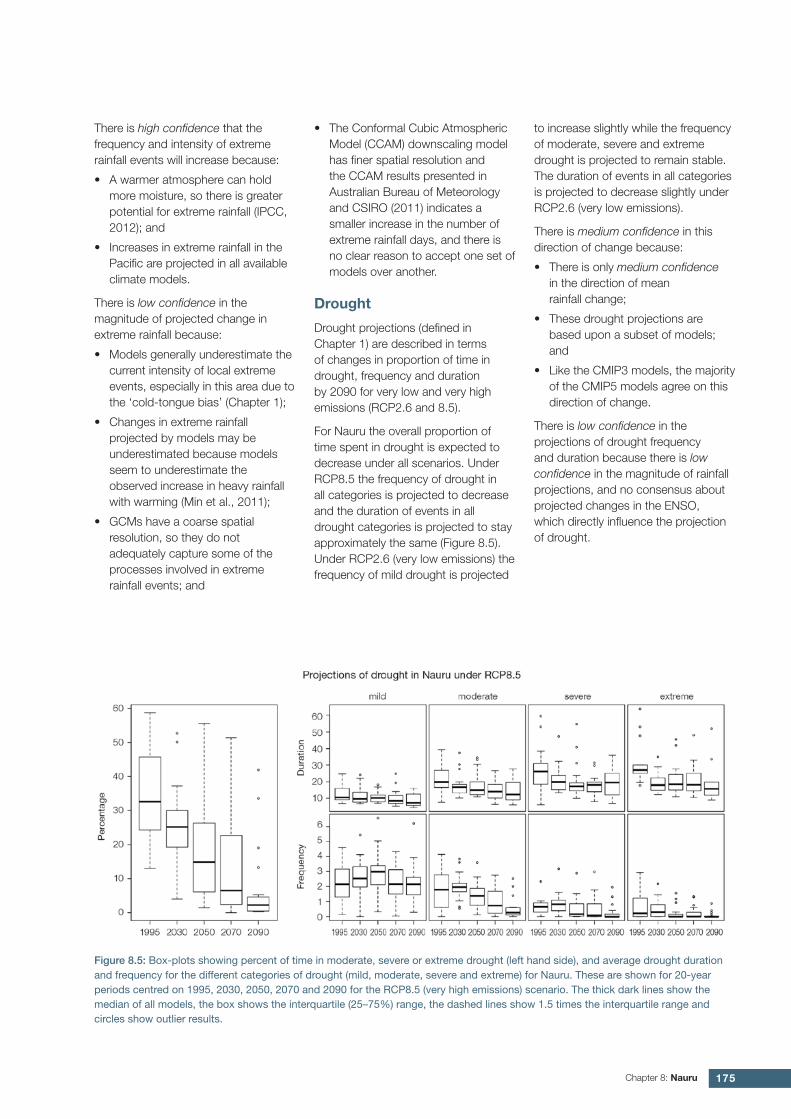
For Nauru the overall proportion of time spent in drought is expected to decrease under all scenarios. Under RCP8.5 the frequency of drought in all categories is projected to decrease and the duration of events in all drought categories is projected to stay approximately the same (Figure 8.5). Under RCP2.6 (very low emissions) the frequency of mild drought is projected
to increase slightly while the frequency of moderate, severe and extreme drought is projected to remain stable. The duration of events in all categories is projected to decrease slightly under RCP2.6 (very low emissions).
There is medium confidence in this direction of change because:
• There is only medium confidence in the direction of mean rainfall change;
• These drought projections are based upon a subset of models; and
• Like the CMIP3 models, the majority of the CMIP5 models agree on this direction of change.
There is low confidence in the projections of drought frequency and duration because there is low confidence in the magnitude of rainfall projections, and no consensus about projected changes in the ENSO, which directly influence the projection of drought.
Figure 8.5: Box-plots showing percent of time in moderate, severe or extreme drought (left hand side), and average drought duration and frequency for the different categories of drought (mild, moderate, severe and extreme) for Nauru. These are shown for 20-year periods centred on 1995, 2030, 2050, 2070 and 2090 for the RCP8.5 (very high emissions) scenario. The thick dark lines show the median of all models, the box shows the interquartile (25–75%) range, the dashed lines show 1.5 times the interquartile range and circles show outlier results.
176 Climate Variability, Extremes and Change in the Western Tropical Pacific: New Science and Updated Country Reports
8.5.4 Coral Reefs and Ocean AcidificationAs atmospheric CO2 concentrations continue to rise, oceans will warm and continue to acidify. These changes will impact the health and viability of marine ecosystems, including coral reefs that provide many key ecosystem services (high confidence). These impacts are also likely to be compounded by other stressors such as storm damage, fishing pressure and other human impacts.
The projections for future ocean acidification and coral bleaching use three RCPs (2.6, 4.5, and 8.5).
Ocean Acidification
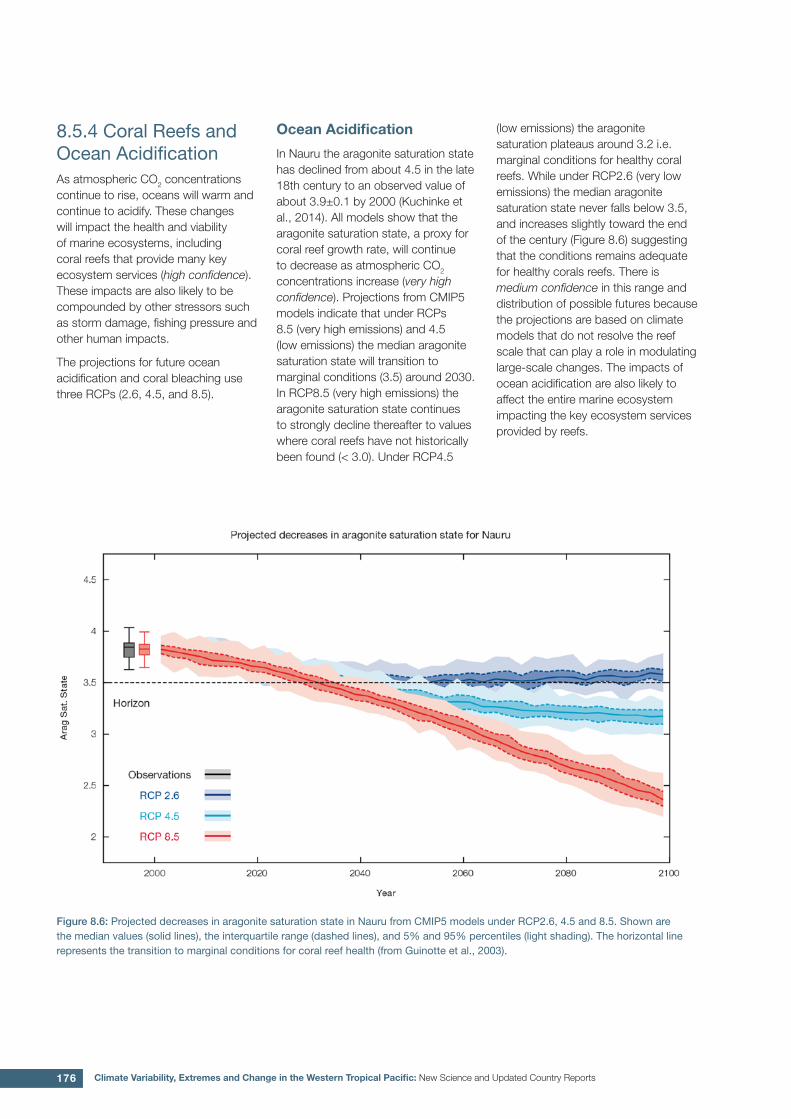
In Nauru the aragonite saturation state has declined from about 4.5 in the late 18th century to an observed value of about 3.9±0.1 by 2000 (Kuchinke et al., 2014). All models show that the aragonite saturation state, a proxy for coral reef growth rate, will continue to decrease as atmospheric CO2 concentrations increase (very high confidence). Projections from CMIP5 models indicate that under RCPs 8.5 (very high emissions) and 4.5 (low emissions) the median aragonite saturation state will transition to marginal conditions (3.5) around 2030. In RCP8.5 (very high emissions) the aragonite saturation state continues to strongly decline thereafter to values where coral reefs have not historically been found (< 3.0). Under RCP4.5
(low emissions) the aragonite saturation plateaus around 3.2 i.e. marginal conditions for healthy coral reefs. While under RCP2.6 (very low emissions) the median aragonite saturation state never falls below 3.5, and increases slightly toward the end of the century (Figure 8.6) suggesting that the conditions remains adequate for healthy corals reefs. There is medium confidence in this range and distribution of possible futures because the projections are based on climate models that do not resolve the reef scale that can play a role in modulating large-scale changes. The impacts of ocean acidification are also likely to affect the entire marine ecosystem impacting the key ecosystem services provided by reefs.
Figure 8.6: Projected decreases in aragonite saturation state in Nauru from CMIP5 models under RCP2.6, 4.5 and 8.5. Shown are the median values (solid lines), the interquartile range (dashed lines), and 5% and 95% percentiles (light shading). The horizontal line represents the transition to marginal conditions for coral reef health (from Guinotte et al., 2003).
177Chapter 8: Nauru
Coral Bleaching Risk
As the ocean warms, the risk of coral bleaching increases (very high confidence). There is medium confidence in the projected rate of change for Nauru because there is medium confidence in the rate of change of sea-surface temperature (SST), and the changes at the reef scale (which can play a role in modulating large-scale changes) are not adequately resolved. Importantly, the coral bleaching risk calculation does not account the impact of other potential stressors (Chapter 1).
Corals can bleach when they are exposed to elevated temperatures over extended periods.
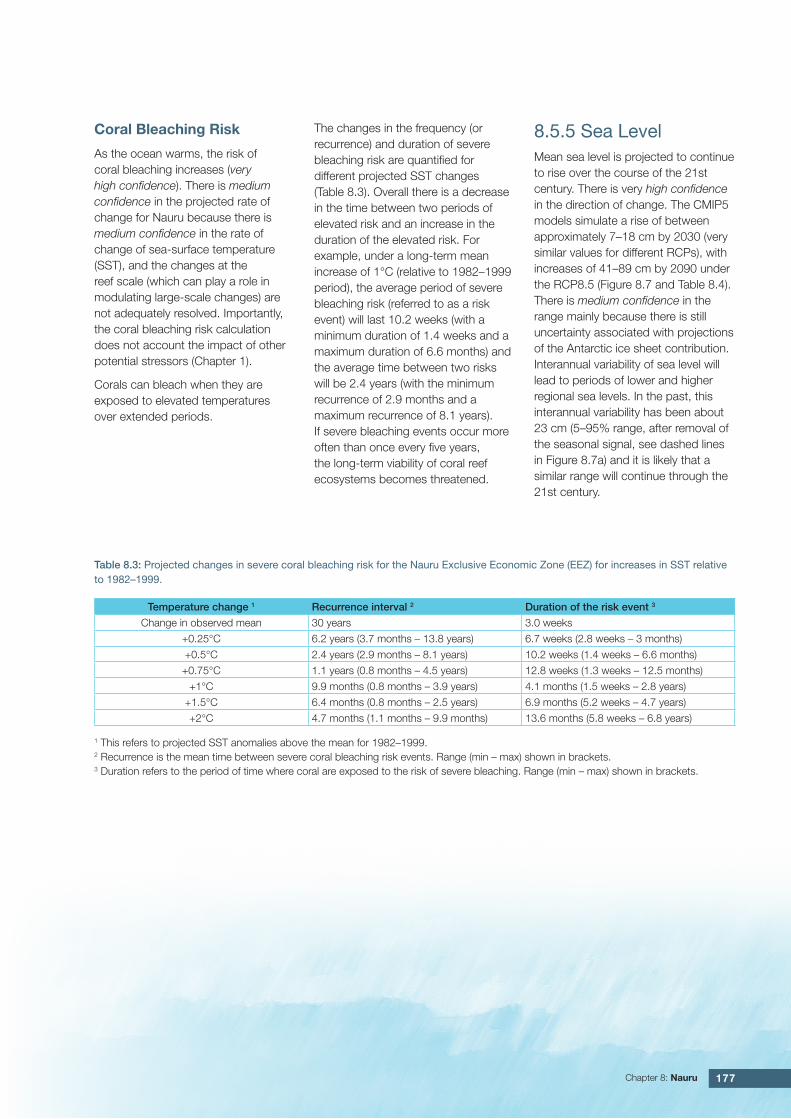
The changes in the frequency (or recurrence) and duration of severe bleaching risk are quantified for different projected SST changes (Table 8.3). Overall there is a decrease in the time between two periods of elevated risk and an increase in the duration of the elevated risk. For example, under a long-term mean increase of 1°C (relative to 1982–1999 period), the average period of severe bleaching risk (referred to as a risk event) will last 10.2 weeks (with a minimum duration of 1.4 weeks and a maximum duration of 6.6 months) and the average time between two risks will be 2.4 years (with the minimum recurrence of 2.9 months and a maximum recurrence of 8.1 years). If severe bleaching events occur more often than once every five years, the long-term viability of coral reef ecosystems becomes threatened.
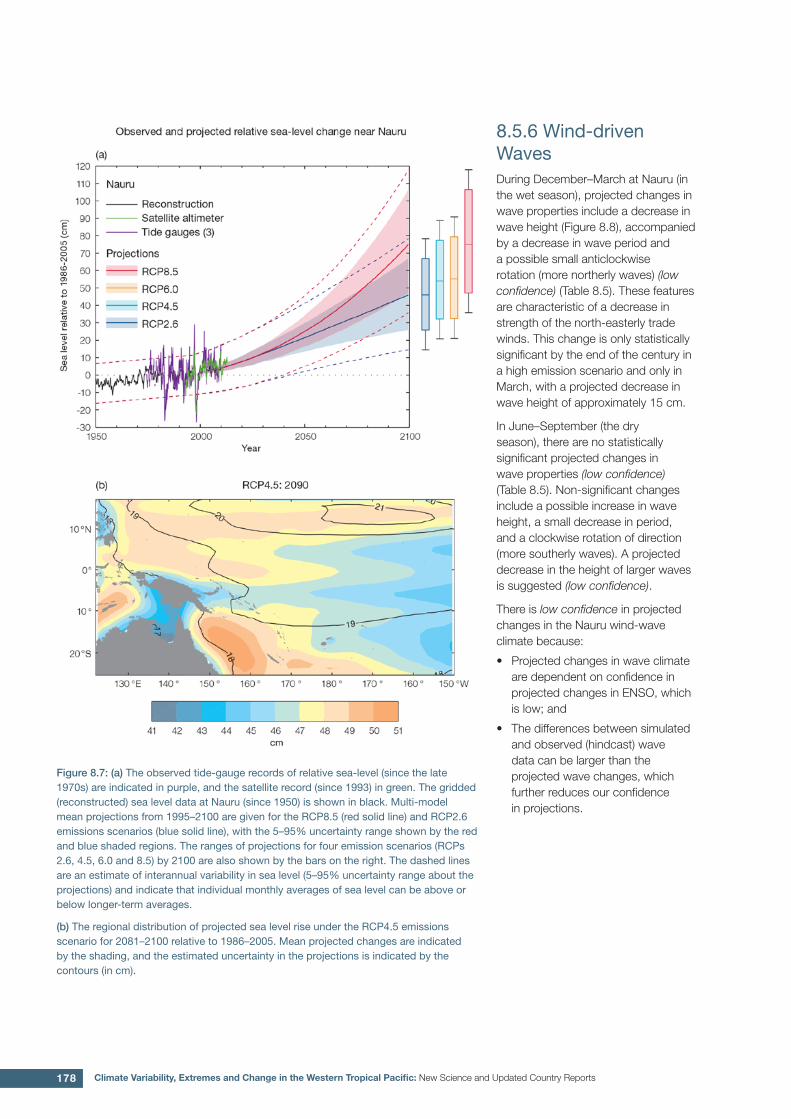
8.5.5 Sea LevelMean sea level is projected to continue to rise over the course of the 21st century. There is very high confidence in the direction of change. The CMIP5 models simulate a rise of between approximately 7–18 cm by 2030 (very similar values for different RCPs), with increases of 41–89 cm by 2090 under the RCP8.5 (Figure 8.7 and Table 8.4). There is medium confidence in the range mainly because there is still uncertainty associated with projections of the Antarctic ice sheet contribution. Interannual variability of sea level will lead to periods of lower and higher regional sea levels. In the past, this interannual variability has been about 23 cm (5–95% range, after removal of the seasonal signal, see dashed lines in Figure 8.7a) and it is likely that a similar range will continue through the 21st century.
Table 8.3: Projected changes in severe coral bleaching risk for the Nauru Exclusive Economic Zone (EEZ) for increases in SST relative to 1982–1999.
Temperature change 1 Recurrence interval 2 Duration of the risk event 3
Change in observed mean 30 years 3.0 weeks
+0.25°C 6.2 years (3.7 months – 13.8 years) 6.7 weeks (2.8 weeks – 3 months)
+0.5°C 2.4 years (2.9 months – 8.1 years) 10.2 weeks (1.4 weeks – 6.6 months)
+0.75°C 1.1 years (0.8 months – 4.5 years) 12.8 weeks (1.3 weeks – 12.5 months)
+1°C 9.9 months (0.8 months – 3.9 years) 4.1 months (1.5 weeks – 2.8 years)
+1.5°C 6.4 months (0.8 months – 2.5 years) 6.9 months (5.2 weeks – 4.7 years)
+2°C 4.7 months (1.1 months – 9.9 months) 13.6 months (5.8 weeks – 6.8 years)
1 This refers to projected SST anomalies above the mean for 1982–1999. 2 Recurrence is the mean time between severe coral bleaching risk events. Range (min – max) shown in brackets.3 Duration refers to the period of time where coral are exposed to the risk of severe bleaching. Range (min – max) shown in brackets.
178 Climate Variability, Extremes and Change in the Western Tropical Pacific: New Science and Updated Country Reports
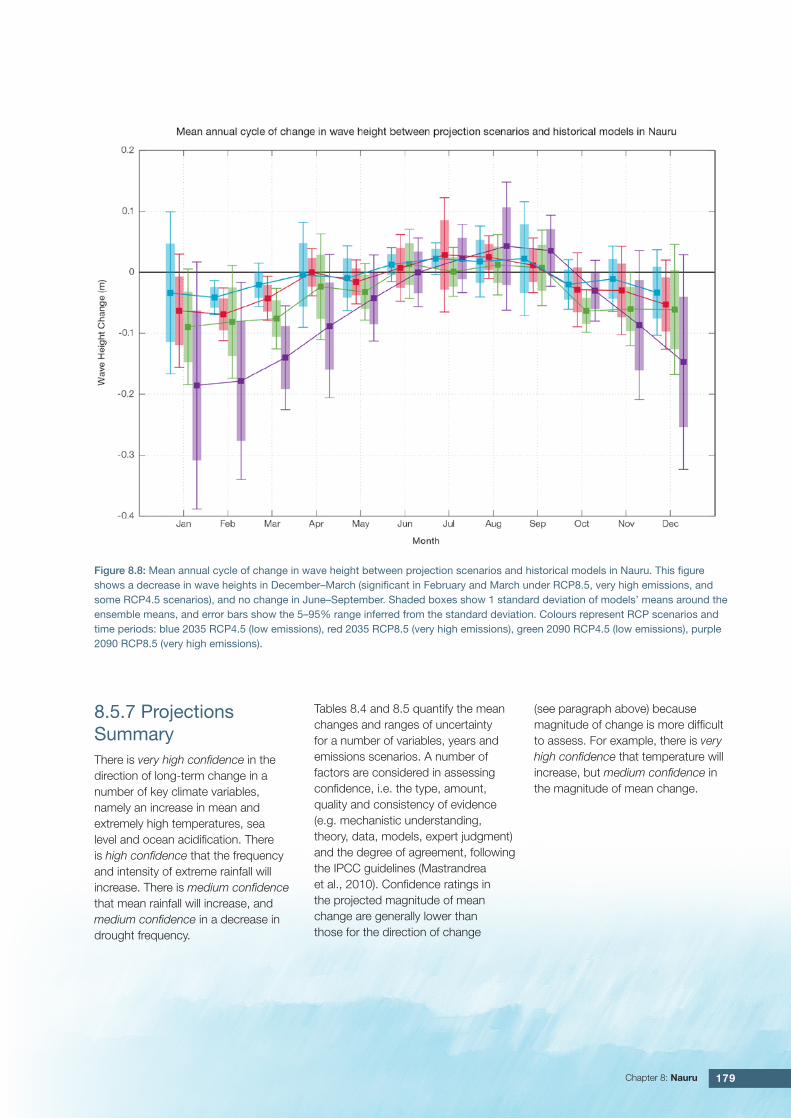
8.5.6 Wind-driven WavesDuring December–March at Nauru (in the wet season), projected changes in wave properties include a decrease in wave height (Figure 8.8), accompanied by a decrease in wave period and a possible small anticlockwise rotation (more northerly waves) (low confidence) (Table 8.5). These features are characteristic of a decrease in strength of the north-easterly trade winds. This change is only statistically significant by the end of the century in a high emission scenario and only in March, with a projected decrease in wave height of approximately 15 cm.
In June–September (the dry season), there are no statistically significant projected changes in wave properties (low confidence) (Table 8.5). Non-significant changes include a possible increase in wave height, a small decrease in period, and a clockwise rotation of direction (more southerly waves). A projected decrease in the height of larger waves is suggested (low confidence).
There is low confidence in projected changes in the Nauru wind-wave climate because:
• Projected changes in wave climate are dependent on confidence in projected changes in ENSO, which is low; and
• The differences between simulated and observed (hindcast) wave data can be larger than the projected wave changes, which further reduces our confidence in projections.
Figure 8.7: (a) The observed tide-gauge records of relative sea-level (since the late 1970s) are indicated in purple, and the satellite record (since 1993) in green. The gridded (reconstructed) sea level data at Nauru (since 1950) is shown in black. Multi-model mean projections from 1995–2100 are given for the RCP8.5 (red solid line) and RCP2.6 emissions scenarios (blue solid line), with the 5–95% uncertainty range shown by the red and blue shaded regions. The ranges of projections for four emission scenarios (RCPs 2.6, 4.5, 6.0 and 8.5) by 2100 are also shown by the bars on the right. The dashed lines are an estimate of interannual variability in sea level (5–95% uncertainty range about the projections) and indicate that individual monthly averages of sea level can be above or below longer-term averages.
(b) The regional distribution of projected sea level rise under the RCP4.5 emissions scenario for 2081–2100 relative to 1986–2005. Mean projected changes are indicated by the shading, and the estimated uncertainty in the projections is indicated by the contours (in cm).
179Chapter 8: Nauru
Figure 8.8: Mean annual cycle of change in wave height between projection scenarios and historical models in Nauru. This figure shows a decrease in wave heights in December–March (significant in February and March under RCP8.5, very high emissions, and some RCP4.5 scenarios), and no change in June–September. Shaded boxes show 1 standard deviation of models’ means around the ensemble means, and error bars show the 5–95% range inferred from the standard deviation. Colours represent RCP scenarios and time periods: blue 2035 RCP4.5 (low emissions), red 2035 RCP8.5 (very high emissions), green 2090 RCP4.5 (low emissions), purple 2090 RCP8.5 (very high emissions).
8.5.7 Projections SummaryThere is very high confidence in the direction of long-term change in a number of key climate variables, namely an increase in mean and extremely high temperatures, sea level and ocean acidification. There is high confidence that the frequency and intensity of extreme rainfall will increase. There is medium confidence that mean rainfall will increase, and medium confidence in a decrease in drought frequency.
Tables 8.4 and 8.5 quantify the mean changes and ranges of uncertainty for a number of variables, years and emissions scenarios. A number of factors are considered in assessing confidence, i.e. the type, amount, quality and consistency of evidence (e.g. mechanistic understanding, theory, data, models, expert judgment) and the degree of agreement, following the IPCC guidelines (Mastrandrea et al., 2010). Confidence ratings in the projected magnitude of mean change are generally lower than those for the direction of change
(see paragraph above) because magnitude of change is more difficult to assess. For example, there is very high confidence that temperature will increase, but medium confidence in the magnitude of mean change.
180 Climate Variability, Extremes and Change in the Western Tropical Pacific: New Science and Updated Country Reports
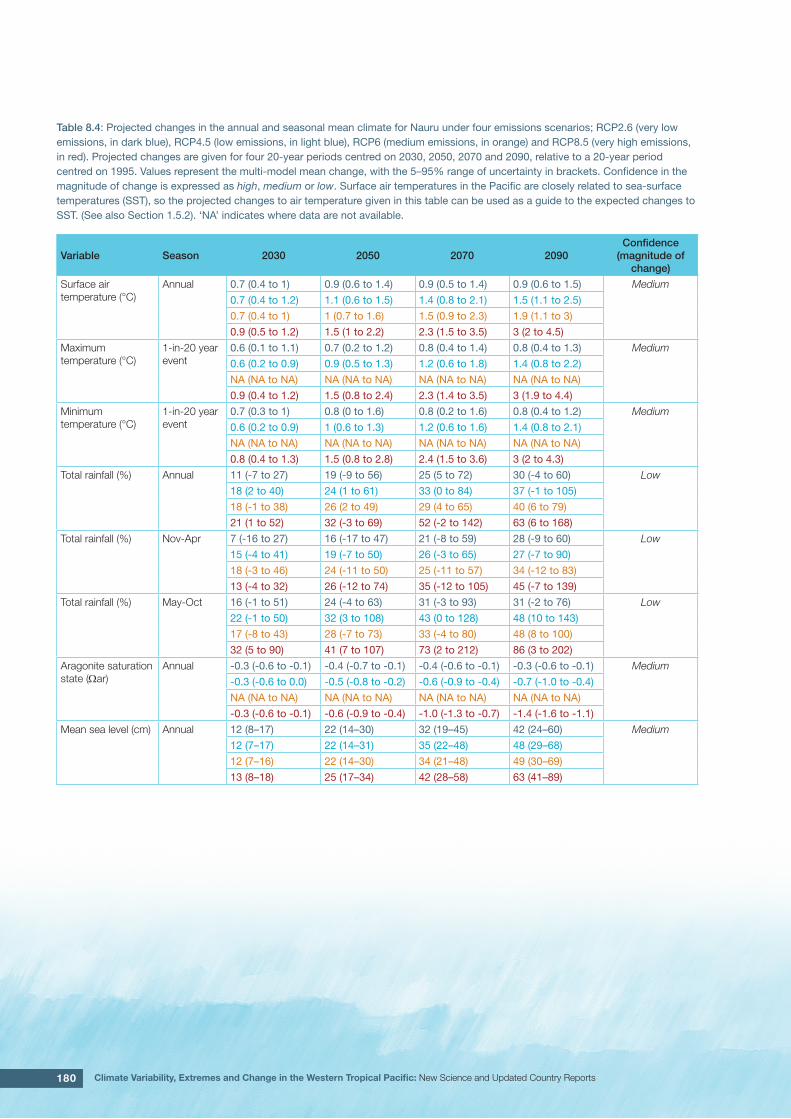
Table 8.4: Projected changes in the annual and seasonal mean climate for Nauru under four emissions scenarios; RCP2.6 (very low emissions, in dark blue), RCP4.5 (low emissions, in light blue), RCP6 (medium emissions, in orange) and RCP8.5 (very high emissions, in red). Projected changes are given for four 20-year periods centred on 2030, 2050, 2070 and 2090, relative to a 20-year period centred on 1995. Values represent the multi-model mean change, with the 5–95% range of uncertainty in brackets. Confidence in the magnitude of change is expressed as high, medium or low. Surface air temperatures in the Pacific are closely related to sea-surface temperatures (SST), so the projected changes to air temperature given in this table can be used as a guide to the expected changes to SST. (See also Section 1.5.2). ‘NA’ indicates where data are not available.
Variable Season 2030 2050 2070 2090Confidence
(magnitude of change)
Surface air temperature (°C)
Annual 0.7 (0.4 to 1) 0.9 (0.6 to 1.4) 0.9 (0.5 to 1.4) 0.9 (0.6 to 1.5) Medium
0.7 (0.4 to 1.2) 1.1 (0.6 to 1.5) 1.4 (0.8 to 2.1) 1.5 (1.1 to 2.5)
0.7 (0.4 to 1) 1 (0.7 to 1.6) 1.5 (0.9 to 2.3) 1.9 (1.1 to 3)
0.9 (0.5 to 1.2) 1.5 (1 to 2.2) 2.3 (1.5 to 3.5) 3 (2 to 4.5)
Maximum temperature (°C)
1-in-20 year event
0.6 (0.1 to 1.1) 0.7 (0.2 to 1.2) 0.8 (0.4 to 1.4) 0.8 (0.4 to 1.3) Medium
0.6 (0.2 to 0.9) 0.9 (0.5 to 1.3) 1.2 (0.6 to 1.8) 1.4 (0.8 to 2.2)
NA (NA to NA) NA (NA to NA) NA (NA to NA) NA (NA to NA)
0.9 (0.4 to 1.2) 1.5 (0.8 to 2.4) 2.3 (1.4 to 3.5) 3 (1.9 to 4.4)
Minimum temperature (°C)
1-in-20 year event
0.7 (0.3 to 1) 0.8 (0 to 1.6) 0.8 (0.2 to 1.6) 0.8 (0.4 to 1.2) Medium
0.6 (0.2 to 0.9) 1 (0.6 to 1.3) 1.2 (0.6 to 1.6) 1.4 (0.8 to 2.1)
NA (NA to NA) NA (NA to NA) NA (NA to NA) NA (NA to NA)
0.8 (0.4 to 1.3) 1.5 (0.8 to 2.8) 2.4 (1.5 to 3.6) 3 (2 to 4.3)
Total rainfall (%) Annual 11 (-7 to 27) 19 (-9 to 56) 25 (5 to 72) 30 (-4 to 60) Low
18 (2 to 40) 24 (1 to 61) 33 (0 to 84) 37 (-1 to 105)
18 (-1 to 38) 26 (2 to 49) 29 (4 to 65) 40 (6 to 79)
21 (1 to 52) 32 (-3 to 69) 52 (-2 to 142) 63 (6 to 168)
Total rainfall (%) Nov-Apr 7 (-16 to 27) 16 (-17 to 47) 21 (-8 to 59) 28 (-9 to 60) Low
15 (-4 to 41) 19 (-7 to 50) 26 (-3 to 65) 27 (-7 to 90)
18 (-3 to 46) 24 (-11 to 50) 25 (-11 to 57) 34 (-12 to 83)
13 (-4 to 32) 26 (-12 to 74) 35 (-12 to 105) 45 (-7 to 139)
Total rainfall (%) May-Oct 16 (-1 to 51) 24 (-4 to 63) 31 (-3 to 93) 31 (-2 to 76) Low
22 (-1 to 50) 32 (3 to 108) 43 (0 to 128) 48 (10 to 143)
17 (-8 to 43) 28 (-7 to 73) 33 (-4 to 80) 48 (8 to 100)
32 (5 to 90) 41 (7 to 107) 73 (2 to 212) 86 (3 to 202)
Aragonite saturation state (Ωar)
Annual -0.3 (-0.6 to -0.1) -0.4 (-0.7 to -0.1) -0.4 (-0.6 to -0.1) -0.3 (-0.6 to -0.1) Medium
-0.3 (-0.6 to 0.0) -0.5 (-0.8 to -0.2) -0.6 (-0.9 to -0.4) -0.7 (-1.0 to -0.4)
NA (NA to NA) NA (NA to NA) NA (NA to NA) NA (NA to NA)
-0.3 (-0.6 to -0.1) -0.6 (-0.9 to -0.4) -1.0 (-1.3 to -0.7) -1.4 (-1.6 to -1.1)
Mean sea level (cm) Annual 12 (8–17) 22 (14–30) 32 (19–45) 42 (24–60) Medium
12 (7–17) 22 (14–31) 35 (22–48) 48 (29–68)
12 (7–16) 22 (14–30) 34 (21–48) 49 (30–69)
13 (8–18) 25 (17–34) 42 (28–58) 63 (41–89)
181Chapter 8: Nauru
Waves Projections Summary
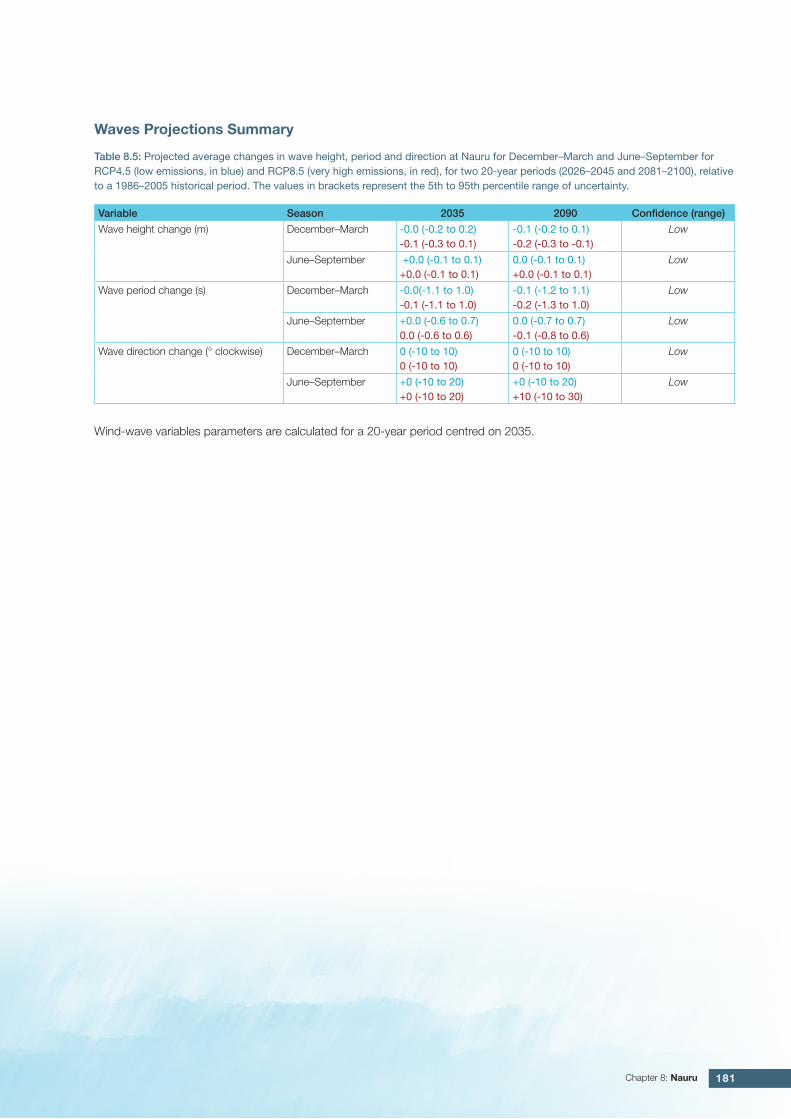
Table 8.5: Projected average changes in wave height, period and direction at Nauru for December–March and June–September for RCP4.5 (low emissions, in blue) and RCP8.5 (very high emissions, in red), for two 20-year periods (2026–2045 and 2081–2100), relative to a 1986–2005 historical period. The values in brackets represent the 5th to 95th percentile range of uncertainty.
Variable Season 2035 2090 Confidence (range)
Wave height change (m) December–March -0.0 (-0.2 to 0.2)-0.1 (-0.3 to 0.1)
-0.1 (-0.2 to 0.1)-0.2 (-0.3 to -0.1)
Low
June–September +0.0 (-0.1 to 0.1)+0.0 (-0.1 to 0.1)
0.0 (-0.1 to 0.1)+0.0 (-0.1 to 0.1)
Low
Wave period change (s) December–March -0.0(-1.1 to 1.0)-0.1 (-1.1 to 1.0)
-0.1 (-1.2 to 1.1)-0.2 (-1.3 to 1.0)
Low
June–September +0.0 (-0.6 to 0.7)0.0 (-0.6 to 0.6)
0.0 (-0.7 to 0.7)-0.1 (-0.8 to 0.6)
Low
Wave direction change (° clockwise) December–March 0 (-10 to 10)0 (-10 to 10)
0 (-10 to 10)0 (-10 to 10)
Low
June–September +0 (-10 to 20)+0 (-10 to 20)
+0 (-10 to 20)+10 (-10 to 30)
Low
Wind-wave variables parameters are calculated for a 20-year period centred on 2035.