Embed Size (px)
Citation preview
Weather and Climate Extremes 1 (2013) 42–50
Contents lists available at ScienceDirect
Weather and Climate Extremes
2212-0947 & 2013 Thehttp://dx.doi.org/10.101
n Corresponding authE-mail addresses: m
journal homepage: www.elsevier.com/locate/wace
On the observed variability of monsoon droughts over India
K. Niranjan Kumar a, M. Rajeevan b,n, D.S. Pai c, A.K. Srivastava c, B. Preethi d
a Divecha Centre for Climate Change, Indian Institute of Science, Bangalore 560012, Indiab Earth System Science Organization (ESSO), Ministry of Earth Sciences, Prithvi Bhavan, Lodi Road, New Delhi 110003, Indiac India Meteorological Department, Shivaji Nagar, Pune 411005, Indiad Indian Institute of Tropical Meteorology, Pashan, Pune 411008, India
a r t i c l e i n f o
Article history:Received 19 January 2013Received in revised form25 June 2013Accepted 29 July 2013Available online 3 August 2013
Keywords:Meteorological droughtIndian MonsoonGlobal warming
Authors. Published by Elsevie6/j.wace.2013.07.006
or. Tel.: +91 11 [email protected], rajeevan61@
a b s t r a c t
In the present study, the observed variability of monsoon droughts over India has been examined using adrought monitoring index, namely the Standardized Precipitation Evapo-transpiration Index (SPEI). Forcalculating the SPEI over different time periods, long term (1901–2010), high resolution, monthly griddedtemperature and rainfall data sets have been used. The drought time series shows significant interannual,decadal and long term trends. The analysis suggests a general increase in the intensity and percent areaaffected by moderate droughts during the recent decades. In particular, the frequency of multi-year (24months) droughts has shown a statistically significant increase, which is attributed to increase in surfaceair temperatures and thus drying of the atmosphere. The wavelet analysis of SPEI suggests significantspectral peaks at quasi-biennial (2–3 years), ENSO (5–7 years) and decadal (10–16 years) time scales,with significant multi-decadal variations. The variability of monsoon droughts over India is significantlyinfluenced by the tropical sea surface temperature anomalies. The Canonical correlation analysis (CCA)suggests that the major portion of the drought variability is influenced by the El Nino/SouthernOscillation (ENSO). Global warming, especially the warming of the equatorial Indian Ocean representsthe second coupled mode and is responsible for the observed increase in intensity of droughts during therecent decades.
& 2013 The Authors. Published by Elsevier B.V. Open access under CC BY license.
1. Introduction
Southwest monsoon season (June–September) is the primaryrainy season over India which contributes 70–90% of the annualmean rainfall. Monsoon seasonal rainfall exhibits large year to yearvariability which is around 10% of the long term mean. The inter-annual variability of monsoon rainfall is linked to the El Nino/Southern Oscillation (ENSO), the equatorial Indian Ocean anoma-lies (Gadgil et al., 2003), and the Atlantic Ocean climate anomalies(Rajeevan and Sridhar, 2008). A detailed review of the monsoonteleconnections is given in Gadgil Sulochana et al., 2007. Aparticular year is termed as an all-India drought year if theseasonal rainfall anomaly averaged over the country as a wholeis less than �10% of its long period average. Based on thiscriterion, 17% of the years during the period 1901–2010 weredrought years. Monsoon droughts had catastrophic effects onagriculture, water resources, food security, economy and sociallife in the country. In spite of technological advancements and
r B.V.
yahoo.co.in (M. Rajeevan).
Open access under CC BY license
improved drought mitigation measures droughts cause adverseeffect on the economy of India. For example, the severe drought of2002 had an adverse effect on the Indian economy by pullingdown the Gross Domestic Product (GDP) of the country by almost1% (Gadgil et al., 2003). To improve drought mitigation andpreparedness, we need to improve our present knowledge aboutthe spatial and temporal variability of droughts.
There are many studies on the general characteristic of droughtsover India (Sikka, 1999; Bhalme andMooley, 1980; Parthasarathy et al.,1987; Rao, 1981) and case studies on the specific drought years like1987, 2002, 2004 and 2009 (Krishnamurti et al., 1989; Gadgil et al.,2003; Sikka, 2003; Francis and Gadgil, 2010; Krishnamurti et al., 2010;Neena et al., 2011). In general, the previous studies of Indian droughtswere based on only rainfall data (Chowdhury et al., 1989, SinhaRayand Shewale, 2001; Guhathakurta, 2003). Recently, Pai et al. (2011)examined district-wide drought climatology over India for the south-west monsoon season (June–September) using two simple droughtindices; Percent of Normal Precipitation (PNP) and StandardizedPrecipitation Index (SPI). Gregory (1989) studied the changes indrought frequency over India for the period 1871–1985. Using theSPI and PDSI as drought indices, Benjamin and Saunders (2002)examined the 20th century drought climatology over Europe. Theirstudy revealed that proportion of Europe experiencing extreme and/or moderate drought conditions has changed insignificantly during
.
K. Niranjan Kumar et al. / Weather and Climate Extremes 1 (2013) 42–50 43
the 20th century. Dai et al. (1998, 2004) examined global variations ofdry and wet spells using PDSI as the monitoring index. Ummenhoferet al. (2012) examined the links between Indo-Pacific climate varia-bility and drought using the Monsoon Asia Drought Atlas.
Several drought indices were developed during the 20thcentury based on a range of variables and parameters. For thedetails, Heim (2002), Mishra and Singh (2010) and Sivakumar et al.(2011) may be referred. However, no single index has been able toadequately capture the intensity and severity of drought and itspotential impacts on such a diverse group of users (Wilhite andGlantz 1985). Among various drought indices, the palmer droughtseverity index (PDSI, Palmer 1965) is one of the most widely used.PDSI is a climatic water balance index that considers precipitationand evapo-transpiration anomalies and soil water-holdingcapacity. Many of the deficiencies in PDSI are resolved by theself-calibrated PDSI. The PDSI is the most prominent index ofmeteorological drought used in the United States (Dai, 2011). It hasbeen used to quantify long term changes in aridity (Dai et al., 1998)and in tree-ring based reconstructions of past droughts (Cooket al., 2004). However, the PDSI has a fixed time scale and does notallow different drought types (Vicente-Serrano et al., 2010a). Sincedrought is a multi-scalar phenomenon (McKee et al., 1993), thePDSI is not a good choice to represent drought conditions. Droughtis a phenomenon which may occur simultaneously across multipletemporal scales. For example, a short period of particular drynessmay be embedded within a long-term drought. In this case, multi-scalar refers to numerous temporal periods which may or may notoverlap (Vicente-Serrano et al., 2010a). The response of varioushydrological systems (including soil moisture) to precipitation canvary markedly as a function of time.
Moreover, a shortcoming of PDSI values is that it may lagbehind emerging droughts by several months. This limits itsapplications in areas of frequent climatic extremes like the Indianmonsoon region. Another major problem associated with usingPDSI is that its computation is complex and required substantialinput of meteorological data and therefore its application islimited where observational networks are scarce (Smakhtin andHughes, 2004).
On the other hand, the Standardized Precipitation Index (SPI)developed by McKee et al. (1993) considers the multi-scalar natureof droughts. However, SPI also has an important shortcoming sinceit is based only on precipitation data and does not consider othercritical variables, especially temperatures. Empirical studies haveshown that temperature rise markedly affects the severity ofdroughts (Abramopoulos et al., 1988). The role of temperaturewas also evident in the devastating central European droughtduring the summer of 2003. Although previous precipitation waslower than normal, the extremely high temperatures over most ofEurope during June and July caused the greatest damage tocultivated and natural systems and dramatically increased eva-poration rates and water stress (Ciais et al., 2005; Fischer et al.,2007). For examining the future projections of droughts in theglobal warming scenario, drought indices that consider precipita-tion only will not be sufficient. The index should account forchanges in atmospheric demand for moisture due to increasedsurface warming (Dai, 2011). Recently a new drought index, theStandardized Precipitation–Evapotranspiration Index (SPEI) hasbeen proposed (Begueria et al., 2010; Vicente-Serrano et al.,2010a, 2010b) to quantify the drought condition over a given area.The SPEI considers not only precipitation but also temperaturedata in its calculation, allowing for a more complete approach toexplore the effects of climate change on drought conditions.
The objective of the present study is to examine the variabilityof monsoon droughts over India using a long term data set of1901–2010 using the SPEI as the drought index. The present studyin particular examines (a) spatial and temporal variations of
observed droughts and long trends and (b) co-variability ofmonsoon droughts with tropical sea surface temperatures (SST).In Section 2, data and methods are described. The results arediscussed in Section 3 and the conclusions are drawn in Section 4.
2. Data and methods
In this study, we preferred to use the SPEI as an indicator fordrought as it represents the multi-scalar aspect and also includesthe effect of temperature. Since the SPEI includes the effect of theevaporative demand on its calculation, it is more suited to explorethe effects of warming temperatures on the occurrence ofdroughts. The SPEI can be calculated at several time scales toadapt to the characteristic times of response to drought of targetnatural and economic systems. The SPEI combines the sensitivityof PDSI to changes in evaporation demand (caused by temperaturefluctuations and trends) with the simplicity of calculation and themulti-temporal nature of the SPI. The new index is particularlysuited to detecting, monitoring and exploring the consequences ofglobal warming on drought conditions (Vicente-Serrano et al.,2010a).
The SPEI is based on a monthly climatic water balance (Pre-cipitaiton minus potential evapotranspiration (PET)) and it isexpressed as a standardized Gaussian variate with a mean of zeroand a standard deviation of one. The SPEI uses the monthlydifference between precipitation and PET. But unlike other waterbalance-based drought indices such as the PDSI, the SPEI does notrely on the water balance of a specific system (the soil system)(Begueria et al., 2010). It can be calculated for different time scales,and hence the SPEI has a much wider range of applications thanthe PDSI (Begueria et al., 2010).
Details of the SPEI calculations are given in Vicente-Serranoet al., (2010a, 2010b). The SPEI is based on the climatic waterbalance, the difference between precipitation and PET.
D¼ P�PET ð1Þwhere P is the monthly precipitation (mm) and PET (mm) iscalculated according to the method of Thornthwaite (1948) whichonly requires data on mean monthly temperature and the geo-graphical location of the region of interest. The calculated D valueswere aggregated at various time scales:
Dkn ¼ ∑
k�1
i ¼ 0ðPn�i�PETn�iÞ; nZk ð2Þ
where k (months) is the timescale of the aggregation and n is thecalculation number. The D values are undefined for k4n. A log-logistic probability distribution function was then fitted to the dataseries of D as it adapts very well to all time scales. The completecalculation procedure for the SPEI can be found in Vicente-Serranoet al. (2010a).
This represents a simple climatic water balance that is calcu-lated at different time scales to obtain the SPEI. Typical values ofthe SPEI range between �2.5 and 2.5 corresponding to excee-dance probabilities of approximately 0.006 and 0.994 respectively,although the theoretical limits are (�1, +1). The software tocalculate the SPEI is available in the Web repository of the SpanishNational Research Council (available online at ⟨http://digital.csic.es/handle/10261/10002⟩). We have used this software to calculatethe SPEI.
For calculating SPEI, both monthly precipitation and tempera-ture data are required. For this purpose, the gridded (1�1 degree)rainfall data over the Indian region (Rajeevan et al., 2006, 2008)developed by the India Meteorological Department (IMD) for theperiod 1901–2010 have been used. For developing the griddedrainfall data set, 1384 stations which had minimum 70% data

K. Niranjan Kumar et al. / Weather and Climate Extremes 1 (2013) 42–5044
availability were considered in order to minimize the risk ofgenerating temporal inhomogeneities in the gridded data due tovarying station densities. Multi-stage quality control of observedrainfall data was carried out including checks for homogeneitybefore interpolating station rainfall data into regular grids. Forinterpolating station data into regular grids, a modified version ofShepard's angular distance weighting algorithm was used. Moredetails of the gridded rainfall data set are available in Rajeevanet al. (2006, 2008).
For temperature for the same period, 1901–2004, the IMDgridded temperature data (Srivastava et al., 2009) was used. Thistemperature data set is based on 395 stations and gridded datawas developed by interpolating station data into regular gridsusing modified version of Shepard's angular distance weightingalgorithm (Srivastava et al., 2009). Before the gridded analysis,station data were subjected to multi-quality controls includingchecks for homogeneity. For examining the linkages to the globalsea surface temperatures, the Hadley Centre SST dataset (⟨http://www.metoffice.gov.uk/hadobs/hadisst/⟩) has been used. This dataset (Rayner et al., 2003) is available at 1�1 degree resolution. Thecalculated monthly SPEI was aggregated for different time scales,6, 12, 18 and 24 months to examine multi-scalar characteristic ofthe monsoon droughts. In this study, we discuss these aggregateddrought indices as SPEI (6), SPEI (12), SPEI (18) and SPEI (24). The6 month SPEI will signify the effect of southwest and northeastmonsoons. The 12 month SPEI will signify the rainfall contributionof winter and pre-monsoon months also in addition to the south-west and northeast monsoons. The 18 and 24 months SPEI willsignify multi-year droughts.
3. Results and discussion
3.1. Observed variability of droughts
In this section, the observed variability of monsoon droughts atdifferent time scales is discussed. Fig. 1a–d shows the time series ofSPEI calculated for 6, 12, 18 and 24 months correspondingly. Thetime series of SEPI (6) resembles the all-India monsoon seasonalrainfall variations, even though there are variations. The timeseries however shows significant inter-annual and multi-decadal
Fig. 1. Time series of SPEI for different accumulated periods 6, 12, 18 and 24 months fdecadal variations using a 13-point filter is shown as red line.
variations. The years, 1918 and 2002 were the worst droughts overIndia. If we assume all-India averaged SPEI o�0.50 as moderatedrought years, with SPEI (6), there were 21 drought years duringthe period 1901–2010, thus making a probability of about 19%. Withthe same criterion, the probability of moderate drought with SPEI(12), SPEI (18) and SPEI (24) are 15%, 15% and 14% respectively.
In the whole data period, three consecutive droughts haveoccurred only once, 2000–2002. This prolonged drought had anadverse effect on the agricultural and water resources sectors overthe country, which will be discussed later. The filtered SPEI timeseries with a 13 point smoother (IPCC 2007) is also shown in Fig. 1.This 13-point filtering is done to remove the sub-decadal fluctua-tions. The filtered time series shows significant decadal variations.In addition, a decreasing trend of SPEI (increasing drought inten-sity) from 1951 to 2010 is also observed. The time series of SPEI(12), SPEI (18) and SPEI (24) also shows significant inter-annual,decadal and long term trends. If there are two or more consecutiveyears with deficient southwest monsoon season, the effect will beseen in SPEI (18) and SPEI (24). If we look at the time series of SPEI(24), we observe higher frequency of multi-year droughts (24months) during the period 1951–2010. For example, during theperiod 1951–2010, there were 12 multi-year droughts (24months), while during the period 1901–1950, there were onlythree such long-lived droughts.
To examine the spectral characteristics of drought index atdifferent time periods, a Morlet wavelet analysis (For details referTorrence and Compo (1998) and Grinsted et al. (2004)) wasperformed on the SPEI time series and the results are shown inFig. 2. The results suggest some interesting characteristics of thedrought index at different time periods. The short term drought(SPEI (6)) is characterized by strong periodicity at quasi-biennial(2–4 years) and decadal (12–16 year) time scales. The longerduration drought, especially SPEI (18) and SPEI (24) are character-ized by the influence of El Nino/Southern Oscillation (ENSO) with apeak around 4–8 year time scale. However, this spectral character-istic with ENSO showed epochal variations. It was stronger duringthe period 1940–1990, with a weakening during the recent years,which is similar to the weakening relationship between Indianmonsoon rainfall and ENSO reported earlier (Kumar Krishna et al.,1999). In addition, strong periodicity is also observed on 8–10 yeartime scale till about 1940s, which then moved to higher time scale
or the period 1901–2010. The smoothed variation of SPEI after removing the sub-

Fig. 2. Wavelet (Morelet) analysis of SPEI at different accumulated periods 6, 12, 18 and 24 months.
Fig. 3. The time series percent area affected by moderate drought (SPEIo�1.0) at different accumulated periods for the period, 1901–2010. The trend lines calculated usingthe data of 1951–2010 are shown as red lines. The statistical significance levels of trend values are shown as p values for each figure. All the trends are statistically significantat least at 95% significance level.
K. Niranjan Kumar et al. / Weather and Climate Extremes 1 (2013) 42–50 45
of 12–16 years during the later years. Similar decadal componenthas been found in the spectral characteristics of the Europeandroughts also (Ionita et al., 2012). This decadal component may beintrinsic to the North Atlantic Oscillation (NAO) and the PacificDecadal Oscillation (PDO). More detailed analysis is howeverrequired to further explore this relationship on decadal time scale.
Fig. 3 shows the time series of percent of the country experi-encing moderate droughts with different time periods. To calculatethese time series, only the plains of India was considered andnortheast India and extreme northern parts of India with highertopography were excluded. For calculating percent of area affectedby drought, the grid points with SPEI less than �1.0 (moderatedrought) were considered. It may be mentioned that for areaaveraged drought index of SPEI for the country as a whole, asmaller threshold (�0.5) was considered. The grid points at whichSPEI is o�1.0 were counted and their total area (after multiplyingwith cosine of the latitude) was considered to prepare the timeseries. On an average, about 17% of the total country is affected
by moderate drought. These time series also show significantinter-annual and decadal variations like the time series of SPEIshown in Fig. 1. In years like 1918 and 2002, more than 60% of thecountry was affected by moderate drought on shorter time scale(SPEI (6)). In some years like 1902, 1905, 1966, 1987, 2002, 2003and 2010, multi-year droughts have affected more than 40% of thecountry. The most significant aspect is the observed increasingtrends in percent area affected by moderate droughts. This isreflected in short-term drought like SPEI (6) as well as multi-yeardrought like SPEI (24). However, the significant increasing trendsare observed from 1951 onwards, which are statistically significantat least at 95% significance level for all time periods.
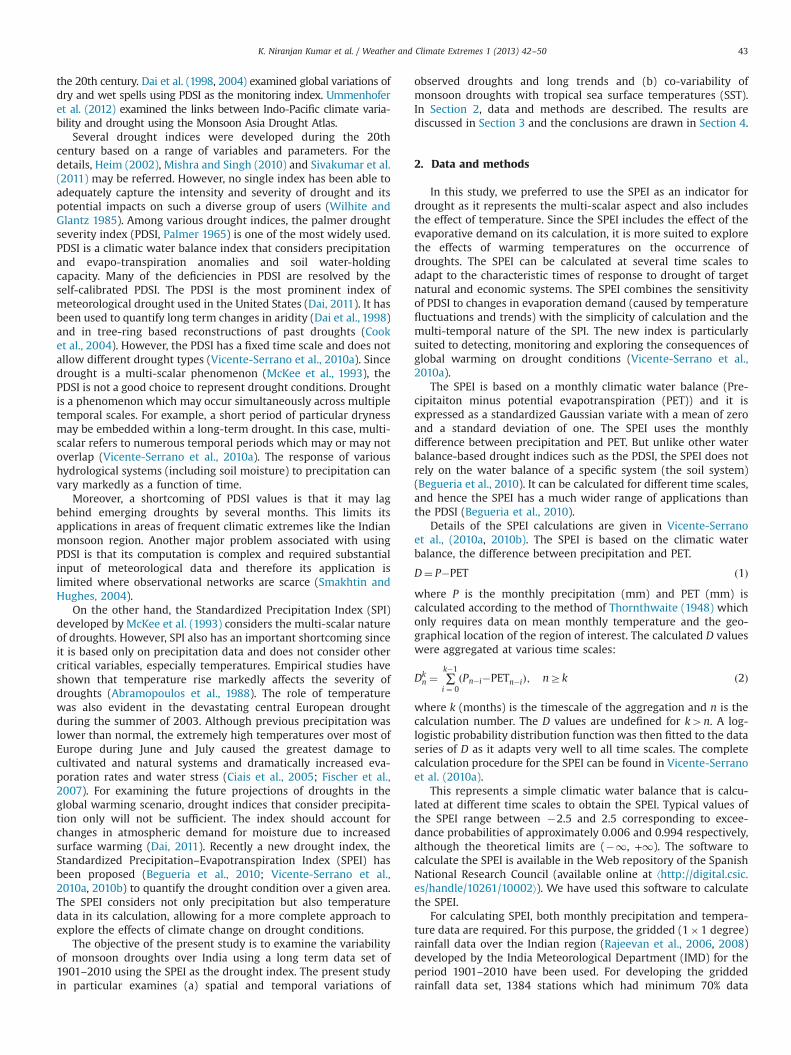
An analysis of possible reasons revealed that these long termtrends in SPEI are associated with increasing temperatures ratherthan decreasing precipitation. Fig. 4 shows the time series ofannual mean temperature and precipitation averaged over thecountry. It shows significant increasing trends of temperaturesfrom mid-1970s. The annual precipitation over the country is
K. Niranjan Kumar et al. / Weather and Climate Extremes 1 (2013) 42–5046
found to be very stable. This increasing trend in temperaturescauses more evaporation and drying and thus increases the areaaffected by drought defined by SPEI. Dai (2011) examined the longterm changes of global PDSI from 1900 to 2008, which suggestedtwo modes of variability. The first mode represents a long-termtrend of drying over Africa, south and east Asia and easternAustralia. The second mode is associated with the ENSO.
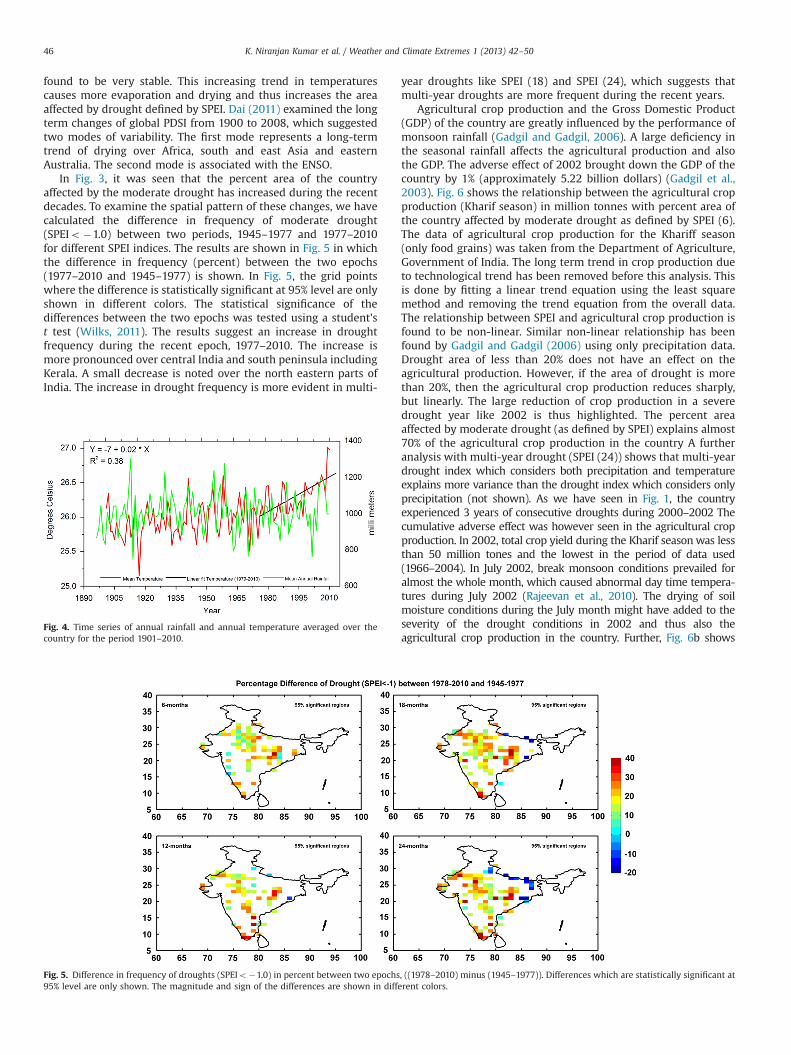
In Fig. 3, it was seen that the percent area of the countryaffected by the moderate drought has increased during the recentdecades. To examine the spatial pattern of these changes, we havecalculated the difference in frequency of moderate drought(SPEIo�1.0) between two periods, 1945–1977 and 1977–2010for different SPEI indices. The results are shown in Fig. 5 in whichthe difference in frequency (percent) between the two epochs(1977–2010 and 1945–1977) is shown. In Fig. 5, the grid pointswhere the difference is statistically significant at 95% level are onlyshown in different colors. The statistical significance of thedifferences between the two epochs was tested using a student'st test (Wilks, 2011). The results suggest an increase in droughtfrequency during the recent epoch, 1977–2010. The increase ismore pronounced over central India and south peninsula includingKerala. A small decrease is noted over the north eastern parts ofIndia. The increase in drought frequency is more evident in multi-
Fig. 4. Time series of annual rainfall and annual temperature averaged over thecountry for the period 1901–2010.
Fig. 5. Difference in frequency of droughts (SPEIo�1.0) in percent between two epochs95% level are only shown. The magnitude and sign of the differences are shown in diffe
year droughts like SPEI (18) and SPEI (24), which suggests thatmulti-year droughts are more frequent during the recent years.
Agricultural crop production and the Gross Domestic Product(GDP) of the country are greatly influenced by the performance ofmonsoon rainfall (Gadgil and Gadgil, 2006). A large deficiency inthe seasonal rainfall affects the agricultural production and alsothe GDP. The adverse effect of 2002 brought down the GDP of thecountry by 1% (approximately 5.22 billion dollars) (Gadgil et al.,2003). Fig. 6 shows the relationship between the agricultural cropproduction (Kharif season) in million tonnes with percent area ofthe country affected by moderate drought as defined by SPEI (6).The data of agricultural crop production for the Khariff season(only food grains) was taken from the Department of Agriculture,Government of India. The long term trend in crop production dueto technological trend has been removed before this analysis. Thisis done by fitting a linear trend equation using the least squaremethod and removing the trend equation from the overall data.The relationship between SPEI and agricultural crop production isfound to be non-linear. Similar non-linear relationship has beenfound by Gadgil and Gadgil (2006) using only precipitation data.Drought area of less than 20% does not have an effect on theagricultural production. However, if the area of drought is morethan 20%, then the agricultural crop production reduces sharply,but linearly. The large reduction of crop production in a severedrought year like 2002 is thus highlighted. The percent areaaffected by moderate drought (as defined by SPEI) explains almost70% of the agricultural crop production in the country A furtheranalysis with multi-year drought (SPEI (24)) shows that multi-yeardrought index which considers both precipitation and temperatureexplains more variance than the drought index which considers onlyprecipitation (not shown). As we have seen in Fig. 1, the countryexperienced 3 years of consecutive droughts during 2000–2002 Thecumulative adverse effect was however seen in the agricultural cropproduction. In 2002, total crop yield during the Kharif seasonwas lessthan 50 million tones and the lowest in the period of data used(1966–2004). In July 2002, break monsoon conditions prevailed foralmost the whole month, which caused abnormal day time tempera-tures during July 2002 (Rajeevan et al., 2010). The drying of soilmoisture conditions during the July month might have added to theseverity of the drought conditions in 2002 and thus also theagricultural crop production in the country. Further, Fig. 6b shows
, ((1978–2010) minus (1945–1977)). Differences which are statistically significant atrent colors.
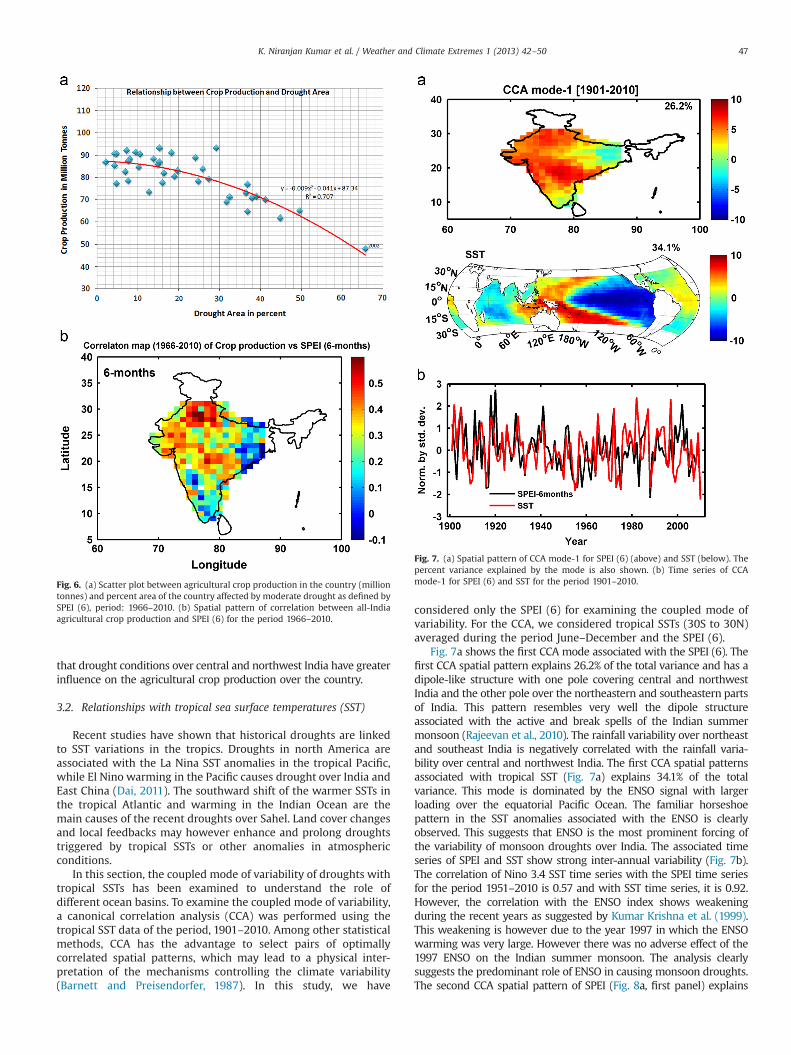
Fig. 7. (a) Spatial pattern of CCA mode-1 for SPEI (6) (above) and SST (below). Thepercent variance explained by the mode is also shown. (b) Time series of CCAmode-1 for SPEI (6) and SST for the period 1901–2010.Fig. 6. (a) Scatter plot between agricultural crop production in the country (million
tonnes) and percent area of the country affected by moderate drought as defined bySPEI (6), period: 1966–2010. (b) Spatial pattern of correlation between all-Indiaagricultural crop production and SPEI (6) for the period 1966–2010.
K. Niranjan Kumar et al. / Weather and Climate Extremes 1 (2013) 42–50 47
that drought conditions over central and northwest India have greaterinfluence on the agricultural crop production over the country.
3.2. Relationships with tropical sea surface temperatures (SST)
Recent studies have shown that historical droughts are linkedto SST variations in the tropics. Droughts in north America areassociated with the La Nina SST anomalies in the tropical Pacific,while El Nino warming in the Pacific causes drought over India andEast China (Dai, 2011). The southward shift of the warmer SSTs inthe tropical Atlantic and warming in the Indian Ocean are themain causes of the recent droughts over Sahel. Land cover changesand local feedbacks may however enhance and prolong droughtstriggered by tropical SSTs or other anomalies in atmosphericconditions.
In this section, the coupled mode of variability of droughts withtropical SSTs has been examined to understand the role ofdifferent ocean basins. To examine the coupled mode of variability,a canonical correlation analysis (CCA) was performed using thetropical SST data of the period, 1901–2010. Among other statisticalmethods, CCA has the advantage to select pairs of optimallycorrelated spatial patterns, which may lead to a physical inter-pretation of the mechanisms controlling the climate variability(Barnett and Preisendorfer, 1987). In this study, we have
considered only the SPEI (6) for examining the coupled mode ofvariability. For the CCA, we considered tropical SSTs (30S to 30N)averaged during the period June–December and the SPEI (6).
Fig. 7a shows the first CCA mode associated with the SPEI (6). Thefirst CCA spatial pattern explains 26.2% of the total variance and has adipole-like structure with one pole covering central and northwestIndia and the other pole over the northeastern and southeastern partsof India. This pattern resembles very well the dipole structureassociated with the active and break spells of the Indian summermonsoon (Rajeevan et al., 2010). The rainfall variability over northeastand southeast India is negatively correlated with the rainfall varia-bility over central and northwest India. The first CCA spatial patternsassociated with tropical SST (Fig. 7a) explains 34.1% of the totalvariance. This mode is dominated by the ENSO signal with largerloading over the equatorial Pacific Ocean. The familiar horseshoepattern in the SST anomalies associated with the ENSO is clearlyobserved. This suggests that ENSO is the most prominent forcing ofthe variability of monsoon droughts over India. The associated timeseries of SPEI and SST show strong inter-annual variability (Fig. 7b).The correlation of Nino 3.4 SST time series with the SPEI time seriesfor the period 1951–2010 is 0.57 and with SST time series, it is 0.92.However, the correlation with the ENSO index shows weakeningduring the recent years as suggested by Kumar Krishna et al. (1999).This weakening is however due to the year 1997 in which the ENSOwarming was very large. However there was no adverse effect of the1997 ENSO on the Indian summer monsoon. The analysis clearlysuggests the predominant role of ENSO in causing monsoon droughts.The second CCA spatial pattern of SPEI (Fig. 8a, first panel) explains

Fig. 8. (a) Spatial pattern of CCA mode-2 for SPEI (6) (above) and SST (below). Thepercent variance explained by the mode is also shown. (b) Time series of CCAmode-2 for SPEI (6) and SST for the period 1901–2010.The SST anomalies averagedover the equatorial Indian Ocean for the same period is also shown in red color.
Fig. 9. Linear trends (1C/110 years) of SST averaged during June–December over thetropical Indian Ocean.
K. Niranjan Kumar et al. / Weather and Climate Extremes 1 (2013) 42–5048
8.6% of the total variance. It shows a spatial structure similar to theseasonal rainfall trends over the Indian sub-continent (Guhathakurtaand Rajeevan, 2008). An analysis of rainfall trends using the data1901–2003 showed significant negative trends over eastern parts ofcentral India and southwest parts of south peninsula (Kerala) andincreasing trends over western parts of central India (Guhathakurtaand Rajeevan, 2008). The spatial pattern of the second mode of SPEIresembles the observed trends of seasonal monsoon rainfall. Fig. 8a(second panel) shows the spatial pattern associated with the secondCCA which explains 20.9% of the total variance. The spatial patternshows strong positive loadings in the equatorial Indian Ocean andSouth Atlantic Ocean. Strong negative loadings are also observedover the north Atlantic Ocean. The time series associated with SPEIand SST present strong interannual variability and a significanttrend, especially after mid-1960s (Fig. 8b). The time series ofmonthly SST anomalies averaged over the equatorial Indian Oceanis also overlaid over the time series of CCA2 of SPEI and SST. Thissuggests a very close relationship between the second mode ofvariability of SPEI and the SST anomalies over the equatorial IndianOcean. The results discussed in Section 3.1 suggested a long termincrease in the percent area affected by moderate drought over thecountry. The second CCA mode explains this observed long termtrend of drought and is related to the SST anomalies over theequatorial Indian Ocean. Since the second mode is related to theequatorial Indian Ocean SST anomalies, it is very likely that IndianOcean SSTs could be the primary cause for the increasing trend ofdrought area over the country. An analysis of trends of sea surfacetemperatures over the tropical Indian Ocean suggests (Fig. 9) that
over the years, the Indian Ocean has shown a warming trend. Manyother studies (Alory et al., 2007; Deser et al., 2010; Ramesh Kumaret al., 2009) also highlighted the warming of the equatorial IndianOcean during the recent decades. The observed warming over theequatorial Indian Ocean could be part of the global warming as thesecond SST mode is significantly correlated (0.75) with global meantemperatures. The warming of the equatorial Indian Ocean mayaffect the monsoon circulation by (a) enhancing convection over theequatorial Indian Ocean and (b) reducing the land-sea temperaturecontrast. However, a detailed analysis including climate modelsimulations is desired for better understanding of the physicalcauses of the relationship between the Indian Ocean SST anomaliesand frequency of droughts.
4. Conclusions
In the present study, the observed variability of droughts andfuture projections of frequency and intensity of droughts over Indiahave been examined using a drought index. The drought index,Standardized Precipitation–Evapotranspiration Index (SPEI) considersboth the effects of temperature and precipitation and it can alsorepresent the multi-scalar characteristic of monsoon droughts. Forcalculating SPEI at different time periods, 6, 12, 18 and 24 months, longterm (1901–2004) high resolution gridded data of monthly tempera-ture and rainfall have been used. The results suggest the droughtindex, SPEI exhibits significant inter-annual, decadal and long termtrends. The years 1918 and 2002 were the worst droughts, whichaffected the country. The observed time series of SPEI since 1951shows a general decrease in SPEI and thus increase in intensity ofmonsoon droughts. Since 1951, there is an increase in percent areaaffected by moderate droughts over the country, which is mainlyattributed to increase in surface air temperatures. The frequency ofmulti-year droughts (SPEI (24)) is much more (12) during the period,1951–2004 compared to the frequency (only 3) during the period1901–1950. The SPEI (6) is characterized by spectral peaks at quasi-biennial time scales. The multi-year droughts like SPEI (24) have,however, show spectral peaks in the ENSO (5–7 years) and decadal(10–16 years) time scales. Occurrence of moderate and severedroughts affect the agricultural crop production, the relationship isfound to be non-linear. The adverse effect on the crop yield is observedwhen the area affected by moderate drought is more than 20%.
The variability of monsoon droughts over India is significantlycaused by the tropical sea surface temperatures. The canonicalcorrelation analysis reveals that the major portion of the droughtvariability over India is influenced by ENSO. The first coupledmode is significantly correlated with the central Pacific sea surfacetemperatures, suggesting the major influence of ENSO on mon-soon droughts. This is consistent with the earlier studies linking

K. Niranjan Kumar et al. / Weather and Climate Extremes 1 (2013) 42–50 49
ENSO and monsoon droughts. The second coupled mode repre-sents the long term trend of monsoon droughts. This mode haslinkage to global warming and especially the warming of thetropical Indian Ocean. The recent warming of the tropical IndianOcean may be responsible for the observed increase of moderatedroughts over the country.
In view of the potential threat to important sectors like agricul-ture, water resources and social life and even the economy, adedicated monitoring and prediction system needs to be implemen-ted. The India Meteorological Department (IMD), the nationalweather agency in India is carrying out the operational monitoringof drought conditions over the country using a drought index basedon precipitation only. The special drought monitoring mechanismimplemented after the devastating subdued monsoon in 2002helped the policy makers and the government to mitigate theadverse effect of the 2002 drought (Sikka, 2003). However a usefulprediction system in predicting probability of occurrence of moderateor severe drought is essential. Many of the current climate modelsare capable of simulating the precipitation deficits during the recentdroughts over North America and Africa (Dai, 2011). It is a bigchallenge for prediction of monsoon droughts on seasonal to decadaltime scales. However, current coupled climate models still have largedeficiencies in simulating mean monsoon circulation and rainfall(Rajeevan et al., 2011; Sperber et al., 2012). Substantial efforts will berequired to improve the skill of coupled climate models to predictSST variations and associated drought occurrence on seasonal todecadal time scales. Also, we need to take adaptation measures tofuture climate changes by considering the widespread droughtsanticipated in coming decades. Lessons learnt from the past droughtsmay be helpful for adaptation strategies for future droughts.
References
Abramopoulos, F., Rosenzweig, C., Choudhury, B., 1988. Improved ground hydrologycalculations for global climate models (GCMs): soil water movement andevapotranspiration. Journal of Climate 1, 921–941.
Alory, G., Wijffels, S.E., Meyers, G., 2007. Observed temperature trends in the IndianOcean over 1960–1999 and associated mechanisms. Geophysical ResearchLetters 34, LO2606.
Barnett, T.P., Preisendorfer, R., 1987. Origin and levels of monthly and seasonalforecast skill for United States surface air temperatures determined bycanonical correlation analysis. Monthly Weather Review 115, 1825–1850.
Begueria, S., Vicente Serrano, S.M., Martínez., M.A., 2010. A multiscalar globaldrought dataset: the SPEI base: a new gridded product for the analysis ofdrought variability and impacts. Bulletin of the American MeteorologicalSociety 10, 1351–1356.
Benjamin, L.H., Saunders, M.A., 2002. A drought climatology for Europe. Interna-tional Journal of Climatology 22, 1571–1592.
Bhalme, H.N., Mooley, D.A., 1980. Large-scale droughts/floods and monsooncirculation. Monthly Weather Review 108, 1197–1211.
Ciais, P.H., et al., 2005. Europe-wide reduction in primary productivity caused bythe heat and drought in 2003. Nature 437, 529–533.
Chowdhury, A., Dandekar, M.M., Raut, P.S., 1989. Variability in drought incidenceover India–a statistical approach. Mausam 40, 207–214.
Cook, E.R., Woodhouse, C.A., Eakin, C.M., Meko, D.M., Stahle, D.W., 2004. Long-termaridity changes in the western United States. Science 306, 1015–1018.
Dai, A., 2011. Drought under global warming: a review. Wiley InterdisciplinaryReviews: Climate Change 2 (1), 45–65.
Dai, A., Trenberth, K.E., Karl, T.R., 1998. Global Variations in droughts and wetspells: 1900–1995. Geophysical Research Letters 25, 3367–3370.
Dai, A., Trenberth, K.E., Qian, T., 2004. A global dataset of Palmer Drought SeverityIndex for 1870–2002: relationship with soil moisture and effects of surfacewarming. Journal of Hydrometeorology 5, 1117–1130.
Deser, C., Philips, A.S., Alexander, M.A., 2010. Twentieth century tropical sea surfacetemperature trends revisited. Geophysical Research Letters 37 (10), http://dx.doi.org/10.1029/2020GL043321.
Francis, P.A., Gadgil, Sulochana, 2010. Towards understanding the unusual Indianmonsoon in 2009. Journal of Earth System Science 119, 397–415.
Fischer, Erich M., et al., 2007. Soil moisture–atmosphere interactions during the2003 European summer heat wave. Journal of Climate 20, 5081–5099.
Gadgil, Sulochana, Vinayachandran, P.N., Francis, P.A., 2003. Droughts of the Indiansummer monsoon: Role of clouds over the Indian Ocean. Current Science 85,1713–1719.
Gadgil, Sulochana, Gadgil, Siddhartha, 2006. The Indian monsoon, GDP andagriculture. Economic and Political Weekly, 4887–4895.
Gadgil, Sulochana, Rajeevan, M., Francis, P.A., 2007. Monsoon variability: links tomajor oscillations over the equatorial Pacific and Indian oceans. Current Science93, 182–194.
Grinsted, A., Moore, J.C., Jevrejeva, S., 2004. Application of the cross wavelettransform and wavelet coherence to geophysical time series. Nonlinear Pro-cesses in Geophysics 11, 561–566.
Gregory, S., 1989. The changing frequency of drought in India, 1871–1985.Geographical Journal 155, 322–334.
Guhathakurta, P., 2003. Drought in districts of India during the recent all Indianormal monsoon years and its probability of occurrence. Mausam 54, 542–545.
Guhathakurta, P., Rajeevan, M., 2008. Trends in the rainfall pattern over India.International Journal of Climatology 28, 1453–1469, http://dx.doi.org/10.1002/joc.
Heim, R.R., 2002. A review of twentieth century drought indices used in the UnitedStates. Bulletin of the American Meteorological Society 83, 1149–1165.
Ionita, M., Lohmann, G., Rimbu, N., Chelcca, S., Dima, M., 2012. Interannual todecadal summer drought variability over Europe and its relationship to globalsea surface temperature. Climate Dynamics 38, 363–377.
Krishnamurti, T.N., Bedi, H.S., Subramaniam, M., 1989. The summer monsoon of1987. Journal of Climate 2, 321–340.
Krishnamurti, T.N., et al., 2010. Desert air incursions, an overlooked aspect, for thedry spells of the Indian summer monsoon. Journal of the Atmospheric Sciences67, 3423–3441.
Kumar Krishna, K., Rajagopalan, B., Cane, M.A., 1999. On the weakening relationshipbetween the Indian monsoon and ENSO. Science 284, 2156–2159.
McKee, T.B., Doesken, N.J., Kliest, J., 1993. The relationship of drought frequency andduration to time scales. In: Proceedings of the 8th Conference on AppliedClimatology, 17–22 January. Anaheim, CA. American Meteorological Society.Boston, MA, pp. 179–184.
Mishra, A.K., Singh, V.P., 2010. A review of drought concepts 391, 202–216, http://dx.doi.org/10.1016/ j.jhydrol.2010.07.012Journal of Hydrology 391, 202–216,http://dx.doi.org/10.1016/ j.jhydrol.2010.07.012.
Neena, J.M., Suhas, E., Goswami, B.N., 2011. Leading role of internal dynamics in the2009 Indian summer monsoon drought. Journal of Geophysical Research 116(D13), D13103.
Pai, D.S., Latha Sridhar, P., Guhathakurta, Hatwar, H.R., 2011. District-wide droughtclimatology of the southwest monsoon season over India based on standar-dized precipitation index (SPI). Natural Hazards 59, 1797–1813, http://dx.doi.org/10.1007/s11069-011-9867-8.
Palmer, W.C., 1965. Meteorological Drought. US Department of Commerce, WeatherBureau, Washington, DC, USA.
Parthasarathy, B., et al., 1987. Droughts/floods in the summer monsoon season overdifferent meteorological subdivisions of India for the period 1871–1984. Journalof Climatology 7 (1), 57–70.
Rajeevan, M., Jyoti Bhate, J.D., Kale, Lal, B., 2006. High resolution daily griddedrainfall data for the Indian region: analysis of break and active monsoon spells.Current Science 91 (3), 296–306.
Rajeevan, M., Jyoti Bhate, Jaswal, A.K., 2008. Analysis of variability and trends ofextreme rainfall events over India using 104 years of gridded daily rainfalldata. Geophysical Research Letters 35, L18707, http://dx.doi.org/10.1029/2008GL035143.
Rajeevan, M., Sridhar, Latha, 2008. Inter-annual relationships between Atlantic seasurface temperature anomalies and Indian summer monsoon. GeophysicalResearch Letters 35, 21.
Rajeevan, M., Gadgil, Sulochana, Bhate, Jyoti, 2010. Active and break spells of theIndian summer monsoon. Journal of Earth System Science 119, 229–247.
Rajeevan, M., Unnikrishnan, C.K., Preethi, B., 2011. Evaluation of the ENSEMBLESmulti-model seasonal forecasts of Indian summer monsoon variability. ClimateDynamics 38, 2257–2274, http://dx.doi.org/10.1007/s00382-011-1061-1.
Ramesh Kumar, M.R., Krishnan, R., Sankar, S., Unnikrishnan, A.S., Pai, D.S., 2009.Increasing trend of “break-monsoon” conditions over India-Role of ocean-atmosphere processes in the Indian Ocean. IEEE Geoscience and RemoteSensing Letters 6, 332–336.
Rao, Y.P., 1981. Blocking highs over Asia and monsoon droughts over India. Nature289, 271.
Rayner, N.A., Parker, D.E., Horton, E.B., Folland, C.K., Alexander, L.V., Rowell, D.P.,Kent, E.C., Kaplan, A., 2003. Global analyses of sea surface temperature, sea ice,and night marine air temperature since the late nineteenth century. Journal ofGeophysical Research 108 (D14), 4407. (10.1029/2002JD002670).
Sikka, D.R., 1999. Monsoon drought in India. No. 2. Center for Ocean–Land–Atmosphere Studies, Center for the Application of Research on the Environment.
Sikka, D.R., 2003. Evaluation of monitoring and forecasting of summer monsoonover India and a review of monsoon drought of 2002. Proceedings of theNational Academy of Sciences, India, Section A 69, 479–504.
SinhaRay, K.C., Shewale, M.P., 2001. Probability of occurrence of drought in varioussubdivisions of India. Mausam 52, 541–546.
Sivakumar, M.V.K., Wilhite, D.A., Motha, R.P., Wood, D.A., 2011. Agricultural DroughtIndices. In Proceedings of WMO/UNISDR Expert Group Meeting on AgriculturalDrought Indices, 2-4 June 2010, Murcia, Spain. AGM-11, WMO/TD No. 1572; WAOB-2011. World Meteorological Organization, Geneva, Switzerland: 182 pp.
Smakhtin, V.U., Hughes, D.A., 2004. Review, Automated Estimation and Analyses ofDrought Indices in South Asia. Working Paper 83. International Water Manage-ment Institute, 24 pp.
Sperber, K.R., Annamalai, H., Kang, I.S., Kitoh, A., Moise, A., Turner, A., Zhou, T., 2012.The Asian summer monsoon: an intercomparison of CMIP5 vs CMIP3 simula-tions of the late 20th century. Climate Dynamics 39, 1–34.

K. Niranjan Kumar et al. / Weather and Climate Extremes 1 (2013) 42–5050
Srivastava, A.K., Rajeevan, M., Kshirsagar, S.R., 2009. Development of a highresolution daily gridded temperature data set (1969–2005) for the Indianregion. Atmospheric Science Letters 10, 249–254, http://dx.doi.org/10.1002/asl.232.
Thornthwaite, C.W., 1948. An approach toward a rational classification of climate.Geographical Review 38 (1), 55–94.
Torrence, C., Compo, G.P., 1998. A practical guide to wavelet analysis. Bulletin of theAmerican Meteorological Society 79, 61–78.
Ummenhofer, C.C., R.D. D'Arrigo, K.J. Anchukaitis, B.M. Buckley and E.R. Cook, 2012,Links between Indo-Pacific climate variability and drought in the Monsoon AsiaDrought Atlas, Climate Dynamics, 40, 1-16. http://dx.doi.org/10.1007/s00382-012-1458-1.
Vicente-Serrano, Sergio M., Beguería, Santiago, López-Moreno, Juan I., 2010a. Amultiscalar drought index sensitive to global warming: the standardizedprecipitation evapotranspiration index. Journal of Climate 23, 1696–1718.
Vicente-Serrano, Sergio M., et al., 2010b. A new global 0.5 gridded dataset (1901–2006) of a multiscalar drought index: comparison with current drought indexdatasets based on the Palmer Drought Severity Index. Journal of Hydrometeor-ology 11, 1033–1043.
Wilks, Daniel S., 2011. Statistical Methods in the Atmospheric Sciences. vol. 100.Academic Press, Oxford, UK.
Wilhite, D.A., Glantz, M.H., 1985. Understanding the drought phenomenon: the roleof definitions. Water International 10, 111–120.


![arXiv:1211.6952v2 [astro-ph.HE] 31 Dec 2014Vladim´ır Karas), tapan.naskar@cbs.ac.in(Tapan Naskar) 1Present Address: Indian Institute of Science Education & Research, Pune 411008,](https://img.pdfslide.us/doc/110x75/5ab69f887f8b9a7c5b8dd487/arxiv12116952v2-astro-phhe-31-dec-2014-vladimir-karas-tapannaskarcbsacintapan.jpg)