Embed Size (px)
Citation preview

Climate Risk Management and Tailored Climate Forecasts
Andrew W. RobertsonMichael K. TippettInternational Research Institute for Climate and Society (IRI) New York, USA
SASCOF-1, April 13-15, 2010
outline
• what is Climate Risk Management? – some examples
• statistical tailoring methods for seasonal forecasts
Climate Risk Management examples
• reservoir management in Manila
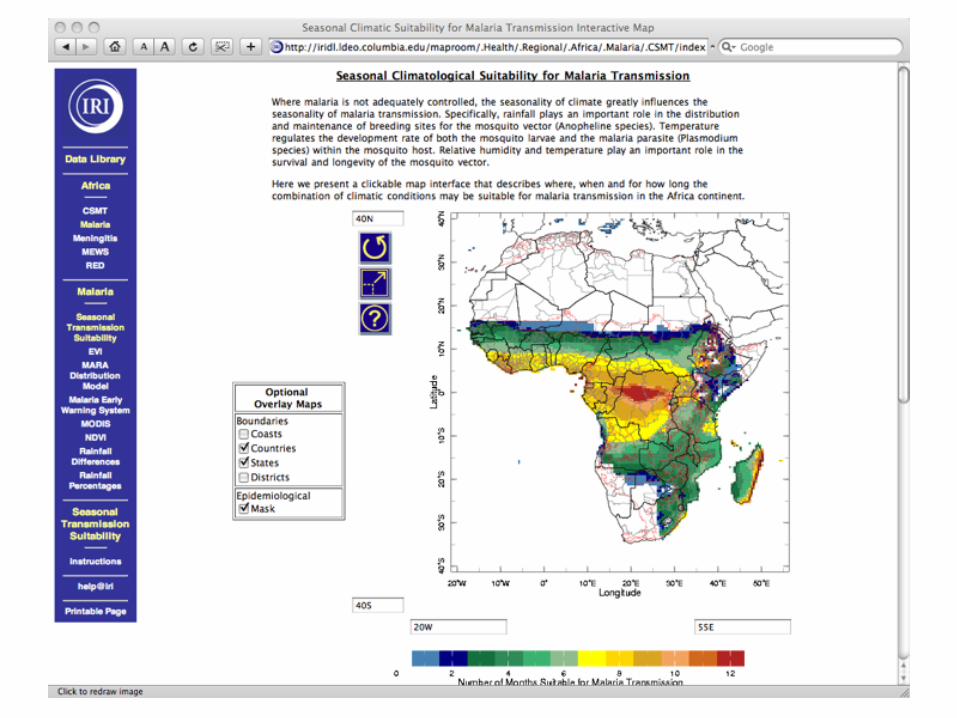
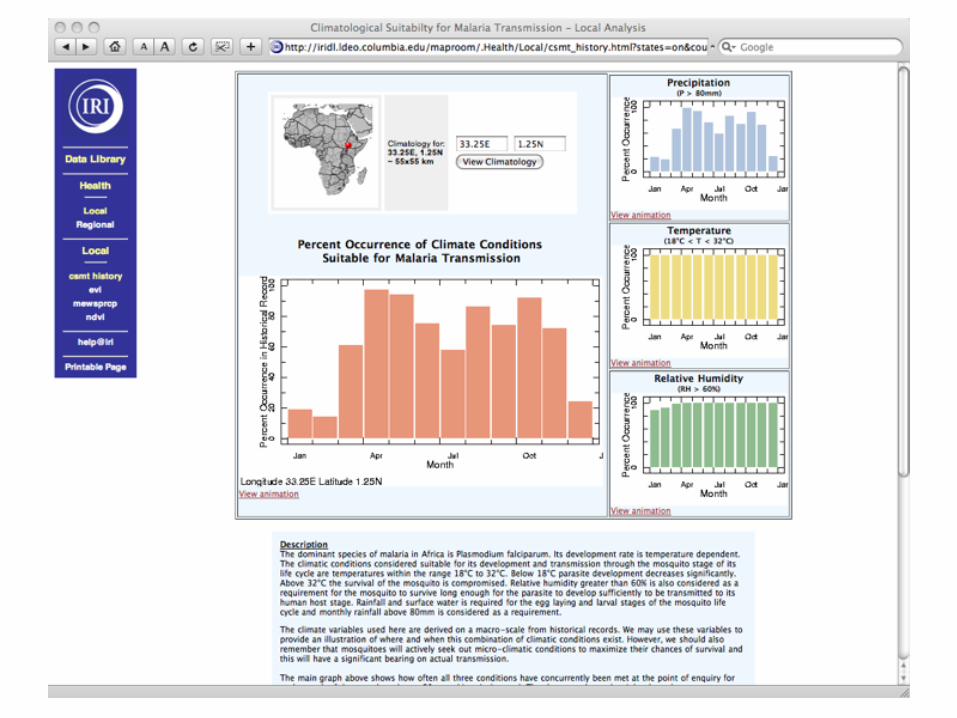
• malaria mapping and early warning in Africa
Angat reservoir
Metro Manila
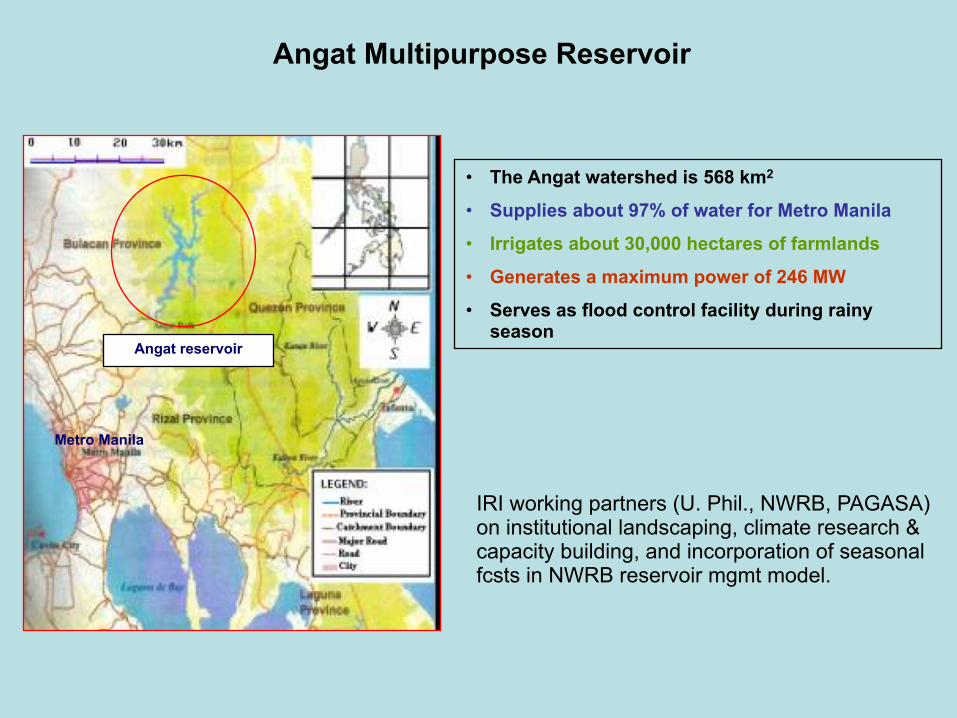
Angat Multipurpose Reservoir
• The Angat watershed is 568 km2
• Supplies about 97% of water for Metro Manila
• Irrigates about 30,000 hectares of farmlands
• Generates a maximum power of 246 MW
• Serves as flood control facility during rainy season
IRI working partners (U. Phil., NWRB, PAGASA) on institutional landscaping, climate research & capacity building, and incorporation of seasonal fcsts in NWRB reservoir mgmt model.
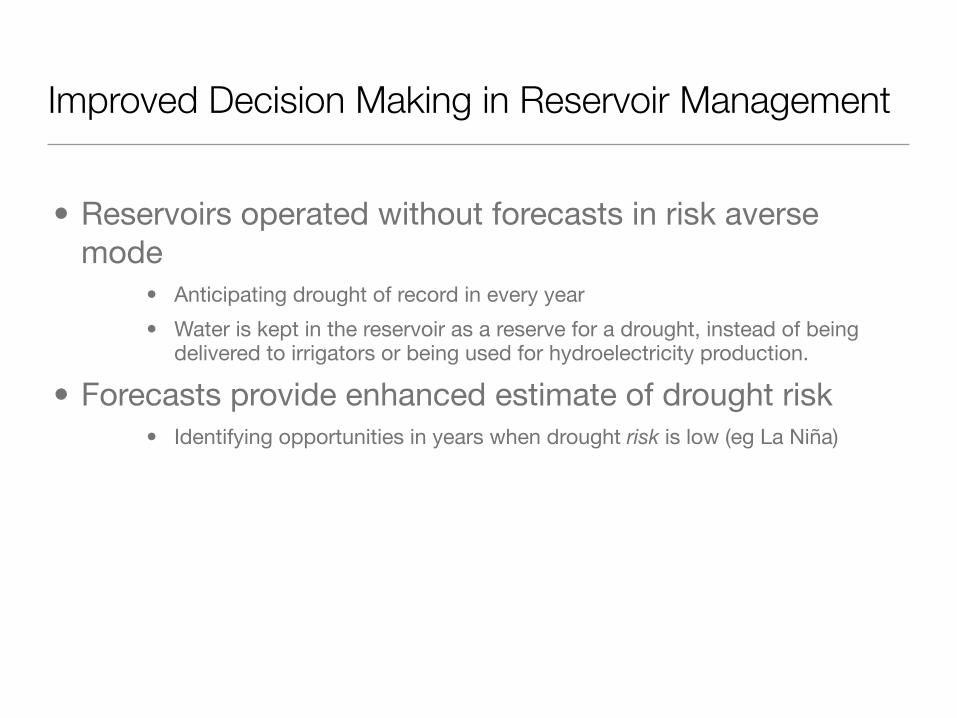
Improved Decision Making in Reservoir Management
• Reservoirs operated without forecasts in risk averse mode
• Anticipating drought of record in every year
• Water is kept in the reservoir as a reserve for a drought, instead of being delivered to irrigators or being used for hydroelectricity production.
• Forecasts provide enhanced estimate of drought risk • Identifying opportunities in years when drought risk is low (eg La Niña)
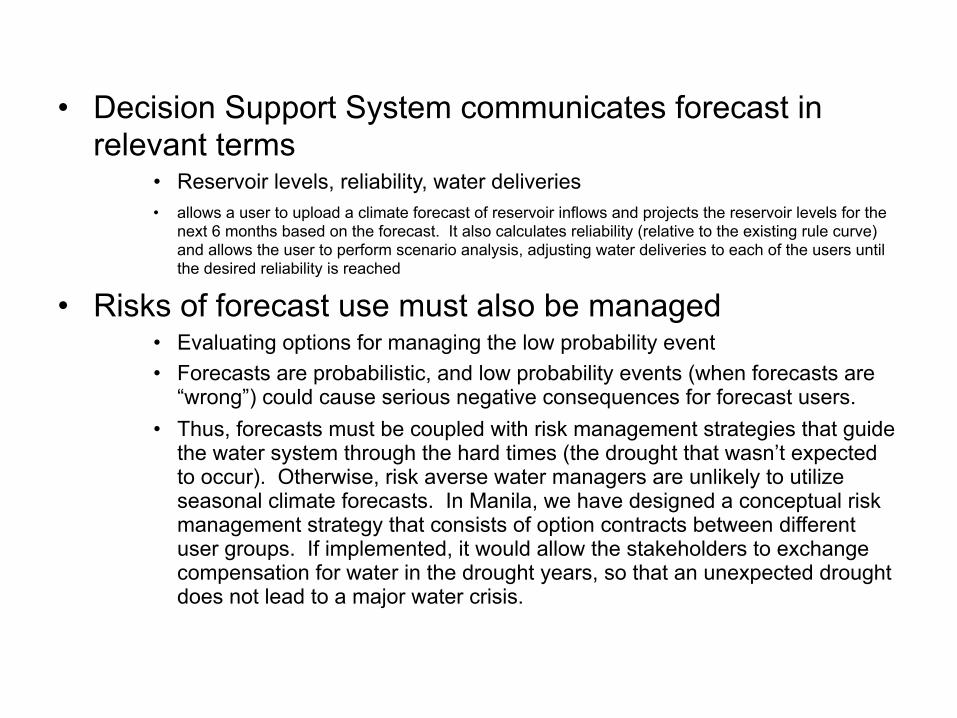
• Decision Support System communicates forecast in relevant terms
• Reservoir levels, reliability, water deliveries• allows a user to upload a climate forecast of reservoir inflows and projects the reservoir levels for the
next 6 months based on the forecast. It also calculates reliability (relative to the existing rule curve) and allows the user to perform scenario analysis, adjusting water deliveries to each of the users until the desired reliability is reached
• Risks of forecast use must also be managed• Evaluating options for managing the low probability event• Forecasts are probabilistic, and low probability events (when forecasts are
“wrong”) could cause serious negative consequences for forecast users. • Thus, forecasts must be coupled with risk management strategies that guide
the water system through the hard times (the drought that wasn’t expected to occur). Otherwise, risk averse water managers are unlikely to utilize seasonal climate forecasts. In Manila, we have designed a conceptual risk management strategy that consists of option contracts between different user groups. If implemented, it would allow the stakeholders to exchange compensation for water in the drought years, so that an unexpected drought does not lead to a major water crisis.
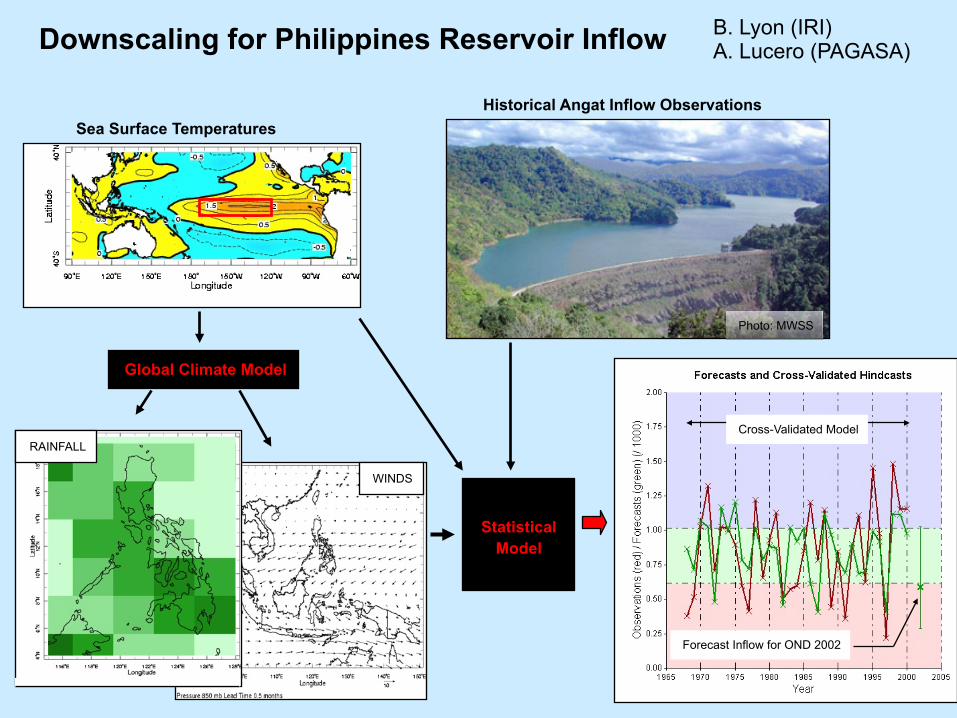
Downscaling for Philippines Reservoir Inflow
Statistical Model
Photo: MWSS
Sea Surface Temperatures
Global Climate Model
Historical Angat Inflow Observations
Forecast Inflow for OND 2002
RAINFALL
WINDS
Cross-Validated Model
B. Lyon (IRI)A. Lucero (PAGASA)
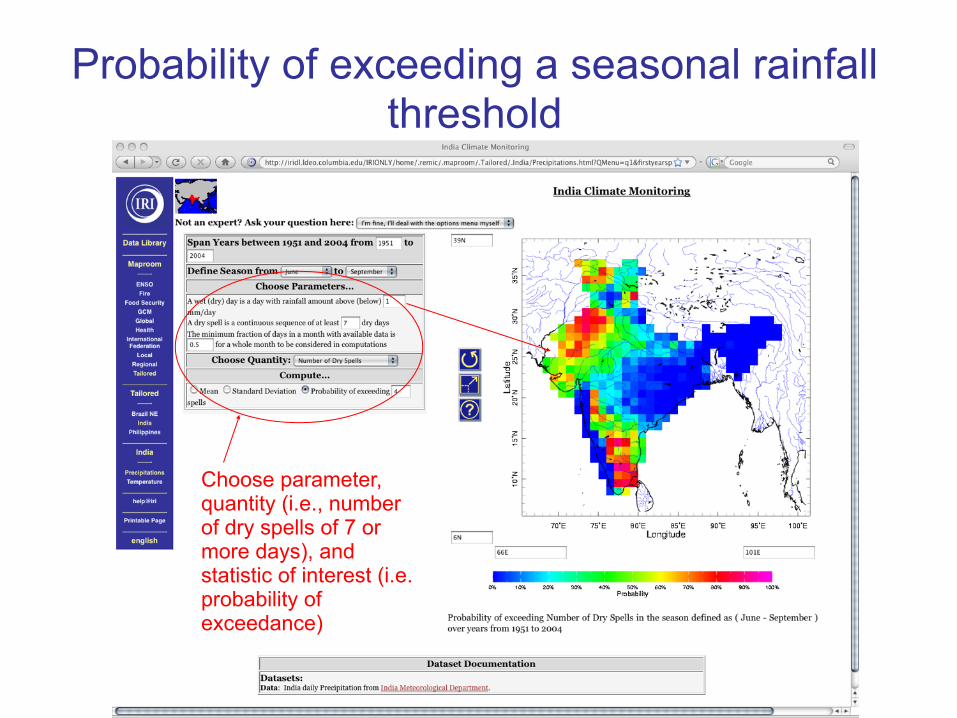
Probability of exceeding a seasonal rainfall threshold
Choose parameter, quantity (i.e., number of dry spells of 7 or more days), and statistic of interest (i.e. probability of exceedance)
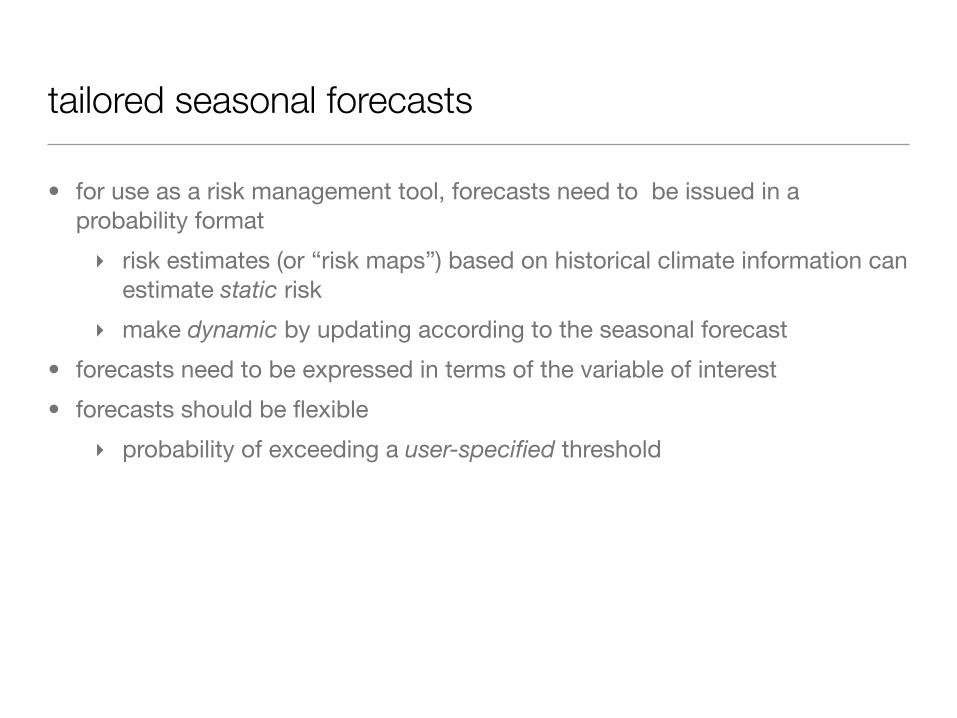
tailored seasonal forecasts
• for use as a risk management tool, forecasts need to be issued in a probability format
‣ risk estimates (or “risk maps”) based on historical climate information can estimate static risk
‣ make dynamic by updating according to the seasonal forecast
• forecasts need to be expressed in terms of the variable of interest
• forecasts should be flexible
‣ probability of exceeding a user-specified threshold
how to make tailored seasonal forecasts?combining GCM forecasts and observational data
Forecast “Assimilation”
Stephenson et al (2005)
L. Goddard
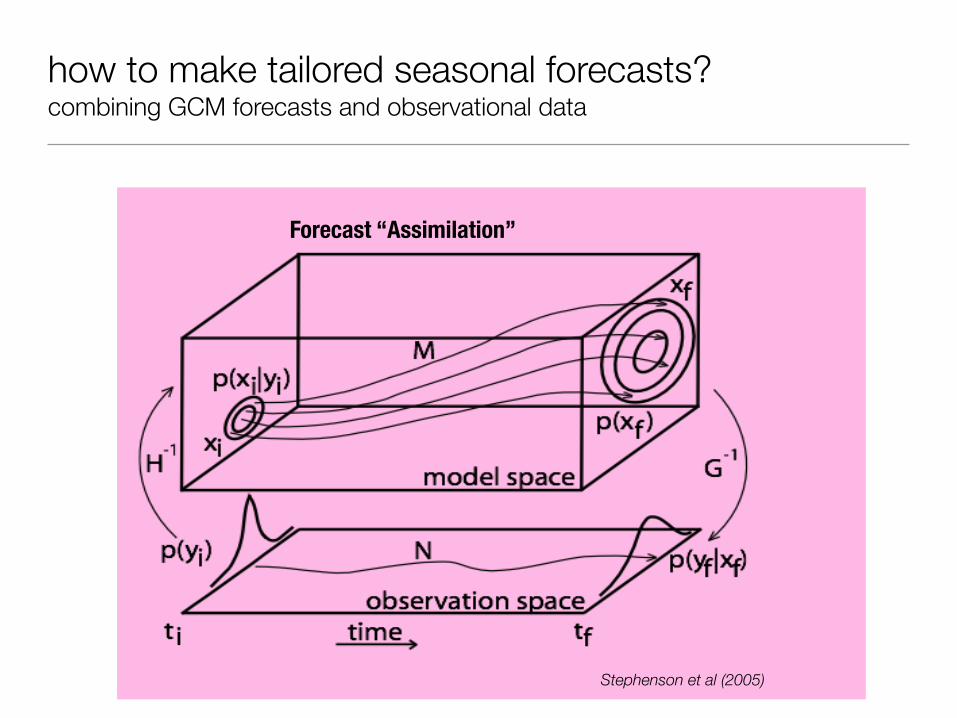
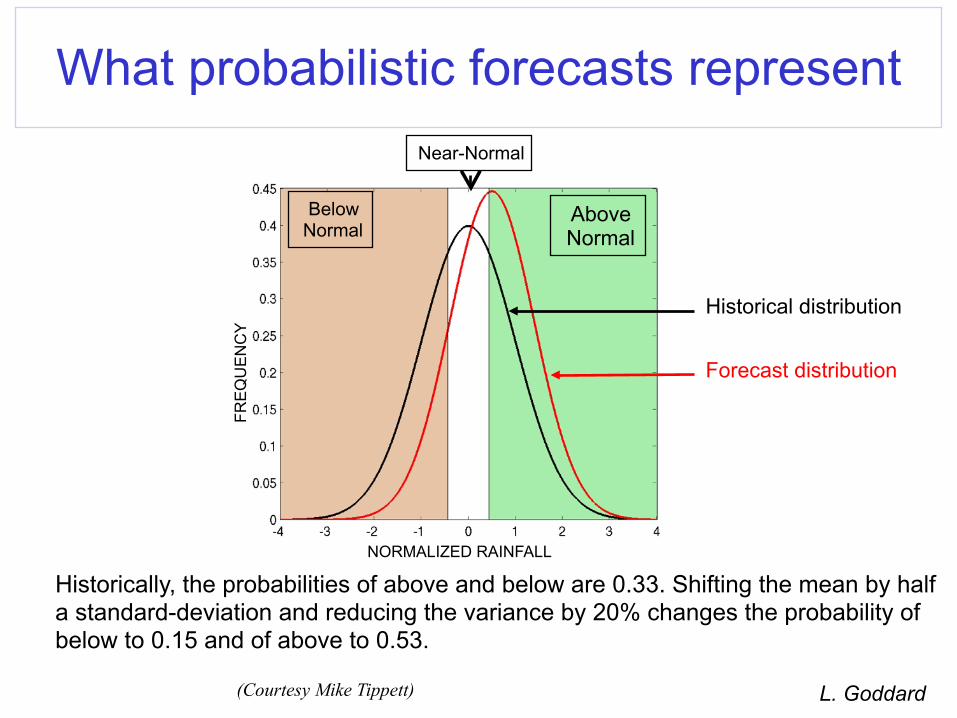
BelowNormal
AboveNormal
Historically, the probabilities of above and below are 0.33. Shifting the mean by half a standard-deviation and reducing the variance by 20% changes the probability of below to 0.15 and of above to 0.53.
Historical distribution
Forecast distribution
(Courtesy Mike Tippett)
What probabilistic forecasts representNear-Normal
NORMALIZED RAINFALL
FRE
QU
EN
CY
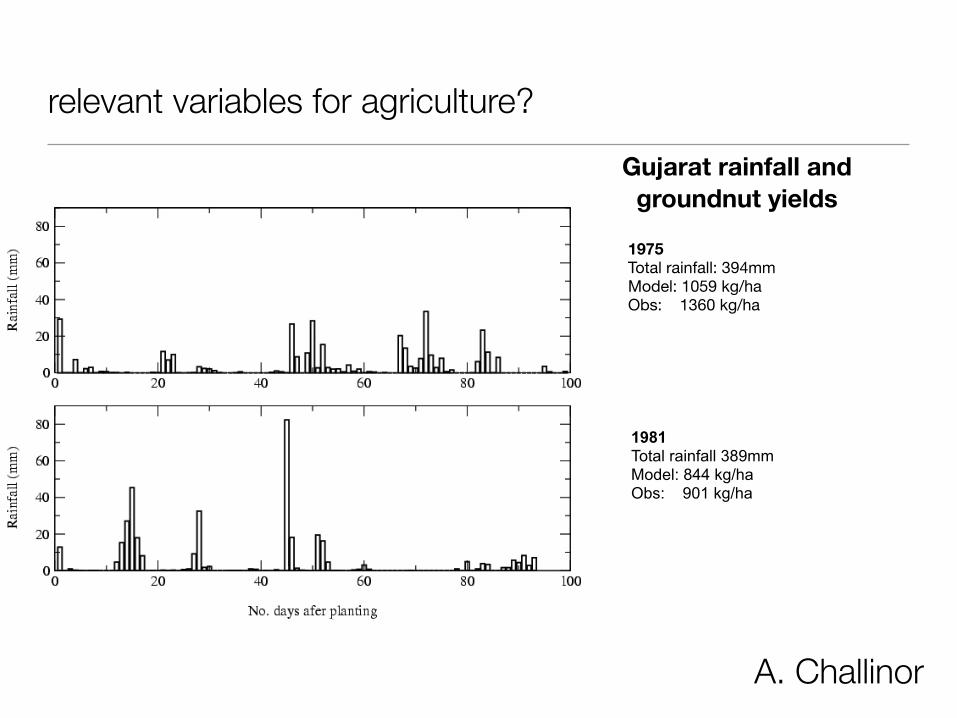
relevant variables for agriculture?
1975Total rainfall: 394mmModel: 1059 kg/haObs: 1360 kg/ha
1981Total rainfall 389mmModel: 844 kg/haObs: 901 kg/ha
A. Challinor
Gujarat rainfall and groundnut yields

Climate risk management: Demonstration sites in SE Asia Diversity of climate hazards + socio-economic systemsMulti-scale partnerships
Angat, Bulacan
Nusa Tenggara Timur
Indramayu
IloIlo
Can Tho
Quang Tri
BaliTimur
Indramayu, a critical rice-growing district in densely
populated West Java, contributing 1/4 of Java's rice production.
Farmers experience droughts and floods which can cause significant
losses in rice production
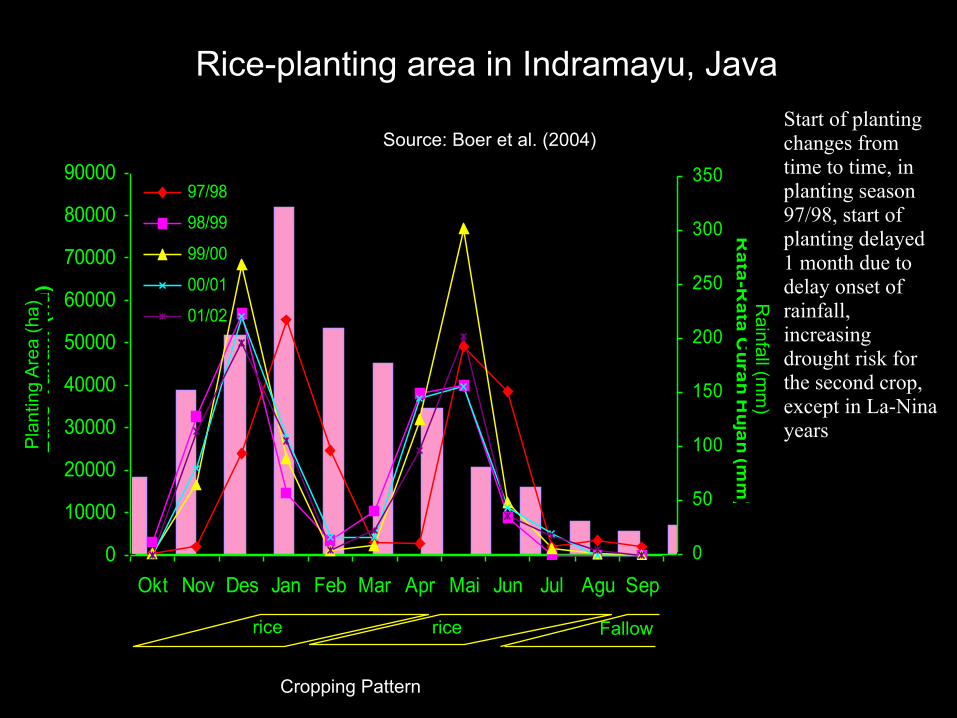
Rice-planting area in Indramayu, JavaStart of planting changes from time to time, in planting season 97/98, start of planting delayed 1 month due to delay onset of rainfall, increasing drought risk for the second crop, except in La-Nina years
Source: Boer et al. (2004)
Rainfall (m
m)
Pla
ntin
g A
rea
(ha)
rice rice Fallow
Cropping Pattern
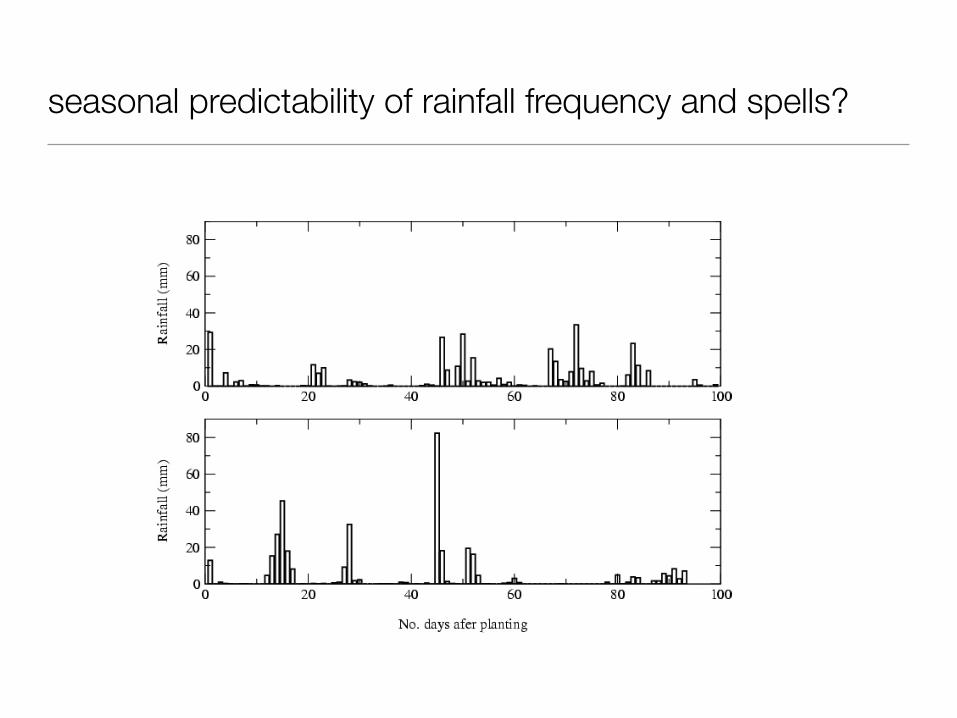
seasonal predictability of rainfall frequency and spells?
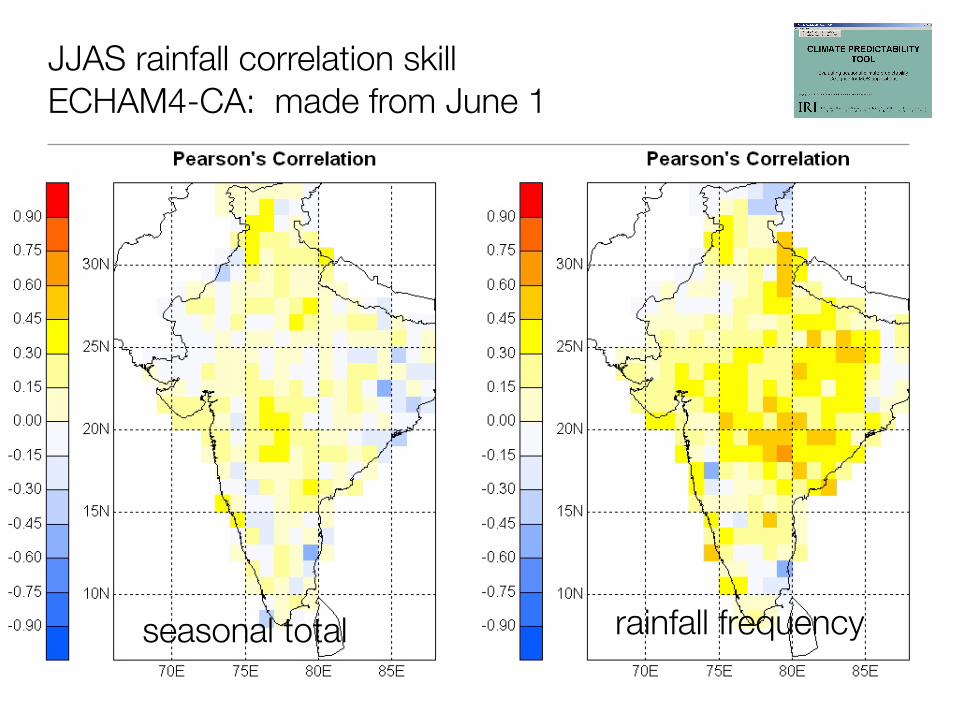
JJAS rainfall correlation skillECHAM4-CA: made from June 1
seasonal total rainfall frequency
Choose the analysis to perform: PCR or CCA
SELECTING THE ANALYSIS
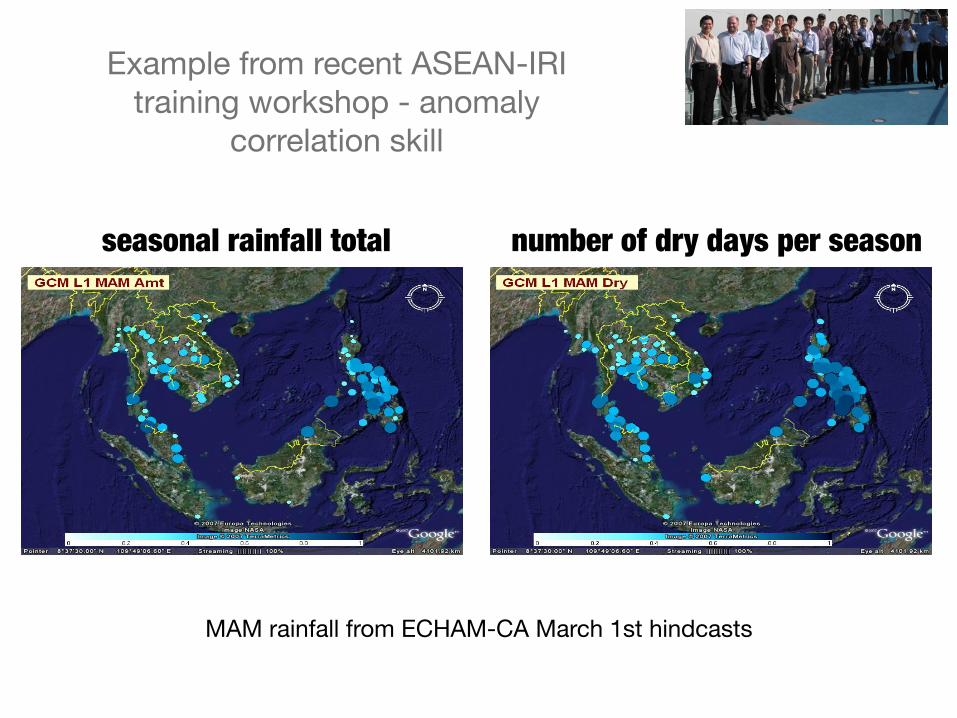
Example from recent ASEAN-IRI training workshop - anomaly
correlation skill
seasonal rainfall total number of dry days per season
MAM rainfall from ECHAM-CA March 1st hindcasts
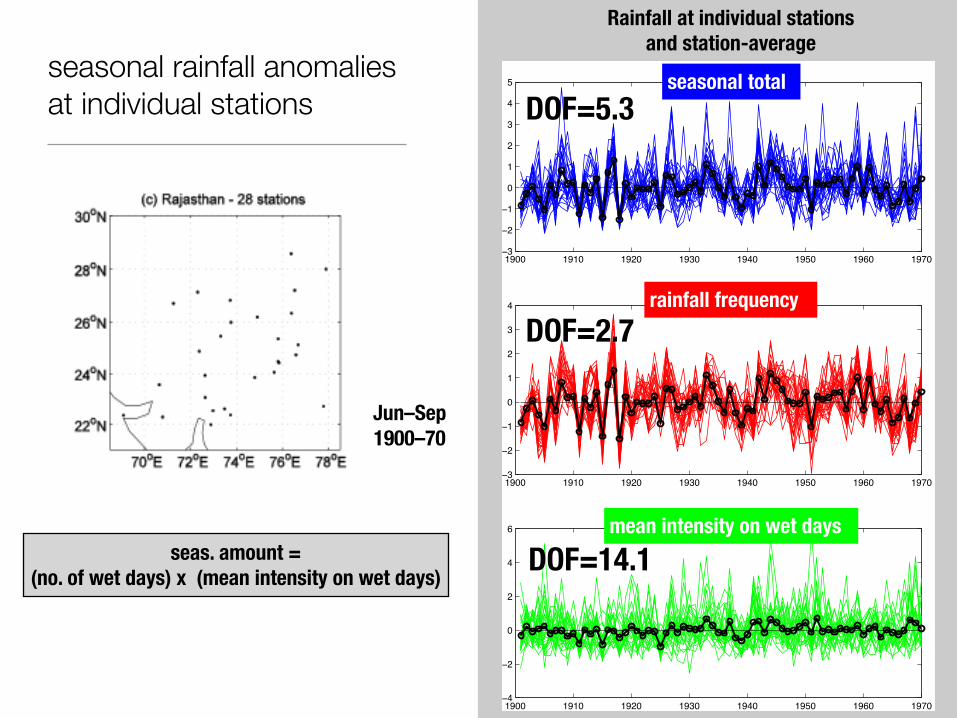
seasonal rainfall anomalies at individual stations
1900 1910 1920 1930 1940 1950 1960 1970!3
!2
!1
0
1
2
3
4
5Seasonal Amount
1900 1910 1920 1930 1940 1950 1960 1970!3
!2
!1
0
1
2
3
4Frequency of Occurrence
1900 1910 1920 1930 1940 1950 1960 1970!4
!2
0
2
4
6Daily Mean Intensity
Rainfall at individual stationsand station-average
seasonal total
rainfall frequency
mean intensity on wet daysseas. amount =
(no. of wet days) x (mean intensity on wet days)
Jun–Sep1900–70
DOF=5.3
DOF=2.7
DOF=14.1

Water vapor image Canal June 17, 1997 at 00h (C.D. Thorncroft)
Meso-Scale :Squall-lines lasting few days …
why are seasonal anomalies of rainfall frequency more coherent than intensity?
• intense convection is very fine scale: may hit or miss a raingauge
• organization of rainfall is larger scale
• climate forcings integrate across a season, preferentially acting on occurrence
Zonal Scale: ITCZ & seasonal scale
Local Scale: ConvectiveCells lasting few hours …
V. Moron
seasonal predictability of monsoon onset date?
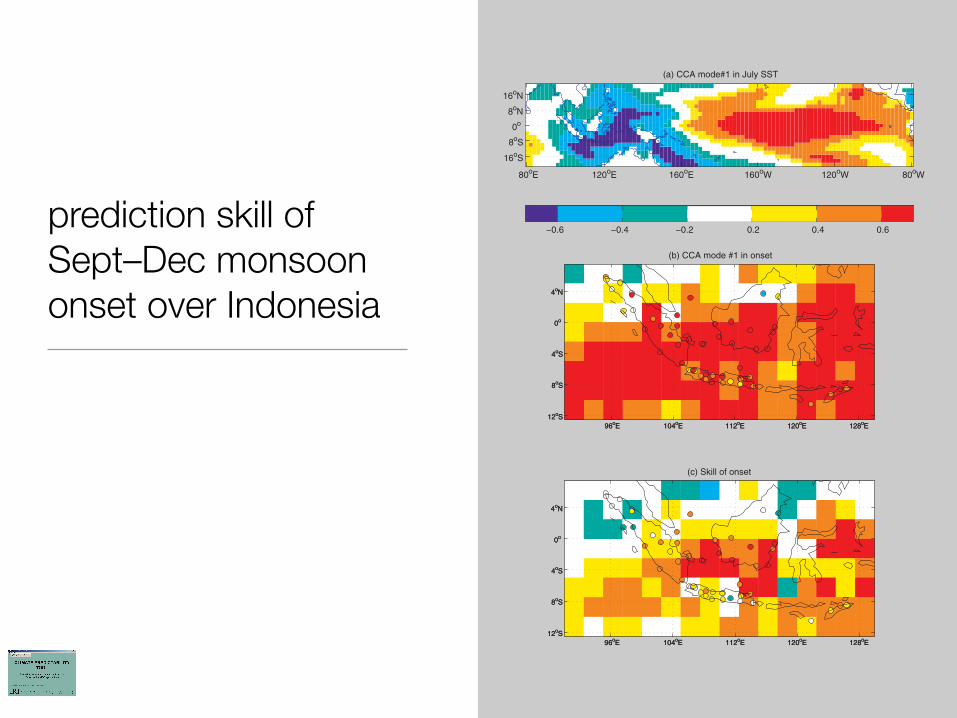
prediction skill of Sept–Dec monsoon onset over Indonesia
Choose the analysis to perform: PCR or CCA
SELECTING THE ANALYSIS
anomaly correlation, with regional averages given inTable 1 (last column). Skill values are highest overmonsoonal Indonesia, exceeding 0.5** from southernSumatra to southern Kalimantan and Timor, reaching0.80*** for the SAI computed over all stations (0.70***for CMAP). The subisland subsets of stations in Table1 achieve station-averaged skills ranging from 0.22(northern Sumatra) to 0.84*** (southern Kalimantan).The spatial variability of skill over Java could be due torandom sampling but also to deterministic signals as-
sociated with small-scale orographic features and/ororientation relative to low-level winds.
4. Conclusions
The spatial coherence of onset date and postonsetrainfall is analyzed from GSOD rain gauges and theCMAP dataset. The onset date is defined using an ag-ronomic approach, that is, the first significant wet spell(here 40 mm in 5 days) without any potentially damaging
FIG. 5. Homogeneous correlation maps of (a) SST, and (b) onset date from CMAP(shading) and GSOD (circles), of the leading canonical correlation analysis (CCA) mode (c)MOS skill (i.e., correlation between observed and hindcast onset date) associated with theleading CCA mode between July SST and onset dates.
848 JOURNAL OF CL IMATE VOLUME 22
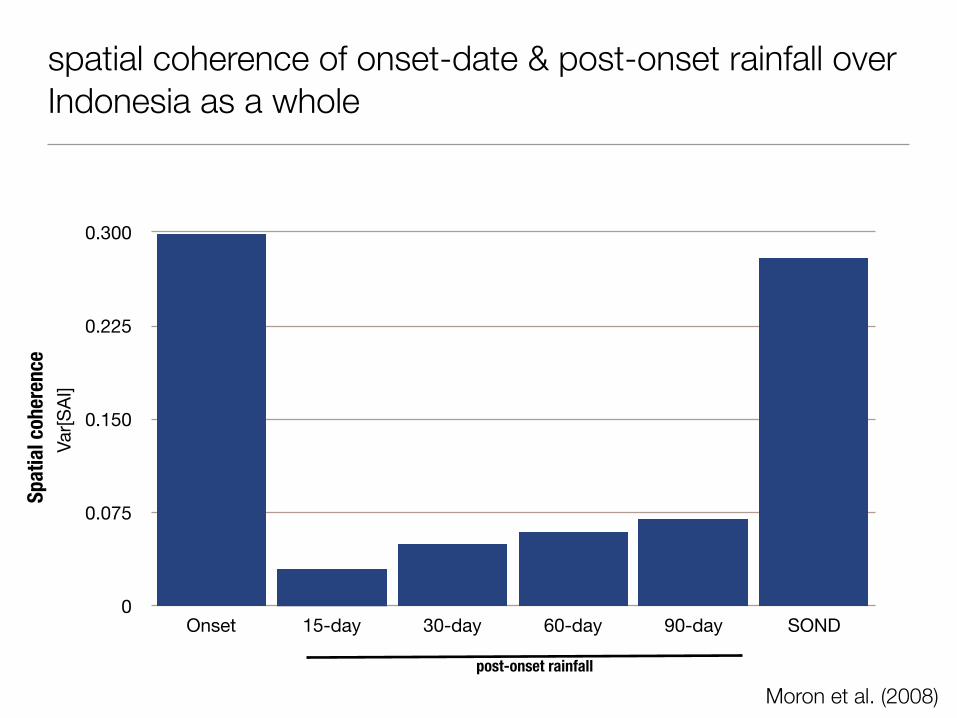
spatial coherence of onset-date & post-onset rainfall over Indonesia as a whole
0
0.075
0.150
0.225
0.300
Onset 15-day 30-day 60-day 90-day SOND
Var[
SA
I]
Moron et al. (2008)
post-onset rainfall
Spat
ial c
oher
ence
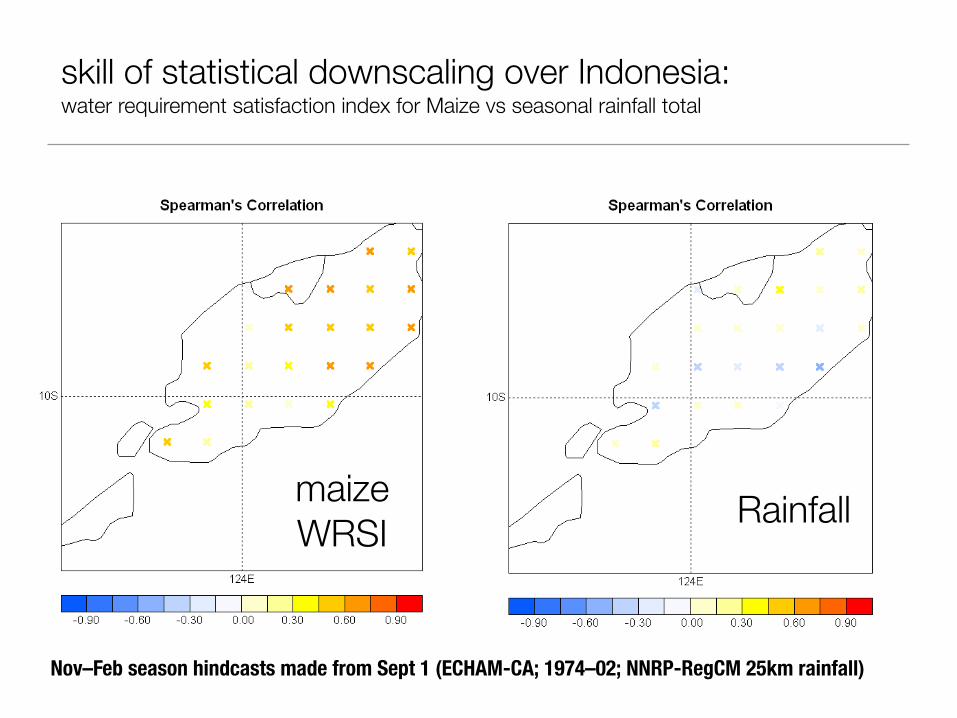
skill of statistical downscaling over Indonesia: water requirement satisfaction index for Maize vs seasonal rainfall total
maizeWRSI
Rainfall
Nov–Feb season hindcasts made from Sept 1 (ECHAM-CA; 1974–02; NNRP-RegCM 25km rainfall)
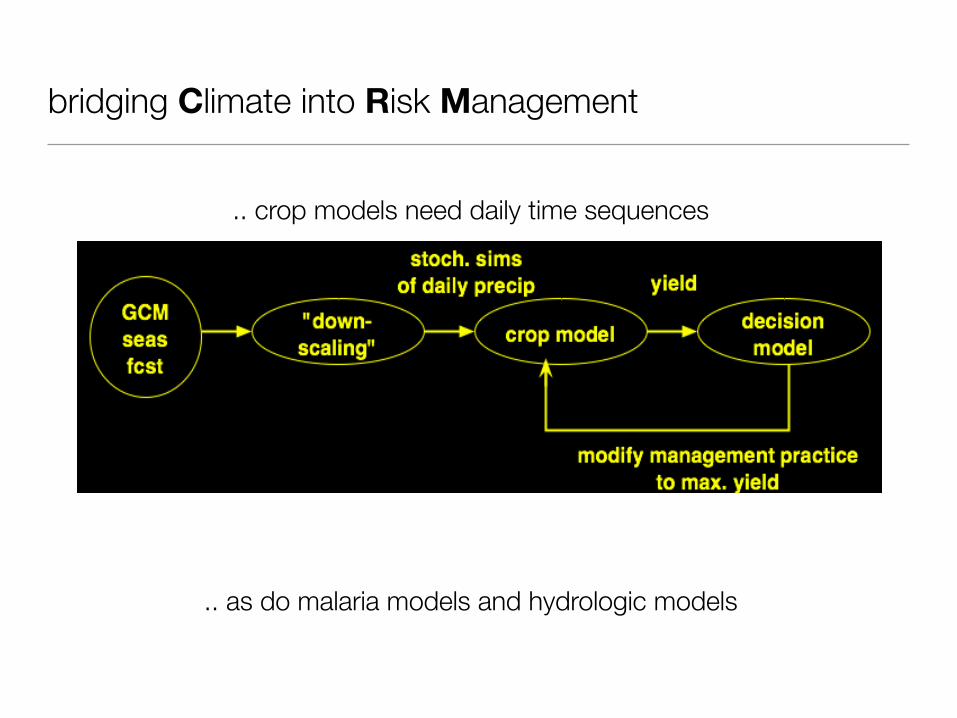
.. crop models need daily time sequences
bridging Climate into Risk Management
.. as do malaria models and hydrologic models
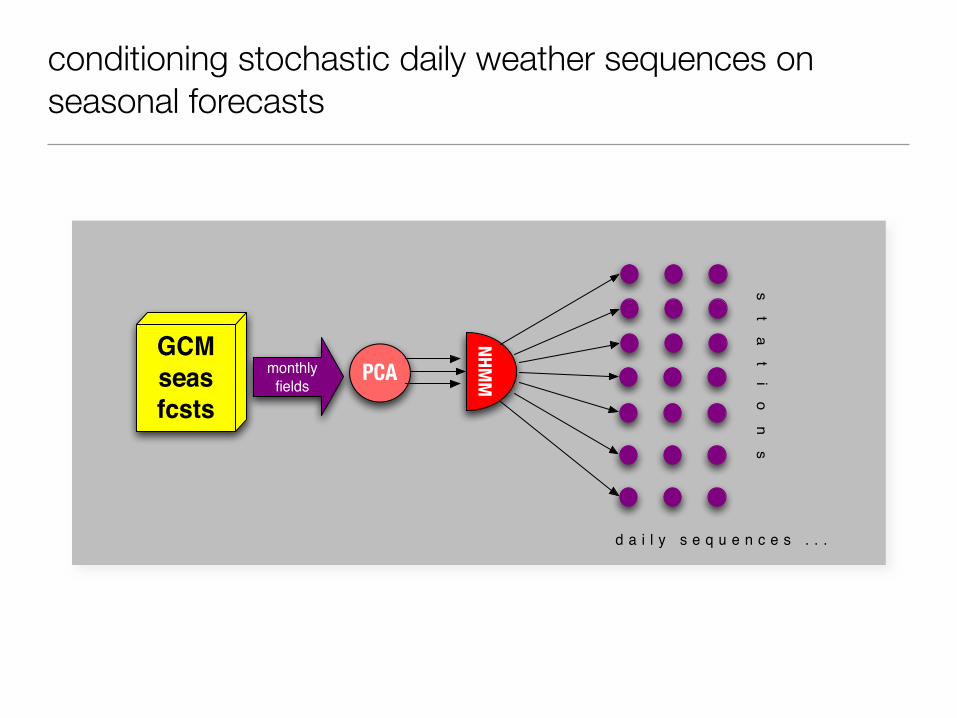
conditioning stochastic daily weather sequences on seasonal forecasts
monthly
fields
GCM
seas
fcsts
PCA
NHMM
st
at
io
ns
d a i l y s e q u e n c e s . . .
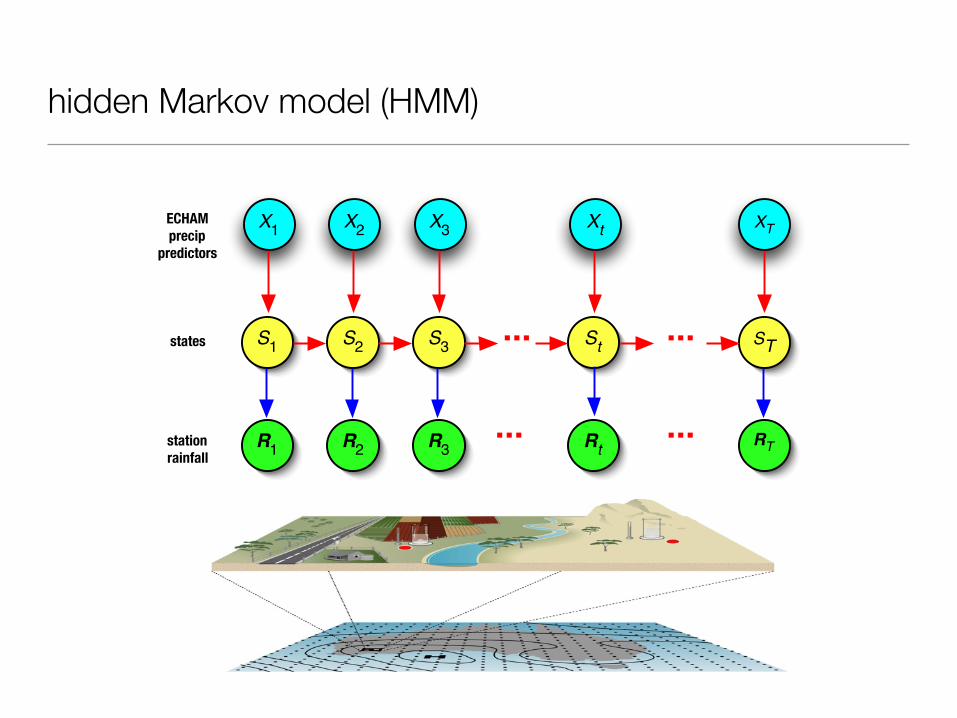
R1
R2
Rt RTR3
... ...
S1
S2
S3
St ST... ...states
stationrainfall
X1
X2
Xt XTX3
ECHAMprecip
predictors
hidden Markov model (HMM)
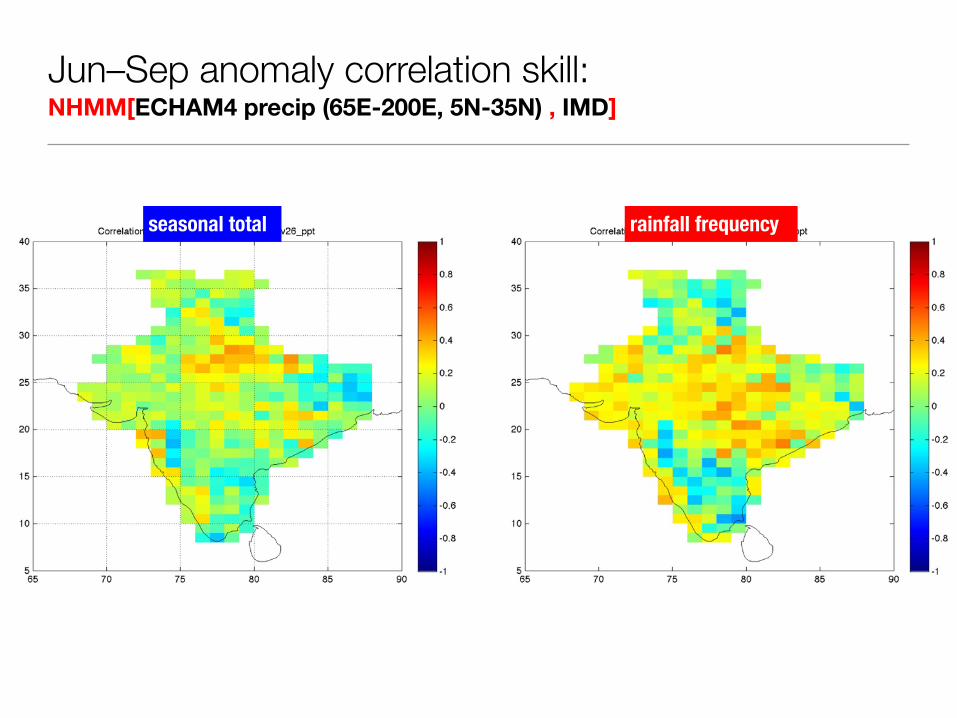
Jun–Sep anomaly correlation skill: NHMM[ECHAM4 precip (65E-200E, 5N-35N) , IMD]
seasonal total rainfall frequency
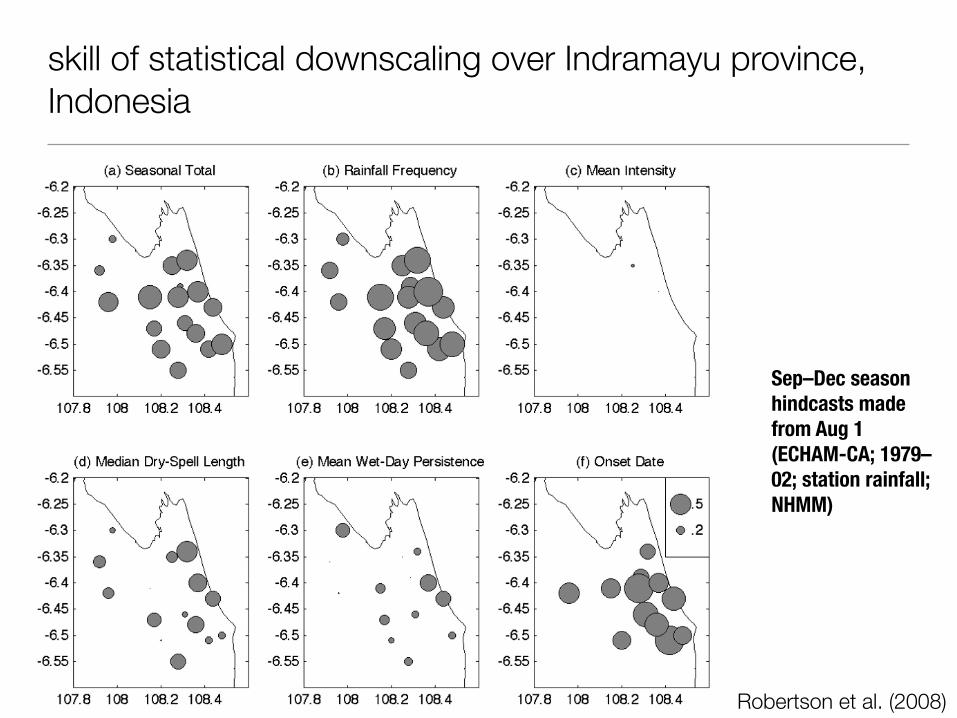
skill of statistical downscaling over Indramayu province, Indonesia
Robertson et al. (2008)
Sep–Dec season hindcasts made from Aug 1 (ECHAM-CA; 1979–02; station rainfall; NHMM)
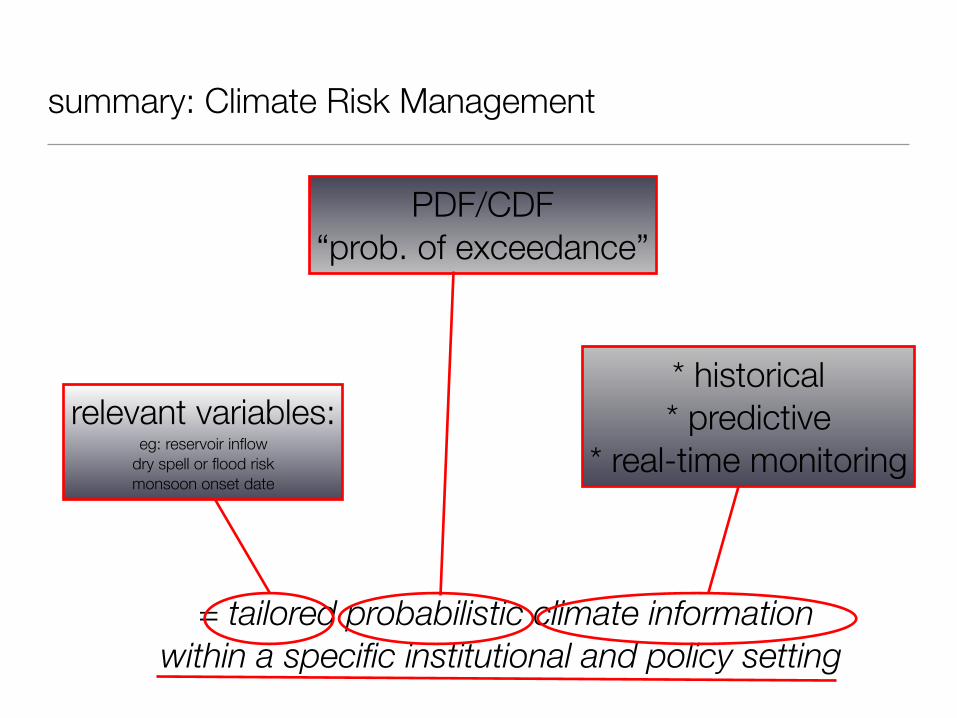
= tailored probabilistic climate information within a specific institutional and policy setting
relevant variables:eg: reservoir inflow
dry spell or flood riskmonsoon onset date
PDF/CDF“prob. of exceedance”
* historical* predictive
* real-time monitoring
summary: Climate Risk Management

summary: “tailored” seasonal forecasts
• correction of various biases (aka calibration, fcst assimilation)
• spatial “downscaling” of seasonal averages
‣ local stations
‣ administrative units, e.g. districts, to match user needs & ag. data
• user-relevant meteorological “events” (eg dry-spell probability)
• coupling to a sectoral (e.g. crop) model using “temporal downscaling”
• probability format: want a “CDF” conditioned reliably on fcst