Embed Size (px)
Citation preview
A Simulation of Angat Dam Outflow Utilizing A Geographic Information System
Justin Alexis O. Abrantes De La Salle University
2401 Taft Avenue, Manila +639178710747
Neil Francis B. Marcelo De La Salle University
2401 Taft Avenue, Manila +639165739861
Precious Hazelle M. Punzalan De La Salle University
2401 Taft Avenue, Manila +639052301386
Rhenalynne Renae A. Roca De La Salle University
2401 Taft Avenue, Manila +639154404694
Ma. Victoria G. Pineda De La Salle University
2401 Taft Avenue, Manila +639158795958
ABSTRACT The Philippines is a disaster prone country especially when it comes to tropical storms or cyclones which can cause devastating floods. To alleviate this kind of problem, this study uses a GIS called GRASS and HEC-RAS flood modeling system to simulate the dam outflow of one of the dams in the Philippines particularly the Angat dam. The study is also proposing the use of the Distributed Rainfall-Runoff model to model the rainfall with a multiple-flow algorithm. The flood model that is being used is the HEC-RAS - Steady Flow Water Surface Profiles. The elevation data of Bulacan were acquired from SRTM. With the aid of these simulation models, the authorities can have an insight of the feasible damages that the outflow from Angat dam can cause. Thus, the authorities can plan for other options to prevent the damages to happen at the places affected by the water release.
Keywords Geographic Information Systems, simulation, disaster mitigation, Angat Dam, dam outflow.
1. INTRODUCTION The Philippines suffers from many different forms of disaster ranging from volcanic eruptions, drought and floods. Floods are the common in most of the cities here in the Philippines. The places which are hardly experiencing floods suddenly suffers from it not only because of unexpected super typhoons entering the Philippine area of responsibility, but also because of the sudden and improper release of water from different dams in the Philippines. According to a recent study by Brussels-based Center for Research on the Epidemiology of Disasters (CRED), the Philippines which experienced 25 disasters in the year 2009 topped the list of the countries that are most vulnerable to disasters. Due to this incident, it somehow helped the new disaster preparedness law to be implemented that was signed last May 2010. The Office of Civil Defense (OCD) is focusing not only on disaster response but on disaster risk reduction as well [4]. Disaster mitigation plays an important role since it is a form of disaster risk reduction. Mitigation is a form of reducing the effects of disaster even before it occurs. As an application of disaster mitigation, this study will incorporate computer-based simulation systems in flood assessment. Moreover, the simulation system
will make use of data coming from a dam management. Angat dam is located at Barangay San Lorenzo, Norzagaray, Bulacan. Angat dam is currently maintained by the National Power Corporation. To further analyze and give concrete support, this research will focus on developing and Angat Dam Simulation system. Computer-based simulation systems are currently one of the latest technologies used in disaster preparedness. Moreover, the use of Geographic Information System in computer-based simulation system makes it possible to have interactive simulation systems in order to effectively represent the probable incoming disaster. In order to prevent some certain disasters such as devastating floods that caused by the improper release of water from dams, there is a need to create a computer-aided technology that would simulate dam outflows and show possible damages on the affected areas of the disaster.
2. IMPORTANT SYSTEMS AND RESEARCH 2.1 Geographic Information System A geographic information system (GIS) integrates hardware, software, and data for capturing, managing, analyzing, and displaying all forms of geographically referenced information. Moreover, GIS technology can be integrated into any enterprise information system framework. Nowadays, businesses, government agencies, educators and scientists, environmental and conservation organizations, natural resource groups, and utilities benefit from using GIS. Most common uses of GIS are: mapping where things are, mapping quantities, mapping densities, mapping the changes, finding what’s nearby and monitoring a specific area [3]. 2.2 SRTM Shuttle Radar Topography Mission which is more commonly known as SRTM is a space mission aboard the space shuttle Endeavour. The digital elevation model (DEM) maps which were created by the mission are freely distributed by NASA on the internet. The SRTM data could be used in Geographic Information Systems. SRTM is the source of the elevation data of
the system. The information from the DEM map are extracted by GRASS and is utilized for the simulation [5].
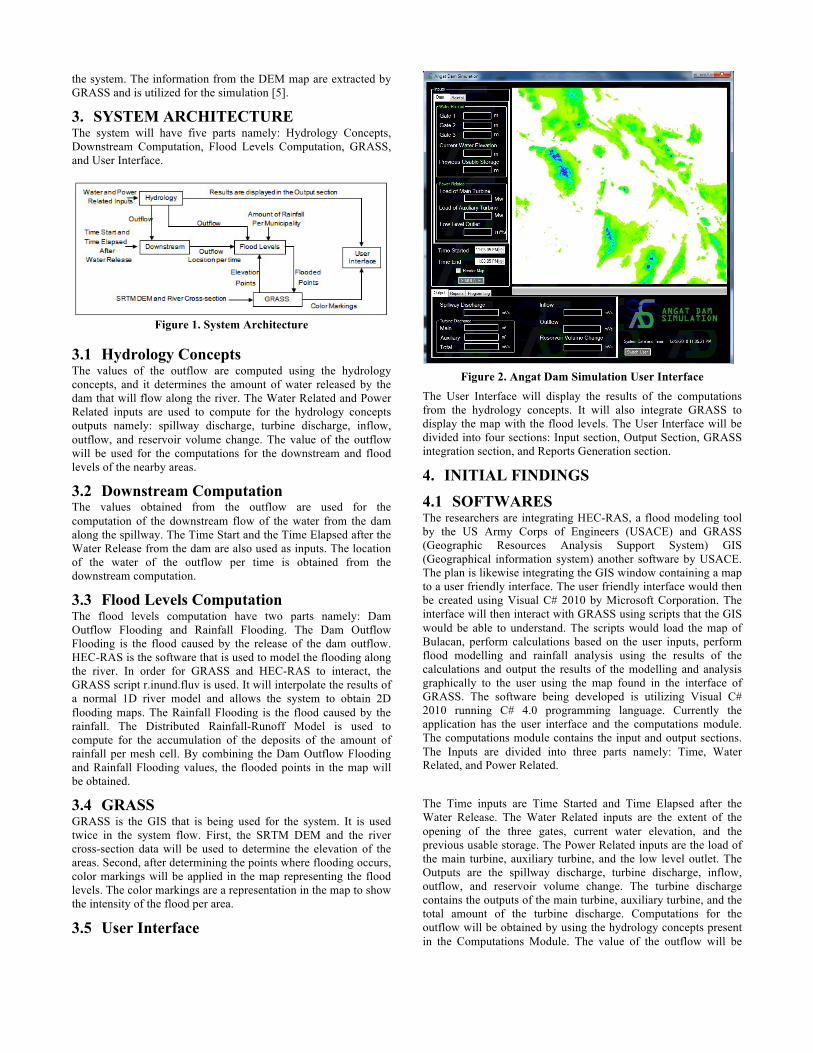
3. SYSTEM ARCHITECTURE The system will have five parts namely: Hydrology Concepts, Downstream Computation, Flood Levels Computation, GRASS, and User Interface.
Figure 1. System Architecture
3.1 Hydrology Concepts The values of the outflow are computed using the hydrology concepts, and it determines the amount of water released by the dam that will flow along the river. The Water Related and Power Related inputs are used to compute for the hydrology concepts outputs namely: spillway discharge, turbine discharge, inflow, outflow, and reservoir volume change. The value of the outflow will be used for the computations for the downstream and flood levels of the nearby areas.
3.2 Downstream Computation The values obtained from the outflow are used for the computation of the downstream flow of the water from the dam along the spillway. The Time Start and the Time Elapsed after the Water Release from the dam are also used as inputs. The location of the water of the outflow per time is obtained from the downstream computation.
3.3 Flood Levels Computation The flood levels computation have two parts namely: Dam Outflow Flooding and Rainfall Flooding. The Dam Outflow Flooding is the flood caused by the release of the dam outflow. HEC-RAS is the software that is used to model the flooding along the river. In order for GRASS and HEC-RAS to interact, the GRASS script r.inund.fluv is used. It will interpolate the results of a normal 1D river model and allows the system to obtain 2D flooding maps. The Rainfall Flooding is the flood caused by the rainfall. The Distributed Rainfall-Runoff Model is used to compute for the accumulation of the deposits of the amount of rainfall per mesh cell. By combining the Dam Outflow Flooding and Rainfall Flooding values, the flooded points in the map will be obtained.
3.4 GRASS GRASS is the GIS that is being used for the system. It is used twice in the system flow. First, the SRTM DEM and the river cross-section data will be used to determine the elevation of the areas. Second, after determining the points where flooding occurs, color markings will be applied in the map representing the flood levels. The color markings are a representation in the map to show the intensity of the flood per area.
3.5 User Interface
Figure 2. Angat Dam Simulation User Interface
The User Interface will display the results of the computations from the hydrology concepts. It will also integrate GRASS to display the map with the flood levels. The User Interface will be divided into four sections: Input section, Output Section, GRASS integration section, and Reports Generation section.
4. INITIAL FINDINGS 4.1 SOFTWARES The researchers are integrating HEC-RAS, a flood modeling tool by the US Army Corps of Engineers (USACE) and GRASS (Geographic Resources Analysis Support System) GIS (Geographical information system) another software by USACE. The plan is likewise integrating the GIS window containing a map to a user friendly interface. The user friendly interface would then be created using Visual C# 2010 by Microsoft Corporation. The interface will then interact with GRASS using scripts that the GIS would be able to understand. The scripts would load the map of Bulacan, perform calculations based on the user inputs, perform flood modelling and rainfall analysis using the results of the calculations and output the results of the modelling and analysis graphically to the user using the map found in the interface of GRASS. The software being developed is utilizing Visual C# 2010 running C# 4.0 programming language. Currently the application has the user interface and the computations module. The computations module contains the input and output sections. The Inputs are divided into three parts namely: Time, Water Related, and Power Related. The Time inputs are Time Started and Time Elapsed after the Water Release. The Water Related inputs are the extent of the opening of the three gates, current water elevation, and the previous usable storage. The Power Related inputs are the load of the main turbine, auxiliary turbine, and the low level outlet. The Outputs are the spillway discharge, turbine discharge, inflow, outflow, and reservoir volume change. The turbine discharge contains the outputs of the main turbine, auxiliary turbine, and the total amount of the turbine discharge. Computations for the outflow will be obtained by using the hydrology concepts present in the Computations Module. The value of the outflow will be
used for the computations for the downstream and flood levels of the nearby areas. The values obtained in the computation for the outflow will be shown in the Output section of the User Interface. The value obtained from the outflow will then be used for the computation of the downstream flow of the water from the dam along the spillway. The Time Start and the Time Elapsed after the Water Release from the dam will be also used as inputs. The Time Start is the instant that the water is released through the gates of the dam. The Time Elapsed after the Water Release from the dam will be used to determine how much water has been displaced from the dam after a given time. The location of the water of the outflow per time will be obtained from the downstream computation. These values will be shown in the Reports section of the User Interface.
4.1.1 HEC-RAS It is the software used for one-dimensional hydraulic calculations developed by the US Department of Defence, Army Corps of Engineers. It has advanced modelling options for floodway computations. HEC-RAS is an open source system. It was made in the Hydrologic Engineering Center hence the name HEC and the system name was originally River analysis system or RAS. It has been recommended for its capability in hydraulic calculations, such as river analysis, for a full network of natural and constructed channels. Specifically our system is going to use the one-dimensional river analysis component for steady flow water surface profile computations. The calculation for the river profiles is going to be used for visualizing the simulation of river channels [1].
4.1.2 GRASS Geographic Resources Analysis Support System is a free Geographic Information System software widely used in academic, commercial, governmental and environmental purposes. GRASS is used for geospatial data management and analysis, image processing, graphics/maps production, spatial modelling and visualization. Grass was originally developed as a tool for land management and environmental planning by the U.S. Army Construction Engineering Research Laboratories (USA-CERL, 1982-1995), a branch under the US Army Corp of Engineers. Today, GRASS is widely used in governmental agencies, academic, commercial, and scientific research. It has been proven to be an efficient tool for data analysis and visualization [2]. With regards to the use of GRASS in the system, since this tool is free, available, powerful and has been widely used in different areas including academic purposes, GRASS will be used in our system as the Geographic Information System (GIS) software. GRASS will be integrated in our system for analysing, interpreting and visualizing all data that will be used in simulation. Among these data are the several types of maps, values from the water outflow computation, rainfall and some other inputs.
4.1.3 Microsoft Visual C# 2010 It is an implementation of the C# specifications by Microsoft. It is included in the Visual Studio family of products and in this case Visual Studio 2010. C# is a multi-paradigm programming language developed by Microsoft in 2001. The language is very similar to Java though Anders Hejlsberg, the creator of C# argues that it was created based on C++. It is currently at version 4.0 which was released on April 12, 2010. The reference compiler of the programming language is Microsoft Visual C# 2010 which is what is being used
by the researchers. The language is being used by the researchers to create scripts for GRASS, generate the user interface and codes for the computations module of the program.
4.2 Algorithms
4.2.1 HEC-RAS - Steady Flow Water Surface Profiles HEC-RAS contains four one-dimensional river analysis components which are: (1) Steady flow water surface profile computations (2) Unsteady flow simulation (3) Movable boundary sediment transport computations (4) Water quality analysis.
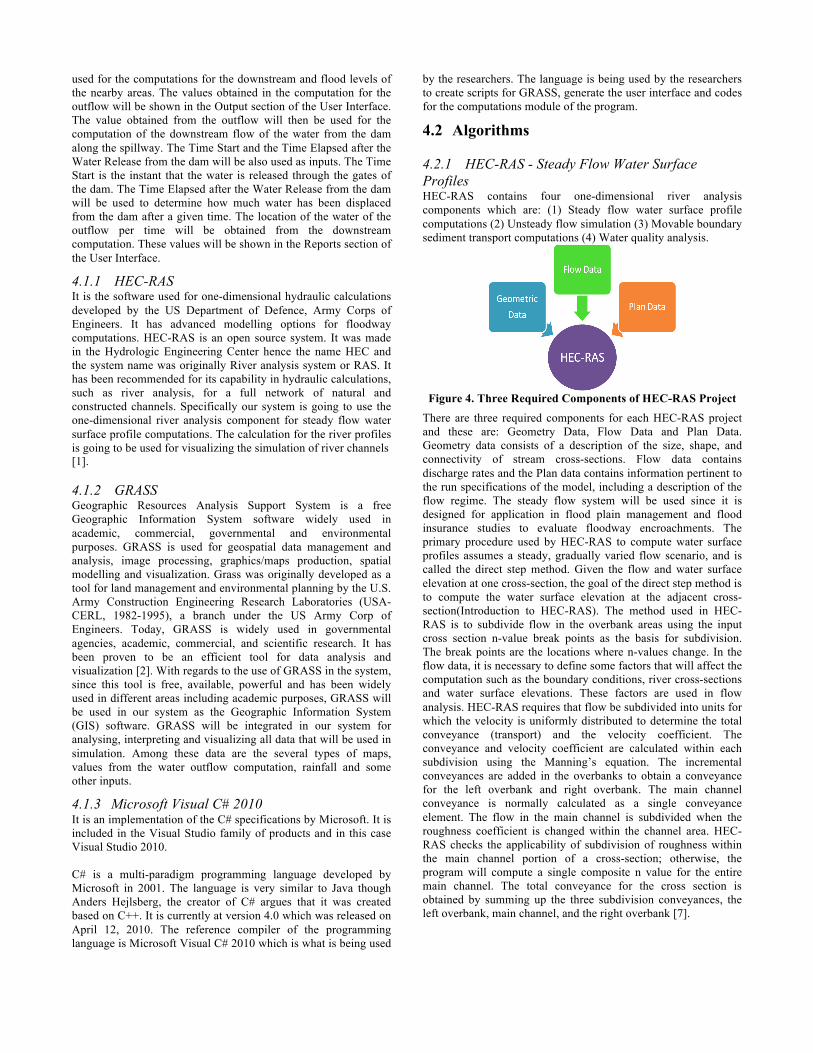
Figure 4. Three Required Components of HEC-RAS Project
There are three required components for each HEC-RAS project and these are: Geometry Data, Flow Data and Plan Data. Geometry data consists of a description of the size, shape, and connectivity of stream cross-sections. Flow data contains discharge rates and the Plan data contains information pertinent to the run specifications of the model, including a description of the flow regime. The steady flow system will be used since it is designed for application in flood plain management and flood insurance studies to evaluate floodway encroachments. The primary procedure used by HEC-RAS to compute water surface profiles assumes a steady, gradually varied flow scenario, and is called the direct step method. Given the flow and water surface elevation at one cross-section, the goal of the direct step method is to compute the water surface elevation at the adjacent cross-section(Introduction to HEC-RAS). The method used in HEC-RAS is to subdivide flow in the overbank areas using the input cross section n-value break points as the basis for subdivision. The break points are the locations where n-values change. In the flow data, it is necessary to define some factors that will affect the computation such as the boundary conditions, river cross-sections and water surface elevations. These factors are used in flow analysis. HEC-RAS requires that flow be subdivided into units for which the velocity is uniformly distributed to determine the total conveyance (transport) and the velocity coefficient. The conveyance and velocity coefficient are calculated within each subdivision using the Manning’s equation. The incremental conveyances are added in the overbanks to obtain a conveyance for the left overbank and right overbank. The main channel conveyance is normally calculated as a single conveyance element. The flow in the main channel is subdivided when the roughness coefficient is changed within the channel area. HEC-RAS checks the applicability of subdivision of roughness within the main channel portion of a cross-section; otherwise, the program will compute a single composite n value for the entire main channel. The total conveyance for the cross section is obtained by summing up the three subdivision conveyances, the left overbank, main channel, and the right overbank [7].
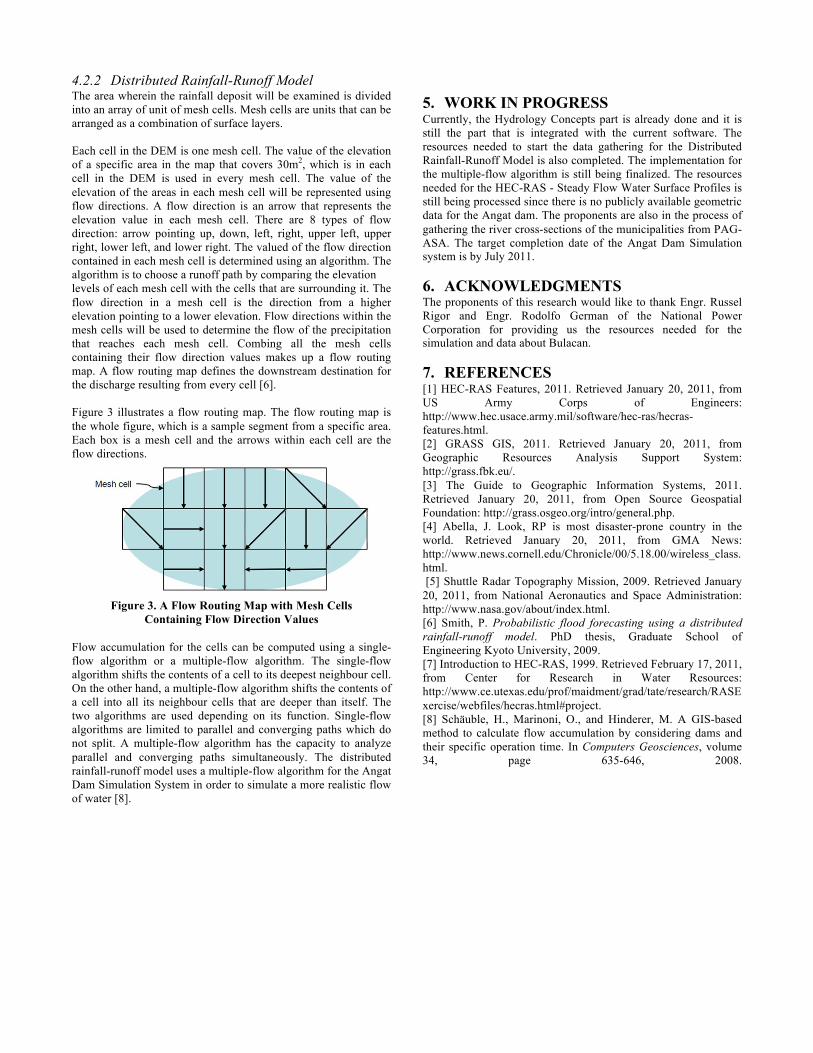
4.2.2 Distributed Rainfall-Runoff Model The area wherein the rainfall deposit will be examined is divided into an array of unit of mesh cells. Mesh cells are units that can be arranged as a combination of surface layers. Each cell in the DEM is one mesh cell. The value of the elevation of a specific area in the map that covers 30m2, which is in each cell in the DEM is used in every mesh cell. The value of the elevation of the areas in each mesh cell will be represented using flow directions. A flow direction is an arrow that represents the elevation value in each mesh cell. There are 8 types of flow direction: arrow pointing up, down, left, right, upper left, upper right, lower left, and lower right. The valued of the flow direction contained in each mesh cell is determined using an algorithm. The algorithm is to choose a runoff path by comparing the elevation levels of each mesh cell with the cells that are surrounding it. The flow direction in a mesh cell is the direction from a higher elevation pointing to a lower elevation. Flow directions within the mesh cells will be used to determine the flow of the precipitation that reaches each mesh cell. Combing all the mesh cells containing their flow direction values makes up a flow routing map. A flow routing map defines the downstream destination for the discharge resulting from every cell [6]. Figure 3 illustrates a flow routing map. The flow routing map is the whole figure, which is a sample segment from a specific area. Each box is a mesh cell and the arrows within each cell are the flow directions.
Figure 3. A Flow Routing Map with Mesh Cells
Containing Flow Direction Values Flow accumulation for the cells can be computed using a single-flow algorithm or a multiple-flow algorithm. The single-flow algorithm shifts the contents of a cell to its deepest neighbour cell. On the other hand, a multiple-flow algorithm shifts the contents of a cell into all its neighbour cells that are deeper than itself. The two algorithms are used depending on its function. Single-flow algorithms are limited to parallel and converging paths which do not split. A multiple-flow algorithm has the capacity to analyze parallel and converging paths simultaneously. The distributed rainfall-runoff model uses a multiple-flow algorithm for the Angat Dam Simulation System in order to simulate a more realistic flow of water [8].
5. WORK IN PROGRESS Currently, the Hydrology Concepts part is already done and it is still the part that is integrated with the current software. The resources needed to start the data gathering for the Distributed Rainfall-Runoff Model is also completed. The implementation for the multiple-flow algorithm is still being finalized. The resources needed for the HEC-RAS - Steady Flow Water Surface Profiles is still being processed since there is no publicly available geometric data for the Angat dam. The proponents are also in the process of gathering the river cross-sections of the municipalities from PAG-ASA. The target completion date of the Angat Dam Simulation system is by July 2011.
6. ACKNOWLEDGMENTS The proponents of this research would like to thank Engr. Russel Rigor and Engr. Rodolfo German of the National Power Corporation for providing us the resources needed for the simulation and data about Bulacan.
7. REFERENCES [1] HEC-RAS Features, 2011. Retrieved January 20, 2011, from US Army Corps of Engineers: http://www.hec.usace.army.mil/software/hec-ras/hecras-features.html. [2] GRASS GIS, 2011. Retrieved January 20, 2011, from Geographic Resources Analysis Support System: http://grass.fbk.eu/. [3] The Guide to Geographic Information Systems, 2011. Retrieved January 20, 2011, from Open Source Geospatial Foundation: http://grass.osgeo.org/intro/general.php. [4] Abella, J. Look, RP is most disaster-prone country in the world. Retrieved January 20, 2011, from GMA News: http://www.news.cornell.edu/Chronicle/00/5.18.00/wireless_class.html. [5] Shuttle Radar Topography Mission, 2009. Retrieved January 20, 2011, from National Aeronautics and Space Administration: http://www.nasa.gov/about/index.html. [6] Smith, P. Probabilistic flood forecasting using a distributed rainfall-runoff model. PhD thesis, Graduate School of Engineering Kyoto University, 2009. [7] Introduction to HEC-RAS, 1999. Retrieved February 17, 2011, from Center for Research in Water Resources: http://www.ce.utexas.edu/prof/maidment/grad/tate/research/RASExercise/webfiles/hecras.html#project. [8] Schäuble, H., Marinoni, O., and Hinderer, M. A GIS-based method to calculate flow accumulation by considering dams and their specific operation time. In Computers Geosciences, volume 34, page 635-646, 2008.