Embed Size (px)
Citation preview
Future of Asia: xxxxx
Climate risk and response in AsiaFuture of Asia: Research preview
August 2020
McKinsey Global Institute
Since its founding in 1990, the McKinsey Global Institute (MGI) has sought to develop a deeper understanding of the evolving global economy. As the business and economics research arm of McKinsey & Company, MGI aims to provide leaders in the commercial, public, and social sectors with the facts and insights on which to base management and policy decisions.
MGI research combines the disciplines of economics and management, employing the analytical tools of economics with the insights of business leaders. Our “micro-to-macro” methodology examines microeconomic industry trends to better understand the broad macroeconomic forces affecting business strategy and public policy. MGI’s in-depth reports have covered more than 20 countries and 30 industries. Current research focuses on six themes: productivity and growth, natural resources, labor markets, the evolution of global financial markets, the economic impact of technology and innovation, and urbanization. Recent reports have assessed the digital economy, the impact of AI and automation on employment, income inequality, the productivity puzzle, the economic benefits of tackling gender inequality, a new era of global competition, Chinese innovation, and digital and financial globalization.
MGI is led by three McKinsey & Company senior partners: James Manyika, Sven Smit, and Jonathan Woetzel. James and Sven also serve as co-chairs of MGI. Michael Chui, Susan Lund, Anu Madgavkar, Jan Mischke, Sree Ramaswamy, Jaana Remes, Jeongmin Seong, and Tilman Tacke are MGI partners, and Mekala Krishnan is an MGI senior fellow.
Project teams are led by the MGI partners and a group of senior fellows and include consultants from McKinsey offices around the world. These teams draw on McKinsey’s global network of partners and industry and management experts. The MGI Council is made up of leaders from McKinsey offices around the world and the firm’s sector practices and includes Michael Birshan, Andrés Cadena, Sandrine Devillard, André Dua, Kweilin Ellingrud, Tarek Elmasry, Katy George, Rajat Gupta, Eric Hazan, Acha Leke, Gary Pinkus, Oliver Tonby, and Eckart Windhagen. The Council members help shape the research agenda, lead high-impact research, and share the findings with decision makers around the world. In addition, leading economists, including Nobel laureates, advise MGI research.
The partners of McKinsey fund MGI’s research; it is not commissioned by any business, government, or other institution. For further information about MGI and to download reports for free, please visit www.mckinsey.com/mgi.
Contents
Preface ii
Climate hazards in Asia to 2050 1
How climate change will affect the “Four Asias” 9
Adaptation and mitigation: Challenges and opportunities in Asia 15
Further reading 17
iThe future of Asia: Climate risk and response in Asia
Preface
1 Dickon Pinner, Matt Rogers, and Hamid Samandari, Addressing climate change in a post-pandemic world, McKinsey & Company, April 7, 2020.
2 Discussion papers and articles in the series are featured on the McKinsey & Company website at mckinsey.com/featured-insights/future-of-asia/overview.
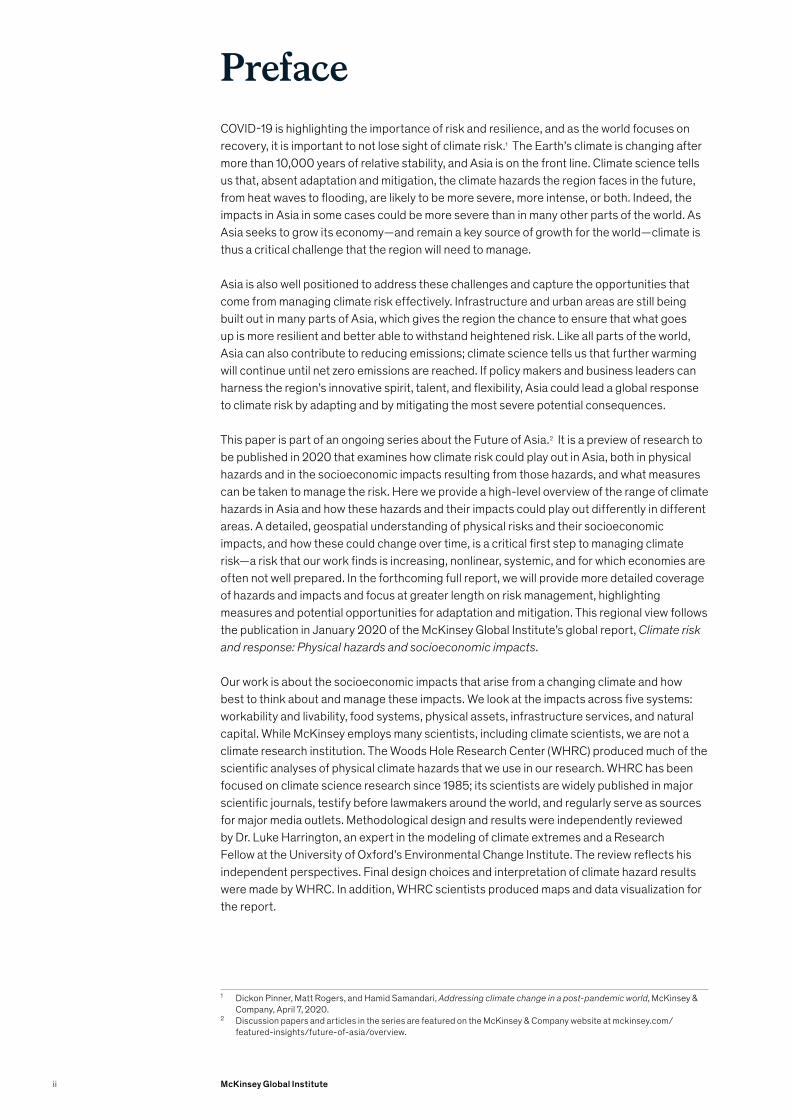
COVID-19 is highlighting the importance of risk and resilience, and as the world focuses on recovery, it is important to not lose sight of climate risk.1 The Earth’s climate is changing after more than 10,000 years of relative stability, and Asia is on the front line. Climate science tells us that, absent adaptation and mitigation, the climate hazards the region faces in the future, from heat waves to flooding, are likely to be more severe, more intense, or both. Indeed, the impacts in Asia in some cases could be more severe than in many other parts of the world. As Asia seeks to grow its economy—and remain a key source of growth for the world—climate is thus a critical challenge that the region will need to manage.
Asia is also well positioned to address these challenges and capture the opportunities that come from managing climate risk effectively. Infrastructure and urban areas are still being built out in many parts of Asia, which gives the region the chance to ensure that what goes up is more resilient and better able to withstand heightened risk. Like all parts of the world, Asia can also contribute to reducing emissions; climate science tells us that further warming will continue until net zero emissions are reached. If policy makers and business leaders can harness the region’s innovative spirit, talent, and flexibility, Asia could lead a global response to climate risk by adapting and by mitigating the most severe potential consequences.
This paper is part of an ongoing series about the Future of Asia.2 It is a preview of research to be published in 2020 that examines how climate risk could play out in Asia, both in physical hazards and in the socioeconomic impacts resulting from those hazards, and what measures can be taken to manage the risk. Here we provide a high-level overview of the range of climate hazards in Asia and how these hazards and their impacts could play out differently in different areas. A detailed, geospatial understanding of physical risks and their socioeconomic impacts, and how these could change over time, is a critical first step to managing climate risk—a risk that our work finds is increasing, nonlinear, systemic, and for which economies are often not well prepared. In the forthcoming full report, we will provide more detailed coverage of hazards and impacts and focus at greater length on risk management, highlighting measures and potential opportunities for adaptation and mitigation. This regional view follows the publication in January 2020 of the McKinsey Global Institute’s global report, Climate risk and response: Physical hazards and socioeconomic impacts.
Our work is about the socioeconomic impacts that arise from a changing climate and how best to think about and manage these impacts. We look at the impacts across five systems: workability and livability, food systems, physical assets, infrastructure services, and natural capital. While McKinsey employs many scientists, including climate scientists, we are not a climate research institution. The Woods Hole Research Center (WHRC) produced much of the scientific analyses of physical climate hazards that we use in our research. WHRC has been focused on climate science research since 1985; its scientists are widely published in major scientific journals, testify before lawmakers around the world, and regularly serve as sources for major media outlets. Methodological design and results were independently reviewed by Dr. Luke Harrington, an expert in the modeling of climate extremes and a Research Fellow at the University of Oxford’s Environmental Change Institute. The review reflects his independent perspectives. Final design choices and interpretation of climate hazard results were made by WHRC. In addition, WHRC scientists produced maps and data visualization for the report.
ii McKinsey Global Institute
Our research focuses on assessing “inherent” risk—that is, risk absent mitigation and adaptation—to understand the magnitude of the risk and the response needed. Separately, we assess a potential adaptation and mitigation response to manage the risk. We look at two time periods: between now and 2030, and from 2030 to 2050. Climate science makes extensive use of scenarios ranging from lower (Representative Concentration Pathway 2.6) to higher (RCP 8.5) CO2 concentrations. We have chosen to focus on RCP 8.5 for our analysis, because the higher-emission scenario it portrays enables us to assess the full inherent physical risk of climate change in the absence of further decarbonization.3
3 For a full discussion of our choice of RCP 8.5 and details of our methodology, see the technical appendix of our global report, Climate risk and response: Physical hazards and socioeconomic impacts, McKinsey Global Institute, January 2020. See also Christopher R. Schwalm, Spencer Glendon, and Philip B. Duffy, “RCP 8.5 tracks cumulative CO2 emissions,” Proceedings of the National Academy of Sciences, August 2020.
iiiThe future of Asia: Climate risk and response in Asia

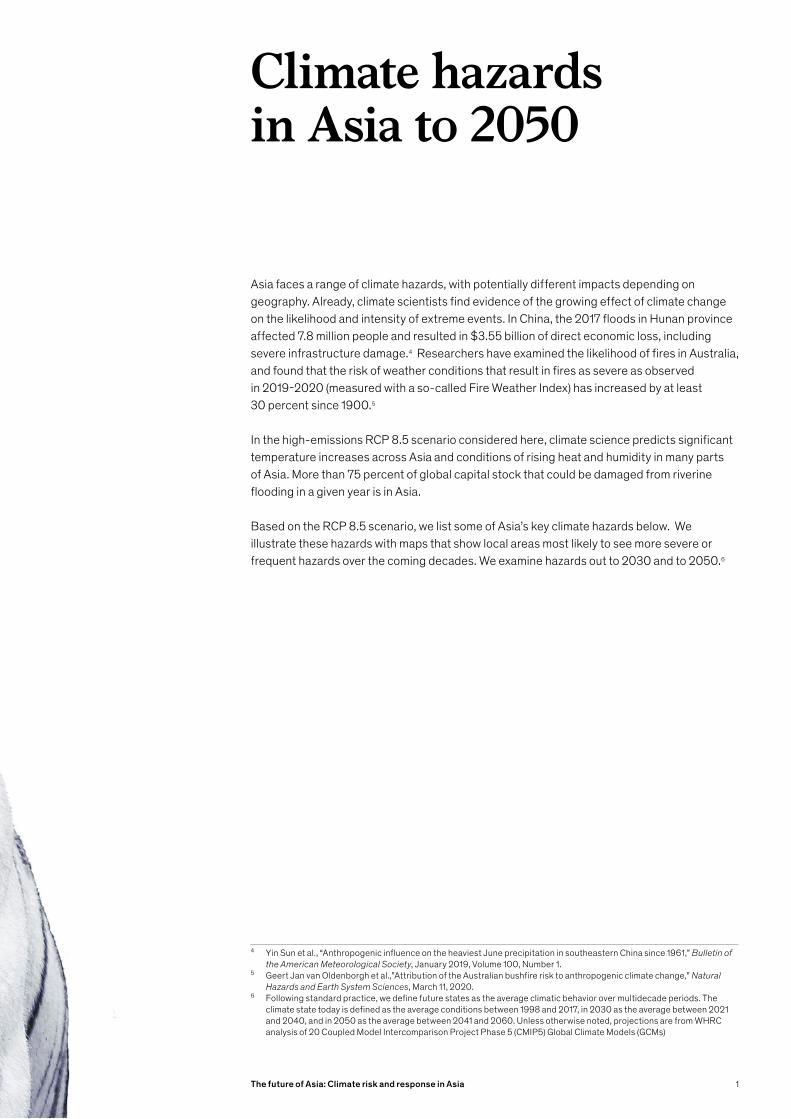
Asia faces a range of climate hazards, with potentially different impacts depending on geography. Already, climate scientists find evidence of the growing effect of climate change on the likelihood and intensity of extreme events. In China, the 2017 floods in Hunan province affected 7.8 million people and resulted in $3.55 billion of direct economic loss, including severe infrastructure damage.4 Researchers have examined the likelihood of fires in Australia, and found that the risk of weather conditions that result in fires as severe as observed in 2019-2020 (measured with a so-called Fire Weather Index) has increased by at least 30 percent since 1900.5
In the high-emissions RCP 8.5 scenario considered here, climate science predicts significant temperature increases across Asia and conditions of rising heat and humidity in many parts of Asia. More than 75 percent of global capital stock that could be damaged from riverine flooding in a given year is in Asia.
Based on the RCP 8.5 scenario, we list some of Asia’s key climate hazards below. We illustrate these hazards with maps that show local areas most likely to see more severe or frequent hazards over the coming decades. We examine hazards out to 2030 and to 2050.6
4 Yin Sun et al., “Anthropogenic influence on the heaviest June precipitation in southeastern China since 1961,” Bulletin of the American Meteorological Society, January 2019, Volume 100, Number 1.
5 Geert Jan van Oldenborgh et al.,”Attribution of the Australian bushfire risk to anthropogenic climate change,” Natural Hazards and Earth System Sciences, March 11, 2020.
6 Following standard practice, we define future states as the average climatic behavior over multidecade periods. The climate state today is defined as the average conditions between 1998 and 2017, in 2030 as the average between 2021 and 2040, and in 2050 as the average between 2041 and 2060. Unless otherwise noted, projections are from WHRC analysis of 20 Coupled Model Intercomparison Project Phase 5 (CMIP5) Global Climate Models (GCMs)
Climate hazards in Asia to 2050
1The future of Asia: Climate risk and response in Asia
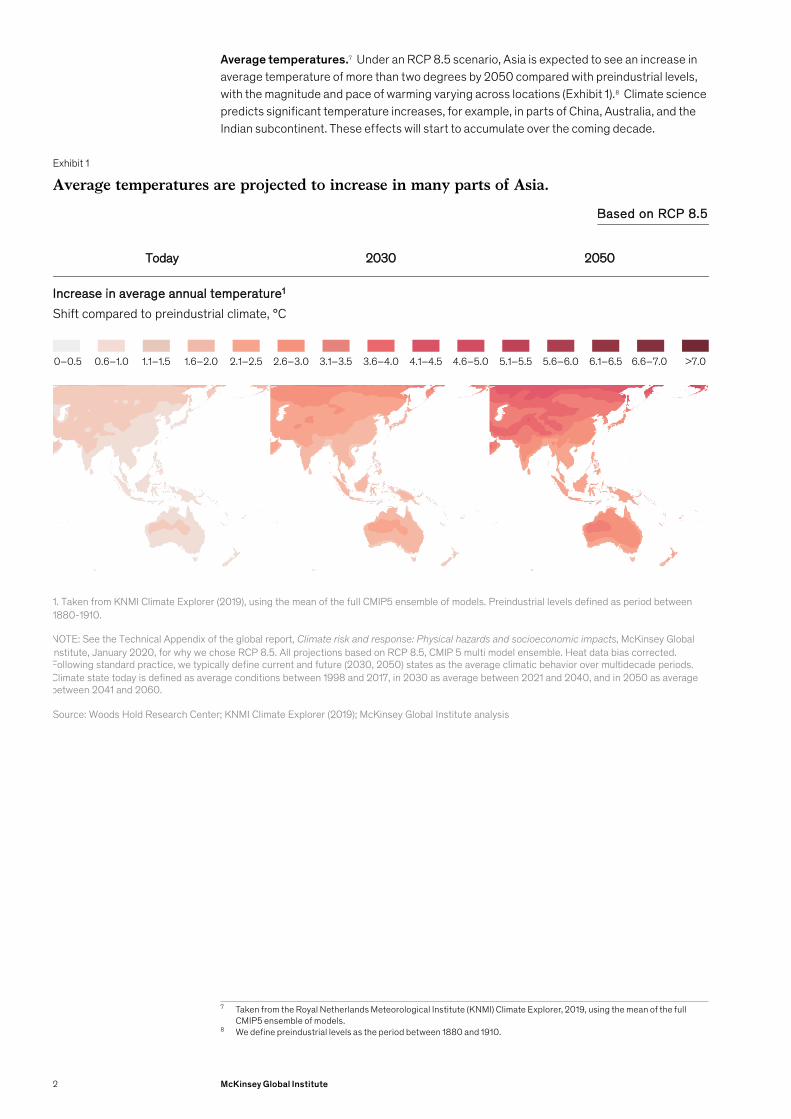
Average temperatures.7 Under an RCP 8.5 scenario, Asia is expected to see an increase in average temperature of more than two degrees by 2050 compared with preindustrial levels, with the magnitude and pace of warming varying across locations (Exhibit 1).8 Climate science predicts significant temperature increases, for example, in parts of China, Australia, and the Indian subcontinent. These effects will start to accumulate over the coming decade.
7 Taken from the Royal Netherlands Meteorological Institute (KNMI) Climate Explorer, 2019, using the mean of the full CMIP5 ensemble of models.
8 We define preindustrial levels as the period between 1880 and 1910.
Exhibit 1
1
Source: Woods Hold Research Center; KNMI Climate Explorer (2019); McKinsey Global Institute analysis
NOTE: See the Technical Appendix of the global report, Climate risk and response: Physical hazards and socioeconomic impacts, McKinsey Global Institute, January 2020, for why we chose RCP 8.5. All projections based on RCP 8.5, CMIP 5 multi model ensemble. Heat data bias corrected. Following standard practice, we typically define current and future (2030, 2050) states as the average climatic behavior over multidecade periods. Climate state today is defined as average conditions between 1998 and 2017, in 2030 as average between 2021 and 2040, and in 2050 as average between 2041 and 2060.
Average temperatures are projected to increase in many parts of Asia.
TTooddaayy 22003300 22005500
IInnccrreeaassee iinn aavveerraaggee aannnnuuaall tteemmppeerraattuurree11
Shift compared to preindustrial climate, °C
0–0.5 0.6–1.0 1.1–1.5 1.6–2.0 2.1–2.5 2.6–3.0 3.1–3.5 3.6–4.0 4.1–4.5 4.6–5.0 5.1–5.5 5.6–6.0 6.1–6.5 6.6–7.0 >7.0
1. Taken from KNMI Climate Explorer (2019), using the mean of the full CMIP5 ensemble of models. Preindustrial levels defined as period between 1880-1910.
BBaasseedd oonn RRCCPP 88..55
2 McKinsey Global Institute
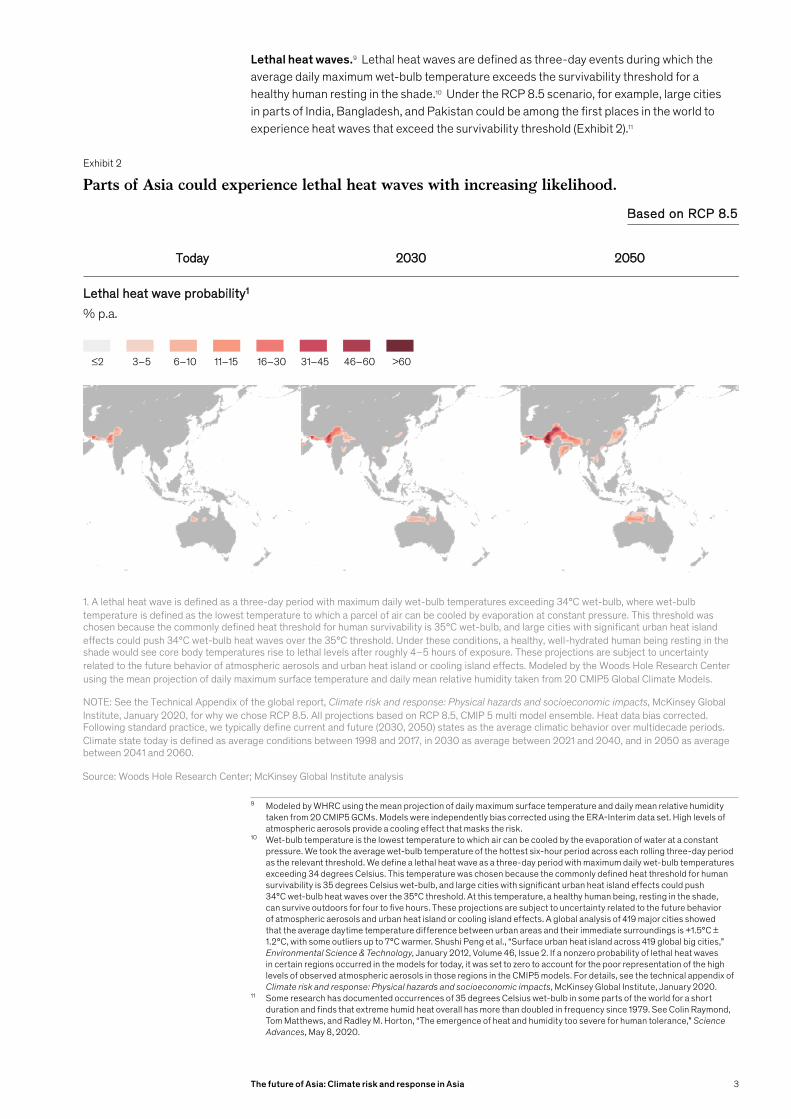
Lethal heat waves.9 Lethal heat waves are defined as three-day events during which the average daily maximum wet-bulb temperature exceeds the survivability threshold for a healthy human resting in the shade.10 Under the RCP 8.5 scenario, for example, large cities in parts of India, Bangladesh, and Pakistan could be among the first places in the world to experience heat waves that exceed the survivability threshold (Exhibit 2).11
9 Modeled by WHRC using the mean projection of daily maximum surface temperature and daily mean relative humidity taken from 20 CMIP5 GCMs. Models were independently bias corrected using the ERA-Interim data set. High levels of atmospheric aerosols provide a cooling effect that masks the risk.
10 Wet-bulb temperature is the lowest temperature to which air can be cooled by the evaporation of water at a constant pressure. We took the average wet-bulb temperature of the hottest six-hour period across each rolling three-day period as the relevant threshold. We define a lethal heat wave as a three-day period with maximum daily wet-bulb temperatures exceeding 34 degrees Celsius. This temperature was chosen because the commonly defined heat threshold for human survivability is 35 degrees Celsius wet-bulb, and large cities with significant urban heat island effects could push 34°C wet-bulb heat waves over the 35°C threshold. At this temperature, a healthy human being, resting in the shade, can survive outdoors for four to five hours. These projections are subject to uncertainty related to the future behavior of atmospheric aerosols and urban heat island or cooling island effects. A global analysis of 419 major cities showed that the average daytime temperature difference between urban areas and their immediate surroundings is +1.5°C ± 1.2°C, with some outliers up to 7°C warmer. Shushi Peng et al., “Surface urban heat island across 419 global big cities,” Environmental Science & Technology, January 2012, Volume 46, Issue 2. If a nonzero probability of lethal heat waves in certain regions occurred in the models for today, it was set to zero to account for the poor representation of the high levels of observed atmospheric aerosols in those regions in the CMIP5 models. For details, see the technical appendix of Climate risk and response: Physical hazards and socioeconomic impacts, McKinsey Global Institute, January 2020.
11 Some research has documented occurrences of 35 degrees Celsius wet-bulb in some parts of the world for a short duration and finds that extreme humid heat overall has more than doubled in frequency since 1979. See Colin Raymond, Tom Matthews, and Radley M. Horton, “The emergence of heat and humidity too severe for human tolerance,” Science Advances, May 8, 2020.
Exhibit 2
2
NOTE: See the Technical Appendix of the global report, Climate risk and response: Physical hazards and socioeconomic impacts, McKinsey Global Institute, January 2020, for why we chose RCP 8.5. All projections based on RCP 8.5, CMIP 5 multi model ensemble. Heat data bias corrected. Following standard practice, we typically define current and future (2030, 2050) states as the average climatic behavior over multidecade periods. Climate state today is defined as average conditions between 1998 and 2017, in 2030 as average between 2021 and 2040, and in 2050 as average between 2041 and 2060.
Source: Woods Hole Research Center; McKinsey Global Institute analysis
Parts of Asia could experience lethal heat waves with increasing likelihood.
TTooddaayy 22003300 22005500
LLeetthhaall hheeaatt wwaavvee pprroobbaabbiilliittyy11
% p.a.
≤2 3–5 6–10 11–15 16–30 31–45 46–60 >60
1. A lethal heat wave is defined as a three-day period with maximum daily wet-bulb temperatures exceeding 34°C wet-bulb, where wet-bulb temperature is defined as the lowest temperature to which a parcel of air can be cooled by evaporation at constant pressure. This threshold was chosen because the commonly defined heat threshold for human survivability is 35°C wet-bulb, and large cities with significant urban heat island effects could push 34°C wet-bulb heat waves over the 35°C threshold. Under these conditions, a healthy, well-hydrated human being resting in the shade would see core body temperatures rise to lethal levels after roughly 4–5 hours of exposure. These projections are subject to uncertainty related to the future behavior of atmospheric aerosols and urban heat island or cooling island effects. Modeled by the Woods Hole Research Center using the mean projection of daily maximum surface temperature and daily mean relative humidity taken from 20 CMIP5 Global Climate Models.
BBaasseedd oonn RRCCPP 88..55
3The future of Asia: Climate risk and response in Asia
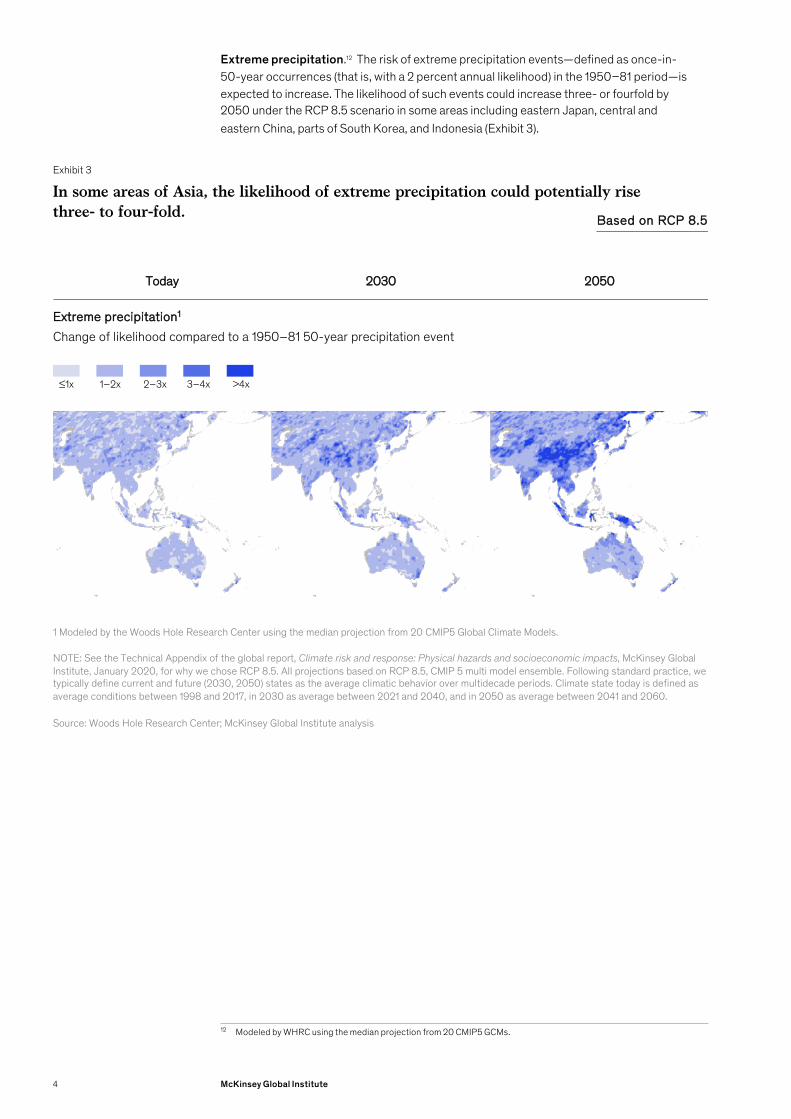
Extreme precipitation.12 The risk of extreme precipitation events—defined as once-in-50-year occurrences (that is, with a 2 percent annual likelihood) in the 1950–81 period—is expected to increase. The likelihood of such events could increase three- or fourfold by 2050 under the RCP 8.5 scenario in some areas including eastern Japan, central and eastern China, parts of South Korea, and Indonesia (Exhibit 3).
12 Modeled by WHRC using the median projection from 20 CMIP5 GCMs.
Exhibit 3
3
Source: Woods Hole Research Center; McKinsey Global Institute analysis
NOTE: See the Technical Appendix of the global report, Climate risk and response: Physical hazards and socioeconomic impacts, McKinsey Global Institute, January 2020, for why we chose RCP 8.5. All projections based on RCP 8.5, CMIP 5 multi model ensemble. Following standard practice, we typically define current and future (2030, 2050) states as the average climatic behavior over multidecade periods. Climate state today is defined as average conditions between 1998 and 2017, in 2030 as average between 2021 and 2040, and in 2050 as average between 2041 and 2060.
In some areas of Asia, the likelihood of extreme precipitation could potentially rise three- to four-fold.
TTooddaayy 22003300 22005500
EExxttrreemmee pprreecciippiittaattiioonn11
Change of likelihood compared to a 1950–81 50-year precipitation event
≤1x 1–2x 2–3x 3–4x >4x
1 Modeled by the Woods Hole Research Center using the median projection from 20 CMIP5 Global Climate Models.
BBaasseedd oonn RRCCPP 88..55
4 McKinsey Global Institute
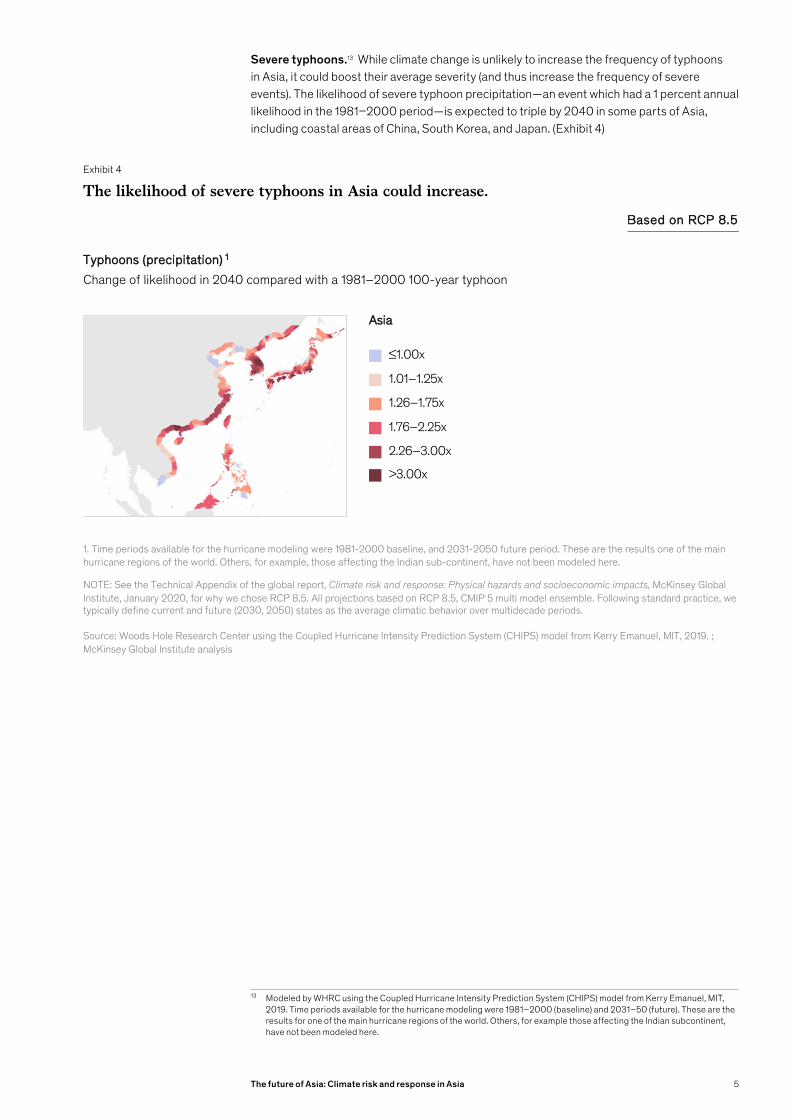
Severe typhoons.13 While climate change is unlikely to increase the frequency of typhoons in Asia, it could boost their average severity (and thus increase the frequency of severe events). The likelihood of severe typhoon precipitation—an event which had a 1 percent annual likelihood in the 1981–2000 period—is expected to triple by 2040 in some parts of Asia, including coastal areas of China, South Korea, and Japan. (Exhibit 4)
13 Modeled by WHRC using the Coupled Hurricane Intensity Prediction System (CHIPS) model from Kerry Emanuel, MIT, 2019. Time periods available for the hurricane modeling were 1981–2000 (baseline) and 2031–50 (future). These are the results for one of the main hurricane regions of the world. Others, for example those affecting the Indian subcontinent, have not been modeled here.
Exhibit 4
4
NOTE: See the Technical Appendix of the global report, Climate risk and response: Physical hazards and socioeconomic impacts, McKinsey Global Institute, January 2020, for why we chose RCP 8.5. All projections based on RCP 8.5, CMIP 5 multi model ensemble. Following standard practice, we typically define current and future (2030, 2050) states as the average climatic behavior over multidecade periods.
Source: Woods Hole Research Center using the Coupled Hurricane Intensity Prediction System (CHIPS) model from Kerry Emanuel, MIT, 2019. ; McKinsey Global Institute analysis
The likelihood of severe typhoons in Asia could increase.
AAssiiaa
≤1.00x
1.01–1.25x
1.26–1.75x
1.76–2.25x
2.26–3.00x
>3.00x
TTyypphhoooonnss ((pprreecciippiittaattiioonn)) 11
Change of likelihood in 2040 compared with a 1981–2000 100-year typhoon
1. Time periods available for the hurricane modeling were 1981-2000 baseline, and 2031-2050 future period. These are the results one of the main hurricane regions of the world. Others, for example, those affecting the Indian sub-continent, have not been modeled here.
BBaasseedd oonn RRCCPP 88..55
5The future of Asia: Climate risk and response in Asia
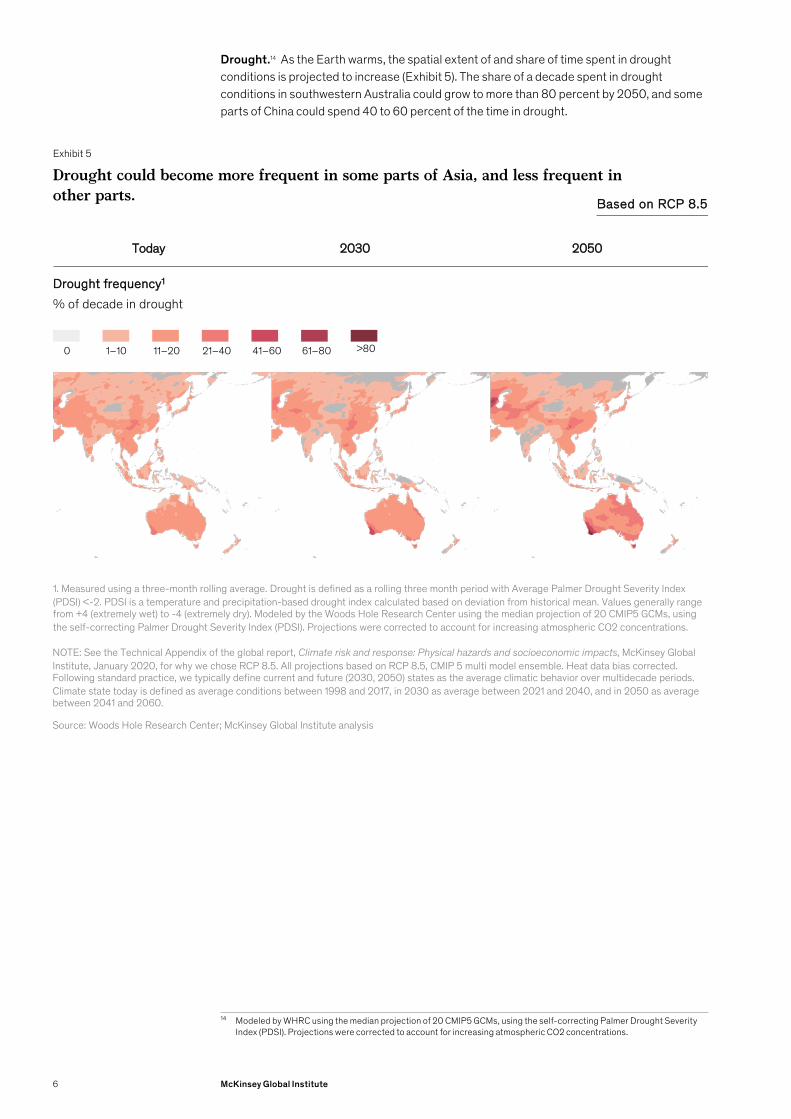
Drought.14 As the Earth warms, the spatial extent of and share of time spent in drought conditions is projected to increase (Exhibit 5). The share of a decade spent in drought conditions in southwestern Australia could grow to more than 80 percent by 2050, and some parts of China could spend 40 to 60 percent of the time in drought.
14 Modeled by WHRC using the median projection of 20 CMIP5 GCMs, using the self-correcting Palmer Drought Severity Index (PDSI). Projections were corrected to account for increasing atmospheric CO2 concentrations.
Exhibit 5
5
NOTE: See the Technical Appendix of the global report, Climate risk and response: Physical hazards and socioeconomic impacts, McKinsey Global Institute, January 2020, for why we chose RCP 8.5. All projections based on RCP 8.5, CMIP 5 multi model ensemble. Heat data bias corrected. Following standard practice, we typically define current and future (2030, 2050) states as the average climatic behavior over multidecade periods. Climate state today is defined as average conditions between 1998 and 2017, in 2030 as average between 2021 and 2040, and in 2050 as average between 2041 and 2060.
Source: Woods Hole Research Center; McKinsey Global Institute analysis
Drought could become more frequent in some parts of Asia, and less frequent in other parts.
TTooddaayy 22003300 22005500
DDrroouugghhtt ffrreeqquueennccyy11
% of decade in drought
0 1–10 11–20 21–40 41–60 61–80 >80
1. Measured using a three-month rolling average. Drought is defined as a rolling three month period with Average Palmer Drought Severity Index (PDSI) <-2. PDSI is a temperature and precipitation-based drought index calculated based on deviation from historical mean. Values generally range from +4 (extremely wet) to -4 (extremely dry). Modeled by the Woods Hole Research Center using the median projection of 20 CMIP5 GCMs, using the self-correcting Palmer Drought Severity Index (PDSI). Projections were corrected to account for increasing atmospheric CO2 concentrations.
BBaasseedd oonn RRCCPP 88..55
6 McKinsey Global Institute
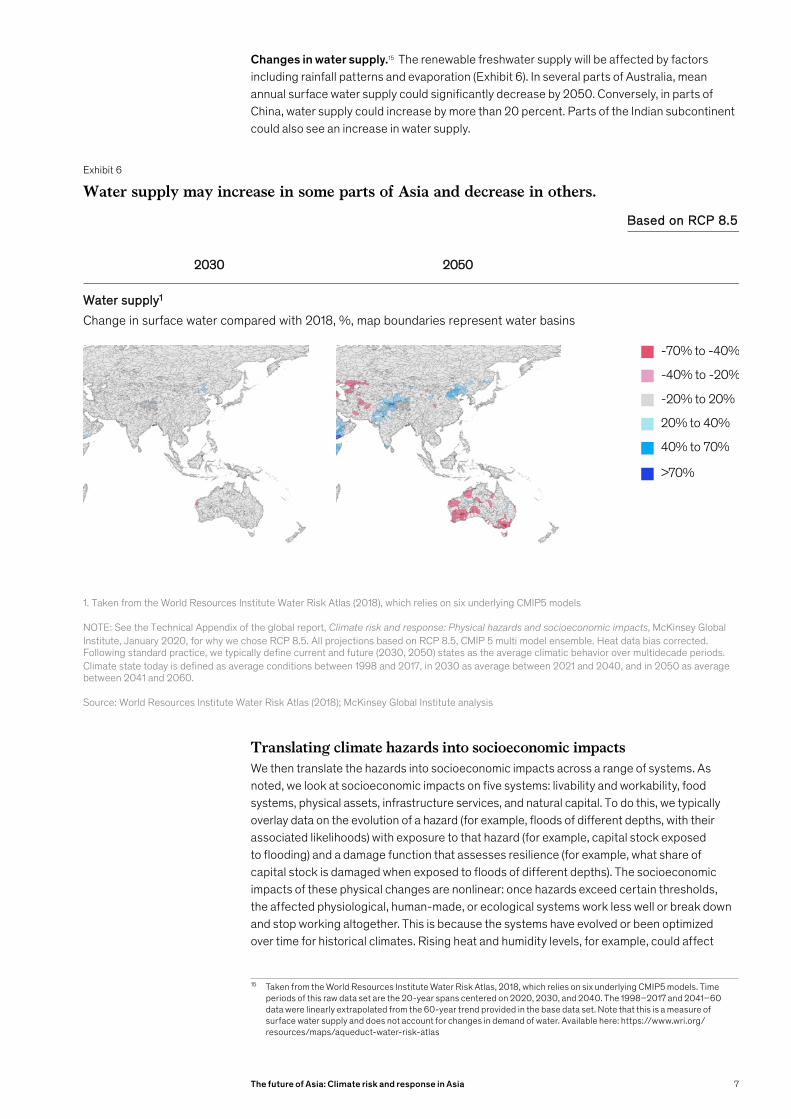
Changes in water supply.15 The renewable freshwater supply will be affected by factors including rainfall patterns and evaporation (Exhibit 6). In several parts of Australia, mean annual surface water supply could significantly decrease by 2050. Conversely, in parts of China, water supply could increase by more than 20 percent. Parts of the Indian subcontinent could also see an increase in water supply.
Translating climate hazards into socioeconomic impactsWe then translate the hazards into socioeconomic impacts across a range of systems. As noted, we look at socioeconomic impacts on five systems: livability and workability, food systems, physical assets, infrastructure services, and natural capital. To do this, we typically overlay data on the evolution of a hazard (for example, floods of different depths, with their associated likelihoods) with exposure to that hazard (for example, capital stock exposed to flooding) and a damage function that assesses resilience (for example, what share of capital stock is damaged when exposed to floods of different depths). The socioeconomic impacts of these physical changes are nonlinear: once hazards exceed certain thresholds, the affected physiological, human-made, or ecological systems work less well or break down and stop working altogether. This is because the systems have evolved or been optimized over time for historical climates. Rising heat and humidity levels, for example, could affect
15 Taken from the World Resources Institute Water Risk Atlas, 2018, which relies on six underlying CMIP5 models. Time periods of this raw data set are the 20-year spans centered on 2020, 2030, and 2040. The 1998–2017 and 2041–60 data were linearly extrapolated from the 60-year trend provided in the base data set. Note that this is a measure of surface water supply and does not account for changes in demand of water. Available here: https://www.wri.org/resources/maps/aqueduct-water-risk-atlas
Exhibit 6
6
-70% to -40%
-40% to -20%
-20% to 20%
20% to 40%
40% to 70%
>70%
NOTE: See the Technical Appendix of the global report, Climate risk and response: Physical hazards and socioeconomic impacts, McKinsey Global Institute, January 2020, for why we chose RCP 8.5. All projections based on RCP 8.5, CMIP 5 multi model ensemble. Heat data bias corrected. Following standard practice, we typically define current and future (2030, 2050) states as the average climatic behavior over multidecade periods. Climate state today is defined as average conditions between 1998 and 2017, in 2030 as average between 2021 and 2040, and in 2050 as average between 2041 and 2060.
Source: World Resources Institute Water Risk Atlas (2018); McKinsey Global Institute analysis
Water supply may increase in some parts of Asia and decrease in others.
22003300 22005500
WWaatteerr ssuuppppllyy11
Change in surface water compared with 2018, %, map boundaries represent water basins
1. Taken from the World Resources Institute Water Risk Atlas (2018), which relies on six underlying CMIP5 models
BBaasseedd oonn RRCCPP 88..55
7The future of Asia: Climate risk and response in Asia
the human body’s ability to work outdoors and also the survivability of healthy human beings, as discussed above. The knock-on effects can be systemic, because direct impacts in a particular geography could spread and have cascading impacts. In Ho Chi Minh City, where direct infrastructure damage from a 100-year flood could be between $500 million and $1 billion by 2050, knock-on costs could be between $1.5 billion and $8.5 billion.16
Our analysis finds that the socioeconomic impacts from intensifying climate hazards could in many cases be more severe for Asia than for other parts of the world, in the absence of adaptation and mitigation.17 Under RCP 8.5, by 2050, between 600 million and one billion people in Asia will be living in areas with a nonzero annual probability of lethal heat waves. That compares with a global total of 700 million to 1.2 billion; in other words, a substantial majority of these people are in Asia. By 2050, on average, between $2.8 trillion and $4.7 trillion of GDP in Asia annually will be at risk from a loss of outdoor working hours because of increased heat and humidity; that accounts for more than two-thirds of the total annual global GDP impact. Finally, about $1.2 trillion in capital stock in Asia could be damaged by riverine flooding in a given year by 2050, equivalent to about 75 percent of the global impact.
16 Jonathan Woetzel, Dickon Pinner, Hamid Samandari, Hauke Engel, Mekala Krishnan, Brodie Boland, and Peter Cooper, Can coastal cities turn the tide on rising flood risk?, McKinsey & Company, April 20, 2020.
17 For our analysis in this report, we look at 16 countries that account collectively for around 95 percent of Asia’s population and GDP. They are: Australia, Bangladesh, Cambodia, China, India, Indonesia, Japan, Laos, Malaysia, Myanmar. New Zealand, Pakistan, Philippines, South Korea, Thailand, and Vietnam. Collectively, these 16 countries make up 54 percent of global population and one-third of global GDP.
8 McKinsey Global Institute
We examine the impacts of climate change on 16 countries in Asia. For each of the countries, we consider the direct effects of rising hazards on livability and workability, food systems, physical assets, infrastructure services, and natural capital. For each of these, we derive an indicator or indicators that serve to illustrate exposure to climate hazards and proximity to physical resilience thresholds. The indicators include the following:18
— Share of population living in areas experiencing a nonzero annual probability of lethal heat waves (a measure of impact on livability and workability)
— Annual share of effective outdoor working hours affected by extreme heat and humidity in climate-exposed regions (a measure of impact on livability and workability). Linked with this, we also measured the GDP at risk from working hours affected by heat and humidity
— Water stress, measured as the annual demand of water as a share of the annual supply of water (a measure of impact on livability and workability)19
— Annual share of capital stock at risk of riverine flood (a measure of impact on physical assets and infrastructure)20
— Annual probability of a change in agricultural yields for four major crops (a measure of impact on food systems)21
— Share of land surface changing climate classification, referred to as “biome shift” (a measure of impact on natural capital)22
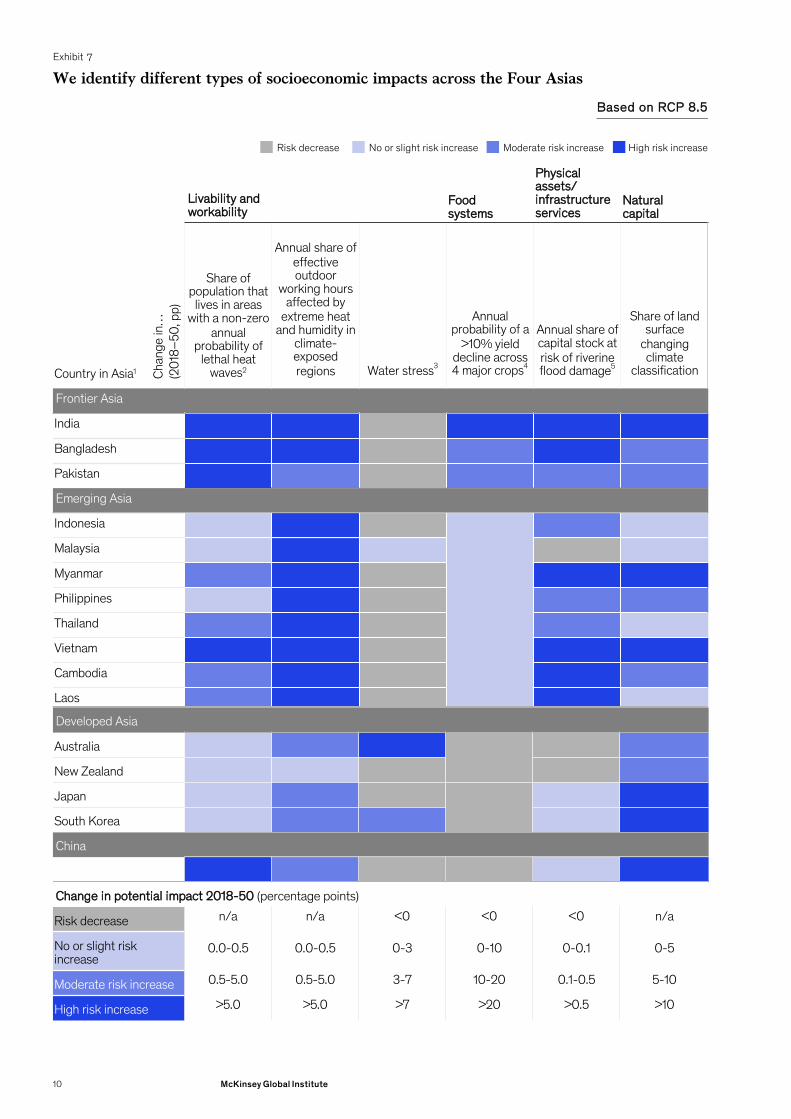
Applying these indicators, we find that all 16 countries may see an increase in potential direct impacts from climate change for at least one indicator by 2050 (Exhibit 7). Twelve countries may see an increase in three or more indicators by 2050. Most countries are expected to see rising impact on the annual share of effective outdoor working hours affected by extreme heat and humidity in climate-exposed regions, the annual share of capital stock at risk of flood damage, and the share of land surface changing climate classification. We categorize each of the 16 countries in the “Four Asias” framework that we have identified in our previous Future
18 See Box 2 and the technical appendix of the global report for further details on the indicators and sizing methodology. Climate risk and response: Physical hazards, socioeconomic impacts, McKinsey Global Institute, January 2020.
19 Water stress is measured as annual demand of water as a share of annual supply of water. For this analysis, we assume that the demand for water stays constant over time, to allow us to measure the impact of climate change alone, and not the impacts of increased population and GDP growth. Water stress projections for arid, low-precipitation regions were excluded due to concerns about projection robustness.
20 For estimation of capital stock at risk of riverine flooding we used a country level Urban Damage risk indicator from WRI Aqueduct Flood Analyzer 2019 under a business-as-usual scenario (RCP 8.5, SSP 2) and existing levels of flood protection.
21 Rice, corn, soy, and wheat; distribution of agricultural yields modeled by WHRC using the median of nitrogen limited crop models from the AgMIP ensemble.
22 The biome refers to the naturally occurring community of flora and fauna inhabiting a particular region. We have used changes in the Köppen Climate Classification System as an indicative proxy for shifts in biome.
How climate change will affect the “Four Asias”
LLiivvaabbiilliittyy aanndd wwoorrkkaabbiilliittyy
FFoooodd ssyysstteemmss
PPhhyyssiiccaall aasssseettss// iinnffrraassttrruuccttuurree sseerrvviicceess
NNaattuurraall ccaappiittaall
Country in Asia1
Share of population that lives in areas
with a non-zero annual
probability of lethal heat
waves2
Annual share of effective outdoor
working hours affected by
extreme heat and humidity in
climate-exposed regions Water stress3
Annual probability of a
>10% yielddecline across 4 major crops4
Annual share of capital stock at risk of riverine flood damage5
Share of land surface
changing climate
classification
Frontier Asia
India
Bangladesh
Pakistan
Emerging Asia
Indonesia
Malaysia
Myanmar
Philippines
Thailand
Vietnam
Cambodia
Laos
Chan
ge in
…
(201
8–50
, pp)
Risk decrease No or slight risk increase Moderate risk increase High risk increase
Developed Asia
Australia
New Zealand
Japan
South Korea
China
CChhaannggee iinn ppootteennttiiaall iimmppaacctt 22001188--5500 (percentage points)
Risk decrease n/a n/a <0 <0 <0 n/a
No or slight risk increase
0.0-0.5 0.0-0.5 0-3 0-10 0-0.1 0-5
Moderate risk increase 0.5-5.0 0.5-5.0 3-7 10-20 0.1-0.5 5-10
High risk increase >5.0 >5.0 >7 >20 >0.5 >10
BBaasseedd oonn RRCCPP 88..55
Exhibit 7
We identify different types of socioeconomic impacts across the Four Asias
10 McKinsey Global Institute
Exhibit 10
1. For our analysis in this report, we look at 16 countries that account collectively for around 95 percent of Asia’s population and GDP. They are:Australia, Bangladesh, Cambodia, China, India, Indonesia, Japan, Laos, Malaysia, Myanmar. New Zealand, Pakistan, Philippines, South Korea, Thailand, and Vietnam. Collectively, these 16 countries make up 54% of global population and one-third of global GDP. 2. We define a lethal heat wave as a 3-day period with maximum daily wet-bulb temperatures exceeding 34°C wet-bulb. This threshold was chosen because the commonly defined heat threshold for human survivability is 35°C wet-bulb, and large cities with significant urban heat island effects could push 34°C wet-bulb heat waves over the 35°C threshold. These projections are subject to uncertainty related to the future behavior of atmospheric aerosols and urban heat island or cooling island effects.3. Water stress is measured as annual demand of water as a share of annual supply of water. For this analysis, we assume that the demand for water stays constant over time, to allow us to measure the impact of climate change alone. Water stress projections for arid, low-precipitation regions wereexcluded due to concerns about projection robustness.4. Rice, corn, soy, and wheat; distribution of agricultural yields modeled by WHRC using the median of nitrogen limited crop models from the AgMIPensemble. Note that this analysis focuses only on likelihood of yield declines (vs. yield increases) since it is focused on the risks from climate change.See the text of the report for a discussion on potential benefits. Countries were grouped for some of the analyses to ensure modeling robustness.5. For estimation of capital stock at risk of riverine flooding we used a country level Urban Damage risk indicator from WRI Aqueduct Flood Analyzer 2019 under Business as usual scenario (RCP 8.5, SSP 2) and existing levels of flood protection. Risk values are calculated based on “expected values”, i.e., probability-weighted value at risk.
NOTE: See the Technical Appendix of the global report, Climate risk and response: Physical hazards and socioeconomic impacts, McKinsey Global Institute, January 2020, for why we chose RCP 8.5. Heat data bias corrected. Following standard practice, we define current and future (2050) states as the average climatic behavior over multidecade periods. Climate state today is defined as average conditions between 1998 and 2017, and in 2050 as average between 2041 and 2060.
Source: Woods Hole Research Center; World Resources Institute Water Risk Atlas, 2018; World Resources Institute Aqueduct Global Flood Analyzer, 2019; Rubel and Kottek, 2010; McKinsey Global Institute analysis
The research underscores the regressive nature of climate risk; the poor will be hit hardest. While different parts of Asia are affected differently, countries with lower levels of per capita GDP are probably most at risk from the impacts of climate change.
11The future of Asia: Climate risk and response in Asia
of Asia work.23 While impacts vary across as well as within countries, we broadly find that these factors will play out differently across the Four Asias.
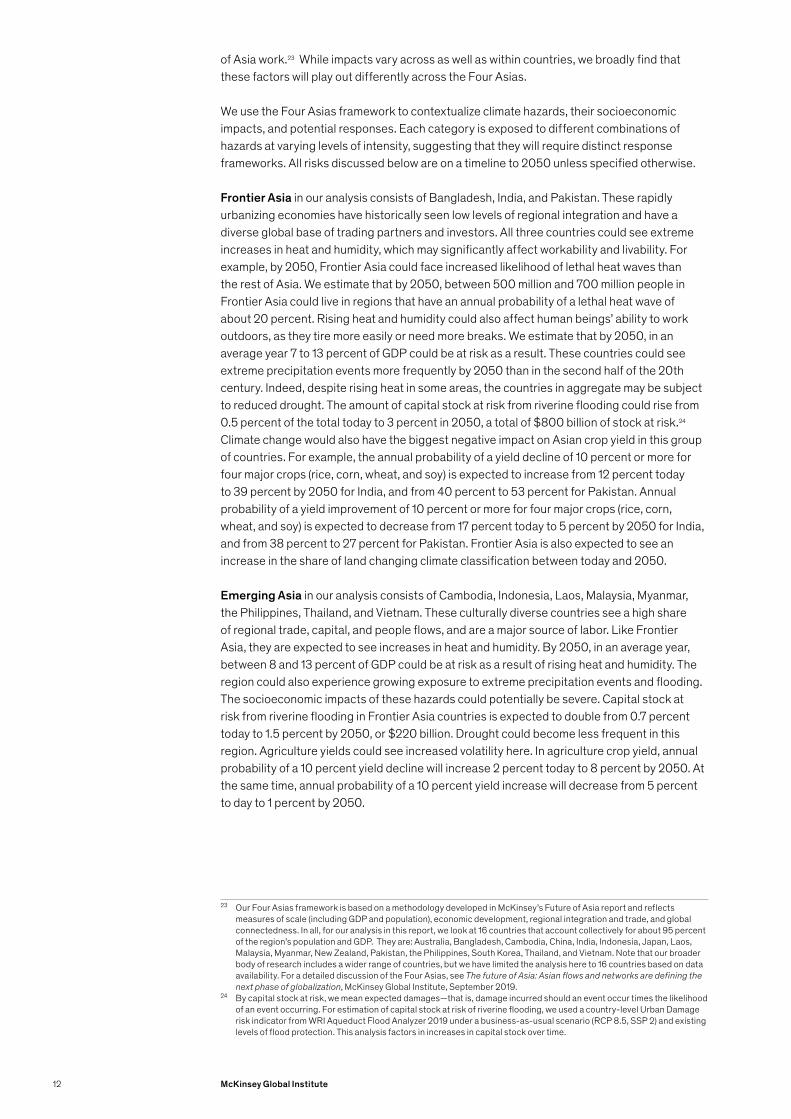
We use the Four Asias framework to contextualize climate hazards, their socioeconomic impacts, and potential responses. Each category is exposed to different combinations of hazards at varying levels of intensity, suggesting that they will require distinct response frameworks. All risks discussed below are on a timeline to 2050 unless specified otherwise.
Frontier Asia in our analysis consists of Bangladesh, India, and Pakistan. These rapidly urbanizing economies have historically seen low levels of regional integration and have a diverse global base of trading partners and investors. All three countries could see extreme increases in heat and humidity, which may significantly affect workability and livability. For example, by 2050, Frontier Asia could face increased likelihood of lethal heat waves than the rest of Asia. We estimate that by 2050, between 500 million and 700 million people in Frontier Asia could live in regions that have an annual probability of a lethal heat wave of about 20 percent. Rising heat and humidity could also affect human beings’ ability to work outdoors, as they tire more easily or need more breaks. We estimate that by 2050, in an average year 7 to 13 percent of GDP could be at risk as a result. These countries could see extreme precipitation events more frequently by 2050 than in the second half of the 20th century. Indeed, despite rising heat in some areas, the countries in aggregate may be subject to reduced drought. The amount of capital stock at risk from riverine flooding could rise from 0.5 percent of the total today to 3 percent in 2050, a total of $800 billion of stock at risk.24 Climate change would also have the biggest negative impact on Asian crop yield in this group of countries. For example, the annual probability of a yield decline of 10 percent or more for four major crops (rice, corn, wheat, and soy) is expected to increase from 12 percent today to 39 percent by 2050 for India, and from 40 percent to 53 percent for Pakistan. Annual probability of a yield improvement of 10 percent or more for four major crops (rice, corn, wheat, and soy) is expected to decrease from 17 percent today to 5 percent by 2050 for India, and from 38 percent to 27 percent for Pakistan. Frontier Asia is also expected to see an increase in the share of land changing climate classification between today and 2050.
Emerging Asia in our analysis consists of Cambodia, Indonesia, Laos, Malaysia, Myanmar, the Philippines, Thailand, and Vietnam. These culturally diverse countries see a high share of regional trade, capital, and people flows, and are a major source of labor. Like Frontier Asia, they are expected to see increases in heat and humidity. By 2050, in an average year, between 8 and 13 percent of GDP could be at risk as a result of rising heat and humidity. The region could also experience growing exposure to extreme precipitation events and flooding. The socioeconomic impacts of these hazards could potentially be severe. Capital stock at risk from riverine flooding in Frontier Asia countries is expected to double from 0.7 percent today to 1.5 percent by 2050, or $220 billion. Drought could become less frequent in this region. Agriculture yields could see increased volatility here. In agriculture crop yield, annual probability of a 10 percent yield decline will increase 2 percent today to 8 percent by 2050. At the same time, annual probability of a 10 percent yield increase will decrease from 5 percent to day to 1 percent by 2050.
23 Our Four Asias framework is based on a methodology developed in McKinsey’s Future of Asia report and reflects measures of scale (including GDP and population), economic development, regional integration and trade, and global connectedness. In all, for our analysis in this report, we look at 16 countries that account collectively for about 95 percent of the region’s population and GDP. They are: Australia, Bangladesh, Cambodia, China, India, Indonesia, Japan, Laos, Malaysia, Myanmar, New Zealand, Pakistan, the Philippines, South Korea, Thailand, and Vietnam. Note that our broader body of research includes a wider range of countries, but we have limited the analysis here to 16 countries based on data availability. For a detailed discussion of the Four Asias, see The future of Asia: Asian flows and networks are defining the next phase of globalization, McKinsey Global Institute, September 2019.
24 By capital stock at risk, we mean expected damages—that is, damage incurred should an event occur times the likelihood of an event occurring. For estimation of capital stock at risk of riverine flooding, we used a country-level Urban Damage risk indicator from WRI Aqueduct Flood Analyzer 2019 under a business-as-usual scenario (RCP 8.5, SSP 2) and existing levels of flood protection. This analysis factors in increases in capital stock over time.
12 McKinsey Global Institute
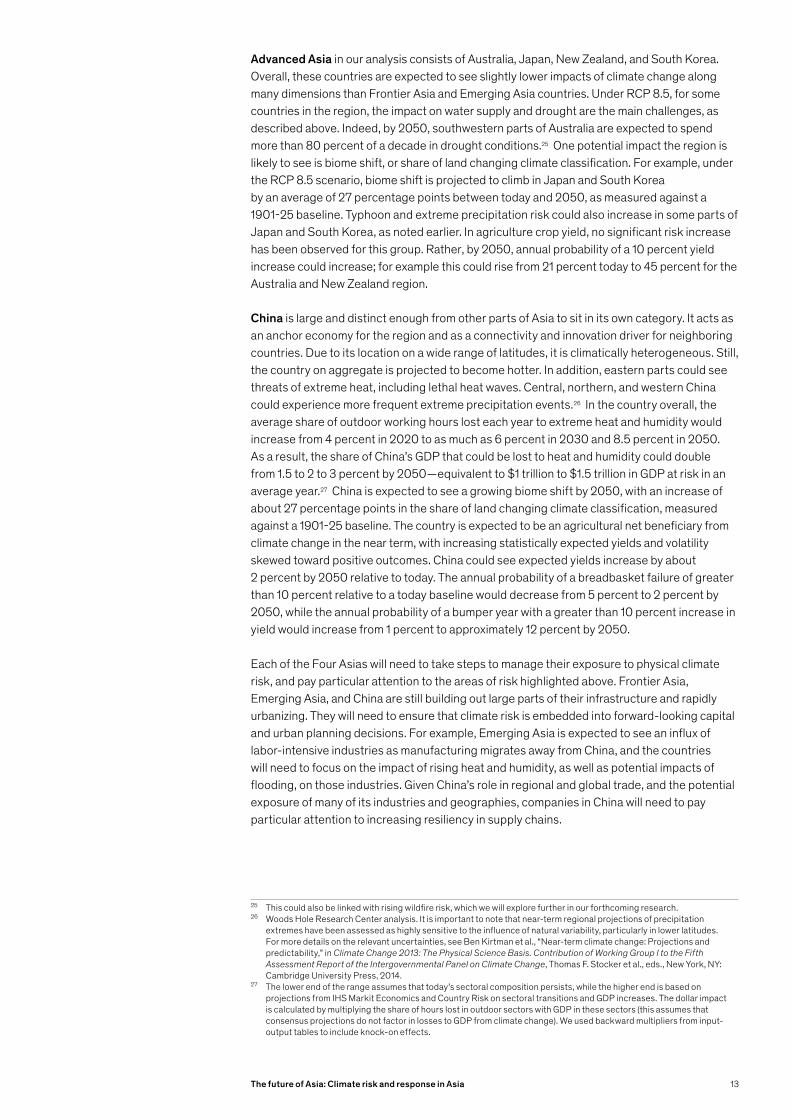
Advanced Asia in our analysis consists of Australia, Japan, New Zealand, and South Korea. Overall, these countries are expected to see slightly lower impacts of climate change along many dimensions than Frontier Asia and Emerging Asia countries. Under RCP 8.5, for some countries in the region, the impact on water supply and drought are the main challenges, as described above. Indeed, by 2050, southwestern parts of Australia are expected to spend more than 80 percent of a decade in drought conditions.25 One potential impact the region is likely to see is biome shift, or share of land changing climate classification. For example, under the RCP 8.5 scenario, biome shift is projected to climb in Japan and South Korea by an average of 27 percentage points between today and 2050, as measured against a 1901-25 baseline. Typhoon and extreme precipitation risk could also increase in some parts of Japan and South Korea, as noted earlier. In agriculture crop yield, no significant risk increase has been observed for this group. Rather, by 2050, annual probability of a 10 percent yield increase could increase; for example this could rise from 21 percent today to 45 percent for the Australia and New Zealand region.
China is large and distinct enough from other parts of Asia to sit in its own category. It acts as an anchor economy for the region and as a connectivity and innovation driver for neighboring countries. Due to its location on a wide range of latitudes, it is climatically heterogeneous. Still, the country on aggregate is projected to become hotter. In addition, eastern parts could see threats of extreme heat, including lethal heat waves. Central, northern, and western China could experience more frequent extreme precipitation events.26 In the country overall, the average share of outdoor working hours lost each year to extreme heat and humidity would increase from 4 percent in 2020 to as much as 6 percent in 2030 and 8.5 percent in 2050. As a result, the share of China’s GDP that could be lost to heat and humidity could double from 1.5 to 2 to 3 percent by 2050—equivalent to $1 trillion to $1.5 trillion in GDP at risk in an average year.27 China is expected to see a growing biome shift by 2050, with an increase of about 27 percentage points in the share of land changing climate classification, measured against a 1901-25 baseline. The country is expected to be an agricultural net beneficiary from climate change in the near term, with increasing statistically expected yields and volatility skewed toward positive outcomes. China could see expected yields increase by about 2 percent by 2050 relative to today. The annual probability of a breadbasket failure of greater than 10 percent relative to a today baseline would decrease from 5 percent to 2 percent by 2050, while the annual probability of a bumper year with a greater than 10 percent increase in yield would increase from 1 percent to approximately 12 percent by 2050.
Each of the Four Asias will need to take steps to manage their exposure to physical climate risk, and pay particular attention to the areas of risk highlighted above. Frontier Asia, Emerging Asia, and China are still building out large parts of their infrastructure and rapidly urbanizing. They will need to ensure that climate risk is embedded into forward-looking capital and urban planning decisions. For example, Emerging Asia is expected to see an influx of labor-intensive industries as manufacturing migrates away from China, and the countries will need to focus on the impact of rising heat and humidity, as well as potential impacts of flooding, on those industries. Given China’s role in regional and global trade, and the potential exposure of many of its industries and geographies, companies in China will need to pay particular attention to increasing resiliency in supply chains.
25 This could also be linked with rising wildfire risk, which we will explore further in our forthcoming research.26 Woods Hole Research Center analysis. It is important to note that near-term regional projections of precipitation
extremes have been assessed as highly sensitive to the influence of natural variability, particularly in lower latitudes. For more details on the relevant uncertainties, see Ben Kirtman et al., “Near-term climate change: Projections and predictability,” in Climate Change 2013: The Physical Science Basis. Contribution of Working Group I to the Fifth Assessment Report of the Intergovernmental Panel on Climate Change, Thomas F. Stocker et al., eds., New York, NY: Cambridge University Press, 2014.
27 The lower end of the range assumes that today’s sectoral composition persists, while the higher end is based on projections from IHS Markit Economics and Country Risk on sectoral transitions and GDP increases. The dollar impact is calculated by multiplying the share of hours lost in outdoor sectors with GDP in these sectors (this assumes that consensus projections do not factor in losses to GDP from climate change). We used backward multipliers from input-output tables to include knock-on effects.
13The future of Asia: Climate risk and response in Asia
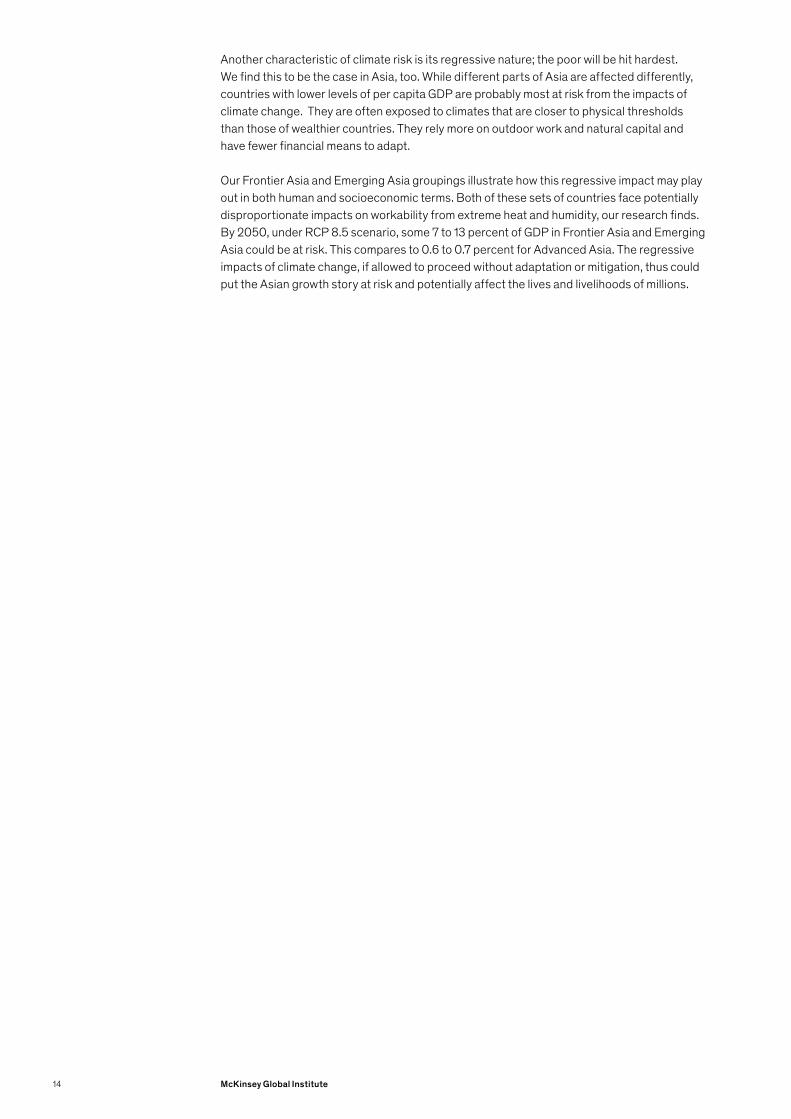
Another characteristic of climate risk is its regressive nature; the poor will be hit hardest. We find this to be the case in Asia, too. While different parts of Asia are affected differently, countries with lower levels of per capita GDP are probably most at risk from the impacts of climate change. They are often exposed to climates that are closer to physical thresholds than those of wealthier countries. They rely more on outdoor work and natural capital and have fewer financial means to adapt.
Our Frontier Asia and Emerging Asia groupings illustrate how this regressive impact may play out in both human and socioeconomic terms. Both of these sets of countries face potentially disproportionate impacts on workability from extreme heat and humidity, our research finds. By 2050, under RCP 8.5 scenario, some 7 to 13 percent of GDP in Frontier Asia and Emerging Asia could be at risk. This compares to 0.6 to 0.7 percent for Advanced Asia. The regressive impacts of climate change, if allowed to proceed without adaptation or mitigation, thus could put the Asian growth story at risk and potentially affect the lives and livelihoods of millions.
14 McKinsey Global Institute
As the Earth continues to warm, physical climate risk is ever-changing or nonstationary. Climate science tells us that further warming and risk increase can only be stopped by achieving zero net greenhouse gas emissions. Furthermore, given the thermal inertia of the Earth system, some amount of warming will also likely occur after net-zero emissions are reached.28
Given the potentially significant effects of climate change in Asia, the onus is on policy makers, companies, and individuals to develop and implement adaptation strategies that will soften impacts and enable economic activities to continue to their maximum potential, even as they consider how to mitigate the rise in carbon emissions and avoid an even more damaging scenario in future decades. These goals will require ambition and a concerted effort to build on and extend recent successful efforts.
The good news is that, in many ways, Asia is well placed to adapt and lead global adaptation and mitigation efforts. A significant opportunity lies in infrastructure development. To maintain its current growth trajectory, Asia must invest $1.7 trillion annually through 2030, according to the Asian Development Bank.29 Incorporating climate adaptation into projects will make a difference to regional development and resilience. As they build out their economies, policy makers in Frontier Asia and Emerging Asia can also exploit synergies between infrastructure needs and opportunities for emissions reductions. Stakeholders can also embrace public-private-sector collaboration and explore new approaches to incorporate climate factors into planning. More broadly, Asia is home to some of the world’s largest and most innovative companies, and almost half of R&D investments globally take place in Asia. Over the past decade, the region accounted for the highest share of global growth in key technology metrics—namely, technology company revenue, venture capital funding, spending on research and development, and number of patents filed.30 With concerted effort, Asian countries can help manage their own exposure to climate risk and can lead the way on global adaptation and mitigation efforts.
28 H. Damon Matthews et al., “Focus on cumulative emissions, global carbon budgets, and the implications for climate mitigation targets,” Environmental Research Letters, January 2018, Volume 13, Number 1; H. Damon Matthews and Ken Caldeira, “Stabilizing climate requires near zero emissions,” Geophysical Research Letters, February 2008, Volume 35; Myles Allen et al, “Warming caused by cumulative carbon emissions towards the trillionth tonne,” Nature, April 2009, Volume 485
29 Infrastructure investment is defined as fixed-asset investments in four sectors: transportation (road, rail, air, and ports), energy, telecommunications, and water and sanitation (including dams, irrigation, and flood control waterworks. Asian Development Bank, Meeting Asia’s infrastructure needs, 2017.
30 See Oliver Tonby, Jonathan Woetzel, Noshir Kaka, Wonsik Choi, Jeongmin Seong, Brant Carson, and Lily Ma, How technology is safeguarding health and livelihoods in Asia, McKinsey & Company, May 2020.
Adaptation and mitigation: Challenges and opportunities in Asia
15The future of Asia: Climate risk and response in Asia
Rising to the climate risk challenge will require efforts by policy makers and business leaders. In our forthcoming report on climate risk and response in Asia, we will highlight measures that Asian leaders could consider for the region to be a global leader in protecting lives and livelihoods from physical climate risk across three dimensions: integrating climate risk into business and policy decisions, adopting measures that are effective in adapting to the changing climate, and seeking to mitigate climate risk through decarbonization.
About the authors: Jonathan Woetzel is a McKinsey senior partner and director of the McKinsey Global Institute (MGI), based in Shanghai; Oliver Tonby is a senior partner in Singapore and chairman, McKinsey Asia; Mekala Krishnan is an MGI senior fellow in Boston; Yuito Yamada is a partner in Tokyo and leader of McKinsey’s Sustainability practice in Asia; Dickon Pinner is a senior partner in San Francisco and leader of McKinsey’s global Sustainability Practice; and Ruslan Fakhrutdinov is an associate in Moscow.
16 McKinsey Global Institute
Further reading McKinsey Global Institute climate risk publications
Climate risk and response: Physical hazards and socioeconomic impacts, McKinsey Global Institute, January 2020.
Detailed case studies from the global research have been published separately:
Can coastal cities turn the tide on rising flood risk? April 20, 2020.
A Mediterranean basin without a Mediterranean climate? May 28, 2020.
Reduced dividends on natural capital? June 29, 2020.
Could climate become the weak link in your supply chain? August 6, 2020
See also Dickon Pinner, Matt Rogers, and Hamid Samandari, Addressing climate change in a post-pandemic world, McKinsey & Company, April 7, 2020.
McKinsey Future of Asia research
The future of Asia: Asian flows and networks are defining the next phase of globalization, McKinsey Global Institute, September 2019.
The future of Asia: Decoding the value and performance of corporate Asia, McKinsey Global Institute, June 3, 2020.
How technology is safeguarding health and livelihoods in Asia, McKinsey & Company, May 12, 2020.
17The future of Asia: Climate risk and response in Asia

McKInsey Global InstituteAugust 2020Copyright © McKinsey & CompanyDesigned by the Sydney Design Studio
www.mckinsey.com
@McKinsey @McKinsey
Future of Asia: xxxxx