Embed Size (px)
Citation preview
Climate Modeling
101
J am ie Ande rsonDecember 9 , 2014
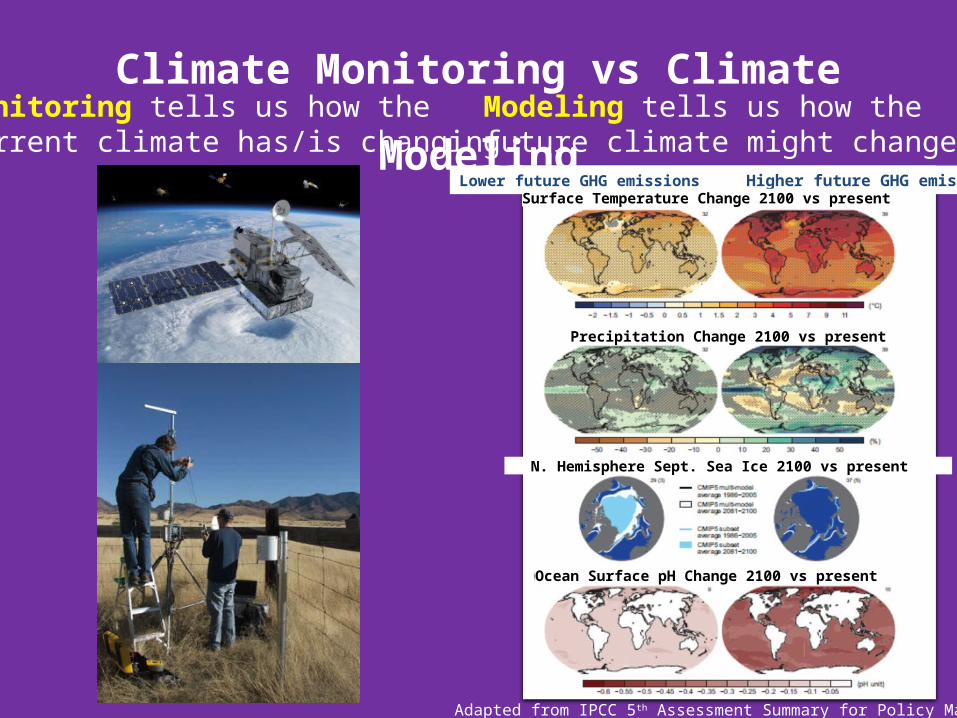
Monitoring tells us how the current climate has/is changing
Climate Monitoring vs Climate ModelingModeling tells us how the future climate might change
Lower future GHG emissions Higher future GHG emissionsSurface Temperature Change 2100 vs present
Precipitation Change 2100 vs present
N. Hemisphere Sept. Sea Ice 2100 vs present
Ocean Surface pH Change 2100 vs present
Adapted from IPCC 5th Assessment Summary for Policy Makers
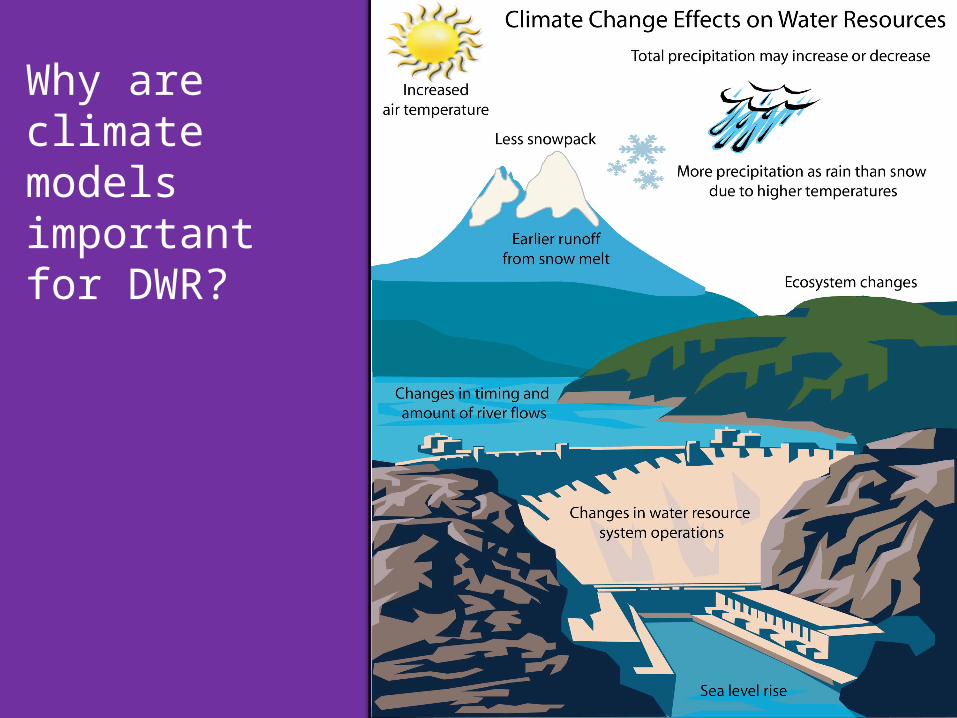
Why are climate models importantfor DWR?
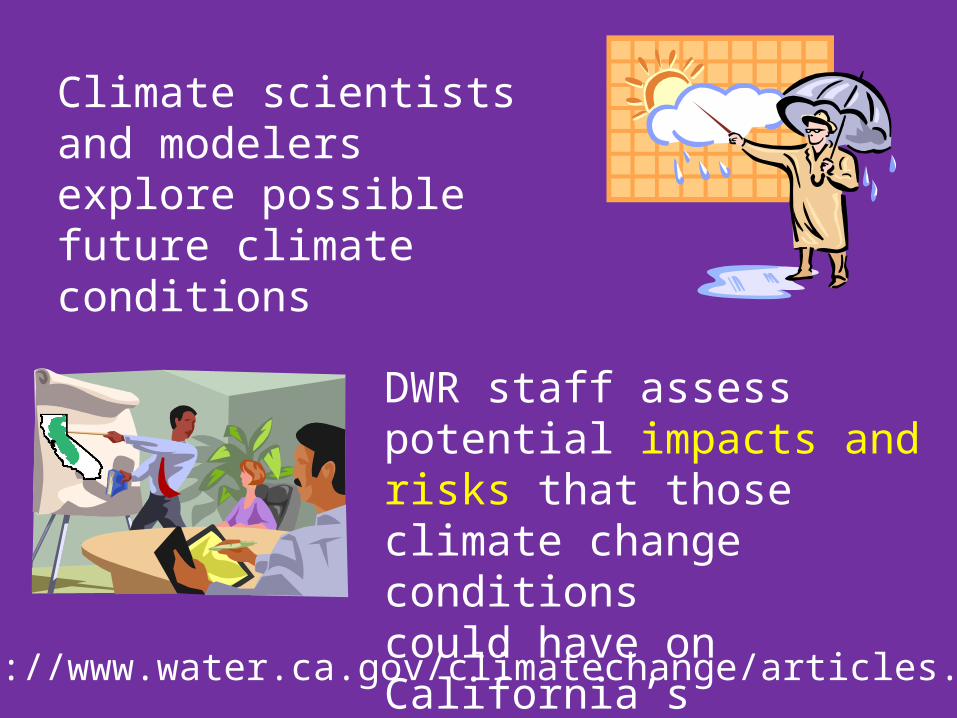
Climate scientists and modelers explore possible future climate conditions
DWR staff assess potential impacts and risks that those climate change conditions could have on California’s water resources
http://www.water.ca.gov/climatechange/articles.cfm
What is a model?
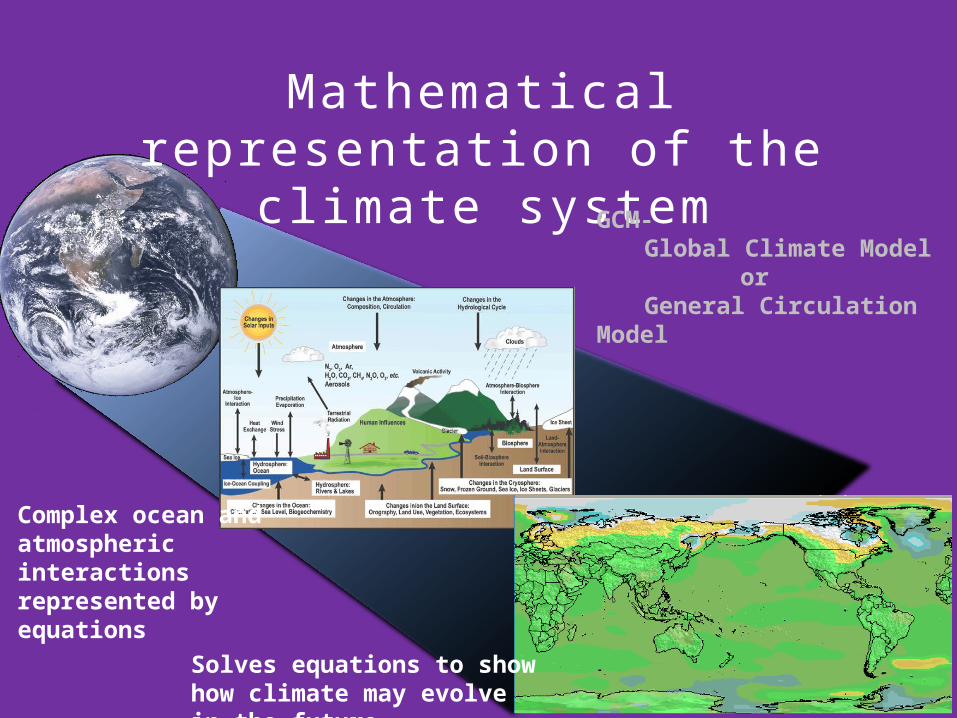
Mathematical representation of the climate system
GCM- Global Climate Model
orGeneral Circulation
Model
Complex ocean and atmospheric interactions represented by equations
Solves equations to show how climate may evolve in the future
http://www.windows2universe.org/earth/climate/climate_modeling.html
Building a Global Climate Model
National Earth Science Teachers Association
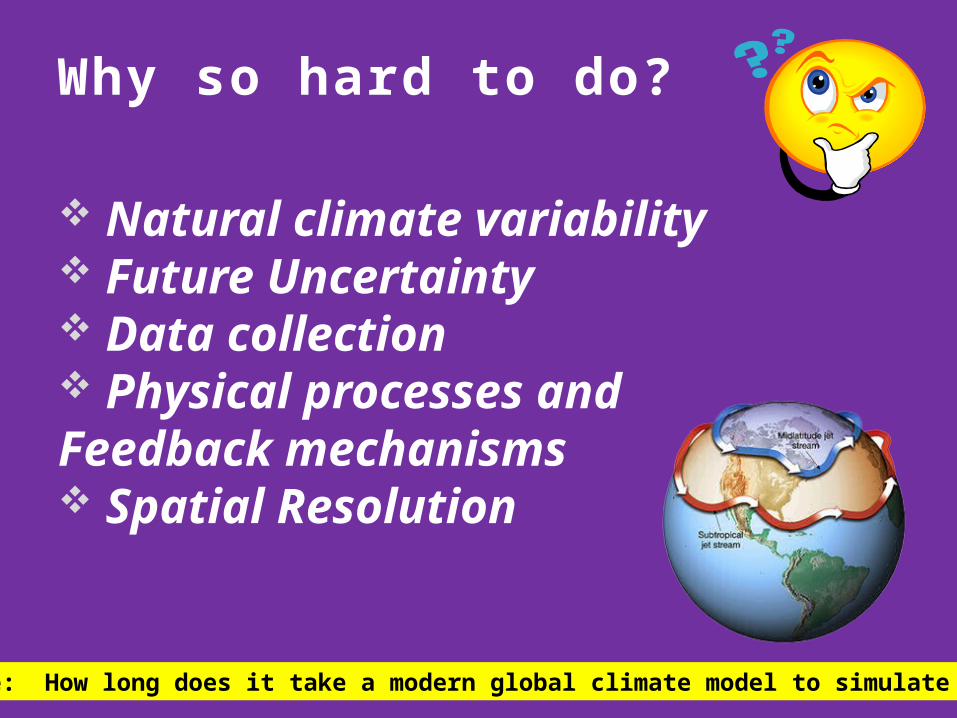
Natural climate variability Future Uncertainty Data collection Physical processes and Feedback mechanisms Spatial Resolution
Why so hard to do?
Trivia Time: How long does it take a modern global climate model to simulate 150 years?
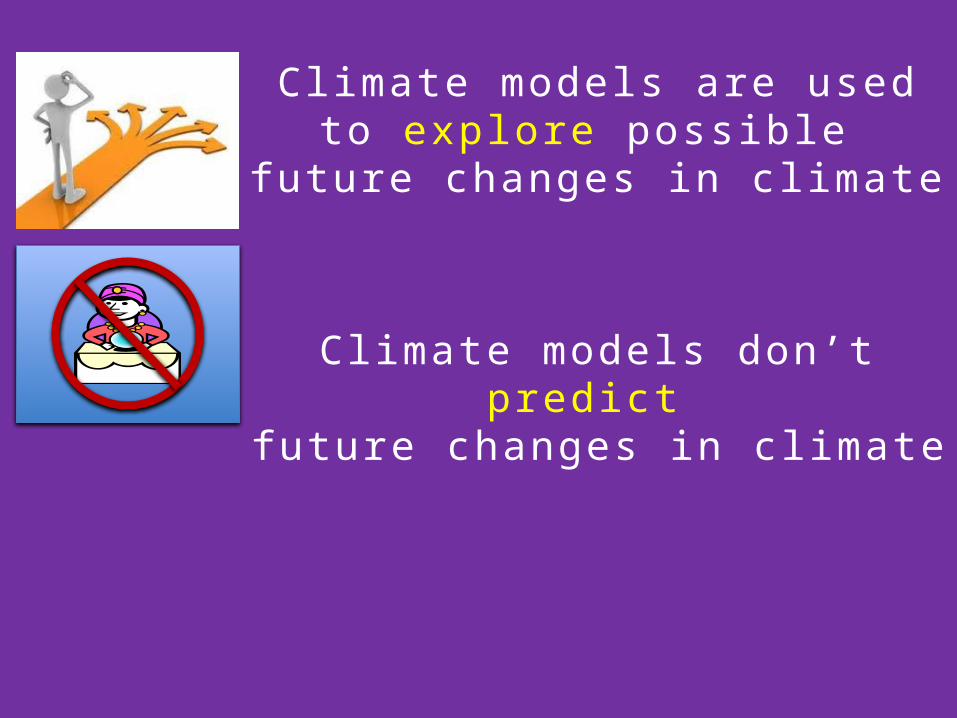
Climate models are used to explore possible
future changes in climate
Climate models don’t predict
future changes in climate

Weather vs Climate Modeling
Weather Forecasting
• What will the weather be on a specific day in a specific place
• Short term (7-10 days)
Future Climate Simulations• What will the climate trends
be in a region in the future
• Long term (100 years)
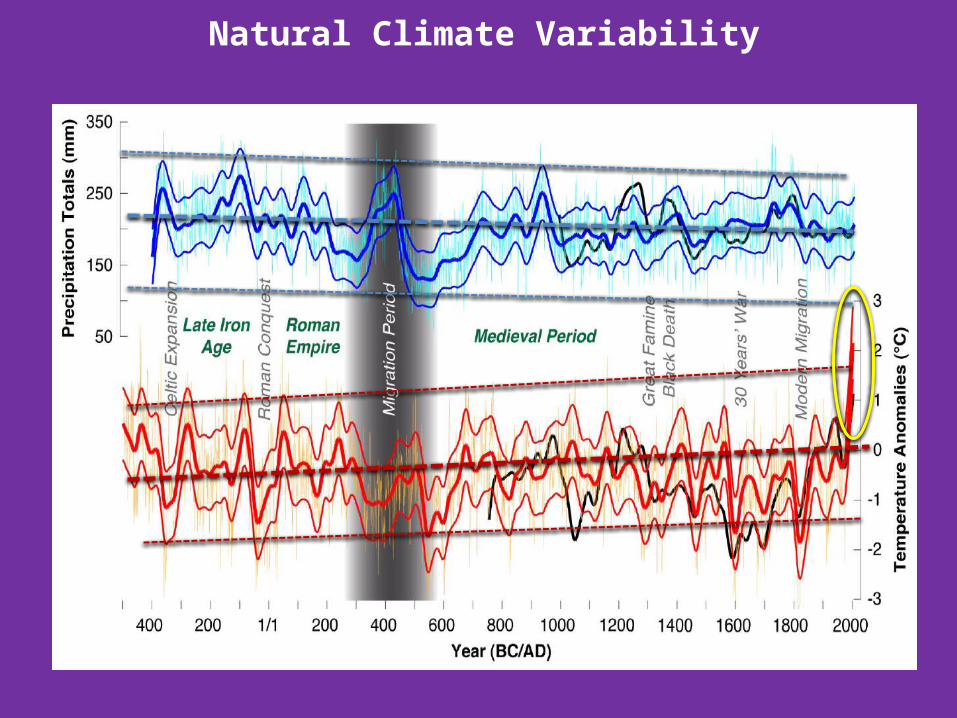
Natural Climate Variability
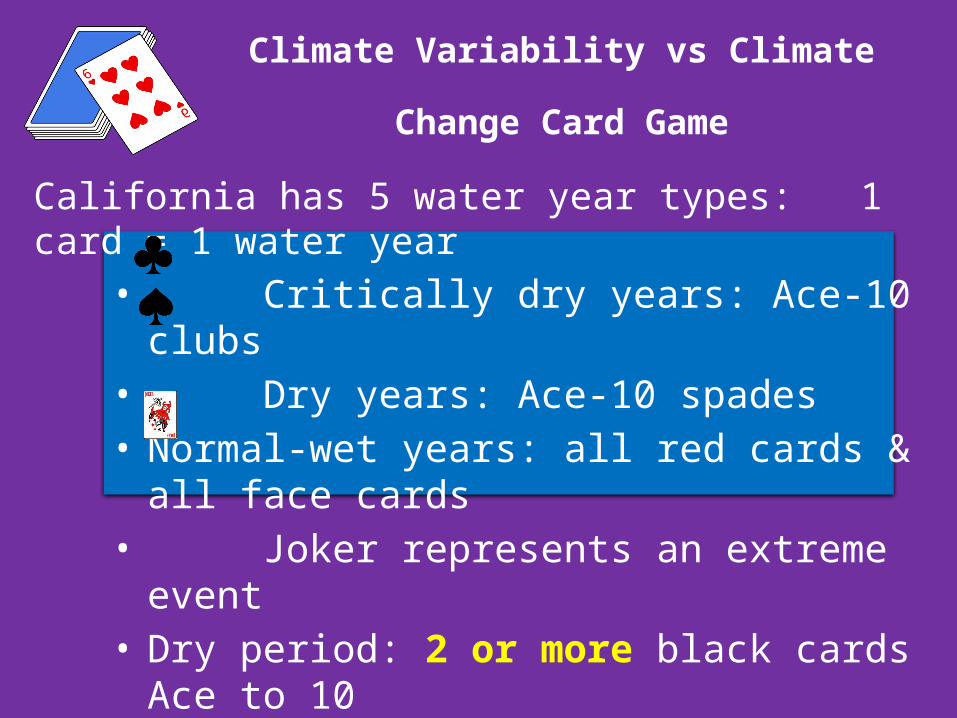
California has 5 water year types: 1 card = 1 water year• Critically dry years: Ace-10 clubs • Dry years: Ace-10 spades• Normal-wet years: all red cards & all face cards• Joker represents an extreme event• Dry period: 2 or more black cards Ace to 10
• Shuffle your deck and deal cards 1 at a time. Count• # dry periods• Length of longest dry period• Did extreme event occur during a dry period?
Climate Variability vs Climate Change Card
Game

Lessons Learned Climate Variability vs Climate Change Card
Game
• Current climate and future modified climate are both highly variable
• Each “sample” gave a different result• An increased probability of dry conditions
did not guarantee dry conditions • Several “samples” are needed to understand
possible trends
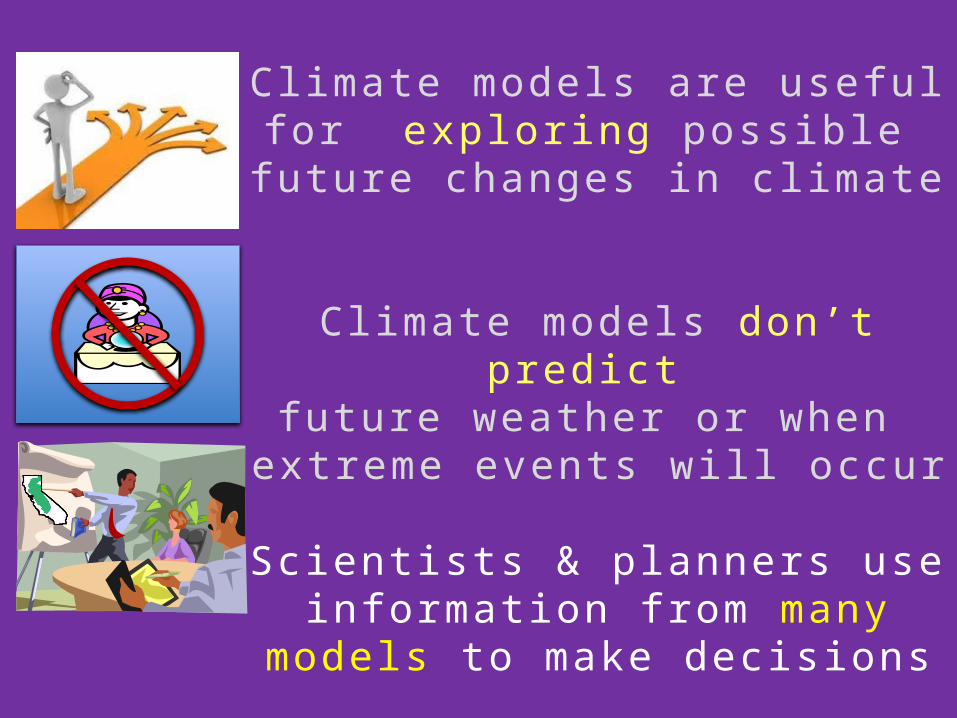
Climate models are useful for exploring possible
future changes in climate
Climate models don’t predict
future weather or when extreme events wil l occur
Scientists & planners use information from many
models to make decisions
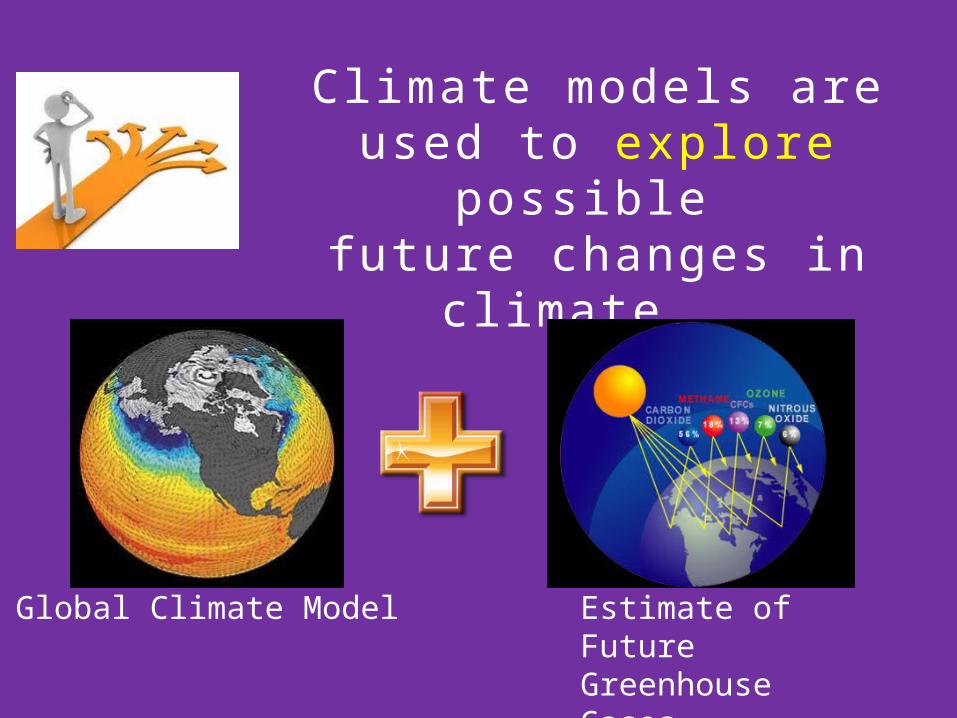
Climate models are used to explore possible future changes in
climate.
Global Climate Model Estimate of FutureGreenhouse Gases
Which climate models are best for CA water resources?
• There is no “best” climate model for CA• Several global climate models represent
climate processes important to CA well• DWR uses information from several of these
climate models to assess potential impacts
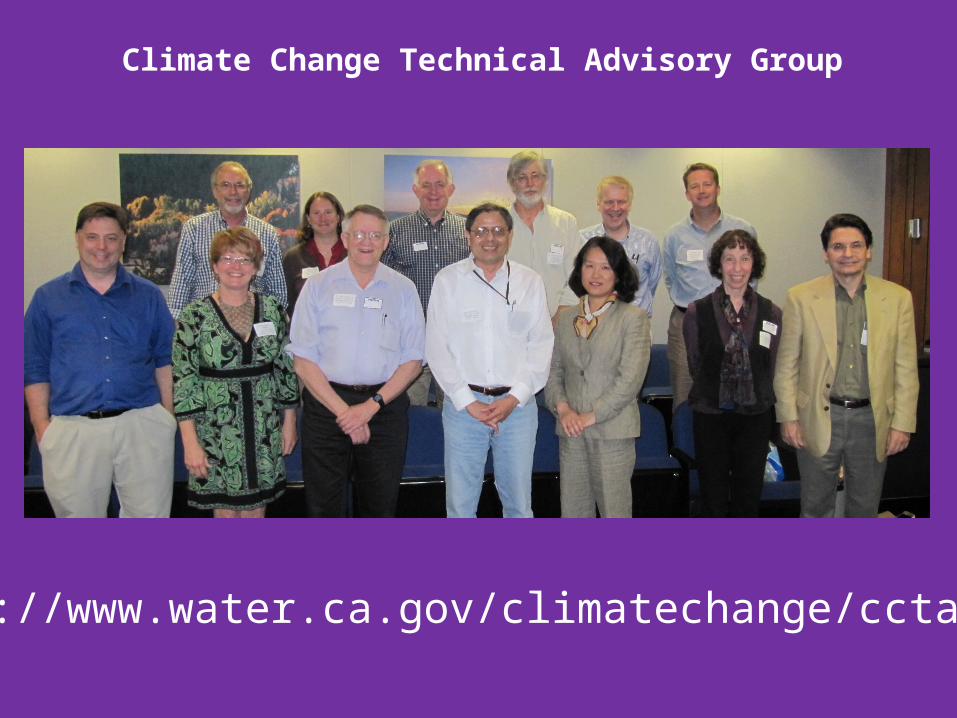
Climate Change Technical Advisory Group
http://www.water.ca.gov/climatechange/cctag.cfm
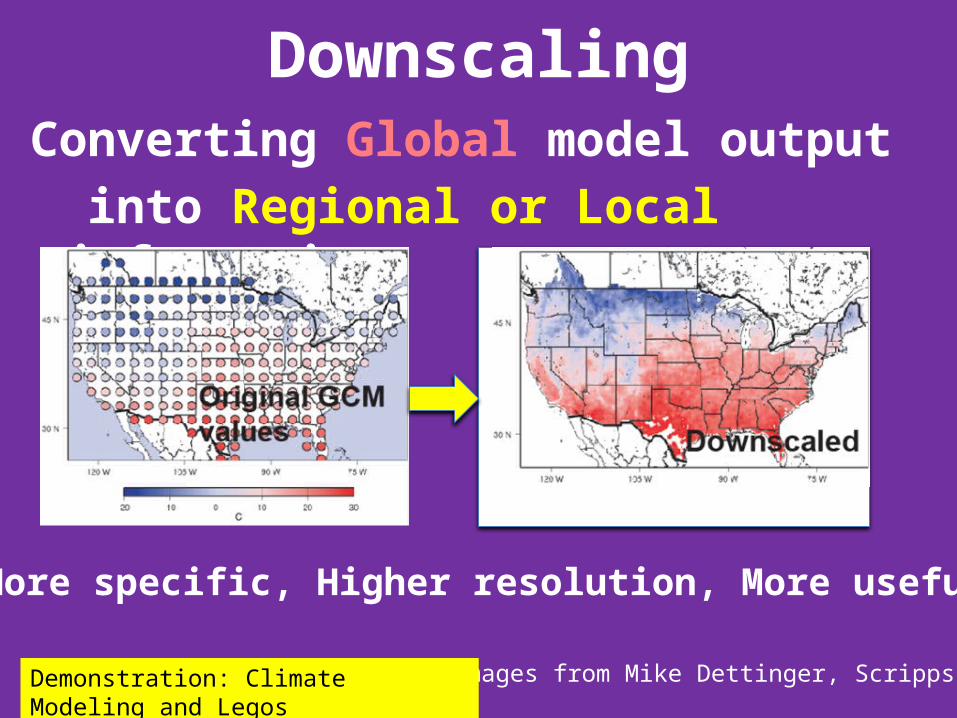
DownscalingConverting Global model output
into Regional or Local information
More specific, Higher resolution, More useful
Images from Mike Dettinger, Scripps/USGSDemonstration: Climate Modeling and Legos
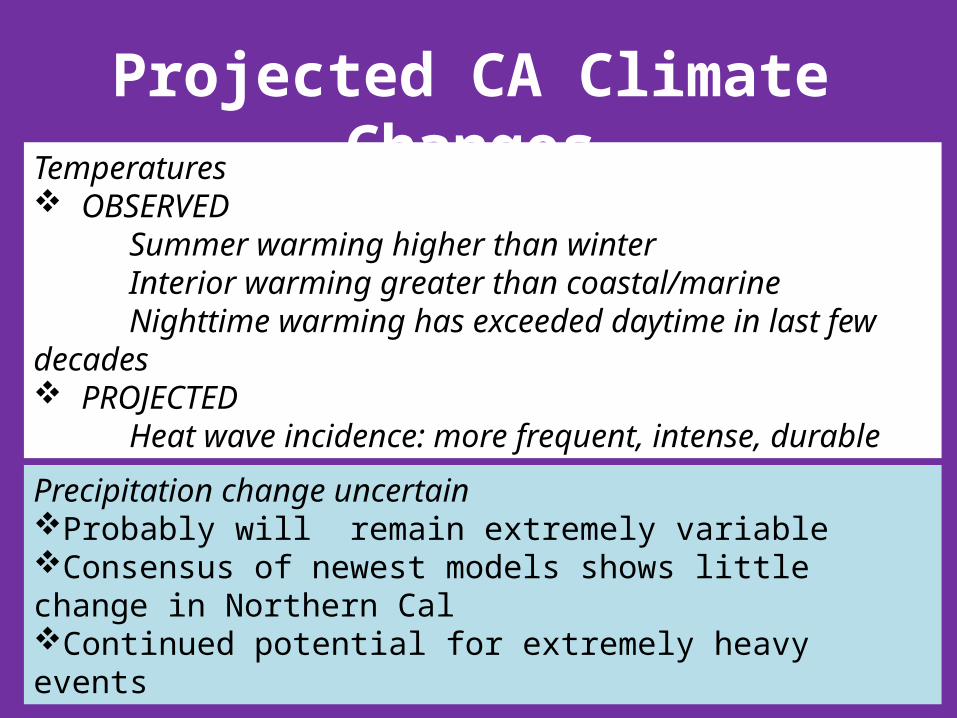
Projected CA Climate ChangesTemperatures
OBSERVED Summer warming higher than winterInterior warming greater than coastal/marine Nighttime warming has exceeded daytime in last few
decades PROJECTED
Heat wave incidence: more frequent, intense, durable
Precipitation change uncertain Probably will remain extremely variable Consensus of newest models shows little change in Northern CalContinued potential for extremely heavy events
http://www.youtube.com/watch?v=U9YAzrmeOGI
Future Climate Projections
National Center for Atmospheric Research
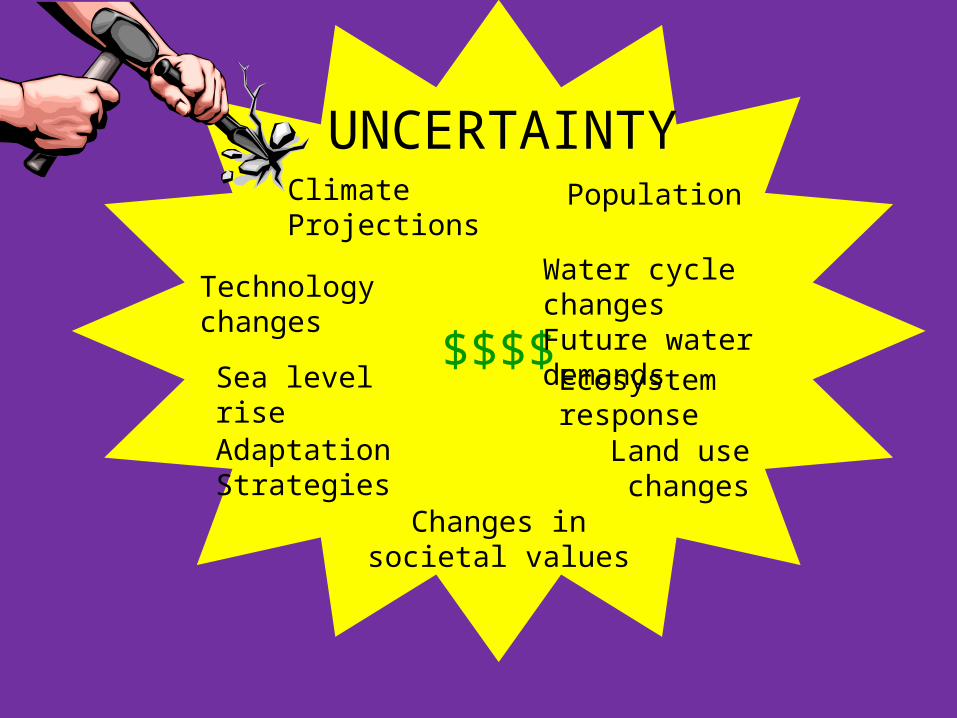
UNCERTAINTYClimate Projections
Technology changes
Changes in societal values
$$$$Ecosystem response
Water cycle changesFuture water demands
Sea level rise
Adaptation Strategies
Population
Land use changes
Take Home Message
Global climate models explore possible future climate conditions, they don’t predict specific future conditions or events
DWR uses results from several global climate models to evaluate possible impacts of climate change on California’s water resources
Current modeling indicates that climate change with increase stress on water resources systems

Extra Slides
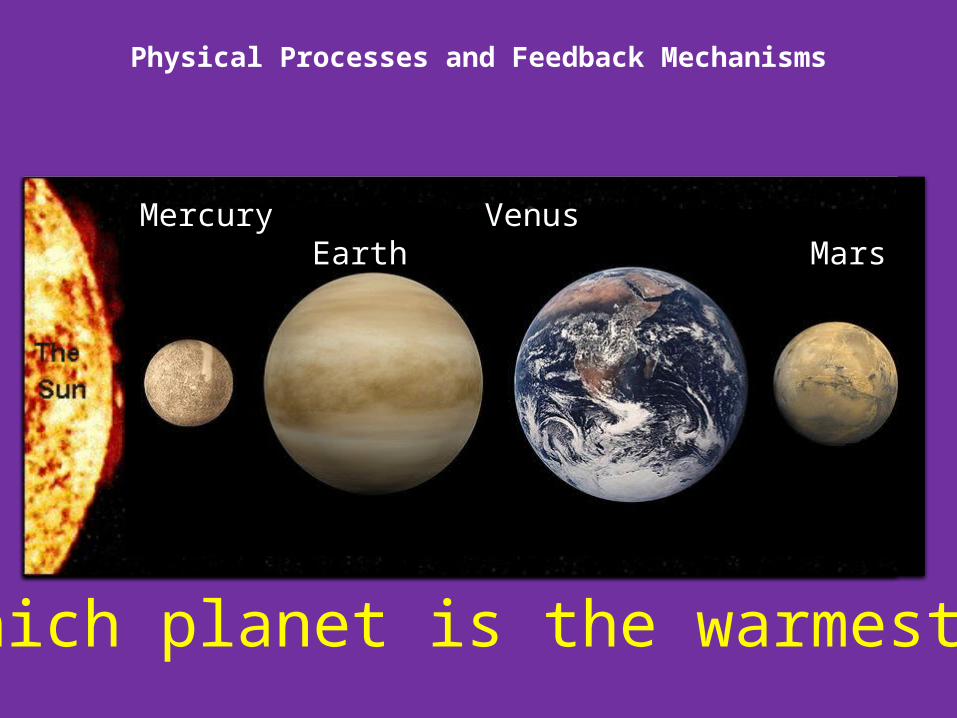
Mercury Venus Earth Mars
Which planet is the warmest?
Physical Processes and Feedback Mechanisms
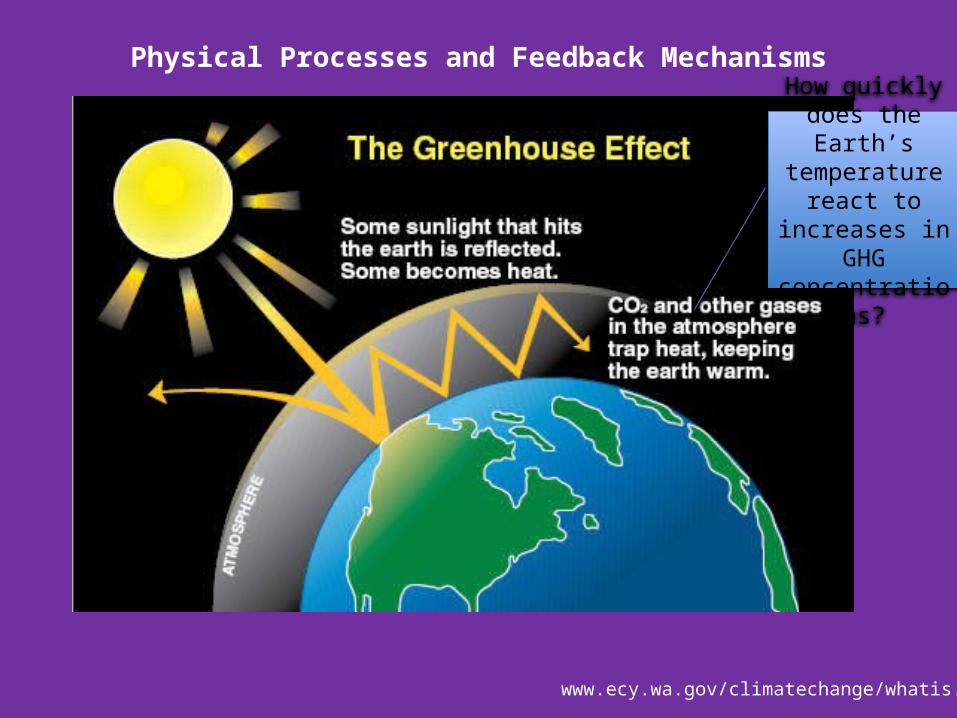
www.ecy.wa.gov/climatechange/whatis.htm
How quickly does the Earth’s
temperature react to increases
in GHG concentrations?
Physical Processes and Feedback Mechanisms
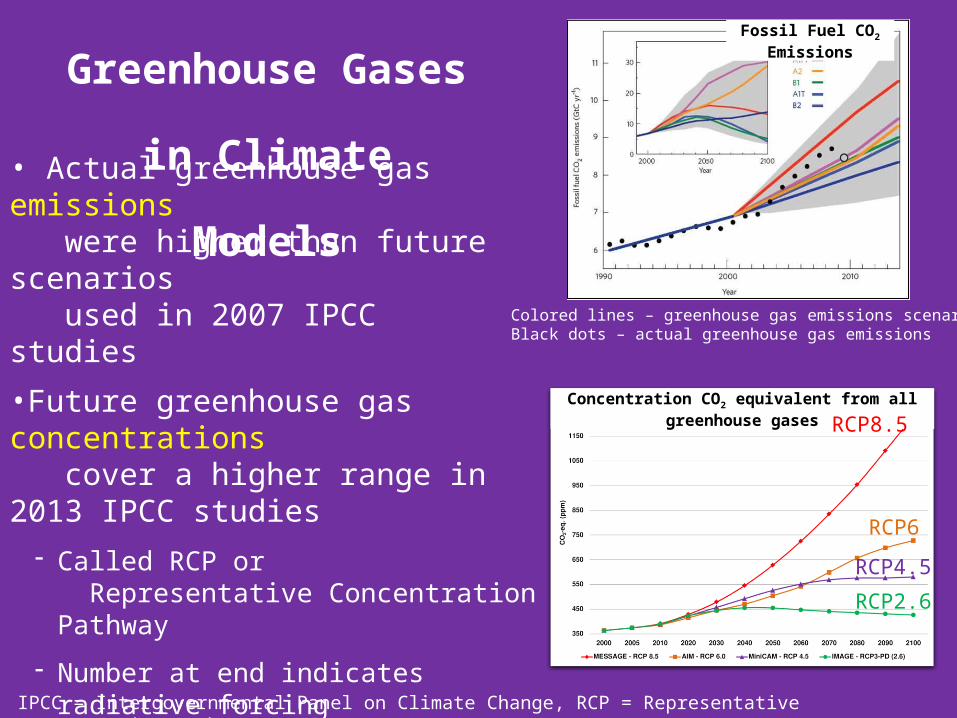
Greenhouse Gases in
Climate Models• Actual greenhouse gas emissions were higher than future scenarios used in 2007 IPCC studies
Colored lines – greenhouse gas emissions scenariosBlack dots – actual greenhouse gas emissions
•Future greenhouse gas concentrations cover a higher range in 2013 IPCC studies
- Called RCP or Representative Concentration Pathway
- Number at end indicates radiative forcing value at the end of the century 2.6, 4.5, 6.0, and 8.5 W/m2 in 2100
Concentration CO2 equivalent from all greenhouse gases
RCP8.5
RCP6
RCP4.5
RCP2.6
Fossil Fuel CO2 Emissions
IPCC = Intergovernmental Panel on Climate Change, RCP = Representative Concentration Pathway
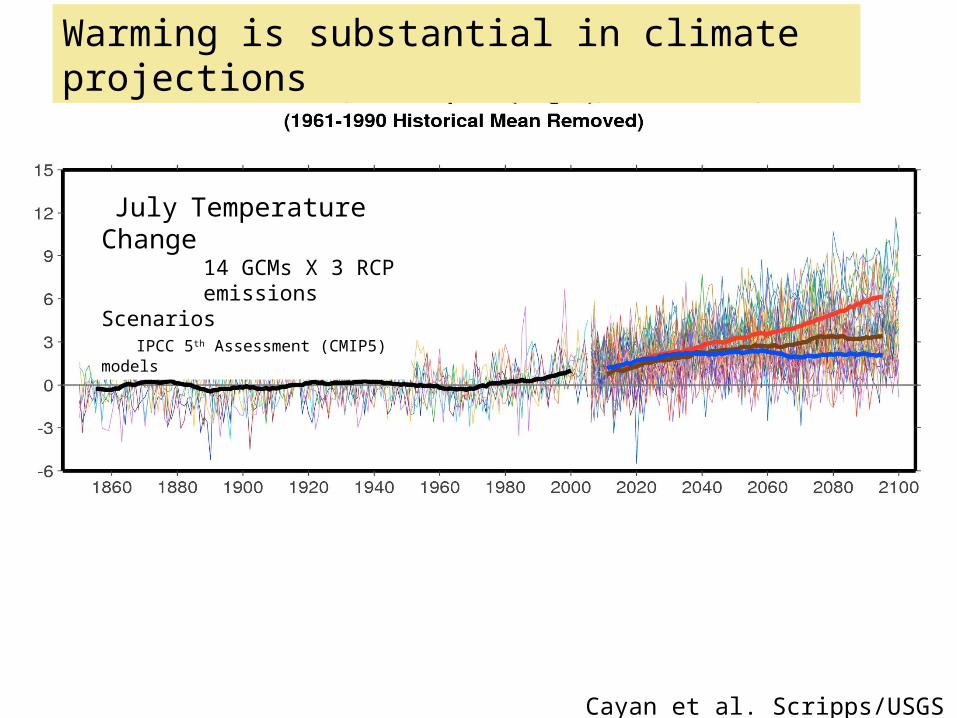
July Temperature Change 14 GCMs X 3 RCP emissions Scenarios IPCC 5th Assessment (CMIP5) models
Warming is substantial in climate projections
Cayan et al. Scripps/USGS 2013
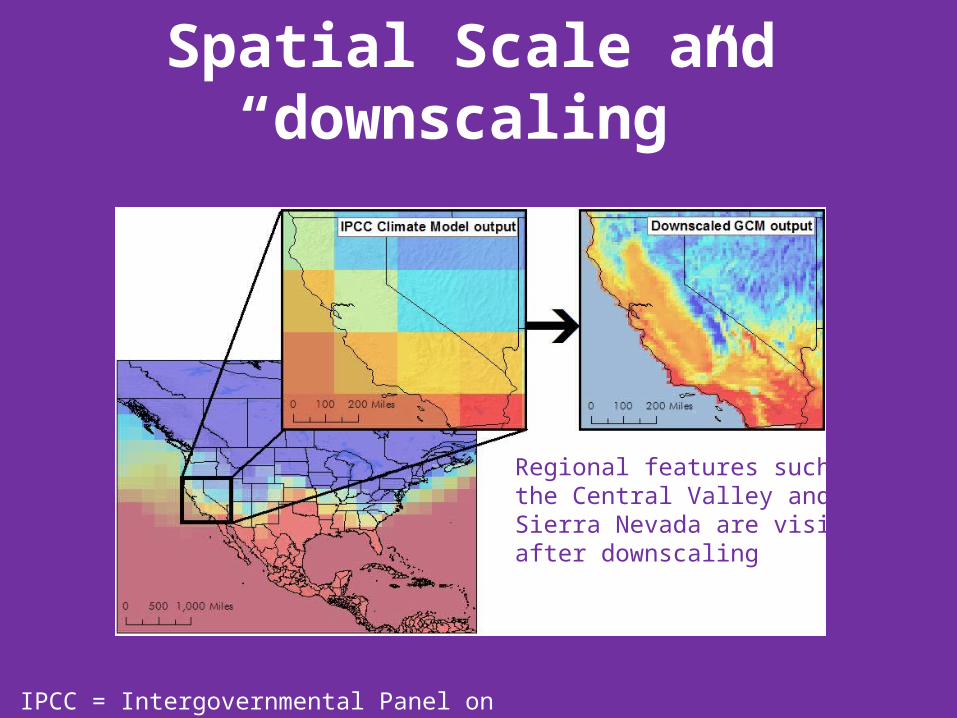
Spatial Scale and “downscaling”
IPCC = Intergovernmental Panel on Climate Change
Regional features such asthe Central Valley and Sierra Nevada are visibleafter downscaling
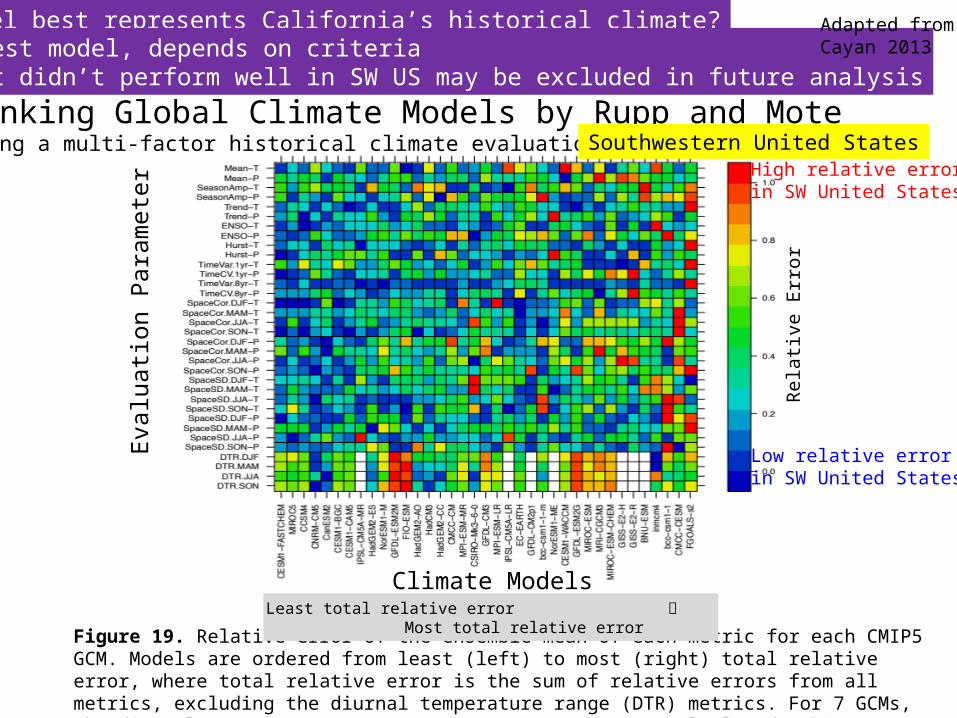
What model best represents California’s historical climate?
Figure 19. Relative error of the ensemble mean of each metric for each CMIP5 GCM. Models are ordered from least (left) to most (right) total relative error, where total relative error is the sum of relative errors from all metrics, excluding the diurnal temperature range (DTR) metrics. For 7 GCMs, the diurnal temperature range (DTR) metrics were not calculated (white squares).
Ranking Global Climate Models by Rupp and Moteusing a multi-factor historical climate evaluation scheme for the
Eval
uatio
n Pa
ram
eter
Climate Models
Rela
tive
Erro
r
High relative errorin SW United States
No clear best model, depends on criteriaModels that didn’t perform well in SW US may be excluded in future analysis
Low relative errorin SW United States
Least total relative error Most total relative error
Adapted from Cayan 2013
Southwestern United States
Building Coalitions
SCRIPPS Institute of Oceanography
U.S. Geological Survey
California Energy Commission UC Berkeley
Lawrence Livermore Lab
Santa Clara University
Lawrence Berkeley Lab UC Davis
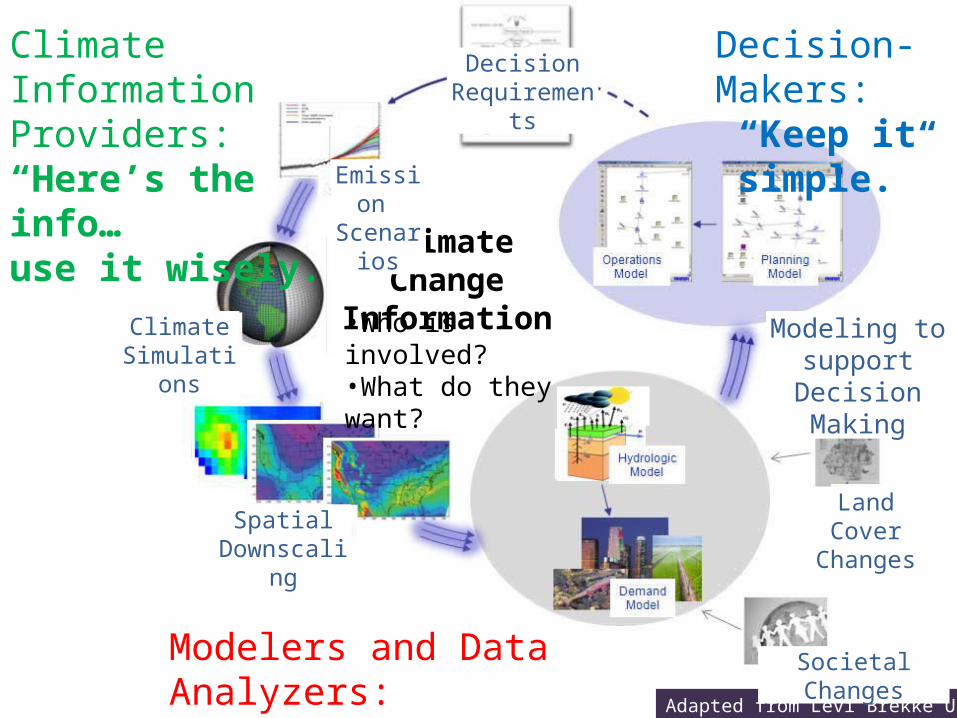
Decision-Makers: “Keep it simple.”
Climate Information Providers: “Here’s the info… use it wisely.”
Modelers and Data Analyzers: “Keep it manageable.”
Adapted from Levi Brekke USBR
Climate Change Information
•Who is involved?•What do they want?
Decision Requirements
Emission Scenarios
Climate Simulations
Spatial Downscaling
Modeling to support Decision
Making
Land Cover Changes
Societal Changes
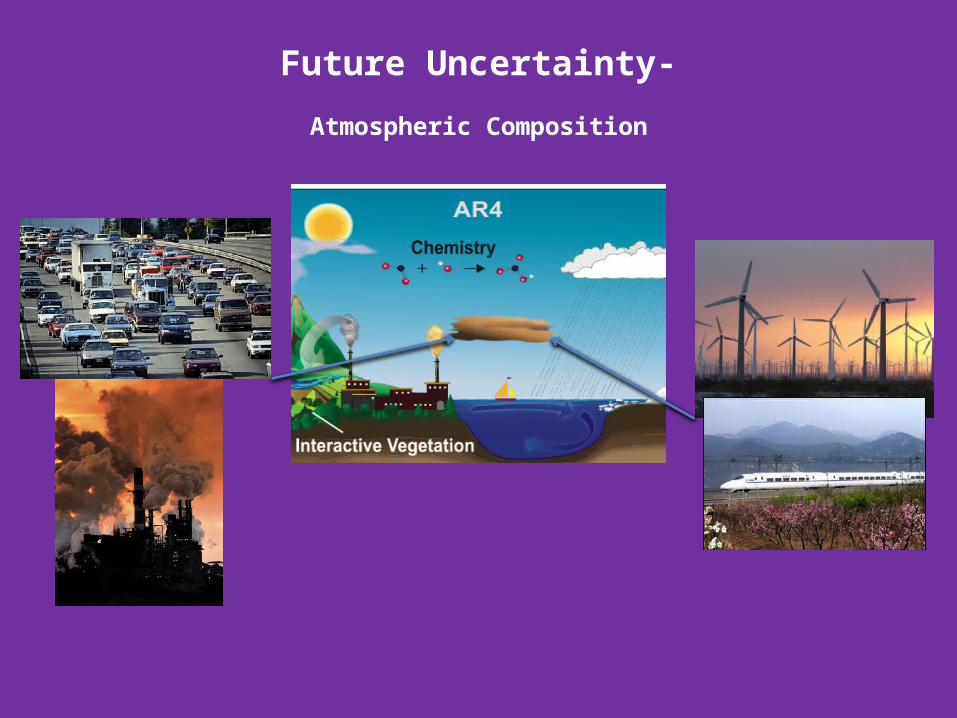
Future Uncertainty-
Atmospheric Composition
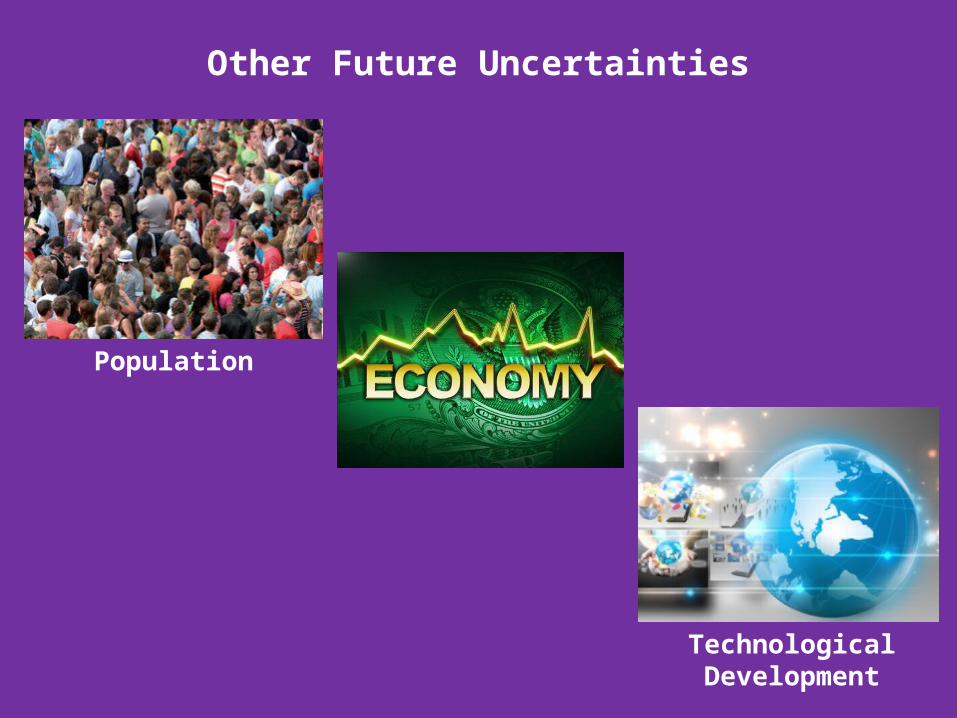
Other Future Uncertainties
Population
Technological Development
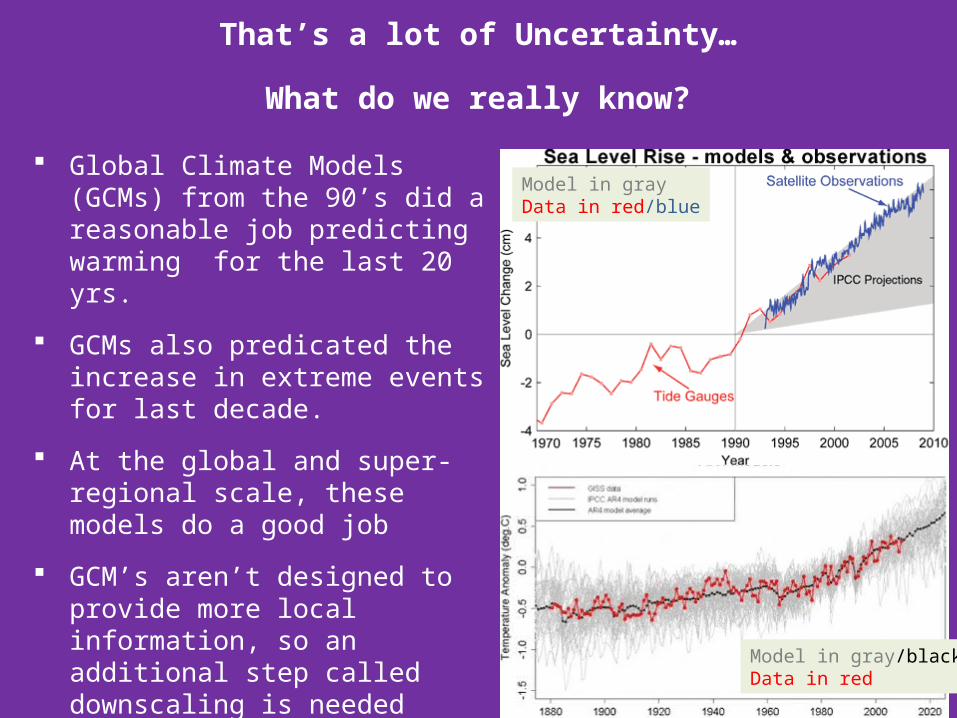
That’s a lot of Uncertainty…
What do we really know?
Global Climate Models (GCMs) from the 90’s did a reasonable job predicting warming for the last 20 yrs.
GCMs also predicated the increase in extreme events for last decade.
At the global and super-regional scale, these models do a good job
GCM’s aren’t designed to provide more local information, so an additional step called downscaling is needed
GCMs give us information that improves our future decision making capabilities
Model in grayData in red/blue
Model in gray/blackData in red