Embed Size (px)
Citation preview
Adv. Sci. Res., 6, 147–150, 2011www.adv-sci-res.net/6/147/2011/doi:10.5194/asr-6-147-2011© Author(s) 2011. CC Attribution 3.0 License.
History of Geo- and Space
SciencesOpen
Acc
ess
Advances in Science & ResearchOpen Access Proceedings
Drinking Water Engineering and ScienceO
pen A
cces
sO
pen A
cces
s Earth System
Science
Data
10thE
MS
AnnualM
eetingand
8thE
uropeanC
onferenceon
Applied
Clim
atology(E
CA
C)
2010
Climate indicators for Italy:calculation and dissemination
F. Desiato1, G. Fioravanti1, P. Fraschetti1, W. Perconti1, and A. Toreti1,2
1Istituto Superiore per la Protezione e la Ricerca Ambientale (ISPRA), Rome, Italy2Oeschger Centre for Climate Change Research (OCCR) and Institute of Geography, Climatology and
Meteorology, University of Bern, Bern, Switzerland
Received: 10 December 2010 – Revised: 30 March 2011 – Accepted: 10 May 2011 – Published: 23 May 2011
Abstract. In Italy, meteorological data necessary and useful for climate studies are collected, processed andarchived by a wide range of national and regional institutions. As a result, the density of the stations, thelength and frequency of the observations, the quality control procedures and the database structure vary fromone dataset to another. In order to maximize the use of those data for climate knowledge and climate changeassessments, a computerized system for the collection, quality control, calculation, regular update and rapiddissemination of climate indicators was developed. The products publicly available through a dedicated website are described, as well as an example of climate trends estimates over Italy, based on the application ofstatistical models on climate indicators from quality-checked and homogenised time series.
1 Introduction
In the context of the United Nations Framework Conventionon Climate Change (UNFCCC) and also at the level of Euro-pean policies, great attention is given to the issue of climatechange adaptation. The scientific community recognizes thatmeasures for mitigating greenhouse gases must be accompa-nied by programs of adaptation in order to reduce the risksand, whenever possible, take advantage of present and futureclimate change effects. As outlined by the Fourth IPCC As-sessment Report (IPCC, 2007), impacts due to global warm-ing, and more generally to climate change, are already evi-dent in many areas of the world. The Mediterranean regionis considered a hot spot of climate change (Diffenbaugh etal., 2007; Giorgi, 2006). Due to the specific characteristicsof this region, climate change may have wide-ranging im-pacts that affect socio-economic and production sectors (suchas energy, transport, agriculture and tourism) and the envi-ronment (including mountainous areas and forests, ecosys-tems and biodiversity, water resources, coastal areas and ma-rine environment) (e.g.IPCC, 2007; EEA, 2009; EEA-JRC-WHO, 2008). The impacts on human health are expected tobe relevant as well (e.g.WHO, 2008). The implementationand evaluation of potential adaptation strategies require ac-
Correspondence to:F. Desiato([email protected])
curate knowledge of climate and its variations at the localscale; in addition, the survey of the impacts related to spe-cific features and vulnerabilities of the territory, are needed.This state-of-the-art knowledge should also cover awarenessof the uncertainties of the impact estimates, and be contin-uously updated and clearly communicated to the stakehold-ers. Instrumental data represent a primary source of infor-mation about climate. They are usually archived at dailyor sub-daily scales by national and local meteorological net-works. Several data sets, which cover different time periods,are useful for the characterization of the recent past climateand its changes over Italy. The identification and estima-tion of trends in climate time series relies on climate datathat meet rigorous criteria of accuracy and temporal continu-ity. Climate trends may be responsible for different types ofimpact, already recognized or projected for the near future.Instrumental climate time series are also necessary for theassessment of climate model skill and consequently for tun-ing the adaptation strategies. In order to address these needsand to build a bridge between climate research and societalsectors involved in climate change impacts, the Italian Na-tional Institute for Environmental Protection and Research(ISPRA) has developed a computerized system called SCIA(www.scia.sinanet.apat.it). In the following sections, a de-scription of this project and its related products is provided.
Published by Copernicus Publications.
148 F. Desiato et al.: Climate indicators
Table 1. Main meteorological Italian networks and data sources.
Synoptic (GTS dissemination)
Air Force Weather Service from′50s–′60s ∼90 stationsENAV-Italian Company for air navigation services from′80s ∼40 stations
National Agrometeorological (Ministry of Agriculture)
Automatic from 1991 ∼40 stationsObservatories from 1860 ∼30 stations
Regional
Meteorological services from′90s few tens/regionHydrological/Civil Protection Network from′50s few tens/regionAgrometeorological services from′90s few tens/region
2 Data sources and climate indicators
In Italy, the meteorological data necessary and useful forclimate evaluations are collected, processed and archivedby a wide range of national and regional institutions (Ta-ble 1). They range from synoptic observations carried outby the national Air Force weather service and the civil avi-ation agency, to hourly measurements at automatic stationsby regional meteorological, hydro-meteorological and agro-meteorological networks. Therefore, the density of the sta-tions, the length and the frequency of the observations, thequality control procedures and the database structure varyfrom one data source to another. The SCIA system has beendeveloped in order to optimize the use of these data for cli-mate knowledge and climate change assessments. It is dedi-cated to the collection, quality control, calculation, regularupdate and dissemination of climate indicators, which re-flect the main statistical properties (mean values, intensityand date of occurrence of extreme events, standard devia-tion, etc.), at different time scales (i.e. 10-daily, monthly andyearly), of a wide range of meteorological variables: tem-perature, precipitation, humidity, wind, water balance, evap-otranspiration, degree-days, cloud cover, sea level pressureand solar radiation. All climate indicators are freely avail-able through the SCIA web site. Climatological values over30-yr reference periods (e.g. 1961–1990) are calculated andavailable as well. Today, the SCIA system is fed and up-dated once a year in collaboration with (and with the data of)the national Air Force weather service, the automatic stationsof the national agrometeorological network, the meteorolog-ical stations of the national Sea Service and twelve regionalenvironmental protection and agrometeorological agencies.Visitors of SCIA can extract, download and plot: (a) the timeseries of each climate indicator for each single station; (b) theclimate indicators for all the stations which are available in aselected time period; (c) the tables and/or the maps of climatenormals over standard climatological 30-yr periods. Through
SCIA, users can also access secondary products such as highresolution monthly temperature maps obtained by the appli-cation of spatial interpolation techniques (regression krig-ing). In order to guarantee the integration and comparison ofindicators obtained from different data sources, all the indica-tors undergo a common set of quality controls. The generalcriteria adopted for the calculation of the indicators followthe recommendations of the World Meteorological Organi-zation (WMO, 2010). Although the validity of input data isthe responsibility of each data provider, two classes of for-mal controls are applied to input data before the calculationof the climate indicators. In the first (weak climatologicalcontrols), each value must fall within a range delimited byminimum and maximum thresholds, representing the limitsfor physically acceptable data. In the second (internal consis-tency controls), the values of different variables at the sametime are checked for consistency; for example, air tempera-ture and dew point temperature are checked in order to verifythat the latter is not greater than the former.
3 Climate trends estimate
Climate statistics and indicators available through SCIA areused for climate trend recognition and estimation, which areneeded for climate impact and vulnerability assessments overItaly, and represent a part of the climate state chapter ofthe national communications to the UNFCCC. In order toget reliable trends estimates, it is necessary to control andeliminate wrong values from the series and filter out (or atleast reduce the influence of) eventual non-climatic signals(i.e. inhomogeneities), such as those due to station reloca-tion or change of meteorological instrumentation. For thisreason, time series undergo a number of suitable homogene-ity statistical procedures and they are homogenised when-ever one or more break points are identified (e.g.Aguilaret al., 2003; Kuglitsch et al., 2009). Then, the variation ofclimatic variables (in terms of differences or, in the case of
Adv. Sci. Res., 6, 147–150, 2011 www.adv-sci-res.net/6/147/2011/
F. Desiato et al.: Climate indicators 149
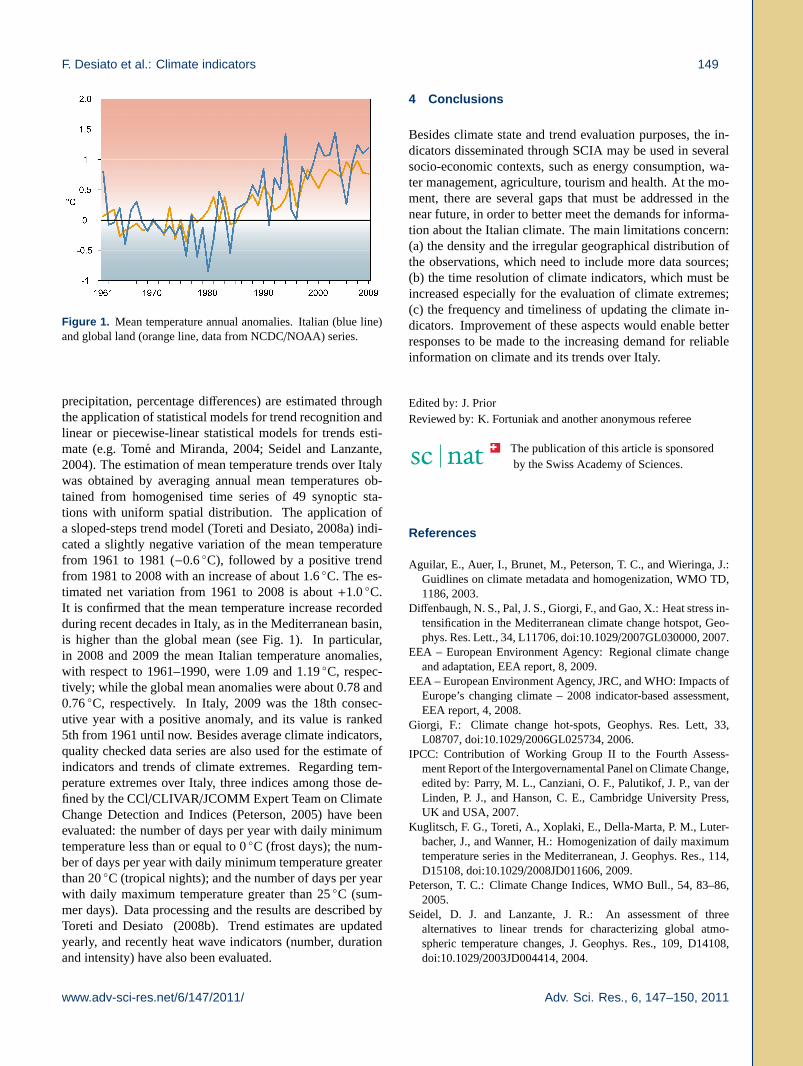
Figure 1. Mean temperature annual anomalies. Italian (blue line)and global land (orange line, data from NCDC/NOAA) series.
precipitation, percentage differences) are estimated throughthe application of statistical models for trend recognition andlinear or piecewise-linear statistical models for trends esti-mate (e.g.Tome and Miranda, 2004; Seidel and Lanzante,2004). The estimation of mean temperature trends over Italywas obtained by averaging annual mean temperatures ob-tained from homogenised time series of 49 synoptic sta-tions with uniform spatial distribution. The application ofa sloped-steps trend model (Toreti and Desiato, 2008a) indi-cated a slightly negative variation of the mean temperaturefrom 1961 to 1981 (−0.6◦C), followed by a positive trendfrom 1981 to 2008 with an increase of about 1.6◦C. The es-timated net variation from 1961 to 2008 is about+1.0◦C.It is confirmed that the mean temperature increase recordedduring recent decades in Italy, as in the Mediterranean basin,is higher than the global mean (see Fig. 1). In particular,in 2008 and 2009 the mean Italian temperature anomalies,with respect to 1961–1990, were 1.09 and 1.19◦C, respec-tively; while the global mean anomalies were about 0.78 and0.76◦C, respectively. In Italy, 2009 was the 18th consec-utive year with a positive anomaly, and its value is ranked5th from 1961 until now. Besides average climate indicators,quality checked data series are also used for the estimate ofindicators and trends of climate extremes. Regarding tem-perature extremes over Italy, three indices among those de-fined by the CCl/CLIVAR /JCOMM Expert Team on ClimateChange Detection and Indices (Peterson, 2005) have beenevaluated: the number of days per year with daily minimumtemperature less than or equal to 0◦C (frost days); the num-ber of days per year with daily minimum temperature greaterthan 20◦C (tropical nights); and the number of days per yearwith daily maximum temperature greater than 25◦C (sum-mer days). Data processing and the results are described byToreti and Desiato(2008b). Trend estimates are updatedyearly, and recently heat wave indicators (number, durationand intensity) have also been evaluated.
4 Conclusions
Besides climate state and trend evaluation purposes, the in-dicators disseminated through SCIA may be used in severalsocio-economic contexts, such as energy consumption, wa-ter management, agriculture, tourism and health. At the mo-ment, there are several gaps that must be addressed in thenear future, in order to better meet the demands for informa-tion about the Italian climate. The main limitations concern:(a) the density and the irregular geographical distribution ofthe observations, which need to include more data sources;(b) the time resolution of climate indicators, which must beincreased especially for the evaluation of climate extremes;(c) the frequency and timeliness of updating the climate in-dicators. Improvement of these aspects would enable betterresponses to be made to the increasing demand for reliableinformation on climate and its trends over Italy.
Edited by: J. PriorReviewed by: K. Fortuniak and another anonymous referee
The publication of this article is sponsoredby the Swiss Academy of Sciences.
References
Aguilar, E., Auer, I., Brunet, M., Peterson, T. C., and Wieringa, J.:Guidlines on climate metadata and homogenization, WMO TD,1186, 2003.
Diffenbaugh, N. S., Pal, J. S., Giorgi, F., and Gao, X.: Heat stress in-tensification in the Mediterranean climate change hotspot, Geo-phys. Res. Lett., 34, L11706,doi:10.1029/2007GL030000, 2007.
EEA – European Environment Agency: Regional climate changeand adaptation, EEA report, 8, 2009.
EEA – European Environment Agency, JRC, and WHO: Impacts ofEurope’s changing climate – 2008 indicator-based assessment,EEA report, 4, 2008.
Giorgi, F.: Climate change hot-spots, Geophys. Res. Lett, 33,L08707,doi:10.1029/2006GL025734, 2006.
IPCC: Contribution of Working Group II to the Fourth Assess-ment Report of the Intergovernamental Panel on Climate Change,edited by: Parry, M. L., Canziani, O. F., Palutikof, J. P., van derLinden, P. J., and Hanson, C. E., Cambridge University Press,UK and USA, 2007.
Kuglitsch, F. G., Toreti, A., Xoplaki, E., Della-Marta, P. M., Luter-bacher, J., and Wanner, H.: Homogenization of daily maximumtemperature series in the Mediterranean, J. Geophys. Res., 114,D15108,doi:10.1029/2008JD011606, 2009.
Peterson, T. C.: Climate Change Indices, WMO Bull., 54, 83–86,2005.
Seidel, D. J. and Lanzante, J. R.: An assessment of threealternatives to linear trends for characterizing global atmo-spheric temperature changes, J. Geophys. Res., 109, D14108,doi:10.1029/2003JD004414, 2004.
www.adv-sci-res.net/6/147/2011/ Adv. Sci. Res., 6, 147–150, 2011

150 F. Desiato et al.: Climate indicators
Tome, A. R. and Miranda, P. M. A.: Piecewise linear fitting andtrend changing points of climate parameters, Geophys. Res.Lett., 31, L02207,doi:10.1029/2003GL019100, 2004.
Toreti, A. and Desiato, F.: Temperature trend over Italy from 1961to 2004, Theor. Appl. Climatol., 91, 51–58, 2008a.
Toreti, A. and Desiato, F.: Changes in temperature extremes overItaly in the last 44 years, Int. J. Climatol., 28, 733–745, 2008b.
WHO – World Health Organization: Protecting health in Europefrom climate change, edited by: Menne, B., Apfel, F., Kovats,S., and Racioppi, F., 2008.
WMO – World Meteorological Organization: Guide to climatolog-ical practices, No. 100, 3 Edn., 2010.
Adv. Sci. Res., 6, 147–150, 2011 www.adv-sci-res.net/6/147/2011/