Embed Size (px)
Citation preview
Climate Graph Activity
A region’s biome is primarily determined by temperature and precipitation. In this activity you will use average climate data to create a climate graph and to predict vegetation type.
Climate diagrams are constructed in a specific way. See Fig 1 below.
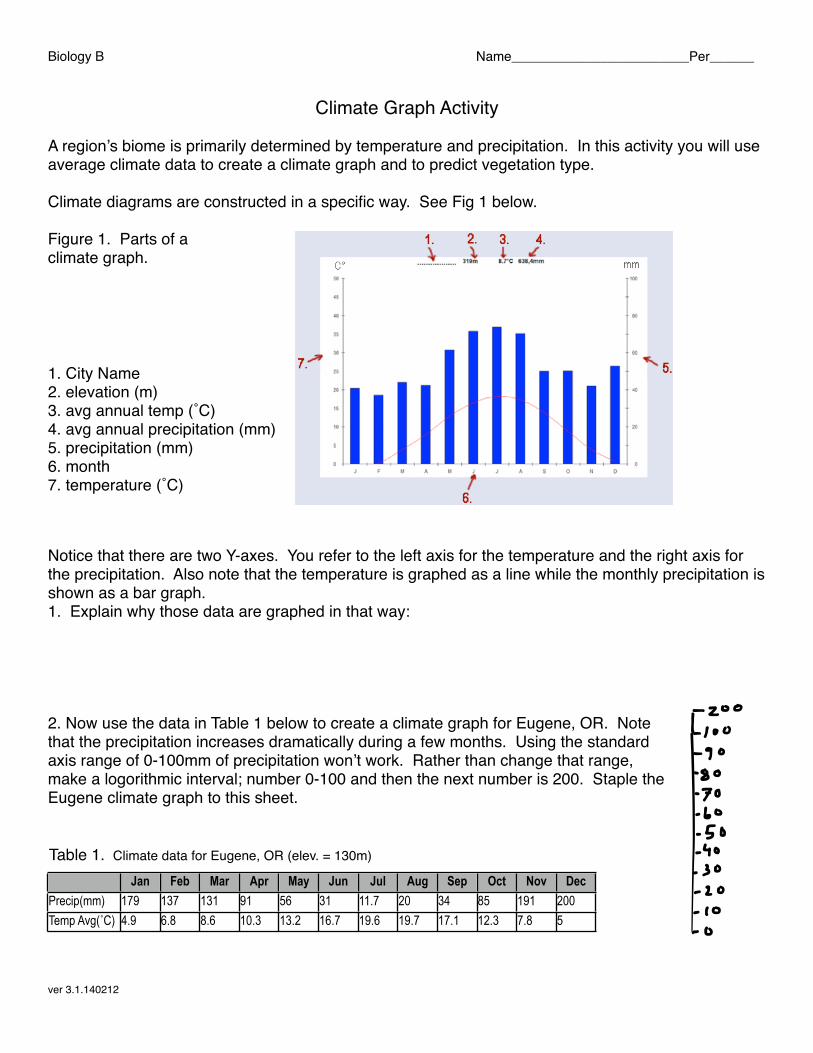
Figure 1. Parts of a climate graph.
1. City Name2. elevation (m)3. avg annual temp (˚C)4. avg annual precipitation (mm)5. precipitation (mm)6. month7. temperature (˚C)
Notice that there are two Y-axes. You refer to the left axis for the temperature and the right axis for the precipitation. Also note that the temperature is graphed as a line while the monthly precipitation is shown as a bar graph. 1. Explain why those data are graphed in that way:
2. Now use the data in Table 1 below to create a climate graph for Eugene, OR. Note that the precipitation increases dramatically during a few months. Using the standard axis range of 0-100mm of precipitation won’t work. Rather than change that range, make a logorithmic interval; number 0-100 and then the next number is 200. Staple the Eugene climate graph to this sheet.
Jan Feb Mar Apr May Jun Jul Aug Sep Oct Nov DecPrecip(mm) 179 137 131 91 56 31 11.7 20 34 85 191 200Temp Avg(˚C) 4.9 6.8 8.6 10.3 13.2 16.7 19.6 19.7 17.1 12.3 7.8 5
Table 1. Climate data for Eugene, OR (elev. = 130m)
Biology B ! Name________________________Per______
ver 3.1.140212

Examine the climate graphs below. (they use a different, non-standard set of axes, so you will need to be careful about comparing the temperature and precipitation values.)
Van Win
3. Describe the difference in monthly temperatures between the cities:
4. Describe the difference in monthly precipitation between the cities:
5. Refer to the map above. What about the geographic features surrounding the cities might explain the climate differences?
Biology B ! Name________________________Per______
ver 3.1.140212
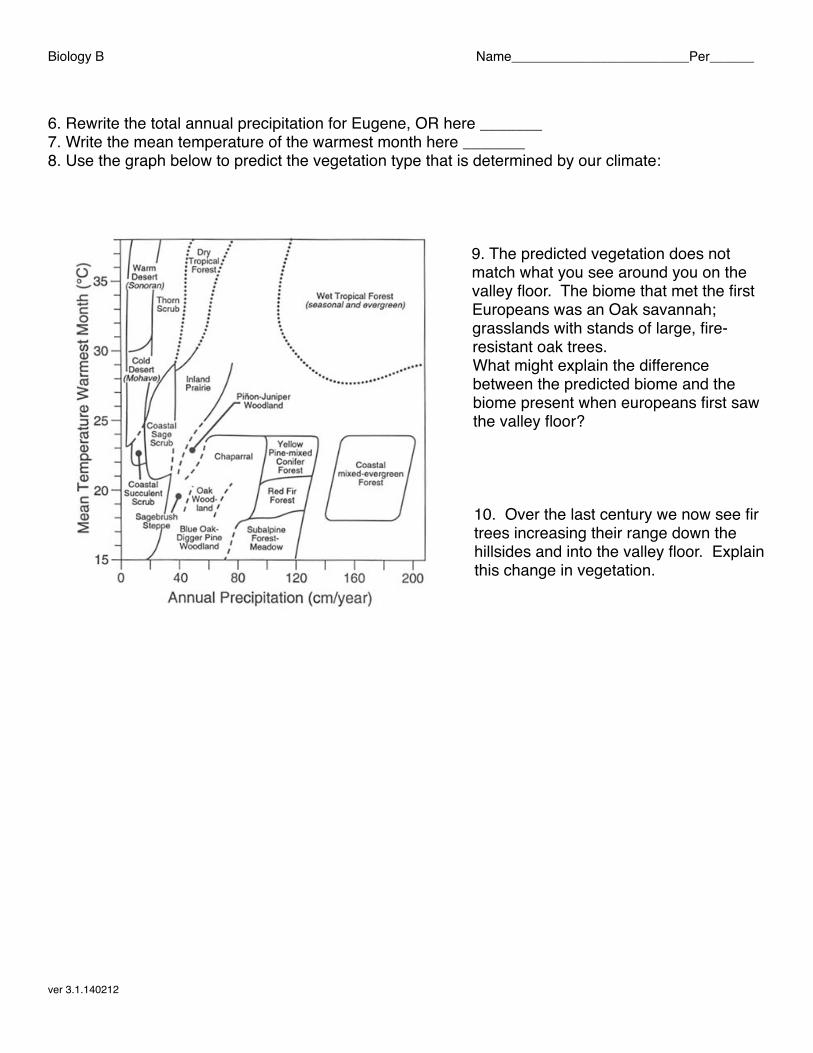
6. Rewrite the total annual precipitation for Eugene, OR here _______7. Write the mean temperature of the warmest month here _______8. Use the graph below to predict the vegetation type that is determined by our climate:
9. The predicted vegetation does not match what you see around you on the valley floor. The biome that met the first Europeans was an Oak savannah; grasslands with stands of large, fire-resistant oak trees. What might explain the difference between the predicted biome and the biome present when europeans first saw the valley floor?
10. Over the last century we now see fir trees increasing their range down the hillsides and into the valley floor. Explain this change in vegetation.
Biology B ! Name________________________Per______
ver 3.1.140212
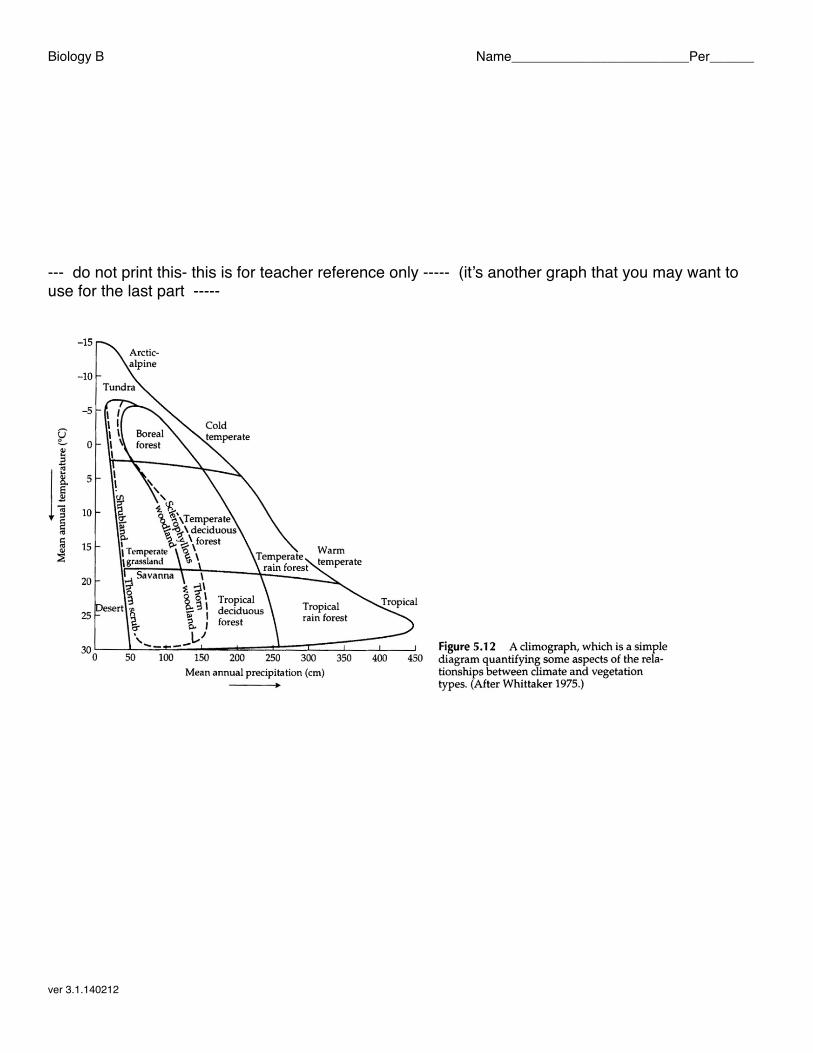
--- do not print this- this is for teacher reference only ----- (it’s another graph that you may want to use for the last part -----
Biology B ! Name________________________Per______
ver 3.1.140212

Biology B ! Name________________________Per______
ver 3.1.140212

The climograph predicts a sclerophyll woodland, which is a midlatitude, Mediterranean type of forest, like a chapparral.
See:
http://www.uwsp.edu/geo/faculty/ritter/geog101/textbook/biogeography/biomes_midlatitude_forests_page_1.html
Midlatitude Forests
Mediterranean Woodland The Mediterranean woodland is a sclerophyll forest consisting of low branching trees with small hard eaves and gnarled thick bark. The Mediterranean Woodland is found on west coast of continents in the midlatitudes and bordering the Mediterranean Sea, in close association with the Mediterranean (Dry Summer Subtropical) climate. Mediterranean woodland in North America is found along much of coastal southern California. Thick bark and small, waxy leaves are two adaptations to prevent excessive loss of moisture during the severe summer drought experienced in the dry summer subtropical climate. Chaparral vegetation grows to a height of 1 to 3 meters and has leathery leaves to prevent moisture loss. Chaparral is adapted to wildfires common in this environment (see below). Canopy of the typically hardwood, evergreen vegetation covers about 25 to 60 % of the terrain. The sparseness of the vegetative cover is due to the severe summer moisture stress and human disturbance.
Biology B ! Name________________________Per______
ver 3.1.140212


![Zimbra - blogs.4j.lane.edublogs.4j.lane.edu/piowaty/files/2018/08/Zimbra.pdfZimbra piowaty_t@4j.lane.edu [princi_elem] Fwd: Get TumbleMath for Free---until November 30. Thu, Aug 16,](https://img.pdfslide.us/doc/110x75/5ce5dff888c993812f8bb5f6/zimbra-blogs4jlaneedublogs4jlaneedupiowatyfiles201808-piowatyt4jlaneedu.jpg)