Embed Size (px)
Citation preview

ORIGINAL ARTICLE
Climate change/variability implications on hydroelectricitygeneration in the Zambezi River Basin
Francis Davison Yamba & Hartley Walimwipi &Suman Jain & Peter Zhou & Boaventura Cuamba &
Cornelius Mzezewa
Received: 13 January 2011 /Accepted: 13 January 2011 /Published online: 23 June 2011# The Author(s) 2011. This article is published with open access at Springerlink.com
Abstract The study has analysed the effects of various factors on hydroelectric powergeneration potential to include climate change/variability, water demand, and installation ofproposed hydroelectric power schemes in the Zambezi River Basin. An assessment ofhistorical (1970–2000) power potential in relation to climate change/variability at existinghydro electric power schemes(Cahora Bassa, Kariba, Kafue Gorge and Itezhi-Tezhi) in theZambezi River Basin was conducted. The correlation of hydroelectric power potential withclimate change/variability aimed at observing the link and extent of influence of the latteron the former was investigated. In order to predict the future outlook of hydro electricpower potential, General Circulation Models (GCM) were used to generate projectedprecipitation. The monthly simulated precipitation was extracted from the GCM for everysub basin and used to compute future precipitation. Further, future water demand in the subbasins of the Zambezi River Basin were estimated based on the respective populationgrowth rate in each sub basin. Subsequently, water balance model, with projectedprecipitation and water demand input was used to determine projected run-offs of subbasins of the Zambezi River Basin. .Based on the projected run-offs of sub basins, reservoir
Mitig Adapt Strateg Glob Change (2011) 16:617–628DOI 10.1007/s11027-011-9283-0
F. D. Yamba (*) :H. WalimwipiCEEEZ-Centre for Energy, Environment and Engineering Zambia, Private Bag E 721, 176 ParirenyatwaRoad, Suite B, Lusaka, Zambiae-mail: [email protected]
S. JainDepartment of Mathematics and Statistics, University of Zambia, P.O. Box 32379, Lusaka, Zambiae-mail: [email protected]
P. ZhouEnergy, Environment, Computing and Geophysical Applications(EECG), Gaborone, Botswanae-mail: [email protected]
B. CuambaDepartment of Physics, Eduardo Mondlane University, Maputo, Mozambiquee-mail: [email protected]
C. MzezewaEnerConsult Pvt Ltd, 21a Wilson Drive, P.O. Amby Greendale, Harare, Zimbabwee-mail: [email protected]

storage capacities at existing hydro electric power schemes were estimated. The baselineassessment revealed a strong relationship between hydroelectric power potential andclimate change/variability. The study also revealed that the main climate and other risksassociated with current and future hydro electric power generation include projected dryyears, floods and increasing water demand. The results indicate that the hydroelectric powerpotential has a tendency towards gradual reduction in its potential in all existing andproposed hydroelectric power schemes owing to climate change and increasing waterdemand.
Keywords Climate change . Variability . Vulnerability . Adaptation . Hydroelectric . Powergeneration . Climate risk
1 Introduction
Although a great deal of research has been undertaken in global climate change world wide,very few studies have focused on specific regions. Studies are now emerging, which placeemphasis on continental regions. For example, a recent study (Engelbrecht 2009)investigated the effects of increased greenhouse gas (GHG) emissions on the SouthernAfrican region’s weather systems with emphasis on the influence of rainfall andtemperature on water resources and agriculture. Further, studies (Arnel 2004) haveinvestigated the implications of climate change on run-off in major regions of Africa.Although hydroelectricity contributes moderately to the energy supply of Southern Africa,few studies have examined the impacts of climate change on hydroelectricity supply in theregion (Warren et al. 2006).
The study reported in this article was supported by Eskom Holdings Limited, SouthAfrica under its Global and Regional Climate Change Impact Research portfolio. It assessesclimate change/variability implications on hydroelectricity generation at the existing andproposed future hydro power stations in the Zambezi River Basin. In the recent past, astudy (Harrison and Whittingtone 2002) has been undertaken focusing on the impact ofclimate change on the proposed Batoka gorge hydroelectric scheme in the Zambezi RiverBasin.
2 Study background
It is evident from recent drought occurrences in the Southern Africa DevelopmentCommunity(SADC) region (ECZ 2001) that there was a deficiency of water during thedrought period 1991, which consequently affected hydropower generation and resulted inload shedding in most affected countries.It is also clear that there is enough historicalevidence of the persistent occurrences of droughts. According to Intergovernmental Panelon Climate Change (IPCC) Third Assessment Report (AR3, 2001), water resources are akey area of vulnerability in Africa, affecting water supply for household use, agricultureand industry including hydroelectric power generation. The report states that Africa is thecontinent with the lowest conversion of precipitation to run off, averaging only 15% perannum.
The report concludes that most of Africa has invested significantly in hydro-electricpower facilities. Reservoir storage in these facilities shows marked sensitivity to variationsin run off and periods of droughts. This reservoir storage and the major dams in the region
618 Mitig Adapt Strateg Glob Change (2011) 16:617–628

have reached critical levels threatening industrial activities. Model results of somereservoirs and lakes indicate that global warming will increase the frequency of such lowlevels of storage as a result of drought conditions (IPCC 2001).
In view of recent historical data on persistently occurring droughts in the region, andthe implications for hydroelectric generation, the study aimed at assessing the potentialimpacts of climate change on run-off and consequently hydroelectric generation in theZambezi River. The effects of climate change on river flows are uncertain, but anysignificant changes would have implications for hydroelectric generation. Climate changecould affect the water level and seasonality in rivers which could affect the amount ofelectricity produced annually by hydro electric means and the timing of power production(ECZ 2001).
The Zambezi River Basin is the fourth-largest river basin of Africa, after the Congo/Zaire, Nile and Niger Basins(FAO 2004). Its total area represents about 4.5% of the area ofthe continent and spreads over eight countries namely; Malawi, Mozambique, Zimbabwe,Zambia, Angola, Botswana, Namibia, and Tanzania as shown in Fig. 1. The Zambezi Riverflows eastwards for about 3,000 km from its sources in Kalene Hills, Northwestern Zambiato the Indian Ocean, and consist of 13 main river basins namely, Barotse, Cuando/Chobe,Kabompo, Kafue, Kariba, Lwanginga, Luangwa, Lungwe Bungo, Mupata, Shire/LakeMalawi, Tete, Upper Zambezi and the Zambezi Delta.
This study was undertaken by a multi disciplinary research team, to assess the potentialimpacts of climate change/variability on run-off, reservoir storage capacities andhydropower potential for both baseline (1970–2000) and projected (2010–2070) periods,and suggest corresponding adaptation/mitigation measures.
3 Methodology
The potential of the Zambezi River Basin was assessed for its capacity to supply bothexisting and projected hydropower requirements against projected climate change andvariability. This required a definition of the Zambezi River Basin with respect to boundariesof main and sub basins, sub basin characteristics, and identification of major existing/planned hydro electric power schemes and their respective characteristics. Sub basinscharacteristic included; surface area and number of meteorological stations, water demandand number of gauging stations while hydroelectric power schemes characteristics includedreservoir storage capacities, head, surface area and power potential. Once definition wasaccomplished, modelling and network formulation of the Zambezi River Basin wasconducted based on the water balance model (Pitman’s model) or Water ResourceSimulation Model (WRSM2000)(WRSM 2000), which is software used to simulatehydrological systems.WRSM2000 is of a modular construction, with four different types ofmodules(run-off, channel reach, reservoir and irrigation) linked by means of routes. Therun-off module is the heart of WRSM2000.
Prior to utilisation of the WRSM 2000, calibration was undertaken for the purpose ofadjusting the ground flow parameters based on baseline (1970–2000) historical data.Baseline historical data included, evapo-transpiration, reservoir storage capacities, surfacearea, rainfall, river flows, and water demand. In addition, pan factors were taken intoaccount as input. This enabled the user to adopt pan-factor figures, provided suitable “cropfactors” were available for natural vegetation. The growth of afforestation and imperviousareas was represented by reading in values for up to ten different years. Ground flowparameters were built into the program and were adjusted accordingly during calibration.
Mitig Adapt Strateg Glob Change (2011) 16:617–628 619

Upon calibration, the water balance model was used to generate projected river flowsand reservoir storage capacities based on projected rainfall data (generated from GCMmodels) and water demand(generated using algorithms). This was followed by anassessment of the impacts of the projected run-off on storage capacity and hydroelectricpower potential.
3.1 Definition of Zambezi river basin-
The Zambezi Basin is located between a latitude of 8° to 20° South, and a longitude ofbetween 16.5° to 36° East draining an area of about 1.385 million km2. It covers about 25%of the total area of its 8 riparian states (Fig. 1) comprising of Angola, Botswana, Malawi,Mozambique, Namibia, Tanzania, Zambia and Zimbabwe. The Zambezi River rises on thecentral African plateau in the Kalene hills in North Western Zambia at 1,585 m above sealevel, flowing to the delta in Mozambique before draining into the Indian Ocean (FAO2004).
The existing hydropower facilities considered under the study included Kafue Gorge,Itezhi-Tezhi, Lake Kariba between Zambia and Zimbabwe and Cahora Bassa inMozambique. Further, proposed hydroelectric scheme sites were studied, and theseincluded the Batoka and Mupata Gorges on the Zambia/Zimbabwe Zambezi riverboundaries (Fig. 2) and Mepanda Uncua in Mozambique.
3.2 Modelling and networking formulation
In order to model the Zambezi River Basin, various hydrological features and other featuresrelevant to the study in the Zambezi River Basin were identified. These features includemain reservoirs, main tributaries, irrigated areas, surface water abstraction etc. Modellingwas performed for the baseline scenario, depicting existing features, as well as the projectedscenario depicting both existing and proposed hydropower schemes.
The modelling process involved (a) identification and location of hydrological features(main reservoirs, main tributaries), (b) determination of sub basin boundaries and their
Source: Zambezi River Authority
Zambezi River Basin Boundary
Lakes
Ocean
Flood plains/swamps
Rivers
International boundaries
Industrial towns
Nations
Fig. 1 Zambezi basin river systems
620 Mitig Adapt Strateg Glob Change (2011) 16:617–628

respective catchment areas, (c) identification and location of other relevant features to waterbalance modelling (i.e. irrigated areas, water abstraction for towns and industries) and, (d)identification and location of gauging stations on tributaries of the Zambezi River Basin.This was followed by drawing of the network diagram containing the above mentionedfeatures. Ultimately, a network was created in the WRSM 2000 software based on thenetwork diagram consisting of routes and run-off, channel reach, and irrigation modules(Appendix 1).
3.3 Assessment of water demand
In this study, proportion of water use for irrigation, domestic, industrial and commercialactivities was estimated and served as input into the water balance model for the purpose ofits calibration in the baseline scenario.
3.4 Precipitation GCM scenarios
Precipitation scenarios were generated using the following general circulation models:
& CCCMA–second version of the Canadian Global Coupled model run by the CanadianCentre for Climate Modeling and Analysis (CCCMA) on the resolution of longitude3.75° and latitude 3.68°
& CSIRO Mk2–run by the Commonwealth Scientific Industrial Research Organisationbased in Australia on resolution of longitude 5.61° and latitudes 3.14° (625 km by350 km)
Fig. 2 Schematic layout of the actual proposed and existing hydroelectric power schemes
Mitig Adapt Strateg Glob Change (2011) 16:617–628 621

& HADCM3 run by the Hadley Center in UK on resolution of longitude 3.75° and latitude2.5°.
The precipitation scenarios were generated using the daily precipitation (mm/day) datafrom the above three models under GHG emissions IPCC scenario SRES A2. The A2storyline assumes a world in which the emphasis is on local solution to economic, social,and environmental sustainability. It is a heterogeneous world with less rapid, and morediverse technological development but with a strong emphasis on community initiative andsocial innovation to find local, rather than global solutions (IPCC 2001).
Thirty (30) years monthly precipitation time series for the periods 2010 to 2040 and2040 to 2070 for every sub basin was generated using Eq. 1. The precipitation data for eachsub basin was extracted by obtaining baseline time series (O) of monthly total precipitationfor each sub basin in the period 1970 to 2000 from Meteorological Departments in theregion (Malawi, Mozambique, Zambia and Zimbabwe). This was then followed byextracting HADCM3, CCCMA, CSIRO precipitation data for the control period 1970–2000 (C) and results from the former and the latter were compared closely. Based on thiscorrelation, future periods (F1) 2010–2040 and (F2) 2040 to 2070 for grid boxes with sizesrelative to the sub basins were carried out. The respective extracted gridded data for control(C) and future (F) from HADCM3, CCCMA, CSIRO were averaged to obtain the overallcontrol (C) and future (F) values. The overall (averaged) control (C) and future (F) datawere then used to determine the future monthly precipitation (Eq. 1) and provided inputinto the water balance model.
Pp ¼ Oþ F � C
C
� �ð1Þ
Pp Projected precipitation (monthly)O baseline (observed) time seriesF future gridded dataC control
From the GCMs grid data projections, future monthly rainfall values were generatedfor the period 2010–2070 together with their respective anomalies. The generated meanmonthly rainfall from the GCMs for the control period were observed to be oscillatingaround the measured historical monthly mean. In some cases, the departure of thegenerated monthly mean from historical monthly mean was considerably high for each ofthe GCM used. Figure 3 representing one of the sub basins shows a comparison ofobserved and modelled monthly means for the period 1970–2000 for the three GCMmodels considered.
Because of the anomalies pointed out above, confidence can not be based on theresults from one single GCM. The trend and magnitude of the average of the monthlymean precipitation for CCCMA, CSIRO and HADCM3 for the control period wasfound to generally characterize the observed monthly mean precipitation as shown inFig. 4.
3.5 Use of water balance model
Water balance modelling depends on hydro-meteorological data and surface water run-offconditions in catchment areas. The Water Resource Simulation Model 2000 (WRSM 2000)
622 Mitig Adapt Strateg Glob Change (2011) 16:617–628

was used to determine surface and sub-surface run-off (Q) after accounting for evapo-transpiration losses, soil moisture and groundwater flows based on Eq. 2.
P ¼ Qþ E � S � G ð2Þ
P precipitation or rainfallQ surface and subsurface run-offE evapo-transpiration lossesS change in soil moistureG change in groundwater, (Pitman, 2001)
Prior to carrying out projected run-off simulations, calibration of the WRSM wasconducted. During calibration, the model parameters were adjusted by trial and error processtill the model indicators closely reproduced the observed stream flow at various gaugingstations on the tributaries of the Zambezi River. The model parameters included: power of soilmoisture/subsurface flow equation(POW), soil moisture state when subsurface flow=0(SL),soil moisture capacity in mm(ST), subsurface flow at soil moisture capacity (FT), maximumgroundwater flow in mm/month (GW), minimum catchment absorption in mm/month(ZMIN), maximum catchment absorption in mm/month (ZMAX), interception storage in mm(PI), lag of flow (excluding groundwater (TL), lag of groundwater flow in months (GL) andCoefficient in evaporation/soil moisture equation (R).
The model indicators were; mean annual runoff (MAR), standard deviation of annualflows (S), coefficient of variability (S/Mar), coefficient. of skewness, autocorrelationcoefficient of annual flows, mean of logs of annual flows, standard deviation of logs of
Fig. 4 Station and model aver-aged monthly means for 1970–2000 for Kabompo
Fig. 3 Observed and modelmonthly means for the period1970–2000 for Kabompo
Mitig Adapt Strateg Glob Change (2011) 16:617–628 623

annual flows and seasonal index variability,. To close up difference among the simulatedand observed indicators, calibration parameters were adjusted until a satisfactory Equivalentwas reached. Shown on Fig. 5 is the model calibration for one of the gauging stations(Watopa on Kabompo sub basin).
With this confidence level, the water balance model was then used to assess projectedrun-off on all the sub basins and their effects on reservoir storage capacities andhydroelectric potential for existing and planned hydroelectric schemes. Given on Fig. 6 isprojected runoff for one of the sub basins.
3.6 Use of water demand
In this study, water demand forecasting for each sub basin was done based on baselinewater demand and growth rate. In the SADC region, water demand is projected to rise by atleast 3% annually until the year 2020, a rate nearly equal to the region's population growthrate (UNEP 2006). This was used as a basis to forecast water demand for each sub basin ofthe Zambezi Basin.
3.7 Effects of installation of proposed power stations on run-off
The effects of installation of proposed new power stations on run-off are determined usingthe water balance model equation developed earlier. Except in this case, consideration is
YEARLY HYDROGRAPHS
HYDROLOGICAL YEAR
ANNUAL FLOW - Mm³
1970 1975 1980 1985 1990 19950
500
1000
1500
2000
2500
3000
3500
4000
4500 Observed
Simulated
ROUTE NO. 2 (Watopa)
WRSM 2000
2004/12/24 Record Period: 1970 - 1999
Fig. 5 Simulated and observedstream flow at Watopa gaugingstation on Kabompo sub basin
Fig. 6 Projected run-off trendsfor Kabompo sub basin
624 Mitig Adapt Strateg Glob Change (2011) 16:617–628

taken of increased losses due to the same effects especially evapo-transpiration losses dueto increase of new surface areas of the new installed infrastructure.
3.8 Calculation of hydroelectric power potential for Itezhi-Tezhi, Lake Kariba, and CaboraBassa
The projected theoretical power potential was assumed as the gross hydropower potential. Itwas estimated from a knowledge of the effective head of the each of the reservoir dams ,annual run-off entering the reservoirs, density of the water and the gravitational force asgiven in the Eq. 3.
PGross ¼ rWATER»g»HGROSS»Q
106ð3Þ
PGross gross power (MW)ρWATER density of water (kg/m3)G acceleration due to gravity (m2/s)HGROSS gross head (m)Q annual run-off into the reservoir (m3/s)
4 Results
To determine the gross theoretical projected hydroelectric power potential on the majorhydroelectric schemes, namely the Itezhi-Tezhi, Lake Kariba and Cabora Bassa required theeffects of run-off and water demand to be taken into account. Run-off was determined usingGCM models which generated monthly precipitation under the projected scenariofrom2010 to 2070. Figures 7 and 8 show existing (Itezhi-Tezhi, Lake Kariba, CahoraBassa) and proposed (Mepanda Uncua) gross theoretical hydroelectric power potential.
It is evident from results obtained that hydroelectric power potential has a tendencytowards a gradual reduction for all the hydroelectric power schemes, both existing and
Fig. 7 Gross theoretical hydroelectric power potential for Itezhi-Tezhi and Lake Kariba
Mitig Adapt Strateg Glob Change (2011) 16:617–628 625
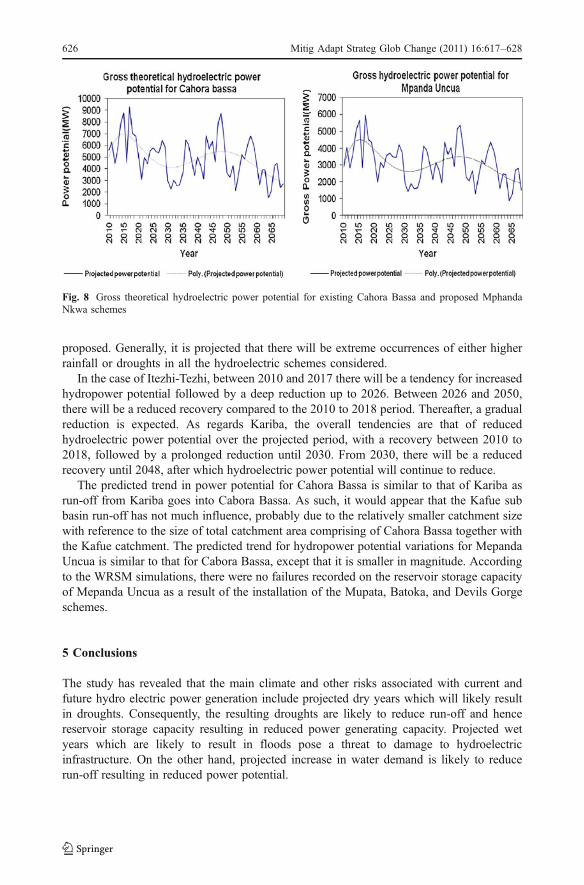
proposed. Generally, it is projected that there will be extreme occurrences of either higherrainfall or droughts in all the hydroelectric schemes considered.
In the case of Itezhi-Tezhi, between 2010 and 2017 there will be a tendency for increasedhydropower potential followed by a deep reduction up to 2026. Between 2026 and 2050,there will be a reduced recovery compared to the 2010 to 2018 period. Thereafter, a gradualreduction is expected. As regards Kariba, the overall tendencies are that of reducedhydroelectric power potential over the projected period, with a recovery between 2010 to2018, followed by a prolonged reduction until 2030. From 2030, there will be a reducedrecovery until 2048, after which hydroelectric power potential will continue to reduce.
The predicted trend in power potential for Cahora Bassa is similar to that of Kariba asrun-off from Kariba goes into Cabora Bassa. As such, it would appear that the Kafue subbasin run-off has not much influence, probably due to the relatively smaller catchment sizewith reference to the size of total catchment area comprising of Cahora Bassa together withthe Kafue catchment. The predicted trend for hydropower potential variations for MepandaUncua is similar to that for Cabora Bassa, except that it is smaller in magnitude. Accordingto the WRSM simulations, there were no failures recorded on the reservoir storage capacityof Mepanda Uncua as a result of the installation of the Mupata, Batoka, and Devils Gorgeschemes.
5 Conclusions
The study has revealed that the main climate and other risks associated with current andfuture hydro electric power generation include projected dry years which will likely resultin droughts. Consequently, the resulting droughts are likely to reduce run-off and hencereservoir storage capacity resulting in reduced power generating capacity. Projected wetyears which are likely to result in floods pose a threat to damage to hydroelectricinfrastructure. On the other hand, projected increase in water demand is likely to reducerun-off resulting in reduced power potential.
Fig. 8 Gross theoretical hydroelectric power potential for existing Cahora Bassa and proposed MphandaNkwa schemes
626 Mitig Adapt Strateg Glob Change (2011) 16:617–628

To mitigate against such risks, the following are being suggested; inter-basin watertransfers, regional integration of electricity infrastructure from hydro to include biomasssources, use of alternative energy sources and effective water management. During dryepisodes, inter-basin transfers can help mitigate the water shortfall needed for powergeneration in sub basins that contain hydropower installations. These basin transfers willallow some schemes to mainly run and operate as run-of-river schemes. This will allowstorage at Kariba, Itezhi-Tezhi and Cahora Bassa for use in the dry seasons. Transferswill be more economical in cases where it is not possible to generate electricity on site.From the foregoing analysis, it is very clear that Zambian River systems have the biggestpotential for hydroelectric power generation and most transfer schemes appear feasible(Tumbare et al. 2000).
Regional integration of hydroelectricity electricity infrastructure to include natural gasand biomass sources has also greatest potential in providing electricity to the SAPP region.With the existence of SAPP, this development is possible. For hydro sources, it isimportant that regional projects such as Kafue Lower and Itezhi-Tezhi in Zambia,rehabilitation of existing Inga in the Congo DR, and development of natural gas powerstations in Mozambique, Namibia and South Africa are considered as part of the adaptationstrategy. In the long term, the grand Inga scheme should be considered as a vision for thefuture, since it lies in a different basin (Congo River basin) which is termed to be rich inwater resources.
Apart from considering hydro based power stations on a regional basis, which can beregarded as renewable, other alternative energy resources include the following; pumpedstorage electricity generation, which involves use of pumped storage schemes to generateelectricity on a continuous basis at selected hydropower stations, and biomass in the formof agriculture and forest wastes. Biomass is a large resource in Southern Africa, which canbe converted into fuels for electricity generation either as isolated schemes or feeding intothe SAPP grid. Other measures include effective integrated water management system inview of the expected increase in water demand in the Zambezi River Basin and energyefficiency and early warning systems.
Acknowledgements The authors would like to sincerely thank ESKOM for providing advice and financialsupport which has enabled successful completion of this study under the leadership of Centre for Energy,Environment and Engineering Zambia (CEEEZ). During the period of the study we received not onlyfinancial support but also very useful critique from ESKOM’s technical experts that helped us to guide, shapeand focus the direction of the study and enabled us to avoid many mistakes. We apologise for not being ableto mention the names of all them. Special thanks go to Maria Couto, Clive Turner, Neil Snow, Siven Naidooand Sanjiv Kalicharan.
CEEEZ wishes to recognise the invaluable contribution of the team members in this study. The teamcomprised of the following: Prof F.D Yamba, Dr P. Zhou, Dr B. Cuamba, Mr C, Mzezewa, Mr C .Chikusa,Mr L. Nyahuma, Mrs S. Jain, Mr H. Walimwipi, and Mr G. Phiri.
We also wish to extend our gratitude to organisations and institutions that contributed to the success of thisstudy. We are indebted to Zesco, Zambezi River Authority (ZRA), Meteorological and Water AffairsDepartments (i.e in Zambia, Malawi, Mozambique and Zimbabwe), for providing us with useful data utilisedin this study.
Open Access This article is distributed under the terms of the Creative Commons AttributionNoncommercial License which permits any noncommercial use, distribution, and reproduction in anymedium, provided the original author(s) and source are credited.
Mitig Adapt Strateg Glob Change (2011) 16:617–628 627

APPENDIX 1
References
Arnel NW (2004) Climate change and global water resources, SRES emissions and social economicscenarios. Glob Environ Change 14:31–51
Environmental Council of Zambia (ECZ) (2001) State of the Environment in ZambiaEngelbrecht F (2009) Climate Simulation of Southern African Region. Published Morrison, L, in
Engineering News-Volume 29 Number 2 ISSN 02 57 8646 January 23–29 2009FAO Corporate Document Repository (2004) http://www.fao.org/Harrison G, Whittingtone P (2002) Susceptibility of the Batoka Gorge hydroelectric scheme to climate
change. J Hydrol 264(1–4):230–241IPCC (2001) IPCC Synthesis Third Assessment ReportUNEP (2006) Net. Water resources; WWW.UNEP.Net/Africa/freshwater, the Environment NetworkWarren RN, Nicholls R, Levy P, Price J (2006) Understanding of regional impacts of climate change,
Research Report prepared for the Stern Review on Economics of climate change, Tyndal Centre forClimate Change Research, Working Paper number 90, UEA, Norwich, p 221
Tumbare, et al. (2000) Management of river basins and dams: the Zambezi River BasinWRSM (2000) Water resource simulation model operation manual
RU3
RU
4
RU23 2
RU
5
RU6
6
RR
3
5
81
RU9
RU10
CR5
14
RU
7
RU8
17
16
CR6
CR
825
2322
20
CR9
RU
12
20
27
RU15
28
RU
14
CR10 CR11
41
40
6943
42
91
30
RU17 RU20 RU22
22 35
36
46
RU16
45
RU19
31
34
RU21
80
18
47
21
19
12
Fig. 9 Baseline network diagram
628 Mitig Adapt Strateg Glob Change (2011) 16:617–628