Embed Size (px)
Citation preview

Increasing Variability in SAIDI andImplications for Identifying
Major Events Days
Joseph H. EtoKristina H. LaCommare & Michael D. Sohn
Lawrence Berkeley National [email protected] | (510) 486-7284
IEEE Power & Energy Society General Meeting 2014July 30, 2014
National Harbor, MD
Background
2
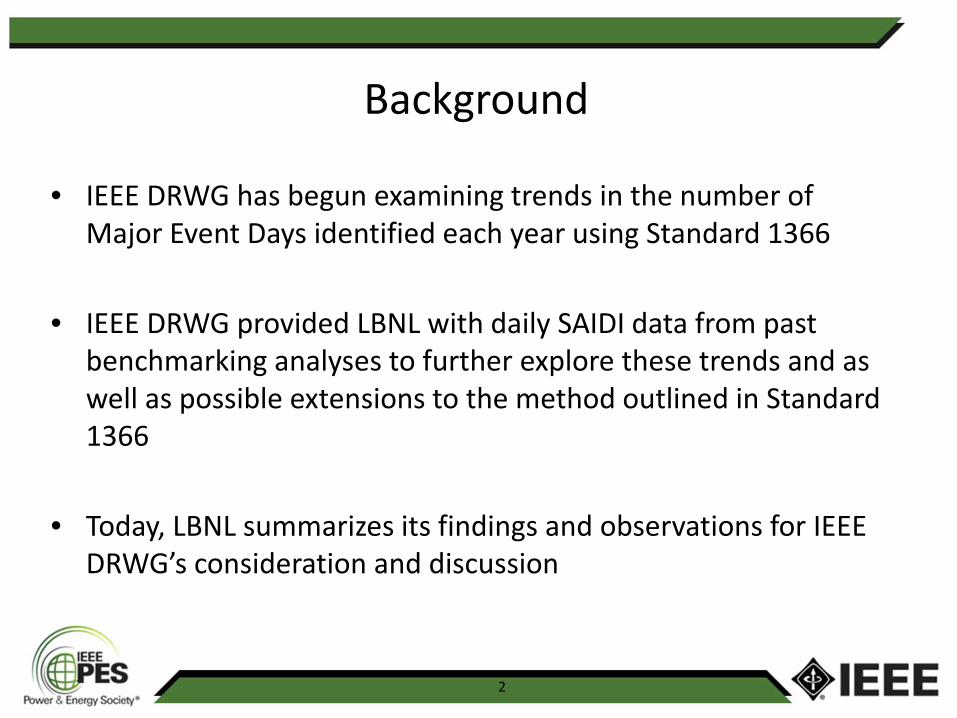
• IEEE DRWG has begun examining trends in the number ofMajor Event Days identified each year using Standard 1366
• IEEE DRWG provided LBNL with daily SAIDI data from pastbenchmarking analyses to further explore these trends and aswell as possible extensions to the method outlined in Standard1366
• Today, LBNL summarizes its findings and observations for IEEEDRWG’s consideration and discussion
IEEE Standard 1366
3
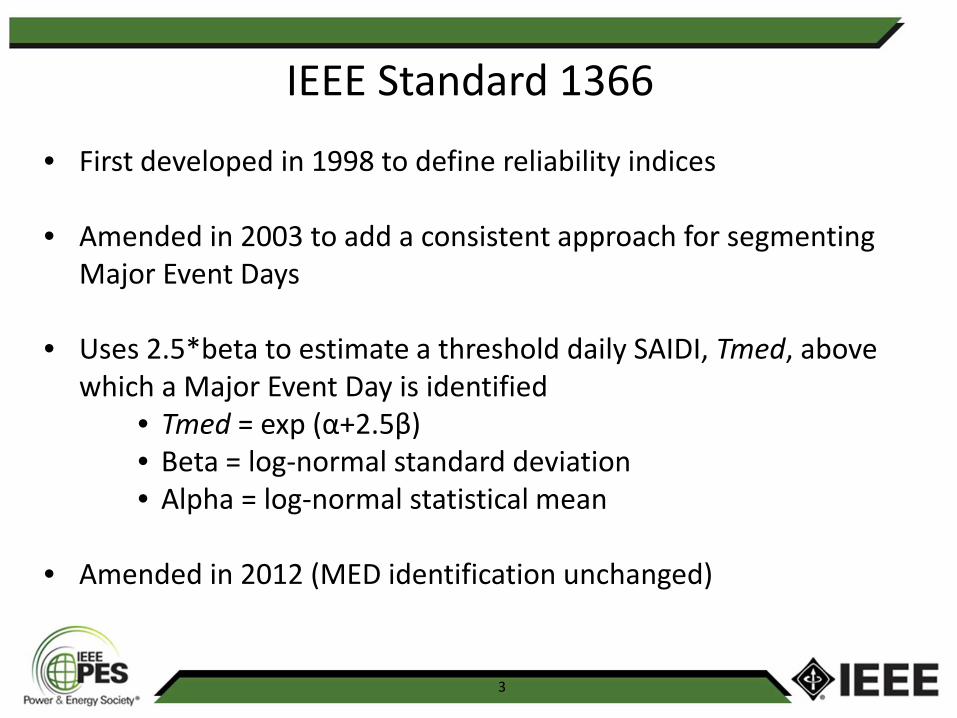
• First developed in 1998 to define reliability indices
• Amended in 2003 to add a consistent approach for segmentingMajor Event Days
• Uses 2.5*beta to estimate a threshold daily SAIDI, Tmed, abovewhich a Major Event Day is identified
• Tmed = exp (α+2.5β)• Beta = log-normal standard deviation• Alpha = log-normal statistical mean
• Amended in 2012 (MED identification unchanged)
Evaluating how 1366 performs
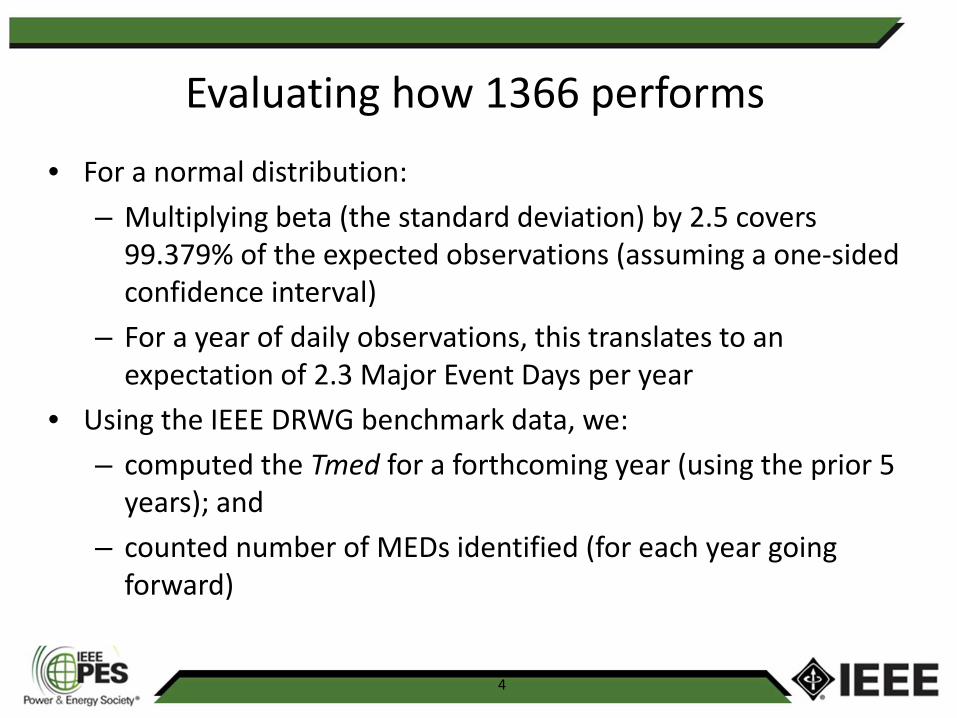
• For a normal distribution:
– Multiplying beta (the standard deviation) by 2.5 covers99.379% of the expected observations (assuming a one-sidedconfidence interval)
– For a year of daily observations, this translates to anexpectation of 2.3 Major Event Days per year
• Using the IEEE DRWG benchmark data, we:
– computed the Tmed for a forthcoming year (using the prior 5years); and
– counted number of MEDs identified (for each year goingforward)
4
Questions we sought to address
5
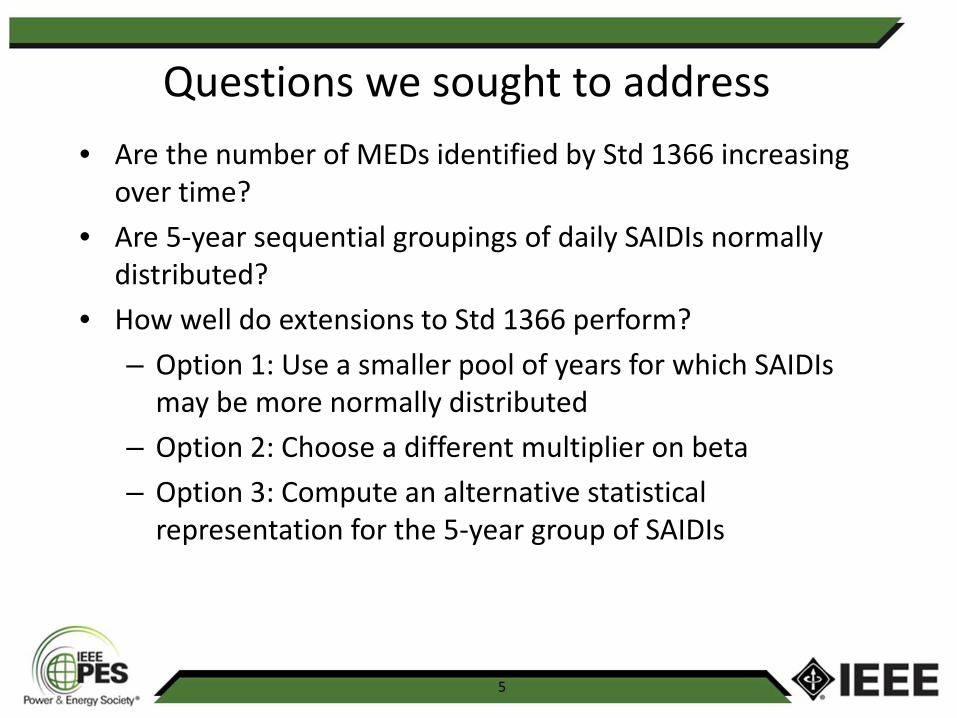
• Are the number of MEDs identified by Std 1366 increasingover time?
• Are 5-year sequential groupings of daily SAIDIs normallydistributed?
• How well do extensions to Std 1366 perform?
– Option 1: Use a smaller pool of years for which SAIDIsmay be more normally distributed
– Option 2: Choose a different multiplier on beta
– Option 3: Compute an alternative statisticalrepresentation for the 5-year group of SAIDIs
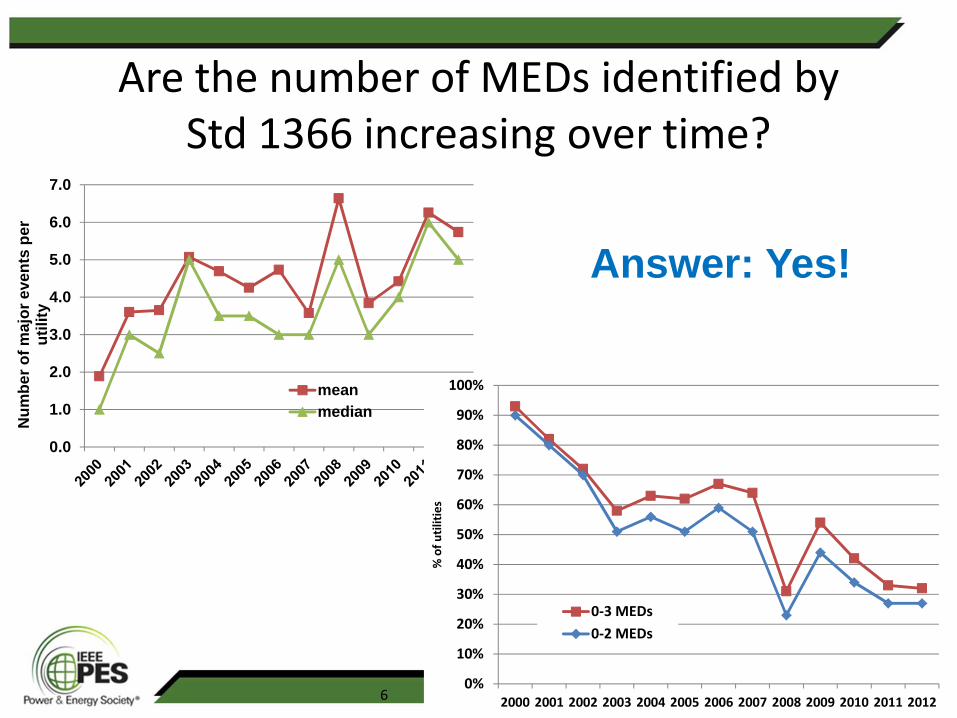
Are the number of MEDs identified byStd 1366 increasing over time?
6
0.0
1.0
2.0
3.0
4.0
5.0
6.0
7.0
Nu
mb
er
of
ma
jor
eve
nts
pe
ru
tility
mean
median
Answer: Yes!
0%
10%
20%
30%
40%
50%
60%
70%
80%
90%
100%
2000 2001 2002 2003 2004 2005 2006 2007 2008 2009 2010 2011 2012
%o
fu
tilit
ies
0-3 MEDs
0-2 MEDs
6
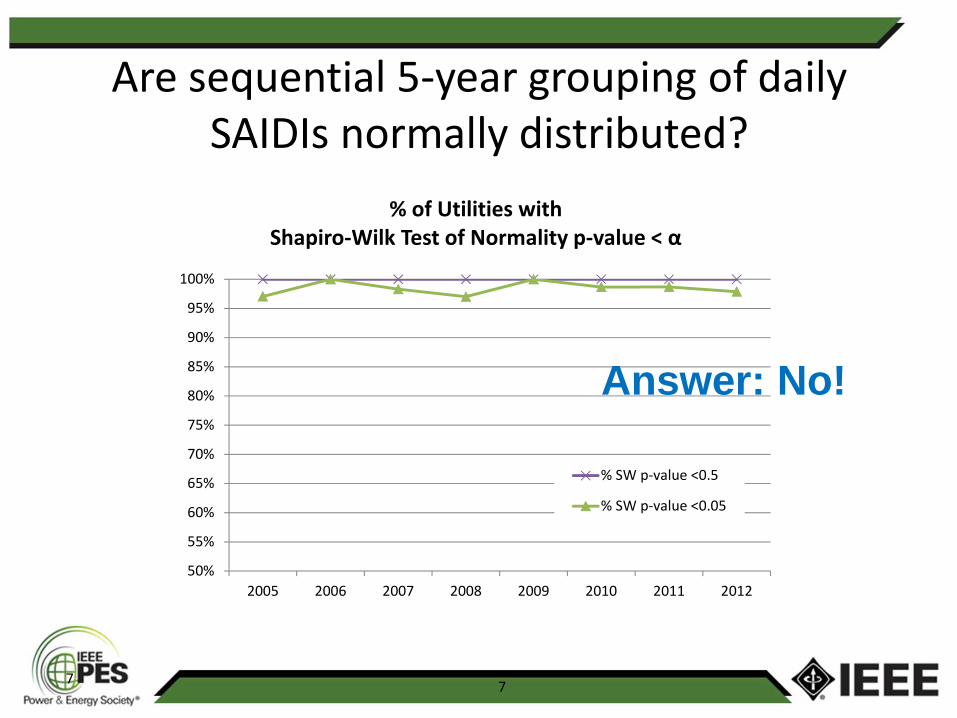
Are sequential 5-year grouping of dailySAIDIs normally distributed?
7
50%
55%
60%
65%
70%
75%
80%
85%
90%
95%
100%
2005 2006 2007 2008 2009 2010 2011 2012
% of Utilities withShapiro-Wilk Test of Normality p-value < α
% SW p-value <0.5
% SW p-value <0.05
Answer: No!
7
8
• In the slides that follow, we consider the effect of differentoptions for selecting Tmed based on direct extensions of themethods and assumptions inherent in Std 1366
• The intent is to evaluate options that may improve our abilityto identify a consistent number of Major Event Days overtime
• None of these options should be confused as potentialrecommendations or suggestions for modifications to Std1366
8
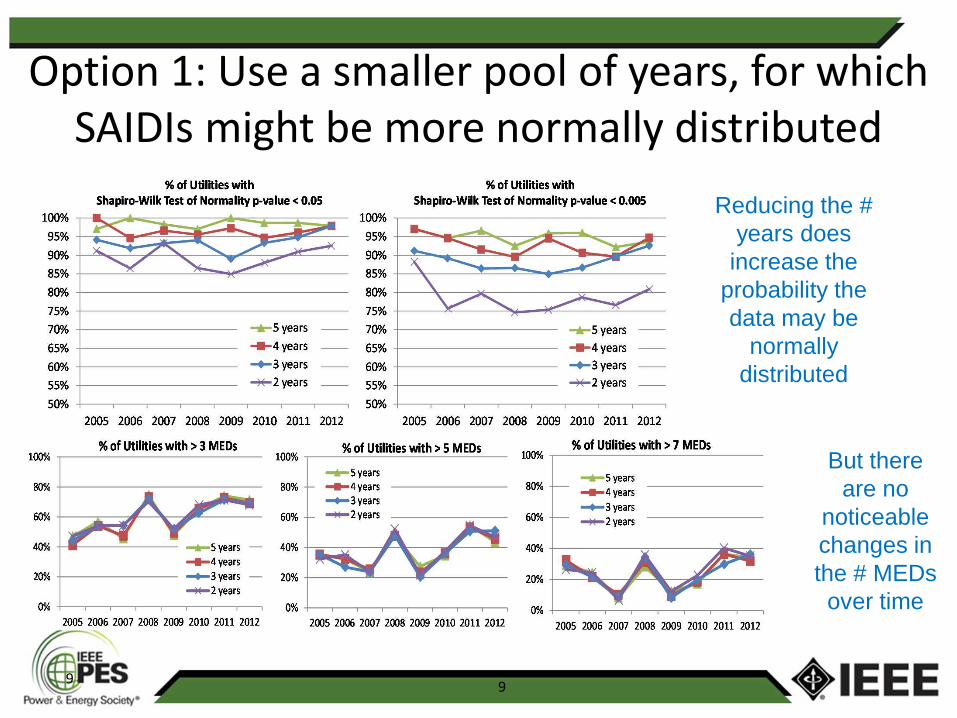
Option 1: Use a smaller pool of years, for whichSAIDIs might be more normally distributed
9
Reducing the #years does
increase theprobability thedata may be
normallydistributed
But thereare no
noticeablechanges inthe # MEDsover time
9
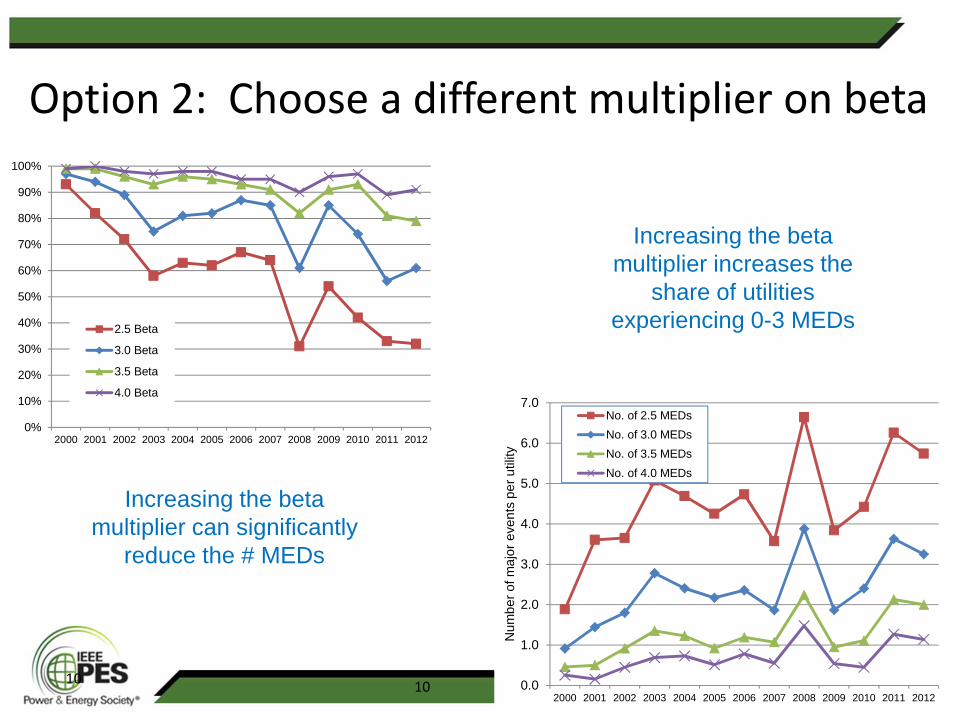
Option 2: Choose a different multiplier on beta
10 0.0
1.0
2.0
3.0
4.0
5.0
6.0
7.0
2000 2001 2002 2003 2004 2005 2006 2007 2008 2009 2010 2011 2012
Nu
mb
er
ofm
ajo
re
ve
nts
pe
ru
tilit
y
No. of 2.5 MEDs
No. of 3.0 MEDs
No. of 3.5 MEDs
No. of 4.0 MEDs
0%
10%
20%
30%
40%
50%
60%
70%
80%
90%
100%
2000 2001 2002 2003 2004 2005 2006 2007 2008 2009 2010 2011 2012
2.5 Beta
3.0 Beta
3.5 Beta
4.0 Beta
Increasing the betamultiplier can significantly
reduce the # MEDs
Increasing the betamultiplier increases the
share of utilitiesexperiencing 0-3 MEDs
10
11
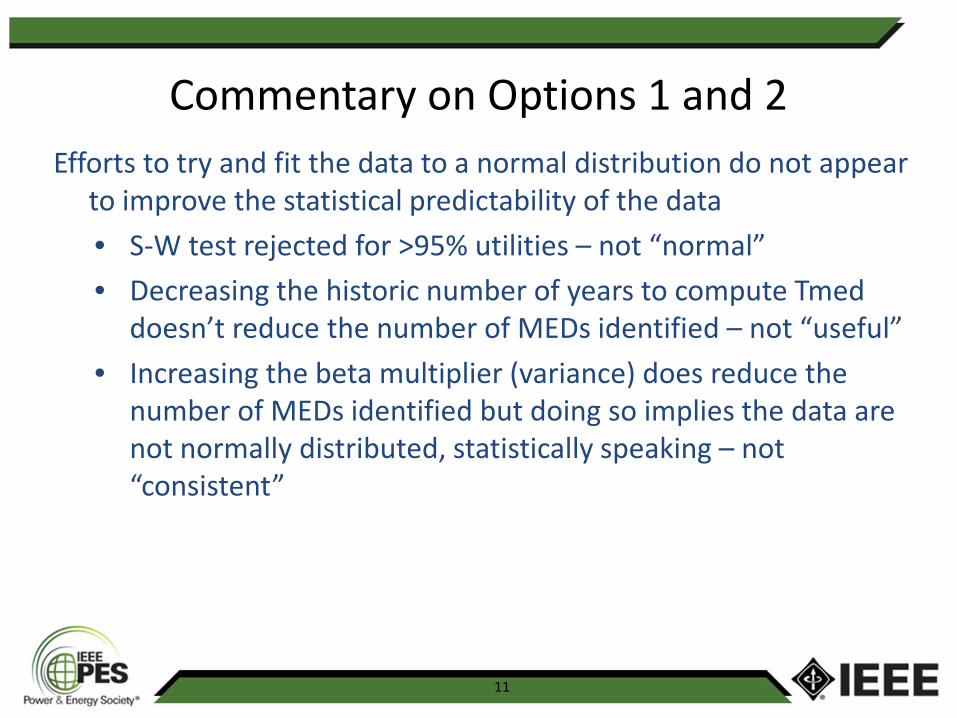
Efforts to try and fit the data to a normal distribution do not appearto improve the statistical predictability of the data
• S-W test rejected for >95% utilities – not “normal”
• Decreasing the historic number of years to compute Tmeddoesn’t reduce the number of MEDs identified – not “useful”
• Increasing the beta multiplier (variance) does reduce thenumber of MEDs identified but doing so implies the data arenot normally distributed, statistically speaking – not“consistent”
Commentary on Options 1 and 2
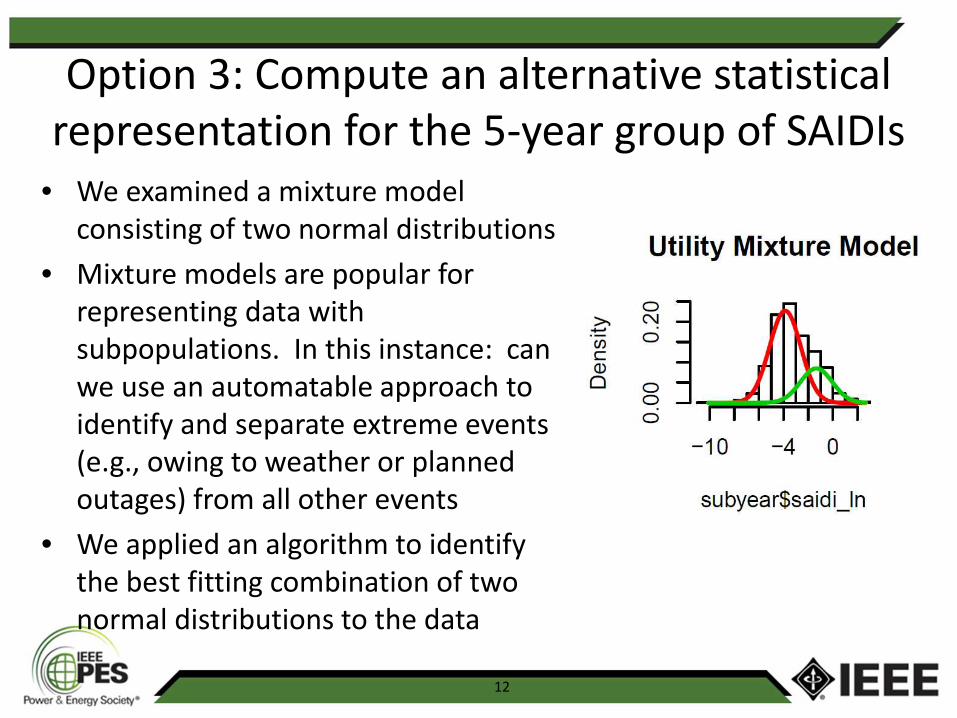
Option 3: Compute an alternative statisticalrepresentation for the 5-year group of SAIDIs
12
• We examined a mixture modelconsisting of two normal distributions
• Mixture models are popular forrepresenting data withsubpopulations. In this instance: canwe use an automatable approach toidentify and separate extreme events(e.g., owing to weather or plannedoutages) from all other events
• We applied an algorithm to identifythe best fitting combination of twonormal distributions to the data
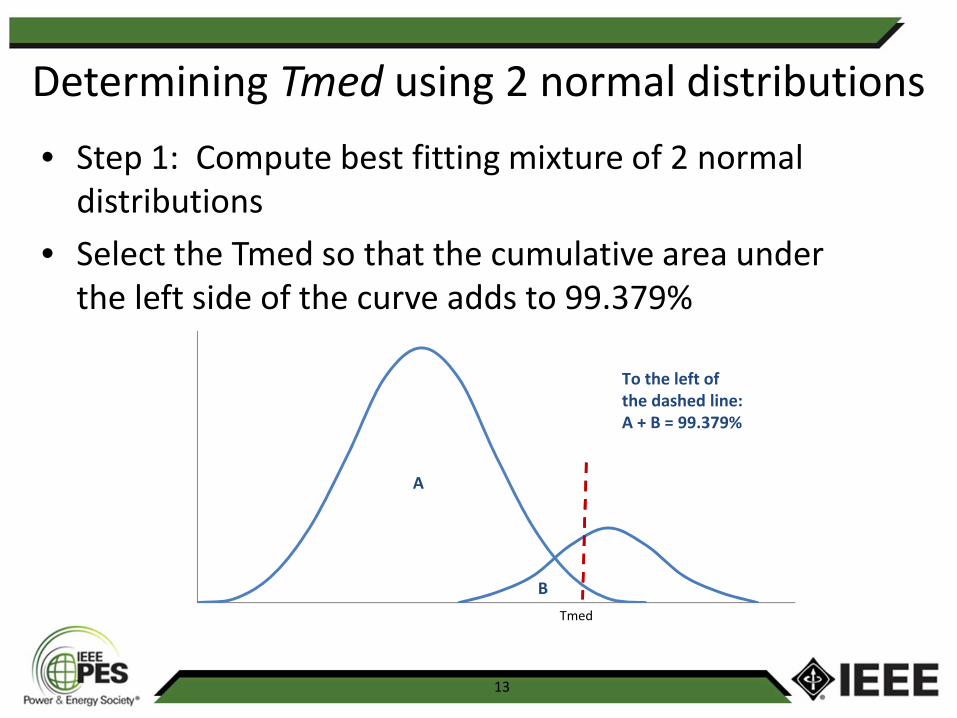
Determining Tmed using 2 normal distributions
13
• Step 1: Compute best fitting mixture of 2 normaldistributions
• Select the Tmed so that the cumulative area underthe left side of the curve adds to 99.379%
0
10
20
30
40
50
60
70
80
0 2 4 6 8 10 12 14 16Tmed
A
B
To the left ofthe dashed line:A + B = 99.379%
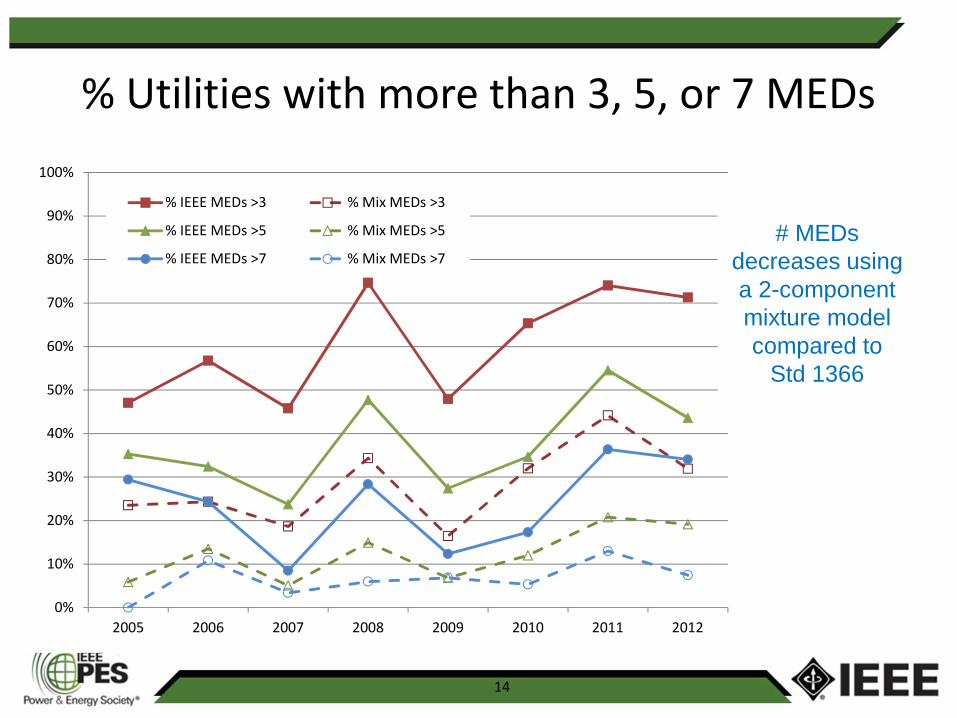
% Utilities with more than 3, 5, or 7 MEDs
14
0%
10%
20%
30%
40%
50%
60%
70%
80%
90%
100%
2005 2006 2007 2008 2009 2010 2011 2012
% IEEE MEDs >3 % Mix MEDs >3
% IEEE MEDs >5 % Mix MEDs >5
% IEEE MEDs >7 % Mix MEDs >7
# MEDsdecreases usinga 2-componentmixture modelcompared to
Std 1366
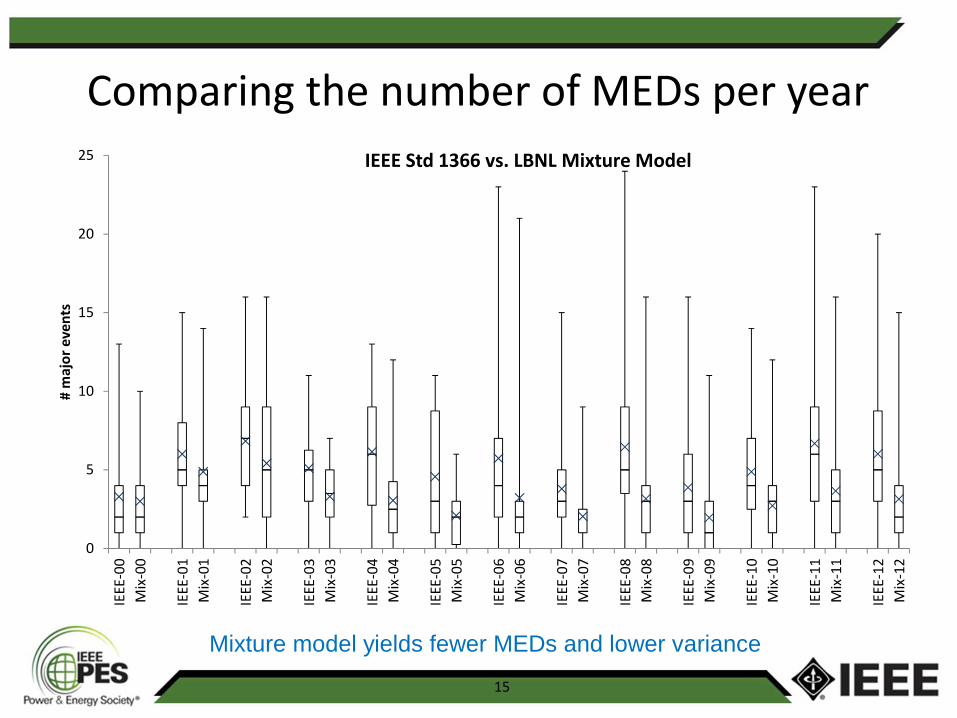
Comparing the number of MEDs per year
15
0
5
10
15
20
25
IEEE
-00
Mix
-00
IEEE
-01
Mix
-01
IEEE
-02
Mix
-02
IEEE
-03
Mix
-03
IEEE
-04
Mix
-04
IEEE
-05
Mix
-05
IEEE
-06
Mix
-06
IEEE
-07
Mix
-07
IEEE
-08
Mix
-08
IEEE
-09
Mix
-09
IEEE
-10
Mix
-10
IEEE
-11
Mix
-11
IEEE
-12
Mix
-12
#m
ajo
rev
ents
IEEE Std 1366 vs. LBNL Mixture Model
Mixture model yields fewer MEDs and lower variance
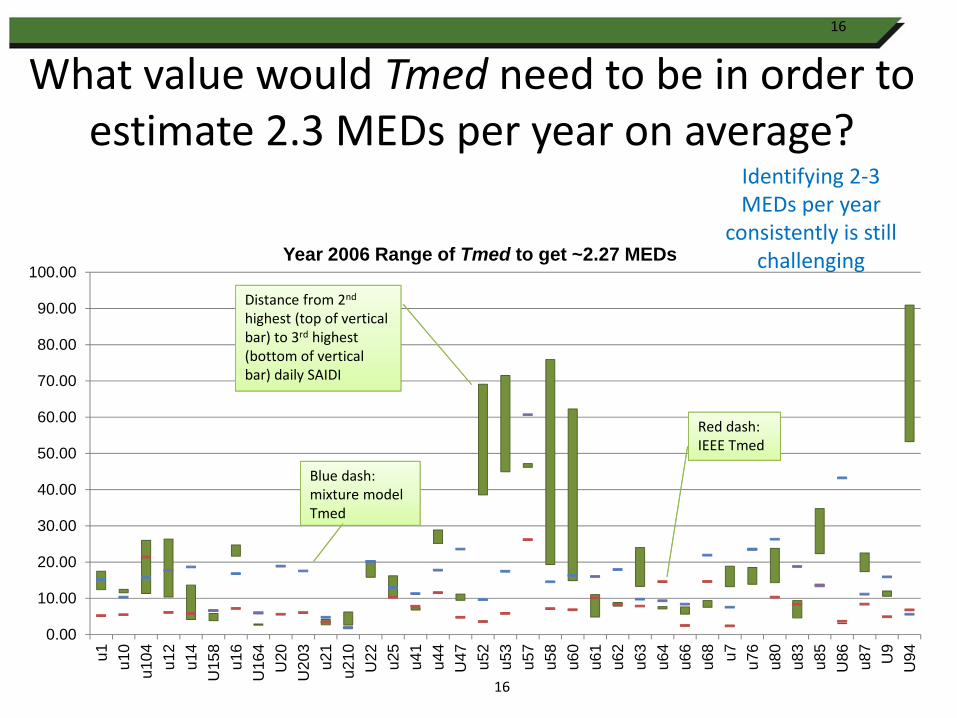
What value would Tmed need to be in order toestimate 2.3 MEDs per year on average?
16
0.00
10.00
20.00
30.00
40.00
50.00
60.00
70.00
80.00
90.00
100.00
u1
u10
u10
4
u12
u14
U15
8
u16
U16
4
U20
U20
3
u21
u21
0
U22
u25
u41
u44
U47
u52
u53
u57
u58
u60
u61
u62
u63
u64
u66
u68
u7
u76
u80
u83
u85
U86
u87
U9
U94
Year 2006 Range of Tmed to get ~2.27 MEDs
Distance from 2nd
highest (top of verticalbar) to 3rd highest(bottom of verticalbar) daily SAIDI
Red dash:IEEE Tmed
Blue dash:mixture modelTmed
Identifying 2-3MEDs per year
consistently is stillchallenging
16
Summary of our findings to date
17
• Major events appear to be increasing over recent years
• Daily SAIDI for IEEE DRWG benchmark utilities are not normallydistributed
• Using fewer historic years to calculate Tmed does not help
• Using higher multiples of beta can reduce the average # MEDsbut is ad hoc; hence, the predictive power for future yearsrequires further study
• The example of a mixture model is promising, but further studyis required
Next steps and food for thought
• Pursue efforts to identify subsets of a utility’s data that follow alog-normal distribution
– Take explicit account of pre-arranged interruptions?
– Segment data within a service territory more finelyaccording to geography?
• Start a discussion on the objective of methods for identifyingMEDs, especially if MEDs are found to be increasing over time
– Consider whether design targets for distribution arechanging over time
18