Embed Size (px)
Citation preview
ECONOMIC COMMISSION FOR EUROPE CONFERENCE OF EUROPEAN STATISTICIANS
RESULTS OF THE SURVEY ON CLIMATE CHANGE RELATED STATISTICS
Prepared by the Task Force on climate change related statistics
I. BACKGROUND
1. The statistical community is increasingly recognizing the need to develop climate change related statistics. Therefore, the Bureau of the Conference of European Statisticians (CES) asked the UNECE secretariat to undertake a survey among the CES members to explore the degree to which national statistical offices are involved in climate change related work and in compiling the greenhouse gas (GHG) inventories. An important objective of the survey was to identify issues of common concern for further work at international level. 2. The UN Committee of Experts on Environmental-Economic Accounting (UNCEEA) expressed support for the work and asked the UNECE to report on the outcome of the survey. The UNCEEA and the UN Statistics Division asked the UNECE secretariat to extend the coverage outside the UNECE region. 3. The UNECE secretariat prepared a questionnaire in consultation with Statistics Norway, Statistics Finland, Eurostat and the European Environment Agency, and in close collaboration with the UN Statistics Division in New York. The survey was carried out in 2011. It covered 69 countries; 56 UNECE member countries and Argentina, Australia, Brazil, Chile, China, India, Indonesia, Japan, Mexico, Mongolia, New Zealand, the Republic of Korea and South Africa. 4. The questionnaire (presented in an annex to this paper) consisted of three parts:
(a) Greenhouse gas (GHG) emission inventories;
(b) Climate change indicators;
(c) General concerns, priorities and plans for the future. 5. In total, 48 countries replied to the questionnaire, a response rate of 69 per cent. These countries are: Armenia, Australia, Austria, Azerbaijan, Belarus, Bosnia and Herzegovina, Brazil, Bulgaria, Canada, Chile, Croatia, Cyprus, Czech Republic, Denmark, Estonia, Finland, France, Georgia, Germany, Hungary, Ireland, Israel, Italy, the Republic of Korea, Kyrgyzstan, Latvia, Lithuania, Luxembourg, Mexico, Moldova, Montenegro, Netherlands, New Zealand, Norway, Poland, Portugal, Romania, Russian Federation, Serbia, Slovakia, Slovenia, Spain, Sweden, Switzerland, the former Yugoslav Republic of Macedonia, Turkey, Ukraine and United States. The large number of replies can be seen as an indication of the high interest in the topic of climate change. 6. The report presents the summary of the replies to the survey. II. INVENTORIES OF GREENHOUSE GAS EMISSIONS 7. The first part of the survey studied the extent to which the NSOs are involved in producing the inventories of GHG emissions. Measurement of GHG emissions is based on the Kyoto
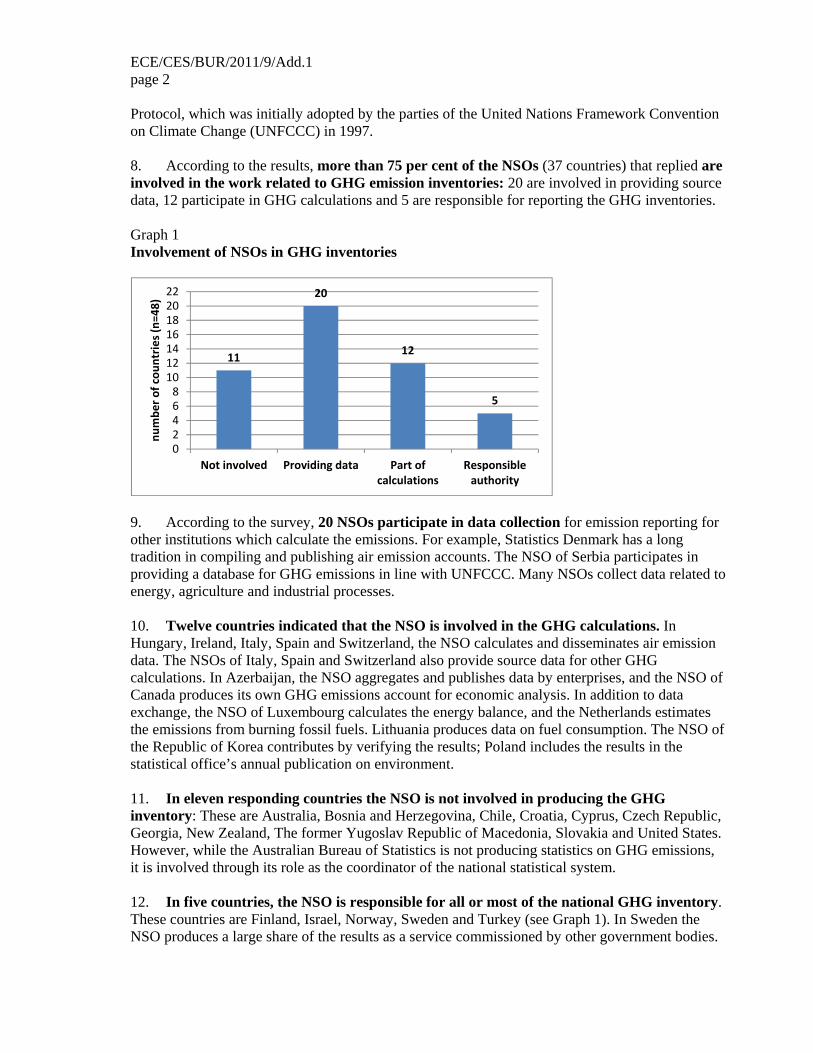
ECE/CES/BUR/2011/9/Add.1 page 2 Protocol, which was initially adopted by the parties of the United Nations Framework Convention on Climate Change (UNFCCC) in 1997. 8. According to the results, more than 75 per cent of the NSOs (37 countries) that replied are involved in the work related to GHG emission inventories: 20 are involved in providing source data, 12 participate in GHG calculations and 5 are responsible for reporting the GHG inventories. Graph 1 Involvement of NSOs in GHG inventories
9. According to the survey, 20 NSOs participate in data collection for emission reporting for other institutions which calculate the emissions. For example, Statistics Denmark has a long tradition in compiling and publishing air emission accounts. The NSO of Serbia participates in providing a database for GHG emissions in line with UNFCCC. Many NSOs collect data related to energy, agriculture and industrial processes. 10. Twelve countries indicated that the NSO is involved in the GHG calculations. In Hungary, Ireland, Italy, Spain and Switzerland, the NSO calculates and disseminates air emission data. The NSOs of Italy, Spain and Switzerland also provide source data for other GHG calculations. In Azerbaijan, the NSO aggregates and publishes data by enterprises, and the NSO of Canada produces its own GHG emissions account for economic analysis. In addition to data exchange, the NSO of Luxembourg calculates the energy balance, and the Netherlands estimates the emissions from burning fossil fuels. Lithuania produces data on fuel consumption. The NSO of the Republic of Korea contributes by verifying the results; Poland includes the results in the statistical office’s annual publication on environment.
11. In eleven responding countries the NSO is not involved in producing the GHG inventory: These are Australia, Bosnia and Herzegovina, Chile, Croatia, Cyprus, Czech Republic, Georgia, New Zealand, The former Yugoslav Republic of Macedonia, Slovakia and United States. However, while the Australian Bureau of Statistics is not producing statistics on GHG emissions, it is involved through its role as the coordinator of the national statistical system. 12. In five countries, the NSO is responsible for all or most of the national GHG inventory. These countries are Finland, Israel, Norway, Sweden and Turkey (see Graph 1). In Sweden the NSO produces a large share of the results as a service commissioned by other government bodies.
11
20
12
5
02468
10121416182022
Not involved Providing data Part ofcalculations
Responsibleauthority
numbe
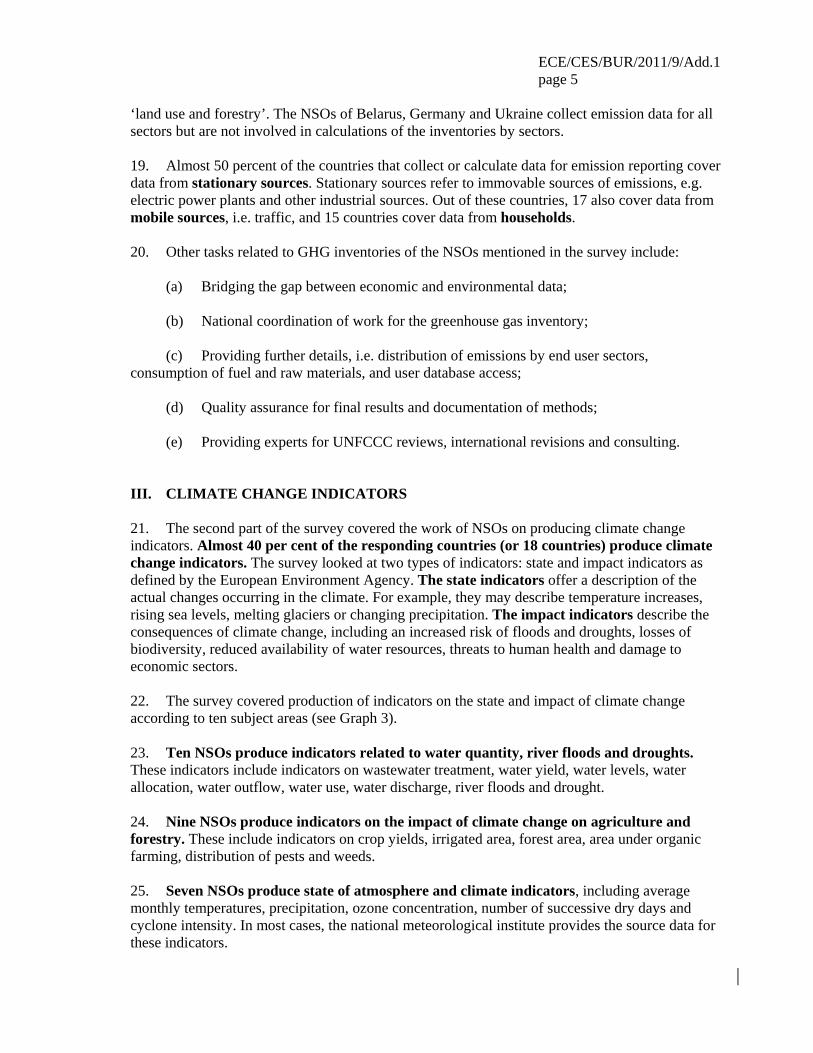
r of cou
ntrie
s (n=
48)
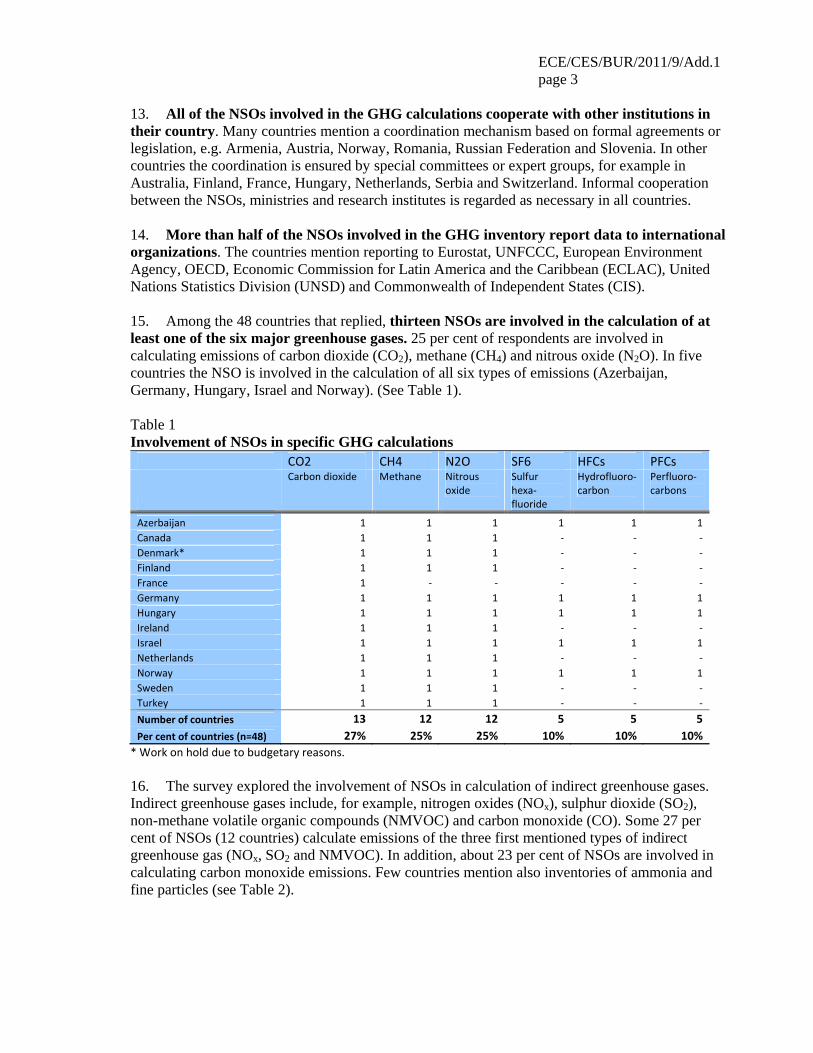
ECE/CES/BUR/2011/9/Add.1 page 3 13. All of the NSOs involved in the GHG calculations cooperate with other institutions in their country. Many countries mention a coordination mechanism based on formal agreements or legislation, e.g. Armenia, Austria, Norway, Romania, Russian Federation and Slovenia. In other countries the coordination is ensured by special committees or expert groups, for example in Australia, Finland, France, Hungary, Netherlands, Serbia and Switzerland. Informal cooperation between the NSOs, ministries and research institutes is regarded as necessary in all countries. 14. More than half of the NSOs involved in the GHG inventory report data to international organizations. The countries mention reporting to Eurostat, UNFCCC, European Environment Agency, OECD, Economic Commission for Latin America and the Caribbean (ECLAC), United Nations Statistics Division (UNSD) and Commonwealth of Independent States (CIS). 15. Among the 48 countries that replied, thirteen NSOs are involved in the calculation of at least one of the six major greenhouse gases. 25 per cent of respondents are involved in calculating emissions of carbon dioxide (CO2), methane (CH4) and nitrous oxide (N2O). In five countries the NSO is involved in the calculation of all six types of emissions (Azerbaijan, Germany, Hungary, Israel and Norway). (See Table 1). Table 1 Involvement of NSOs in specific GHG calculations CO2 CH4 N2O SF6 HFCs PFCs
Carbon dioxide Methane Nitrous oxide
Sulfur hexa‐ fluoride
Hydrofluoro‐ carbon
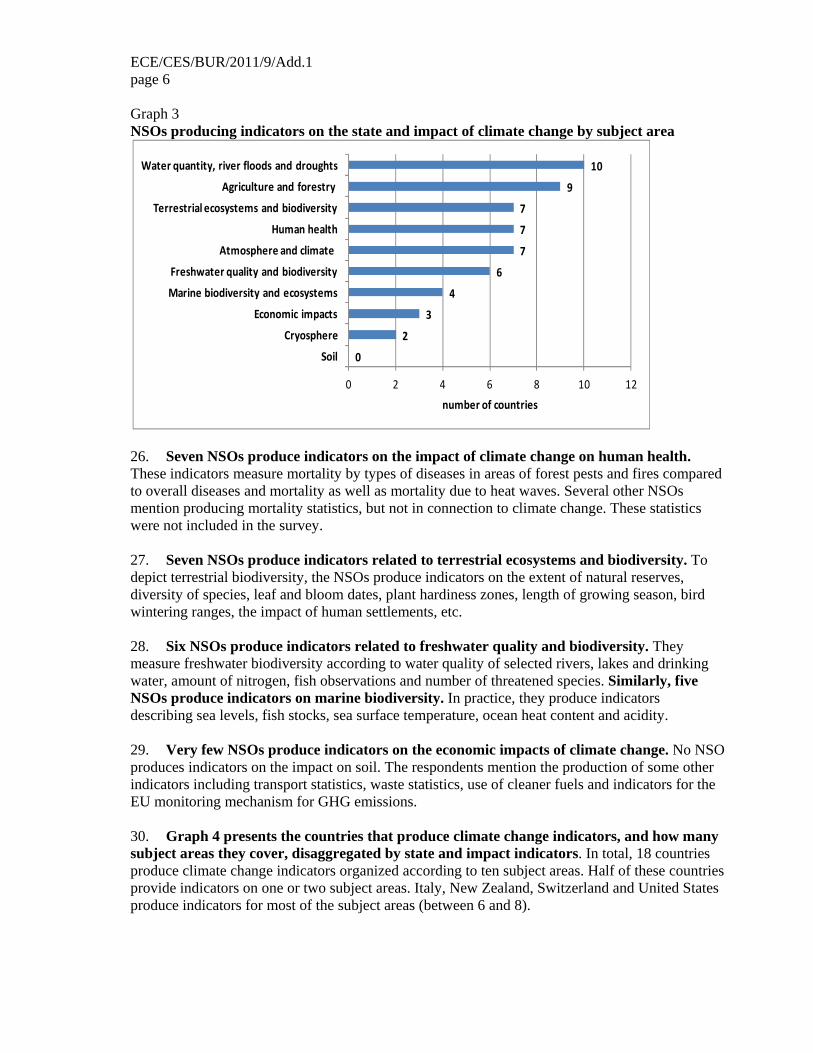
Perfluoro‐carbons
Azerbaijan 1 1 1 1 1 1 Canada 1 1 1 ‐ ‐ ‐ Denmark* 1 1 1 ‐ ‐ ‐ Finland 1 1 1 ‐ ‐ ‐ France 1 ‐ ‐ ‐ ‐ ‐ Germany 1 1 1 1 1 1 Hungary 1 1 1 1 1 1 Ireland 1 1 1 ‐ ‐ ‐ Israel 1 1 1 1 1 1 Netherlands 1 1 1 ‐ ‐ ‐ Norway 1 1 1 1 1 1 Sweden 1 1 1 ‐ ‐ ‐ Turkey 1 1 1 ‐ ‐ ‐ Number of countries 13 12 12 5 5 5 Per cent of countries (n=48) 27% 25% 25% 10% 10% 10%
* Work on hold due to budgetary reasons. 16. The survey explored the involvement of NSOs in calculation of indirect greenhouse gases. Indirect greenhouse gases include, for example, nitrogen oxides (NOx), sulphur dioxide (SO2), non-methane volatile organic compounds (NMVOC) and carbon monoxide (CO). Some 27 per cent of NSOs (12 countries) calculate emissions of the three first mentioned types of indirect greenhouse gas (NOx, SO2 and NMVOC). In addition, about 23 per cent of NSOs are involved in calculating carbon monoxide emissions. Few countries mention also inventories of ammonia and fine particles (see Table 2).
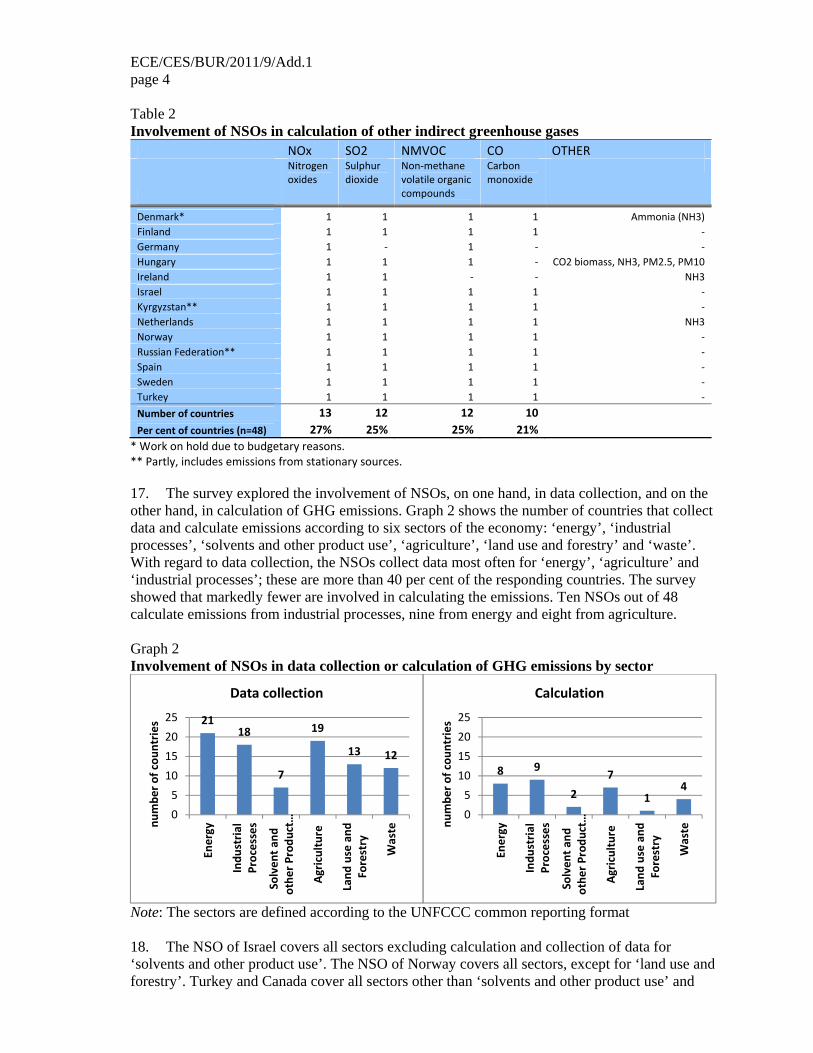
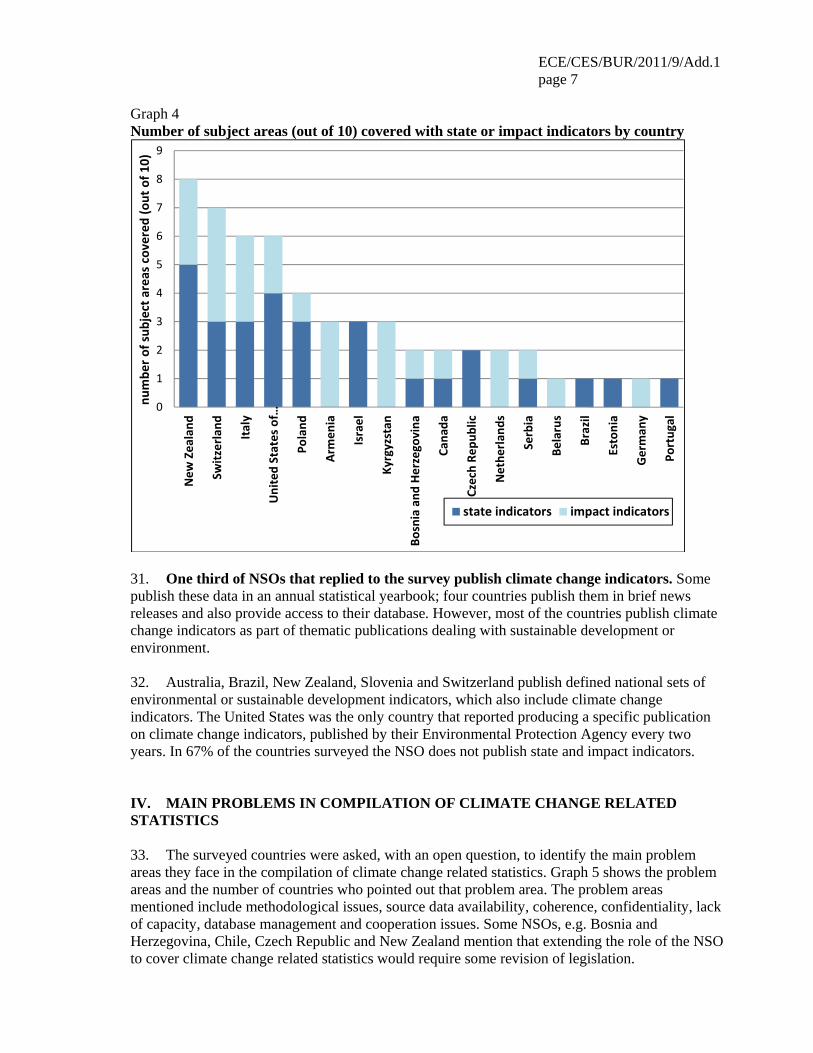
ECE/CES/BUR/2011/9/Add.1 page 4 Table 2 Involvement of NSOs in calculation of other indirect greenhouse gases NOx SO2 NMVOC CO OTHER
Nitrogen oxides
Sulphur dioxide
Non‐methane volatile organic compounds
Carbon monoxide
Denmark* 1 1 1 1 Ammonia (NH3) Finland 1 1 1 1 ‐ Germany 1 ‐ 1 ‐ ‐ Hungary 1 1 1 ‐ CO2 biomass, NH3, PM2.5, PM10 Ireland 1 1 ‐ ‐ NH3 Israel 1 1 1 1 ‐ Kyrgyzstan** 1 1 1 1 ‐ Netherlands 1 1 1 1 NH3 Norway 1 1 1 1 ‐ Russian Federation** 1 1 1 1 ‐ Spain 1 1 1 1 ‐ Sweden 1 1 1 1 ‐ Turkey 1 1 1 1 ‐ Number of countries 13 12 12 10 Per cent of countries (n=48) 27% 25% 25% 21%
* Work on hold due to budgetary reasons. ** Partly, includes emissions from stationary sources. 17. The survey explored the involvement of NSOs, on one hand, in data collection, and on the other hand, in calculation of GHG emissions. Graph 2 shows the number of countries that collect data and calculate emissions according to six sectors of the economy: ‘energy’, ‘industrial processes’, ‘solvents and other product use’, ‘agriculture’, ‘land use and forestry’ and ‘waste’. With regard to data collection, the NSOs collect data most often for ‘energy’, ‘agriculture’ and ‘industrial processes’; these are more than 40 per cent of the responding countries. The survey showed that markedly fewer are involved in calculating the emissions. Ten NSOs out of 48 calculate emissions from industrial processes, nine from energy and eight from agriculture. Graph 2 Involvement of NSOs in data collection or calculation of GHG emissions by sector
Note: The sectors are defined according to the UNFCCC common reporting format 18. The NSO of Israel covers all sectors excluding calculation and collection of data for ‘solvents and other product use’. The NSO of Norway covers all sectors, except for ‘land use and forestry’. Turkey and Canada cover all sectors other than ‘solvents and other product use’ and
2118
7
19
13 12
0510152025
Energy
Indu
stria
lProcesses
Solven
t and
othe
r Produ
ct…
Agric
ulture
Land
use and
Forestry
Wastenu
mbe
r of cou
ntrie
s
Data collection
8 9
27
14
05
10152025
Energy
Indu
stria
lProcesses
Solven
t and
othe
r Produ
ct…
Agric
ulture
Land
use and
Forestry
Wastenu
mbe
r of cou
ntrie
s
Calculation
ECE/CES/BUR/2011/9/Add.1 page 5 ‘land use and forestry’. The NSOs of Belarus, Germany and Ukraine collect emission data for all sectors but are not involved in calculations of the inventories by sectors. 19. Almost 50 percent of the countries that collect or calculate data for emission reporting cover data from stationary sources. Stationary sources refer to immovable sources of emissions, e.g. electric power plants and other industrial sources. Out of these countries, 17 also cover data from mobile sources, i.e. traffic, and 15 countries cover data from households. 20. Other tasks related to GHG inventories of the NSOs mentioned in the survey include: (a) Bridging the gap between economic and environmental data; (b) National coordination of work for the greenhouse gas inventory; (c) Providing further details, i.e. distribution of emissions by end user sectors, consumption of fuel and raw materials, and user database access; (d) Quality assurance for final results and documentation of methods; (e) Providing experts for UNFCCC reviews, international revisions and consulting. III. CLIMATE CHANGE INDICATORS 21. The second part of the survey covered the work of NSOs on producing climate change indicators. Almost 40 per cent of the responding countries (or 18 countries) produce climate change indicators. The survey looked at two types of indicators: state and impact indicators as defined by the European Environment Agency. The state indicators offer a description of the actual changes occurring in the climate. For example, they may describe temperature increases, rising sea levels, melting glaciers or changing precipitation. The impact indicators describe the consequences of climate change, including an increased risk of floods and droughts, losses of biodiversity, reduced availability of water resources, threats to human health and damage to economic sectors. 22. The survey covered production of indicators on the state and impact of climate change according to ten subject areas (see Graph 3). 23. Ten NSOs produce indicators related to water quantity, river floods and droughts. These indicators include indicators on wastewater treatment, water yield, water levels, water allocation, water outflow, water use, water discharge, river floods and drought. 24. Nine NSOs produce indicators on the impact of climate change on agriculture and forestry. These include indicators on crop yields, irrigated area, forest area, area under organic farming, distribution of pests and weeds. 25. Seven NSOs produce state of atmosphere and climate indicators, including average monthly temperatures, precipitation, ozone concentration, number of successive dry days and cyclone intensity. In most cases, the national meteorological institute provides the source data for these indicators.
ECE/CES/BUR/2011/9/Add.1 page 6 Graph 3 NSOs producing indicators on the state and impact of climate change by subject area
26. Seven NSOs produce indicators on the impact of climate change on human health. These indicators measure mortality by types of diseases in areas of forest pests and fires compared to overall diseases and mortality as well as mortality due to heat waves. Several other NSOs mention producing mortality statistics, but not in connection to climate change. These statistics were not included in the survey. 27. Seven NSOs produce indicators related to terrestrial ecosystems and biodiversity. To depict terrestrial biodiversity, the NSOs produce indicators on the extent of natural reserves, diversity of species, leaf and bloom dates, plant hardiness zones, length of growing season, bird wintering ranges, the impact of human settlements, etc. 28. Six NSOs produce indicators related to freshwater quality and biodiversity. They measure freshwater biodiversity according to water quality of selected rivers, lakes and drinking water, amount of nitrogen, fish observations and number of threatened species. Similarly, five NSOs produce indicators on marine biodiversity. In practice, they produce indicators describing sea levels, fish stocks, sea surface temperature, ocean heat content and acidity. 29. Very few NSOs produce indicators on the economic impacts of climate change. No NSO produces indicators on the impact on soil. The respondents mention the production of some other indicators including transport statistics, waste statistics, use of cleaner fuels and indicators for the EU monitoring mechanism for GHG emissions. 30. Graph 4 presents the countries that produce climate change indicators, and how many subject areas they cover, disaggregated by state and impact indicators. In total, 18 countries produce climate change indicators organized according to ten subject areas. Half of these countries provide indicators on one or two subject areas. Italy, New Zealand, Switzerland and United States produce indicators for most of the subject areas (between 6 and 8).
0
2
3
4
6
7
7
7
9
10
0 2 4 6 8 10 12
Soil
Cryosphere
Economic impacts
Marine biodiversity and ecosystems
Freshwater quality and biodiversity
Atmosphere and climate
Human health
Terrestrial ecosystems and biodiversity
Agriculture and forestry
Water quantity, river floods and droughts
number of countries
ECE/CES/BUR/2011/9/Add.1 page 7 Graph 4 Number of subject areas (out of 10) covered with state or impact indicators by country
31. One third of NSOs that replied to the survey publish climate change indicators. Some publish these data in an annual statistical yearbook; four countries publish them in brief news releases and also provide access to their database. However, most of the countries publish climate change indicators as part of thematic publications dealing with sustainable development or environment. 32. Australia, Brazil, New Zealand, Slovenia and Switzerland publish defined national sets of environmental or sustainable development indicators, which also include climate change indicators. The United States was the only country that reported producing a specific publication on climate change indicators, published by their Environmental Protection Agency every two years. In 67% of the countries surveyed the NSO does not publish state and impact indicators. IV. MAIN PROBLEMS IN COMPILATION OF CLIMATE CHANGE RELATED STATISTICS 33. The surveyed countries were asked, with an open question, to identify the main problem areas they face in the compilation of climate change related statistics. Graph 5 shows the problem areas and the number of countries who pointed out that problem area. The problem areas mentioned include methodological issues, source data availability, coherence, confidentiality, lack of capacity, database management and cooperation issues. Some NSOs, e.g. Bosnia and Herzegovina, Chile, Czech Republic and New Zealand mention that extending the role of the NSO to cover climate change related statistics would require some revision of legislation.
0
1
2
3
4
5
6
7
8
9
New
Zealand
Switzerland
Italy
United States of…
Poland
Armen
ia
Israel
Kyrgyzstan
Bosnia and
Herzegovina
Cana
da
Czech Re
public
Nethe
rland
s
Serbia
Belarus
Brazil
Estonia
German
y
Portug
al
numbe
r of sub
ject areas covered
(out of 1
0)
state indicators impact indicators
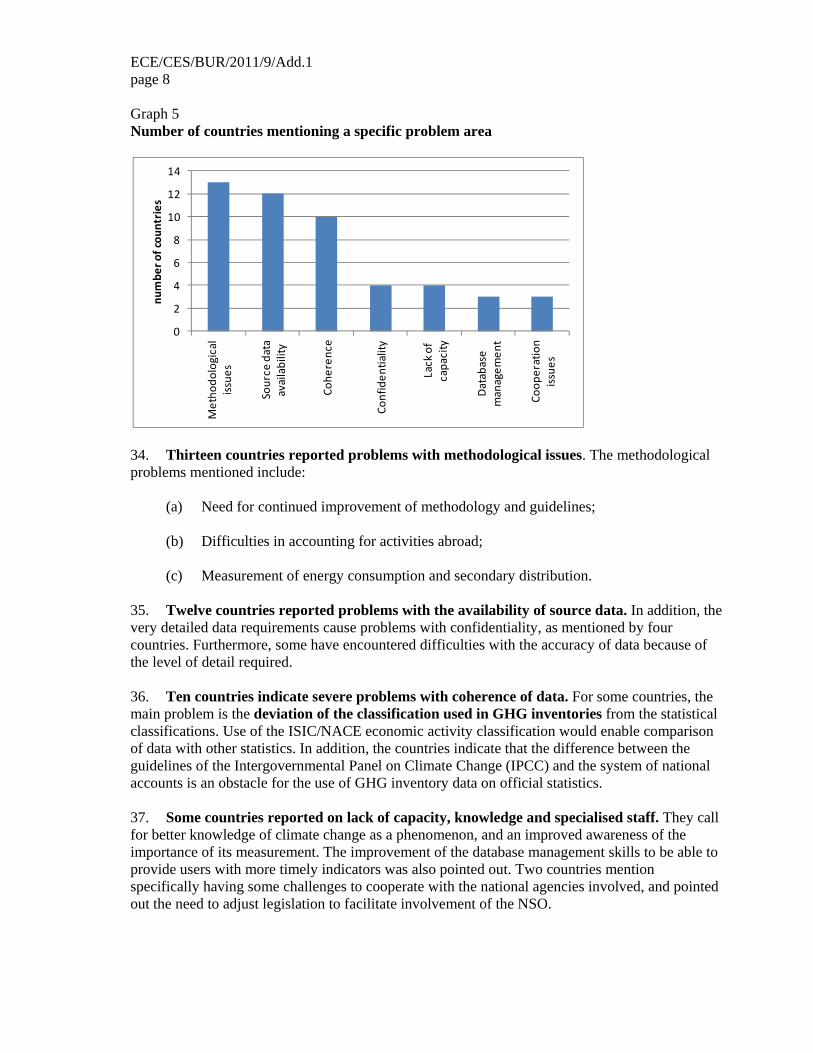
ECE/CES/BUR/2011/9/Add.1 page 8 Graph 5 Number of countries mentioning a specific problem area
34. Thirteen countries reported problems with methodological issues. The methodological problems mentioned include: (a) Need for continued improvement of methodology and guidelines; (b) Difficulties in accounting for activities abroad; (c) Measurement of energy consumption and secondary distribution. 35. Twelve countries reported problems with the availability of source data. In addition, the very detailed data requirements cause problems with confidentiality, as mentioned by four countries. Furthermore, some have encountered difficulties with the accuracy of data because of the level of detail required. 36. Ten countries indicate severe problems with coherence of data. For some countries, the main problem is the deviation of the classification used in GHG inventories from the statistical classifications. Use of the ISIC/NACE economic activity classification would enable comparison of data with other statistics. In addition, the countries indicate that the difference between the guidelines of the Intergovernmental Panel on Climate Change (IPCC) and the system of national accounts is an obstacle for the use of GHG inventory data on official statistics. 37. Some countries reported on lack of capacity, knowledge and specialised staff. They call for better knowledge of climate change as a phenomenon, and an improved awareness of the importance of its measurement. The improvement of the database management skills to be able to provide users with more timely indicators was also pointed out. Two countries mention specifically having some challenges to cooperate with the national agencies involved, and pointed out the need to adjust legislation to facilitate involvement of the NSO.
0
2
4
6
8
10
12
14
Metho
dological
issue
s
Source
data
availability
Cohe
rence
Confiden
tiality
Lack of
capacity
Database
managem
ent
Coop
eration
issue
s
numbe
r of cou
ntrie
s
ECE/CES/BUR/2011/9/Add.1 page 9 V. PRIORITY AREAS FOR FURTHER WORK ON CLIMATE CHANGE RELATED STATISTICS 38. Countries were asked, with an open question, to indicate the priority areas where recommendations, guidelines, best practices and international standards are needed. Twenty-seven countries provided information on areas for future work. 39. Countries asked for international work for developing general guidelines and studying good practices in climate change related statistics. Several respondents emphasised the need to improve methods for calculating the GHG emissions. 40. Furthermore, countries mentioned additional priorities related to the development of particular subject matter areas:
• Mitigation and adaptation expenditures; • Energy use by sector and energy consumption; • Green renewable energy; • Transfers and taxes; • Economic impacts of climate change; • Air emissions and industrial processes; • Solvents and other product use; • Measuring perceptions of climate change; • Impact of climate change on human health.
41. Several countries (Canada, France, Norway, Slovenia and United States) pointed out as a priority the need to address the mismatch between the statistical classifications and those used by UNFCCC and IPCC. They also stressed the possible benefits of linking statistical classifications and inventories more closely, for example, to facilitate the use of energy statistics in the compilation of GHG emissions. Canada pointed out the need to harmonise the IPCC reporting framework with the System of National Accounts. Norway would welcome the development of more precise classifications for environmental technology. 42. Australia stressed the need for NSOs to work together with the Energy Agencies to develop statistics related to climate change. Bosnia and Herzegovina, Brazil and Germany highlighted the importance of identifying exactly what data the NSOs should produce for GHG calculations. France and Germany suggested to consider the possibility of reducing the level of detail in calculating the inventories to achieve a better balance between costs of data collection and accuracy of results. 43. The United States noted that changes in climate-related phenomena and greenhouse gases occur over decades, even centuries, whereas observational records are much shorter by comparison. Thus, they would find it useful to have guidelines on how to account for long-term natural variability in the climate system. A. Comments in relation to GHG inventories
44. A number of NSOs reported about their plans to improve the calculation of GHG inventories in the future. Among the priorities mentioned are improving the coverage, developing new methodology, improving coordination within the country and redefining the scope. Fourteen NSOs have no plans for future improvements or are not involved in the calculation of GHG.
ECE/CES/BUR/2011/9/Add.1 page 10 45. Nine countries plan to improve the coverage of the GHG inventory, e.g. to add data on energy and land use balance, emissions from road traffic, air emissions and list of polluting substances. Some countries indicated the need arising from the EU climate and energy package or from a potential new climate change agreement. Others indicated that they will continue producing the GHG inventory without any major changes, and some stressed the need to improve the cooperation with the responsible national agencies in the calculations of GHG inventories. 46. Canada, Norway and the Republic of Korea plan to improve the methodology of GHG inventories. Canada plans to produce bridge tables to illustrate the differences between emission accounts of the SNA/environmental accounts (SEEA) and the IPCC based reporting framework, improve timeliness, conduct confrontation analysis and examine various methodological approaches. Norway focuses on improving their GHG calculations, quality assurance procedures, calculation models and consistency between energy and GHG statistics. The Republic of Korea aims at matching the international classification used in GHG inventories with the Korean standard industrial code. B. Comments in relation to climate change indicators
47. The survey showed that 23 per cent of those who replied (11 countries) plan to define a set of climate change indicators, and to identify the needed data. 48. Some countries indicated that they do not have any plans. The reasons for that are:
• needs for further consultations within the country between the different institutions involved in the work;
• awaiting for an internationally defined framework for climate change related indicators.
49. Canada has plans to develop a regular production of a set of ecosystem and biodiversity statistics. Hungary is defining a set of climate change indicators by the end of 2011. Ireland, Israel, Kyrgyzstan and Romania are working within their countries to come up with an agreed set of indicators and to assess the possibility of data collection. The NSO of Spain is developing many primary statistics potentially useful for climate change indicators. 50. In the United States, the Environmental Protection Agency leads the work, and considers adding 5-10 new indicators to their current list of 24 climate change indicators. The NSO of Serbia is creating a database for waste statistics in cooperation with the Environmental Protection Agency. Norway may develop indicators related to human activity. The Netherlands and Sweden reported that they plan to continue producing climate change related statistics; Sweden develops these indicators within the framework of the environmental accounts (SEEA). C. Concrete proposals for further work
51. Countries were asked to express their views by replying “yes” or “no” on concrete proposals for further work as specified in question 13 of the attached questionnaire. The proposals for further work are also presented in Graph 6. 52. In total, 71 per cent of respondents, among others Brazil, Canada, Estonia, Ireland, Norway, Slovenia and Switzerland, emphasised the need for an internationally agreed framework or recommendations for climate change indicators. The results show that the respondents agree to a large extent with the importance of improving measurement of climate change. Four countries (Bulgaria, Germany, Netherlands and Sweden) do not consider this work
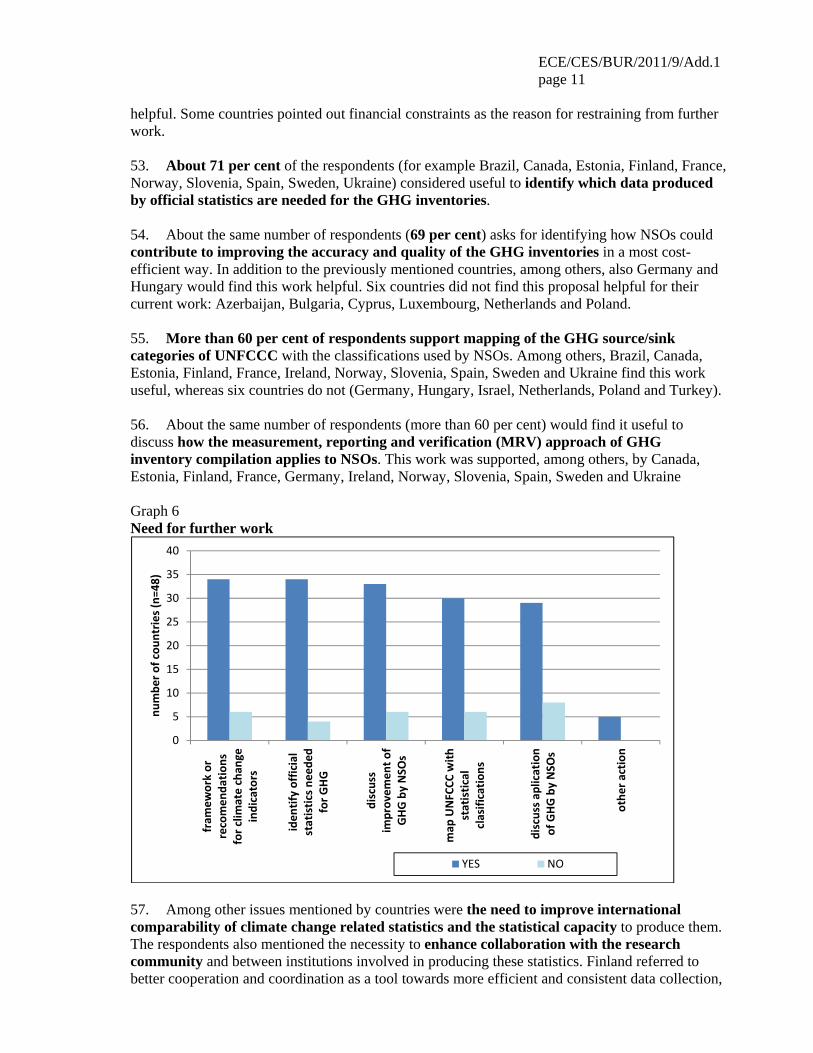
ECE/CES/BUR/2011/9/Add.1 page 11 helpful. Some countries pointed out financial constraints as the reason for restraining from further work. 53. About 71 per cent of the respondents (for example Brazil, Canada, Estonia, Finland, France, Norway, Slovenia, Spain, Sweden, Ukraine) considered useful to identify which data produced by official statistics are needed for the GHG inventories. 54. About the same number of respondents (69 per cent) asks for identifying how NSOs could contribute to improving the accuracy and quality of the GHG inventories in a most cost-efficient way. In addition to the previously mentioned countries, among others, also Germany and Hungary would find this work helpful. Six countries did not find this proposal helpful for their current work: Azerbaijan, Bulgaria, Cyprus, Luxembourg, Netherlands and Poland. 55. More than 60 per cent of respondents support mapping of the GHG source/sink categories of UNFCCC with the classifications used by NSOs. Among others, Brazil, Canada, Estonia, Finland, France, Ireland, Norway, Slovenia, Spain, Sweden and Ukraine find this work useful, whereas six countries do not (Germany, Hungary, Israel, Netherlands, Poland and Turkey). 56. About the same number of respondents (more than 60 per cent) would find it useful to discuss how the measurement, reporting and verification (MRV) approach of GHG inventory compilation applies to NSOs. This work was supported, among others, by Canada, Estonia, Finland, France, Germany, Ireland, Norway, Slovenia, Spain, Sweden and Ukraine Graph 6 Need for further work
57. Among other issues mentioned by countries were the need to improve international comparability of climate change related statistics and the statistical capacity to produce them. The respondents also mentioned the necessity to enhance collaboration with the research community and between institutions involved in producing these statistics. Finland referred to better cooperation and coordination as a tool towards more efficient and consistent data collection,
0
5
10
15
20
25
30
35
40
fram
ework or
recomen
datio
nsfor clim
ate chan
geindicators
iden
tify official
statistics n
eede
dfor G
HG
discuss
improvem
ent o
fGHG by NSO
s
map
UNFCCC
with
statistical
clasificatio
ns
discuss a
plication
of GHG by NSO
s
othe
r action
numbe
r of cou
ntrie
s (n=
48)
YES NO
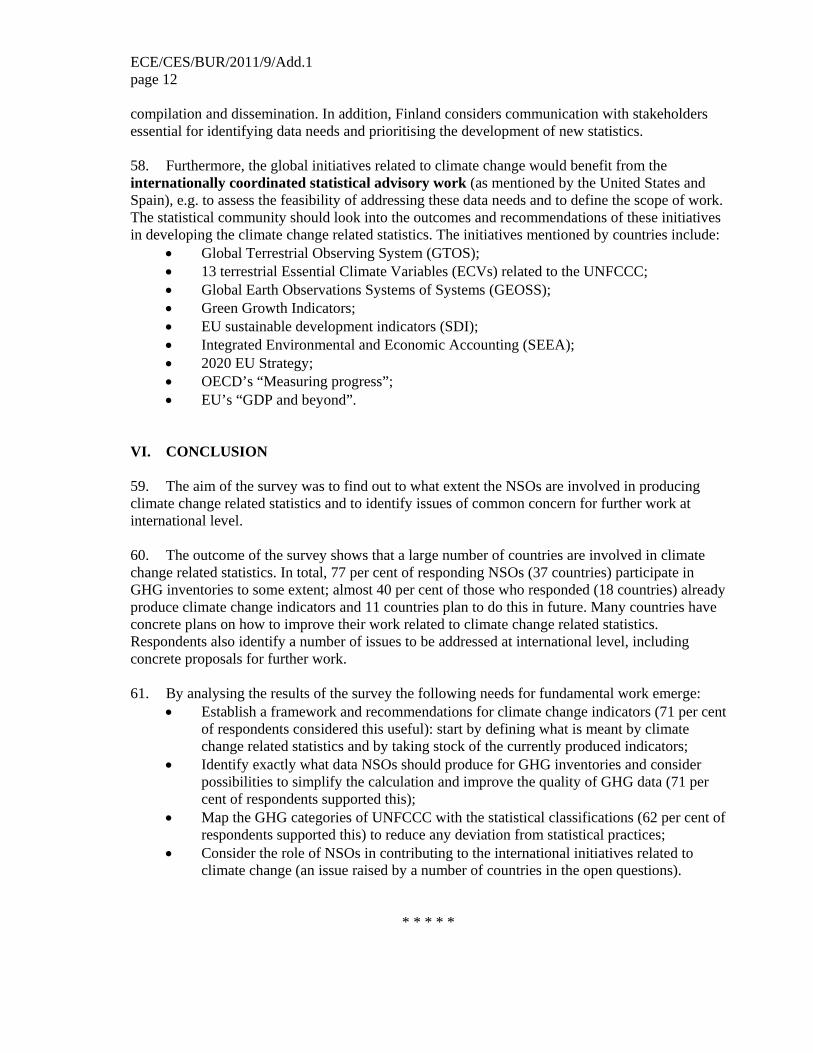
ECE/CES/BUR/2011/9/Add.1 page 12 compilation and dissemination. In addition, Finland considers communication with stakeholders essential for identifying data needs and prioritising the development of new statistics. 58. Furthermore, the global initiatives related to climate change would benefit from the internationally coordinated statistical advisory work (as mentioned by the United States and Spain), e.g. to assess the feasibility of addressing these data needs and to define the scope of work. The statistical community should look into the outcomes and recommendations of these initiatives in developing the climate change related statistics. The initiatives mentioned by countries include:
• Global Terrestrial Observing System (GTOS); • 13 terrestrial Essential Climate Variables (ECVs) related to the UNFCCC; • Global Earth Observations Systems of Systems (GEOSS); • Green Growth Indicators; • EU sustainable development indicators (SDI); • Integrated Environmental and Economic Accounting (SEEA); • 2020 EU Strategy; • OECD’s “Measuring progress”; • EU’s “GDP and beyond”.
VI. CONCLUSION
59. The aim of the survey was to find out to what extent the NSOs are involved in producing climate change related statistics and to identify issues of common concern for further work at international level. 60. The outcome of the survey shows that a large number of countries are involved in climate change related statistics. In total, 77 per cent of responding NSOs (37 countries) participate in GHG inventories to some extent; almost 40 per cent of those who responded (18 countries) already produce climate change indicators and 11 countries plan to do this in future. Many countries have concrete plans on how to improve their work related to climate change related statistics. Respondents also identify a number of issues to be addressed at international level, including concrete proposals for further work. 61. By analysing the results of the survey the following needs for fundamental work emerge:
• Establish a framework and recommendations for climate change indicators (71 per cent of respondents considered this useful): start by defining what is meant by climate change related statistics and by taking stock of the currently produced indicators;
• Identify exactly what data NSOs should produce for GHG inventories and consider possibilities to simplify the calculation and improve the quality of GHG data (71 per cent of respondents supported this);
• Map the GHG categories of UNFCCC with the statistical classifications (62 per cent of respondents supported this) to reduce any deviation from statistical practices;
• Consider the role of NSOs in contributing to the international initiatives related to climate change (an issue raised by a number of countries in the open questions).
* * * * *
ECE/CES/BUR/2011/9/Add.1 page 13
ANNEX 1. QUESTIONNAIRE ON CLIMATE CHANGE RELATED STATISTICS
CLIMATE CHANGE RELATED STATISTICS
QUESTIONNAIRE TO NATIONAL STATISTICAL ORGANISATIONS
Explanatory Note
The statistical community is increasingly recognizing the need to develop better statistics related to climate change. However, this is a new area and statistical offices are still in the process of establishing their role among the many institutions involved in producing climate change related data. In response to the growing importance of this area, the Bureau of the Conference of European Statisticians (CES) asked the UNECE secretariat to undertake a survey to explore the degree to which national statistical organisations are involved in producing emission inventories and other climate change related statistics. The aim of the survey is to identify common concerns and needs of official statistics to be addressed at the international level. We would be very grateful if you could fill in the attached questionnaire and send your response to Ms. Vania Etropolska ([email protected]) with a copy to Ms. Bénédicte Boudol ([email protected]). The questionnaire was developed in consultation with Statistics Norway, Statistics Finland, Eurostat and the European Environment Agency (EEA). It consists of three parts:
Part A – Greenhouse Gas Emissions – focuses on involvement of national statistical offices in producing data for emission inventories.
Part B – State and Impact Indicators of Climate Change– deals with indicators to describe the state of climate and the impacts of climate change in ecological, social and economic areas and human health.
Part C – General Questions – includes questions about concerns, priorities, future plans, etc.
The survey is carried out in close collaboration with Eurostat and in coordination with the UN Statistics Division in New York. This work is also undertaken at the request of the UN Committee of Experts on Environmental-Economic Accounting which has been asked by the Statistical Commission to identify possible statistical activities related to climate change.
ECE/CES/BUR/2011/9/Add.1 page 14
Climate Change Related Statistics
QUESTIONNAIRE TO NATIONAL STATISTICAL ORGANIZATIONS
Please provide your contact information:
Country: Name of organisation: Contact person: Email: Tel:
I. Part A – Greenhouse Gas Emissions
1. Is your Organisation involved in work related to greenhouse gas (GHG) emissions (e.g.
collecting data, calculating GHG emissions, maintaining GHG inventories, providing data for other institutions who calculate the emissions, etc.)? Please specify in what way:
If your Organisation is not involved in work related to the GHG emissions please go to Part B.
2. Does your Organisation cooperate with other Institutions/Agencies in the work related to
GHG emissions? Yes - Please describe the coordination mechanism and the name of the institutions involved: No
3. Do you report GHG data to International/Regional Organizations?
Yes - Please specify: No
4. Is your Organisation involved in the calculation of the following GHG emissions?
carbon dioxide CO2 methane CH4 nitrous oxide N2O sulphurhexafluoride SF6 HFCs compounds (hydrofluorocarbons) PFCs compounds (perfluorocarbons)
ECE/CES/BUR/2011/9/Add.1 page 15
5. Do you calculate emissions on other indirect greenhouse gases (i.e. carbon monoxide CO, nitrogen oxides NOx, sulphur dioxide SO2, non-methane volatile organic compounds NMVOC)?
Yes - Please specify: No
6. For which sectors of the UNFCCC Common Reporting Format (Annex I) does your
Organisation collect data for emission reporting and/or calculate emissions?
Data collection for Calculation of
emission reporting GHG emissions
Energy Industrial Processes Solvents and Other Product Use Agriculture Land use, Land-use change and Forestry Waste
7. For which sources of GHG emissions does your Organisation collect data for emission
reporting and/or calculate emissions? Stationary sources Mobile sources Households
8. Does your Organisation have any other tasks related to the national GHG inventory?
Yes - Please specify: No
II. Part B – State and Impact Indicators of Climate Change
This part of the questionnaire deals with state and impact indicators to assess the state of climate and its associated impacts on ecological, social and economic functions and human health. The state indicators give the quantitative and qualitative description of the actual changes occurring in the climate. State indicators may, for example, describe temperature increases, shifts in average temperature, rising sea levels, melting glaciers, or changing precipitation. The impact indicators are used to describe the consequences of the climate change, including an increased risk of floods and droughts, losses of biodiversity, reduced availability of water resources, threats to human health, and damage to economic sectors such as energy, transport, forestry, agriculture, and tourism1.
1 For further information on state and impact indicators please see the EEA Report “Impacts of Europe’s changing climate – 2008 indicator-based assessment“: http://www.eea.europa.eu/publications/eea_report_2008_4
ECE/CES/BUR/2011/9/Add.1 page 16
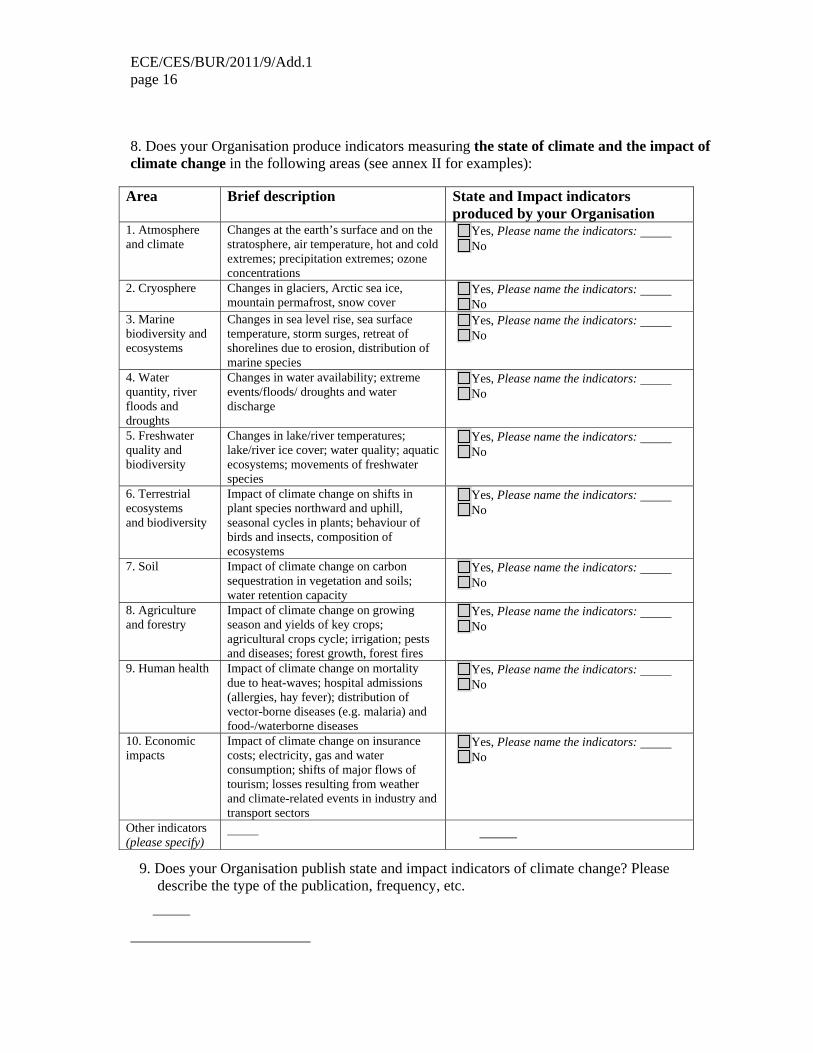
8. Does your Organisation produce indicators measuring the state of climate and the impact of climate change in the following areas (see annex II for examples):
Area Brief description State and Impact indicators produced by your Organisation
1. Atmosphere and climate
Changes at the earth’s surface and on the stratosphere, air temperature, hot and cold extremes; precipitation extremes; ozone concentrations
Yes, Please name the indicators: No
2. Cryosphere Changes in glaciers, Arctic sea ice, mountain permafrost, snow cover
Yes, Please name the indicators: No
3. Marine biodiversity and ecosystems
Changes in sea level rise, sea surface temperature, storm surges, retreat of shorelines due to erosion, distribution of marine species
Yes, Please name the indicators: No
4. Water quantity, river floods and droughts
Changes in water availability; extreme events/floods/ droughts and water discharge
Yes, Please name the indicators: No
5. Freshwater quality and biodiversity
Changes in lake/river temperatures; lake/river ice cover; water quality; aquatic ecosystems; movements of freshwater species
Yes, Please name the indicators: No
6. Terrestrial ecosystems and biodiversity
Impact of climate change on shifts in plant species northward and uphill, seasonal cycles in plants; behaviour of birds and insects, composition of ecosystems
Yes, Please name the indicators: No
7. Soil Impact of climate change on carbon sequestration in vegetation and soils; water retention capacity
Yes, Please name the indicators: No
8. Agriculture and forestry
Impact of climate change on growing season and yields of key crops; agricultural crops cycle; irrigation; pests and diseases; forest growth, forest fires
Yes, Please name the indicators: No
9. Human health Impact of climate change on mortality due to heat-waves; hospital admissions (allergies, hay fever); distribution of vector-borne diseases (e.g. malaria) and food-/waterborne diseases
Yes, Please name the indicators: No
10. Economic impacts
Impact of climate change on insurance costs; electricity, gas and water consumption; shifts of major flows of tourism; losses resulting from weather and climate-related events in industry and transport sectors
Yes, Please name the indicators: No
Other indicators (please specify)
9. Does your Organisation publish state and impact indicators of climate change? Please describe the type of the publication, frequency, etc.
ECE/CES/BUR/2011/9/Add.1 page 17 III. Part C – General Questions
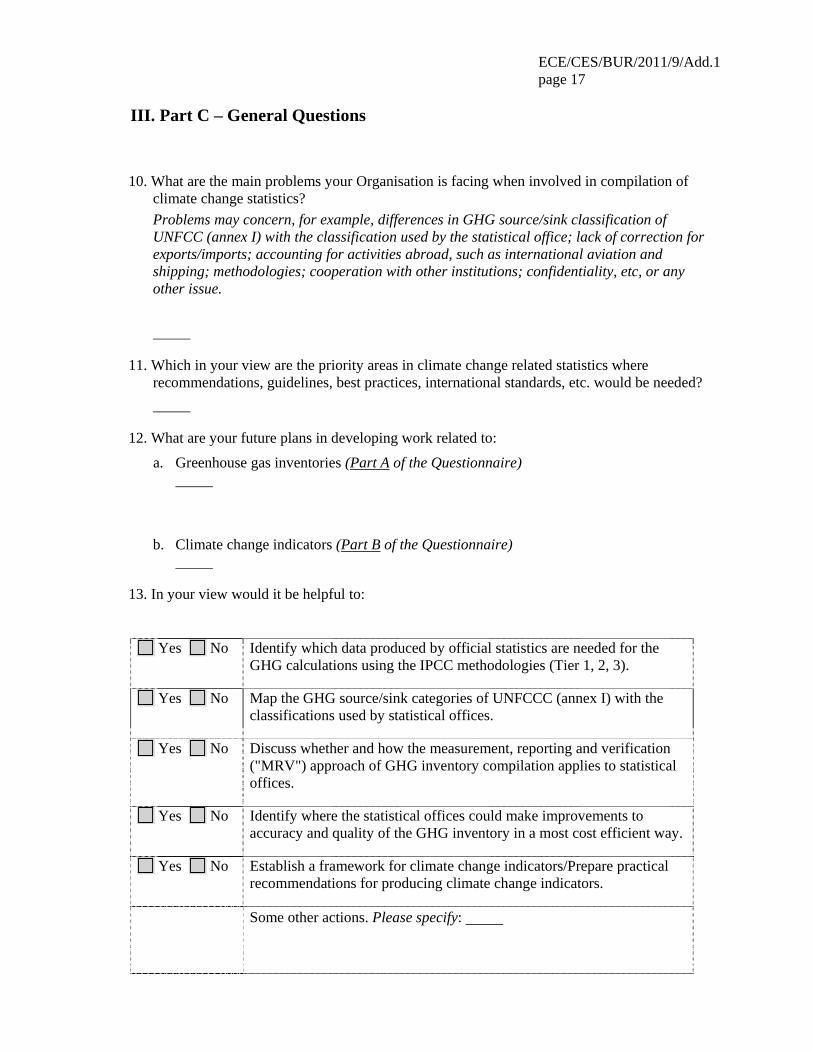
10. What are the main problems your Organisation is facing when involved in compilation of climate change statistics? Problems may concern, for example, differences in GHG source/sink classification of UNFCC (annex I) with the classification used by the statistical office; lack of correction for exports/imports; accounting for activities abroad, such as international aviation and shipping; methodologies; cooperation with other institutions; confidentiality, etc, or any other issue.
11. Which in your view are the priority areas in climate change related statistics where recommendations, guidelines, best practices, international standards, etc. would be needed?
12. What are your future plans in developing work related to:
a. Greenhouse gas inventories (Part A of the Questionnaire)
b. Climate change indicators (Part B of the Questionnaire)
13. In your view would it be helpful to:
Yes No Identify which data produced by official statistics are needed for the GHG calculations using the IPCC methodologies (Tier 1, 2, 3).
Yes No Map the GHG source/sink categories of UNFCCC (annex I) with the classifications used by statistical offices.
Yes No Discuss whether and how the measurement, reporting and verification ("MRV") approach of GHG inventory compilation applies to statistical offices.
Yes No Identify where the statistical offices could make improvements to accuracy and quality of the GHG inventory in a most cost efficient way.
Yes No Establish a framework for climate change indicators/Prepare practical recommendations for producing climate change indicators.
Some other actions. Please specify:
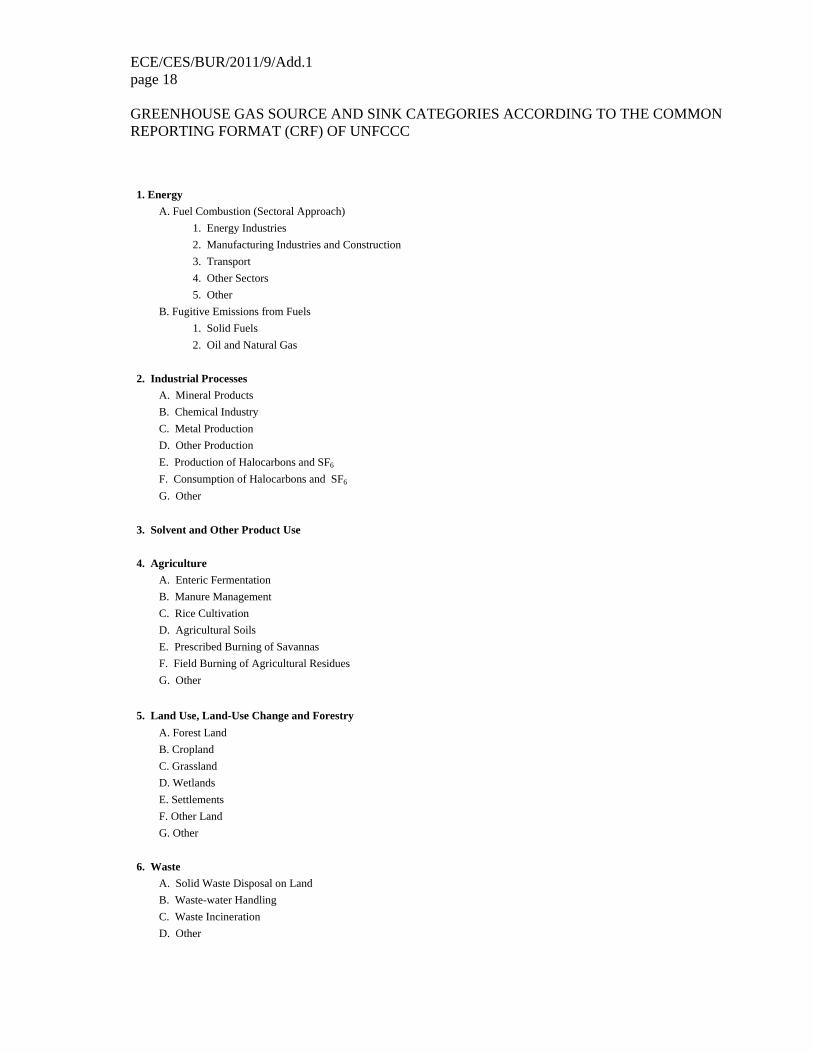
ECE/CES/BUR/2011/9/Add.1 page 18 GREENHOUSE GAS SOURCE AND SINK CATEGORIES ACCORDING TO THE COMMON REPORTING FORMAT (CRF) OF UNFCCC
1. Energy A. Fuel Combustion (Sectoral Approach)
1. Energy Industries 2. Manufacturing Industries and Construction 3. Transport 4. Other Sectors 5. Other
B. Fugitive Emissions from Fuels 1. Solid Fuels 2. Oil and Natural Gas
2. Industrial Processes
A. Mineral Products B. Chemical Industry C. Metal Production D. Other Production E. Production of Halocarbons and SF6 F. Consumption of Halocarbons and SF6 G. Other
3. Solvent and Other Product Use 4. Agriculture
A. Enteric Fermentation B. Manure Management C. Rice Cultivation D. Agricultural Soils E. Prescribed Burning of Savannas F. Field Burning of Agricultural Residues G. Other
5. Land Use, Land-Use Change and Forestry
A. Forest Land B. Cropland C. Grassland D. Wetlands E. Settlements F. Other Land G. Other
6. Waste
A. Solid Waste Disposal on Land B. Waste-water Handling C. Waste Incineration D. Other
ECE/CES/BUR/2011/9/Add.1 page 19 EXAMPLES OF THE USE OF CLIMATE CHANGE INDICATORS2
Atmosphere and climate
Recent observations confirm that the global mean temperature has increased by 0.8 °C compared with pre-industrial times for land and oceans, and by 1.0 °C for land alone. Europe has warmed more than the global average (1.0 and 1.2 °C, respectively), especially in the south-west, the north-east and mountain areas. Projections suggest further temperature increases in Europe between 1.0–5.5 °C by the end of the century, which is also higher than projected global warming (1.8–4.0 °C). Whether the EU's goal of less then 2 °C global warming (compared with pre-industrial levels) will be exceeded will depend on the effectiveness of international climate policy regarding global greenhouse gas emission reductions. More frequent and more intense hot extremes and a decreasing number of cold extremes have occurred the past 50 years and this trend is projected to continue.
Changes in precipitation show more spatially variable trends across Europe. Annual precipitation changes are already exacerbating differences between a wet northern part (an increase of 10 to 40 % during the 20th century) and a dry southern part (a decrease of up to 20 % in some parts of southern Europe). The intensity of precipitation extremes such as heavy rain events has increased in the past 50 years, and these events are projected to become more frequent. Dry periods are projected to increase in length and frequency, especially in southern Europe.
No clear trend in the frequency and intensity of storms has yet been observed, but the strength of the heaviest storms is projected to increase, albeit with slightly lower frequency. Climate variability and change have contributed to an increase in ozone concentrations in central and south-western Europe.
Cryosphere
The cryosphere (the frozen world) is important since it is affected by climate change, while changes in the cryosphere itself have a major effect on the climate system. European glaciers are melting rapidly: those in the Alps have lost two thirds of their volume since 1850, with loss accelerating since the 1980s, and they are projected to continue their decline. Snow cover has decreased by 1.3 % per decade during the past 40 years, with the greatest losses in spring and summer, and decreases are projected to continue.
The reduction in Arctic sea ice, especially in summer, has accelerated the past five decades, with a record low extent in September 2007 of about half the normal minimum in the 1950s. Species specialised for life in the ice are threatened. Less ice will ease access to the Arctic's resources. Oil and gas exploration, shipping, tourism and fisheries will offer new economic opportunities, but also increase risks to the Arctic environment.
Also mountain permafrost is reducing due to increasing temperatures, which is already increasing natural hazards and damage of high-mountain infrastructure. The Greenland ice sheet has lost ice since the 1990s, probably at an increasing rate. Hence its contribution to global sea-level rise has increased in the past decades. Accelerated flow of outlet glaciers to the sea accounts for more of the ice loss than melting. The processes causing the faster movement of the glaciers are poorly understood and there is a lack of long-term observations.
Marine biodiversity and ecosystems
According to satellite observations, the rate of global mean sea-level rise has increased to 3.1 mm/year in the past 15 years (compared with a global average of 1.7 mm/year in the 20th century). Because of ocean circulation and gravity effects, sea-level rise is not uniform but varies across European seas. An acceleration of sea surface temperature increases has also been observed in recent decades. Sea-level rise can cause flooding, coastal erosion and the loss of flat and low-lying coastal regions. It increases the likelihood of storm surges, enforces landward intrusion of salt water and endangers coastal ecosystems and wetlands.
Changes in the timing of seasonal biological phenomena (phenology) and distribution of marine species have been observed, including earlier seasonal cycles (by 4–6 weeks) and northward movements, by up to 1 100 km over the past 40 years, which seems to have accelerated since 2000. Sub-tropical species are occurring with increasing
2 Source: Report of the European Environment Agency (Executive summary): “Impacts of Europe's changing climate-2008 indicator-based assessment”, http://www.eea.europa.eu/publications/eea_report_2008_4/pp1-19_CC2008Executive_Summary.pdf
ECE/CES/BUR/2011/9/Add.1 page 20 frequency in European waters, and sub-Arctic species are receding northwards. The rate of northward movement of a particular species, the sailfin dory, has been estimated at about 50 km/year.
Water quantity, river floods and droughts
Climate change, including changes in temperature, precipitation, glaciers and snow cover, is intensifying the hydrological cycle. However, other factors such as land-use changes, water management practices and extensive water withdrawals have considerably changed the natural flows of water, making it difficult to detect climate change-induced trends in hydrological variables. In general, annual river flows have been observed to increase in the north and decrease in the south. Strong changes in seasonality are projected, with lower flows in summer and higher flows in winter. As a consequence, droughts and water stress will increase, particularly in the south and in summer.
In the past, the recorded number of river floods has been strongly influenced by improved monitoring and reporting systems. For example since 1990, 259 major river floods have been reported in Europe, of which 165 have been reported since 2000.
Projected climate-induced changes in the hydrological cycle will aggravate the impact of other stresses (such as land-use and socio-economic changes) on water availability, freshwater ecosystems, energy production, navigation, freshwater supply and use (in agriculture, households, industry) and tourism.
Freshwater quality and biodiversity
Increased temperatures of lakes and rivers (by 1–3 °C during the 20th century) have resulted in decreases in ice cover on lakes and rivers by 12 days on average in the last century in Europe. These changes can be at least partly attributed to climate change, and partly to other causes such as freshwater use for cooling processes (e.g. power plants). Lake and river surface water temperatures are projected to increase further with increasing air temperatures. Warming of surface water can have several effects on water quality and hence on human use and aquatic ecosystems. Changes include movement of freshwater species northwards and to higher altitudes, changes in life-cycle events (phenology), for example spring phytoplankton and zooplankton blooms up to one month earlier than 30–40 years ago.
Terrestrial ecosystems and biodiversity
Climate change, in particular milder winters, is responsible for the observed northward and uphill distribution shifts of many European plant species. By the late 21st century, plant species are projected to have shifted several hundred kilometers to the north, forests are likely to have contracted in the south and expanded in the north, and 60 % of mountain plant species may face extinction. The timing of seasonal events in plants (phenology) is changing, for example the average advance of spring and summer between 1971 and 2000 was 2.5 days per decade. The pollen season starts on average 10 days earlier and is longer than 50 years ago.
Birds, insects, mammals and other animal groups are also moving northwards and uphill. A combination of the rate of climate change, habitat fragmentation and other obstacles will impede the movement of many animal species, possibly leading to a progressive decline in European biodiversity. Suitable climatic conditions for Europe's breeding birds are projected to shift nearly 550 km north-eastward by the end of the century, with the average range size shrinking by 20 %.
Climate change has caused advancement in the life cycles of many animal groups (phenology), including frog spawning, bird nesting and the arrival of migrant birds and butterflies. Populations may explode if the young are not exposed to normal predation pressures. Conversely, populations may crash if the emergence of vulnerable young is not in synchrony with their main food source or if shorter hibernation times lead to declines in body condition.
Soil
Information on the impacts of climate change on soil and the various related feedbacks is very limited. Indicators with full European coverage are absent and there is a need for the establishment of appropriate monitoring schemes. Changes in the bio-physical nature of soil are likely due to projected rising temperatures, changing precipitation intensity and frequency and more severe droughts. Such changes can lead to a future decline in soil organic carbon stocks and a substantial increase in CO2 emissions. Projected increased variations in rainfall pattern and intensity will make soils more susceptible to erosion. Maintaining water retention capacity is important, e.g. through adaptation measures. Climate change alters the habitat of soil biota, which affects the diversity and structure of species and their abundance. Soil degradation is already intense in parts of the Mediterranean and central-eastern Europe and, together
ECE/CES/BUR/2011/9/Add.1 page 21 with prolonged drought periods and increased numbers of fires, is already contributing to an increased risk of desertification.
Agriculture and forestry
In both agriculture and forestry, climate change affects the growing season and average yields while also key relevant land-use and management changes occur, making it difficult to detect climate change-induced trends. The length of the growing season of several agricultural crops has increased at northern latitudes, favouring the introduction of new species that were not previously suitable. However, there has been a shortening of the growing season locally at southern latitudes. The flowering and maturity of several species in Europe now occurs two or three weeks earlier than in the past with consequent higher risk of frost damage from delayed spring frosts. Changes in the growing season and the timing of the cycle of agricultural crops (agrophenology) are projected to continue. Since the beginning of the 21st century, the variability of crop yields has increased as a consequence of extreme climatic events, e.g. the summer heat of 2003 and the spring drought of 2007. Increases in water demand for agriculture (by 50–70 %) has occurred mainly in Mediterranean areas.
In much of continental Europe, the majority of forests are growing faster now than in the early 20th century, due to advances in forest management practices, increased nitrogen deposition, and reduced acidification by air pollution (sulphur dioxide) and also increasing temperatures and atmospheric CO2 concentrations. Projected climate change will favour certain species in some forest locations, while making conditions worse for others, leading to substantial shifts in vegetation distribution. Periods of drought and warm winters are increasing pest populations and further weakening forests. Projected temperature increases will increase the danger of forest fires.
Human health
Increased temperatures can have various effects on human health. The large number of additional deaths during the 2003 (more than 70 000 excess deaths reported in 12 European countries) heat wave highlighted the need for adaptation actions, such as heat health action plans. A number of vector-borne diseases are expected to increase in the near future. The tiger mosquito, a transmitter of a number of viruses, has extended its range in Europe substantially over the past 15 years and is projected to extend even further. Ticks and the associated Lyme disease and tick-borne encephalitis are moving into higher altitudes and latitudes. There is a risk of additional outbreaks of Chikungunya (a virus that is highly infective and disabling but not transmissible between people) and a potential for localised dengue to re-appear. Changes in the geographic distribution of the sandfly vector are occurring in several European countries and there is a risk of human Leishmania cases further north. Some water- and food-borne disease outbreaks are expected to become more frequent with rising temperatures and more frequent extreme events.
Economic impacts
Overall losses resulting from weather- and climate-related events have clearly increased during the past 25 years. However, it is still not possible to determine the proportion of the increase in damage that might be attributed to anthropogenic climate change.
Projections suggest significantly reduced space-heating demand in northern Europe and increased space-cooling demand in southern Europe, with associated costs and benefits. Hydropower production is projected to increase in northern Europe and decrease in the south. With more severe summer droughts, the availability of cooling water for power plants could be limited.
Changes in climate are starting to reduce the attractiveness of major tourist resorts in mountain areas and the Mediterranean, while improving it in other regions. The suitability of the Mediterranean for tourism is projected to decline during the key summer months, although there will be an increased suitability during spring and autumn. This can produce shifts in the major flows of tourism within the EU, which will be very important in regions where tourism is a dominant economic sector.