Embed Size (px)
Citation preview
(Defra Project Code GA0204)
Climate Change Risk Assessment Methodology Report July 2012 Contractors: HR Wallingford
AMEC Environment & Infrastructure UK Ltd (formerly Entec UK Ltd)
The Met Office Collingwood Environmental Planning Alexander Ballard Ltd Paul Watkiss Associates Metroeconomica
ii CCRA Methodology Report
Statement of use For consideration for those undertaking the next CCRA or similar studies Dissemination status External Keywords: Climate change risk assessment, methodology Research contractor: HR Wallingford Ltd Howbery Park, Wallingford, Oxon, OX108BA Tel: +44(0)1491835381 (For contractor quality control purposes this report is also numbered EX 6798) Defra project officer: Soheila Amin-Hanjani Defra contact details: Adapting to Climate Change Programme, Department for Environment, Food and Rural Affairs (Defra) Area 3A Nobel House 17 Smith Square London SW1P 3JR
Tel: 020 7238 3000 www.defra.gov.uk/adaptation
Document History: Date Release Prepared Notes 18/06/12 1 HR Wallingford Draft for comment 02/07/12 2 HR Wallingford Final
CCRA Methodology Report iii
Summary This report describes the risk assessment methodology used for the UK Climate Change Risk Assessment 2012 (CCRA). This differs from the proposed methodology, which is described in two reports produced during the early stages of the CCRA:
Part I – This provided a review of alternative approaches and moves the discussion on from the Inception Report regarding the proposed method, but at this stage the method was only draft and needed testing (Defra, 2010a).
Part II – This provided the final method following a pilot study of the Water sector (Defra, 2010b).
The pilot study was carried out to provide tangible examples of how specific aspects of the methodology could be applied to understand future climate risks.
The Project Steering Group and In-House Experts Group played important roles in the development and refinement of the methodology. The final method was ‘signed-off’ by Adaptation Sub-Committee before it was applied across all sectors.
This report focuses on the methodology that was used for the CCRA and provides tips for applying the methodology to other national assessments. Reference should be made to the CCRA Recommendations Report (CCRA, 2012a) for a more detailed appraisal of the methodology and discussion of future research needs to enhance the methodology specifically for future CCRA cycles.
iv CCRA Methodology Report
Key Term Glossary The key terms used by the CCRA are defined below.
Adaptation (IPCC, 2007)
Autonomous adaptation – Adaptation that does not constitute a conscious1 response to climatic stimuli but is triggered by ecological changes in natural systems and by market or welfare changes in human systems. Also referred to as spontaneous adaptation.
Planned adaptation – Adaptation that is the result of a deliberate policy decision, based on an awareness that conditions have changed or are about to change and that action is required to return to, maintain, or achieve a desired state.
Adaptive Capacity -The ability of a system to design or implement effective adaptation strategies to adjust to information about potential climate change (including climate variability and extremes), to moderate potential damages, to take advantage of opportunities, or to cope with the consequences (modified from the IPCC to support project focus on management of future risks) (Ballard, 2009). As such this does not include the adaptive capacity of biophysical systems.
Adaptation costs and benefits
The costs of planning, preparing for, facilitating, and implementing adaptation measures, including transition costs.
The avoided damage costs or the accrued benefits following the adoption and implementation of adaptation measures.
Consequence - The end result or effect on society, the economy or environment caused by some event or action (e.g. economic losses, loss of life). Consequences may be beneficial or detrimental. This may be expressed descriptively and/or semi-quantitatively (high, medium, low) or quantitatively (monetary value, number of people affected, etc).
Impact - An effect of climate change on the socio-bio-physical system (e.g. flooding, rails buckling).
Response function – Function showing how climate impacts or consequences vary with key climate variables; can be based on observations, sensitivity analysis, impacts modelling and/or expert elicitation.
Risk - Combines the likelihood an event will occur with the magnitude of its outcome.
Sensitivity - The degree to which a system is affected, either adversely or beneficially, by climate variability or change.
Uncertainty - A characteristic of a system or decision where the probabilities that certain states or outcomes have occurred or may occur is not precisely known.
Vulnerability - The extent to which a system is susceptible to, or unable to cope with, adverse effects of climate change including climate variability and extremes. It depends not only on a system’s sensitivity but also on its adaptive capacity.
1 The inclusion of the word ‘conscious’ in this IPCC definition is a problem for the CCRA and we treat this as anticipated adaptation that is not part of a planned adaptation programme. It may include behavioural changes by people who are fully aware of climate change issues.
CCRA Methodology Report v
Contents Summary iii
Key Term Glossary iv
Contents v
1 Introduction 1
1.1 Background 1
1.2 Purpose and structure of this report 1
2 Framework 3
3 Outline of risk assessment method 4
4 Identify and characterise impacts 7 4.1 Step 1 – Literature review and Tier 1 analysis 7
4.2 Step 2 – Cross-sectoral and indirect consequences 7
5 Assess vulnerability 10
5.1 Step 3 – Review of Policy 10
5.2 Step 4 – Social Vulnerability 10
5.3 Step 5 – Adaptive Capacity 11
6 Identify the main risks 13
6.1 Step 6 – Selection of Tier 2 impacts 13
6.2 Step 7 – Identifying risk metrics 14
7 Assess current and future risk 15 7.1 Step 8 – Response functions 15
7.2 Step 9 – Estimates of changes in selected climate change scenarios 16
7.3 Step 10 – Socio-economic change 20
7.4 Step 11 – Economic impacts 21
8 Report on risks 25
8.1 Step 12 – Report outputs 25
9 References 32
Appendices 35
Appendix 1 – Guidance on Classifications 37
vi CCRA Methodology Report
Tables Table 6.1 Criteria scoring and weighting 13 Table 7.1 30-year time periods assessed in CCRA and their short names 16 Table 8.1 Summary of classification of relative magnitude 28 Table 8.2 Summary of classification of confidence 29
Figures Figure 2.1 Stages of the CCRA (yellow) and other actions for Government (grey) 3 Figure 3.1 Steps of the risk assessment method (Stage 3 of framework) 4 Figure 4.1 Illustration of forward chaining process 8 Figure 7.1 Examples of the range of UKCP09 climate change projections applied 17 Figure 7.2 UKCP09 Administrative Regions (left) and River Basin Regions (right) 19 Figure 8.1 Relationships between themes and sectors 27 Figure 8.2 Example of an onset plot (Agriculture & Forestry Theme) 30 Figure 8.3 Example of a scorecard (Agriculture & Forestry Theme) 31
CCRA Methodology Report 1
1 Introduction
1.1 Background
The Climate Change Act 2008 makes the UK the first country in the world to have a legally-binding long-term framework to cut greenhouse gas emissions and a framework for building the UK’s ability to adapt to a changing climate. As part of this, the Act requires:
A UK-wide climate change risk assessment that must take place every five years, with the first one having to be laid before parliament by January 2012; and
A national adaptation programme (NAP) which must be put in place and reviewed every five years, setting out the Government’s objectives, proposals and policies for responding to the risks identified in the CCRA.
The UK Climate Change Risk Assessment (CCRA) 2012 was the first of the risk assessments and was laid before parliament in January 2012.
A consortium led by HR Wallingford was commissioned to undertake the CCRA on behalf of the UK Government, funded by the Department for Environment, Food and Rural Affairs (Defra), the Devolved Governments of Scotland, Wales and Northern Ireland and, in the first year, the Regional Development Agencies.
The CCRA assessed the main risks and opportunities in the UK from climate change. It assessed risks in and across sectors, enabling comparison between different sectors. It provides underpinning evidence that can be used by the UK Governments to help inform priorities for action and appropriate adaptation measures. It also highlights where more work is needed to understand better the scale and nature of the risks, and to help Government to consider what action (if any) needs to be taken.
The CCRA is being followed by national adaptation programmes in England, Wales, Scotland and Northern Ireland. Further economic analysis is currently underway to supplement the findings from the CCRA to inform Government about the case for further action and the costs and benefits of a number of options for adaptation to climate change.
1.2 Purpose and structure of this report
The purpose of this report is to provide a summary of the methodology applied to this first CCRA. Therefore, it explains what was done, but then it also gives tips for applying the methodology to other national assessments.
It starts by explaining how the risk assessment fits within the overall framework for adaptation planning. It then focuses on the steps involved in the risk assessment.
For ease of use, this report does not provide detailed discussion of why a certain approach was adopted, nor does it give an in-depth appraisal of the effectiveness of the approach. This information is provided in the following separate CCRA reports:
The two Method Reports (Defra, 2010a, b) that were produced during the early stages of the project; and
2 CCRA Methodology Report
The Recommendations Report (CCRA, 2012a) that was produced after the risk assessment had been completed, which provides a more detailed appraisal of the methodology and discussion of future research needs to enhance the methodology specifically for future CCRA cycles.
For details of how the method was applied to specific risks, reference should be made to the CCRA Sector Reports:
Agriculture (Knox et al., 2012)
Biodiversity and Ecosystem Services (Brown et al., 2012)
Built Environment (Capon et al., 2012)
Business, Industry and Services (Baglee et al., 2012)
Energy (McColl et al., 2012)
Floods and Coastal Erosion (Ramsbottom et al., 2012)
Forestry (Moffat et al., 2012)
Health (Hames et al., 2012)
Marine and Fisheries (Pinnegar et al., 2012)
Transport (Thornes et al., 2012)
Water (Rance et al., 2012)
CCRA Methodology Report 3
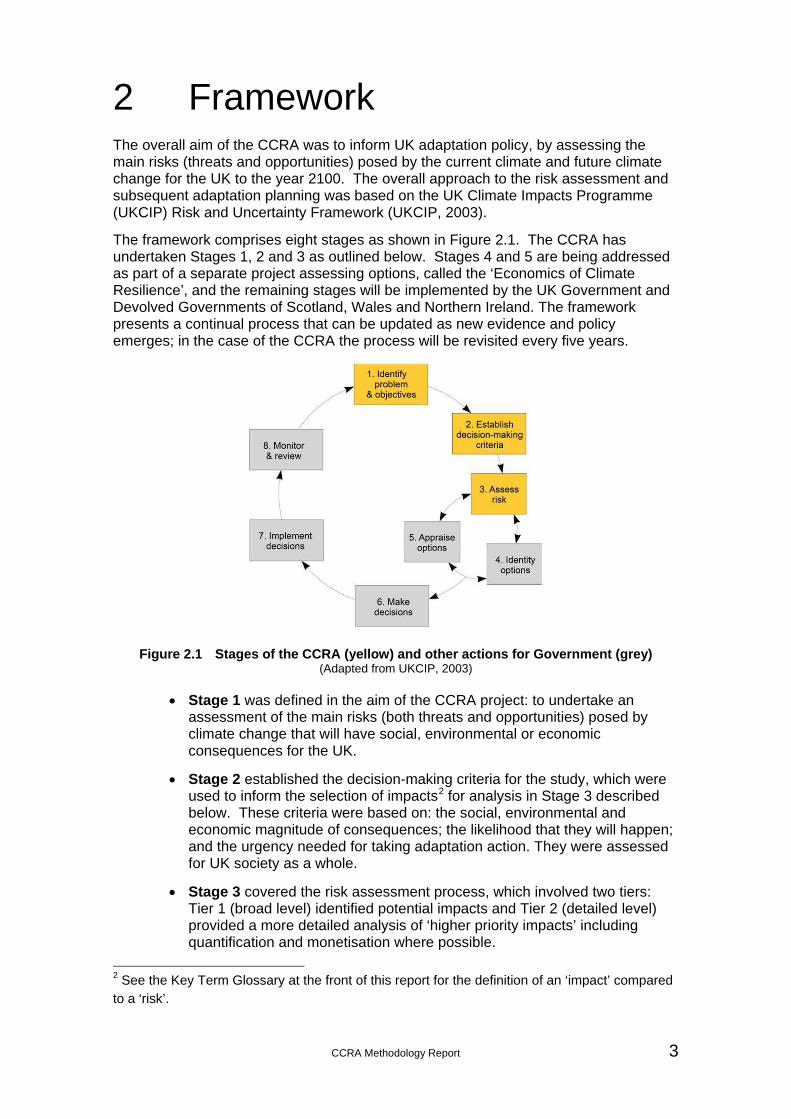
2 Framework The overall aim of the CCRA was to inform UK adaptation policy, by assessing the main risks (threats and opportunities) posed by the current climate and future climate change for the UK to the year 2100. The overall approach to the risk assessment and subsequent adaptation planning was based on the UK Climate Impacts Programme (UKCIP) Risk and Uncertainty Framework (UKCIP, 2003).
The framework comprises eight stages as shown in Figure 2.1. The CCRA has undertaken Stages 1, 2 and 3 as outlined below. Stages 4 and 5 are being addressed as part of a separate project assessing options, called the ‘Economics of Climate Resilience’, and the remaining stages will be implemented by the UK Government and Devolved Governments of Scotland, Wales and Northern Ireland. The framework presents a continual process that can be updated as new evidence and policy emerges; in the case of the CCRA the process will be revisited every five years.
Figure 2.1 Stages of the CCRA (yellow) and other actions for Government (grey) (Adapted from UKCIP, 2003)
Stage 1 was defined in the aim of the CCRA project: to undertake an
assessment of the main risks (both threats and opportunities) posed by climate change that will have social, environmental or economic consequences for the UK.
Stage 2 established the decision-making criteria for the study, which were used to inform the selection of impacts2 for analysis in Stage 3 described below. These criteria were based on: the social, environmental and economic magnitude of consequences; the likelihood that they will happen; and the urgency needed for taking adaptation action. They were assessed for UK society as a whole.
Stage 3 covered the risk assessment process, which involved two tiers: Tier 1 (broad level) identified potential impacts and Tier 2 (detailed level) provided a more detailed analysis of ‘higher priority impacts’ including quantification and monetisation where possible.
2 See the Key Term Glossary at the front of this report for the definition of an ‘impact’ compared to a ‘risk’.
4 CCRA Methodology Report
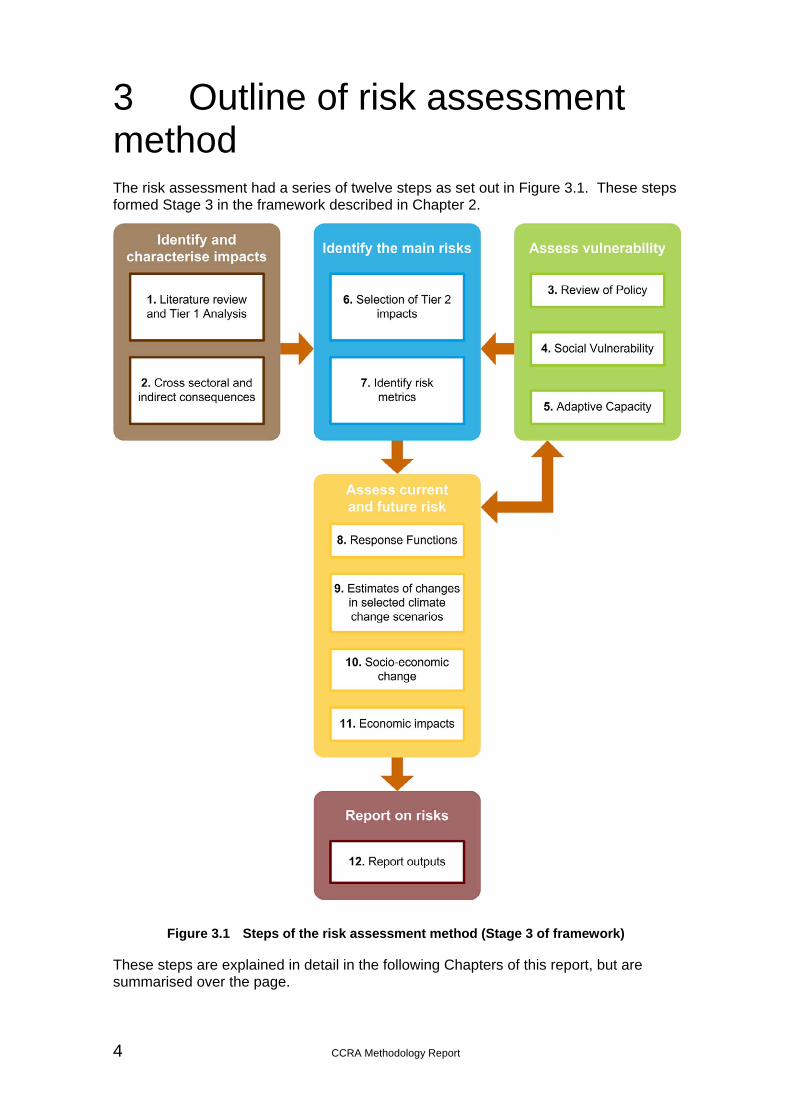
3 Outline of risk assessment method The risk assessment had a series of twelve steps as set out in Figure 3.1. These steps formed Stage 3 in the framework described in Chapter 2.
Figure 3.1 Steps of the risk assessment method (Stage 3 of framework)
These steps are explained in detail in the following Chapters of this report, but are summarised over the page.
CCRA Methodology Report 5
The Stage 3 risk assessment sought to:
Identify and characterise impacts of climate change.
This was achieved by developing the Tier 1 list of impacts, which included impacts across the eleven sectors (see Section 1.2) as well as impacts not covered by the sectors and arising from cross-sectoral links.
The process included literature reviews, extensive stakeholder engagement and technical reviews.
Assess vulnerability of the UK as a whole.
This involved:
- A high level snapshot of Government policy on objectives that could be affected by climate change in the eleven sectors;
- A high level assessment of the social vulnerability to climate change impacts; and
- A high level assessment of the adaptive capacity of the sectors.
Identify the main risks for closer analysis.
This involved the selection of Tier 2 impacts for detailed analysis from the long list of impacts in Tier 1. Higher priority impacts were selected by stakeholder groups based on the social, environmental and economic magnitude of impacts and the urgency of taking action (see below).
Assess current and future risk, using climate projections and considering socio-economic factors.
The risk assessment used ‘response functions’ that provided a relationship between changes in climate with specific consequences based on analysis of historic data, the use of models or expert elicitation. In some cases this was not possible and a narrative approach was taken instead. The UKCP09 climate projections (and other climate models where necessary) were then applied to assess future risks for the 2020s, 2050s and 2080s.
With the exception of population growth, the risk assessment did not take account of changes in society (e.g. economic growth and developments in new technologies); nor does it take account of responses to climate risks (e.g. future or planned Government policies or private adaptation investment plans).
Report on risks to inform action
The main reporting of the risk assessment findings for the CCRA took the following forms:
- Eleven Sector Reports (as listed in Section 1.2) that present in detail the findings for each sector and methods used for assessing individual risks. These formed the main evidence base for the reports below.
- The Evidence Report (CCRA, 2012b) that draws together the main findings from the project, outlining the risks to the UK as a whole, including consideration of cross-cutting issues and interdependencies.
- The Devolved Administration (DA) Reports (CCRA, 2012c, d, e) that present the findings from the Sector Reports for Scotland, Wales and Northern Ireland, based around the threats and opportunities most
6 CCRA Methodology Report
relevant for each country and taking into consideration the specific vulnerabilities of each country.
- Summaries that accompany each of the reports above.
Further details of reports can be found in the Recommendations Report (CCRA, 2012a).
This stage included peer reviews by academics and industry experts, reviews by UK Government Departments and Devolved Governments, and liaison with the Adaptation Sub-Committee.
CCRA Methodology Report 7
4 Identify and characterise impacts
4.1 Step 1 – Literature review and Tier 1 analysis
This step scoped the potential impacts and consequences of climate change for the UK across the eleven sectors based on:
Existing evidence available to the project team, which included information from literature reviews and ongoing research being carried out within the project team;
Stakeholder feedback from workshops, telephone interviews and an online questionnaire;
Expert opinion, available within the organisations represented in the project team or external organisations.
This was a very broad and shallow assessment that developed Tier 1 lists of impacts for each sector. Discussion of these impacts (and consequences) is provided in the Sector Reports (see Section 1.2).
Tip1: It can be difficult to be precise about what is an impact, consequence or risk at this early stage of discussion with stakeholders. Different people and organisations use these terms in different ways for a variety of reasons. It is helpful to have definitions of key terminology to be used by the project as early as possible to prevent confusion. The Key Term Glossary at the beginning of this report shows what was made available for this first CCRA.
Tip 2: Dividing the assessment up into the eleven sectors had its benefits, as these worked well for collecting evidence, including engaging with stakeholders. However, there are potentially other ways of organising the work. For example, we moved to using five overlapping themes for our Evidence Report (CCRA, 2012b) and DA Reports (CCRA, 2012c, d, e) – see Step 12.
4.2 Step 2 – Cross-sectoral and indirect consequences
Initially the Tier 1 lists of impacts were developed independently for each of the eleven sectors (see Step 1). Step 2 compared and rationalised these lists into a single Tier 1 list, which was then developed further to include cross-sectoral and indirect impacts. This was achieved in a number of ways including further literature reviews and a stakeholder workshop looking specifically at mapping of cross-sectoral risks. A ‘Systematic Mapping’ exercise (see Section 4.2.1) was also undertaken, which set out a flow chart to link causes and effects in a logical process. Any additional impacts identified during this step were added to the Tier 1 list. A full Tier 1 list is provided in the Evidence Report (CCRA, 2012b).
A separate study looking at how climate change impacts outside of the UK may affect the UK was carried out in parallel to the CCRA (see Section 4.2.2). Findings from the study were reviewed and included in the discussion provided in the final reporting (see Step 12), but it was difficult to assess the relative importance of international versus ‘domestic’ risks as the international study did not quantify many of the risks or categorise them in a similar way to the CCRA.
8 CCRA Methodology Report
4.2.1 Systematic Mapping
The aim of the systematic mapping was to identify key linkages between causes and effects (or consequences) and the processes that lead to change. It was largely descriptive and did not seek to quantify the change in anything other than qualitative terms and without reference to specific future scenarios. The systematic mapping was also a process based method that only considered changes that may arise due to climate change. Other drivers of change were not considered and effects that may be a result of emergent system properties (such as collective societal response to the threat of climate change) were also not considered.
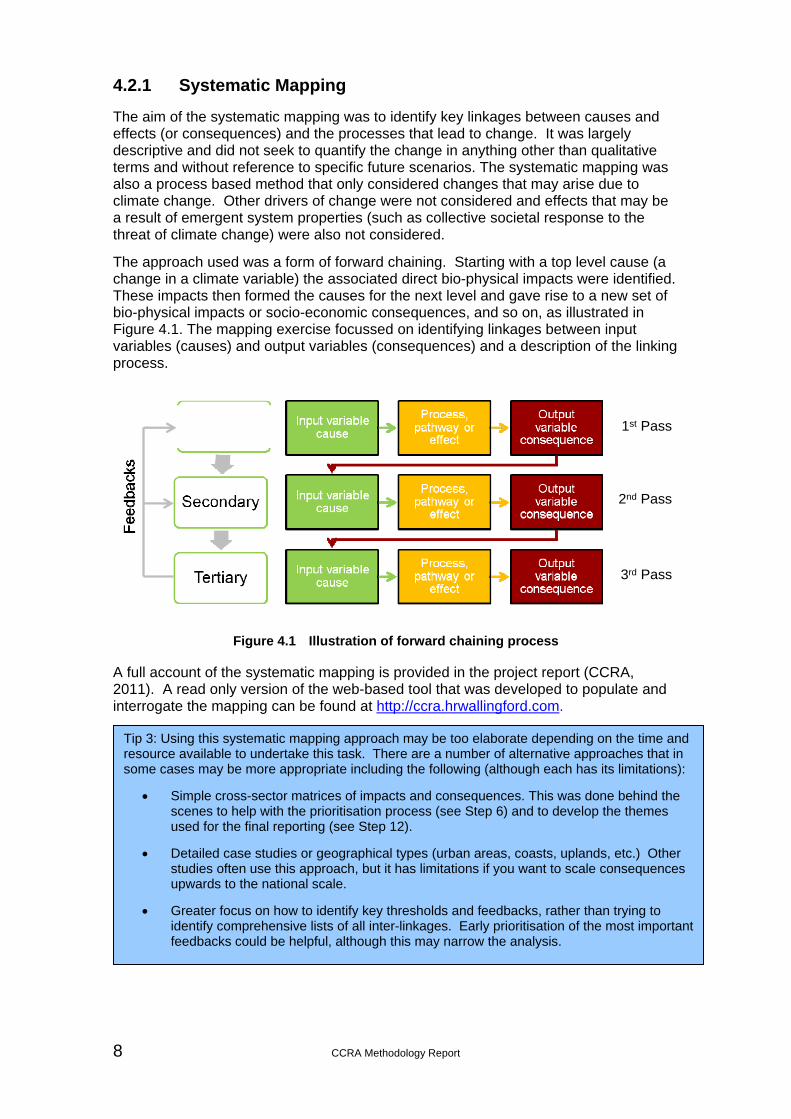
The approach used was a form of forward chaining. Starting with a top level cause (a change in a climate variable) the associated direct bio-physical impacts were identified. These impacts then formed the causes for the next level and gave rise to a new set of bio-physical impacts or socio-economic consequences, and so on, as illustrated in Figure 4.1. The mapping exercise focussed on identifying linkages between input variables (causes) and output variables (consequences) and a description of the linking process.
1st Pass
2nd Pass
3rd Pass
Figure 4.1 Illustration of forward chaining process A full account of the systematic mapping is provided in the project report (CCRA, 2011). A read only version of the web-based tool that was developed to populate and interrogate the mapping can be found at http://ccra.hrwallingford.com.
Tip 3: Using this systematic mapping approach may be too elaborate depending on the time and resource available to undertake this task. There are a number of alternative approaches that in some cases may be more appropriate including the following (although each has its limitations):
Simple cross-sector matrices of impacts and consequences. This was done behind the scenes to help with the prioritisation process (see Step 6) and to develop the themes used for the final reporting (see Step 12).
Detailed case studies or geographical types (urban areas, coasts, uplands, etc.) Other studies often use this approach, but it has limitations if you want to scale consequences upwards to the national scale.
Greater focus on how to identify key thresholds and feedbacks, rather than trying to identify comprehensive lists of all inter-linkages. Early prioritisation of the most important feedbacks could be helpful, although this may narrow the analysis.
CCRA Methodology Report 9
4.2.2 International dimensions of climate change
The Foresight International Dimensions of Climate Change (IDCC) study (Foresight, 2011) looked at political, economic and social impacts on the UK from changes taking place elsewhere in the world. The study focused on global climate change, defined as changes to the climate of countries and regions of the world other than the UK and its coastal waters. Climate change effects directly affecting the UK were not considered as this was part of the CCRA.
Both the medium term (generally up to 2030) and the long term (generally up to 2050 and where possible beyond to 2100) were considered.
The approach was used in the project can be summarised as the following:
Identify important areas of potential impact: academics, experts from the private sector, and policy-makers were consulted to help identify areas for analysis. Nine broad areas were selected:
- Global governance and institutions
- Financial services and insurance
- Legislation
- Global infrastructure
- Physical resources and commodities
- Science and technology
- Health
- Migration
- Human behaviour.
Base the analysis on scientific and other evidence: a wide range of existing research, articles and reports from academia, government and other sources were used to inform the project, including international studies on direct impacts of climate change carried out by countries with strong links to the UK. Reviews were also commissioned from leading academics and private sector experts to provide in-depth and independent analysis in the areas listed above, including climate modelling carried out by the UK Met Office Hadley Centre.
Identify areas of uncertainty: on the time horizons considered, many factors (including climate change projections, demographic change and economic and social trends) are subject to considerable uncertainty. In some instances the range of uncertainty can be described. In others, experts may disagree, or there will be more fundamental gaps in the evidence. Where uncertainties exist, their nature and extent were highlighted. These were not seen as a limitation to the analysis but as an inevitable feature of long-term projections.
Tip 4: In order to have a complete national picture of risks, it is important to consider the relative importance of international versus domestic risks on society. The existing methodology could be developed further (perhaps alongside development of socio-economic scenarios – see Step 10) to enable a more integrated assessment of international risks.
10 CCRA Methodology Report
5 Assess vulnerability
5.1 Step 3 – Review of Policy
The Sector Reports included an overview of selected relevant UK and Devolved Government policy as this provided important context for understanding how risks that are influenced by climate relate to existing policies. This in turn informed our understanding of the urgency with which adaptation decisions would need to be taken (see Step 6).
Tip 5: Government policy on climate change develops and changes rapidly to keep pace with emerging science and understanding of how to respond through mitigation and adaptation. Therefore, it is very important to work closely with Government to have information that is as up to date as possible, whilst recognising that this can only really be a snapshot at any given time.
Tip 6: The Government’s Green Book (HM Treasury, 2003) provides consistent and long-term guidance on analysing economic, social and environmental costs and benefits regardless of changes to more detailed policies.
5.2 Step 4 – Social Vulnerability
The vulnerability of different groups in society to the climate change risks for each sector was considered at a high level through a check list of questions that was completed based on desk studies and informed judgement (see Section 5.2.1).
This information was provided for context; it was not a detailed assessment of social vulnerability to specific impacts. However, it did help to inform our understanding of the potential magnitude of social impacts and the urgency with which adaptation decisions would need to be taken (see Step 6) and in a few cases where data was available also influenced the selection of suitable risk metrics (see Step 7).
Note that this step is different from Step 10, which considered how changes in society may affect the risks.
Annex B of the Evidence Report (Twigger-Ross and Orr, 2012) provides a short review of available evidence on social vulnerability and climate change impacts, taking forward the work described above by examining in more detail the question of vulnerability to the major types of climate change impacts: heat, drought and flooding.
Tip 7: Consideration of social vulnerability should be included as early as possible so that it informs the risk assessment.
The distributional effects of climate impacts within the UK is a relatively new topic and incorporation of social vulnerability into climate risk assessments is still an emerging field of research. In the future it may be possible to have a more sophisticated approach, for example:
Development and use of indicator data from the national census, such as the Multiple Deprivation Indicator.
The use of more detailed and in-depth case studies of vulnerability to specific risks to inform the national assessment.
CCRA Methodology Report 11
5.2.1 Social Vulnerability Check List
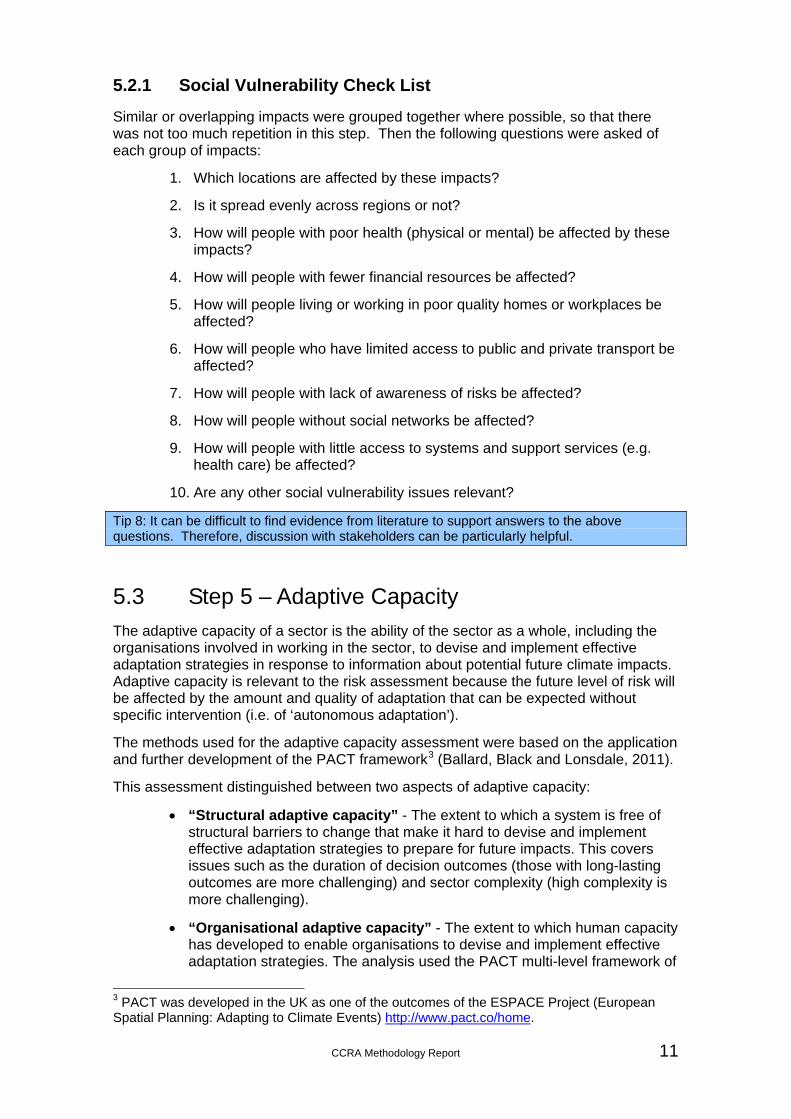
Similar or overlapping impacts were grouped together where possible, so that there was not too much repetition in this step. Then the following questions were asked of each group of impacts:
1. Which locations are affected by these impacts?
2. Is it spread evenly across regions or not?
3. How will people with poor health (physical or mental) be affected by these impacts?
4. How will people with fewer financial resources be affected?
5. How will people living or working in poor quality homes or workplaces be affected?
6. How will people who have limited access to public and private transport be affected?
7. How will people with lack of awareness of risks be affected?
8. How will people without social networks be affected?
9. How will people with little access to systems and support services (e.g. health care) be affected?
10. Are any other social vulnerability issues relevant?
Tip 8: It can be difficult to find evidence from literature to support answers to the above questions. Therefore, discussion with stakeholders can be particularly helpful.
5.3 Step 5 – Adaptive Capacity
The adaptive capacity of a sector is the ability of the sector as a whole, including the organisations involved in working in the sector, to devise and implement effective adaptation strategies in response to information about potential future climate impacts. Adaptive capacity is relevant to the risk assessment because the future level of risk will be affected by the amount and quality of adaptation that can be expected without specific intervention (i.e. of ‘autonomous adaptation’).
The methods used for the adaptive capacity assessment were based on the application and further development of the PACT framework3 (Ballard, Black and Lonsdale, 2011).
This assessment distinguished between two aspects of adaptive capacity:
“Structural adaptive capacity” - The extent to which a system is free of structural barriers to change that make it hard to devise and implement effective adaptation strategies to prepare for future impacts. This covers issues such as the duration of decision outcomes (those with long-lasting outcomes are more challenging) and sector complexity (high complexity is more challenging).
“Organisational adaptive capacity” - The extent to which human capacity has developed to enable organisations to devise and implement effective adaptation strategies. The analysis used the PACT multi-level framework of
3 PACT was developed in the UK as one of the outcomes of the ESPACE Project (European Spatial Planning: Adapting to Climate Events) http://www.pact.co/home.
12 CCRA Methodology Report
adaptive capacity to assess this. It recognises different levels of adaptation, from entry level (‘Engaging’) to advanced levels (‘Pioneering’ and ‘Leading’), all of which may be needed for effective adaptation.
The adaptive capacity assessment influenced the risk assessment by improving our understanding of levels of autonomous adaptation, which was an important consideration when determining response functions (see Step 8). It also improved our understanding of decision-making within sectors and contributed to the development of the ‘urgency’ criteria applied to the risk assessment results (see Step 12).
However, this step was primarily designed to be a major input into the follow-on project assessing options, the ‘Economics of Climate Resilience’ (Stages 4 and 4 of the framework).
Tip 9: Assessments of adaptive capacity require significant time and resources to cover all relevant organisations and key decisions related to adaptation. Further research work is needed to develop an approach for integrating this into future risk assessments. In order to be fully integrated into a risk assessment, an adaptive capacity assessment would need to be undertaken early and across all sectors.
Tip 10: Assessments of adaptive capacity can be particularly useful at highlighting real practical barriers to adaptation and actions that could improve adaptive capacity within or across sectors.
Within the natural environment, adaptive capacity can be considered as having two components: the inherent biological and ecological adaptive capacity of ecosystems and the socio-economic factors determining the ability to implement planned adaptation measures (Linder et al., 2010).
The CCRA work on adaptive capacity focused on the socio-economic factors (i.e. structural and organisational adaptive capacity of human systems). The Biodiversity & Ecosystem Services Sector Report, however, also provided an overview of findings of other work looking at ‘natural adaptive capacity’ and discussed interactions between both components (Brown et al., 2010).
CCRA Methodology Report 13
6 Identify the main risks
6.1 Step 6 – Selection of Tier 2 impacts
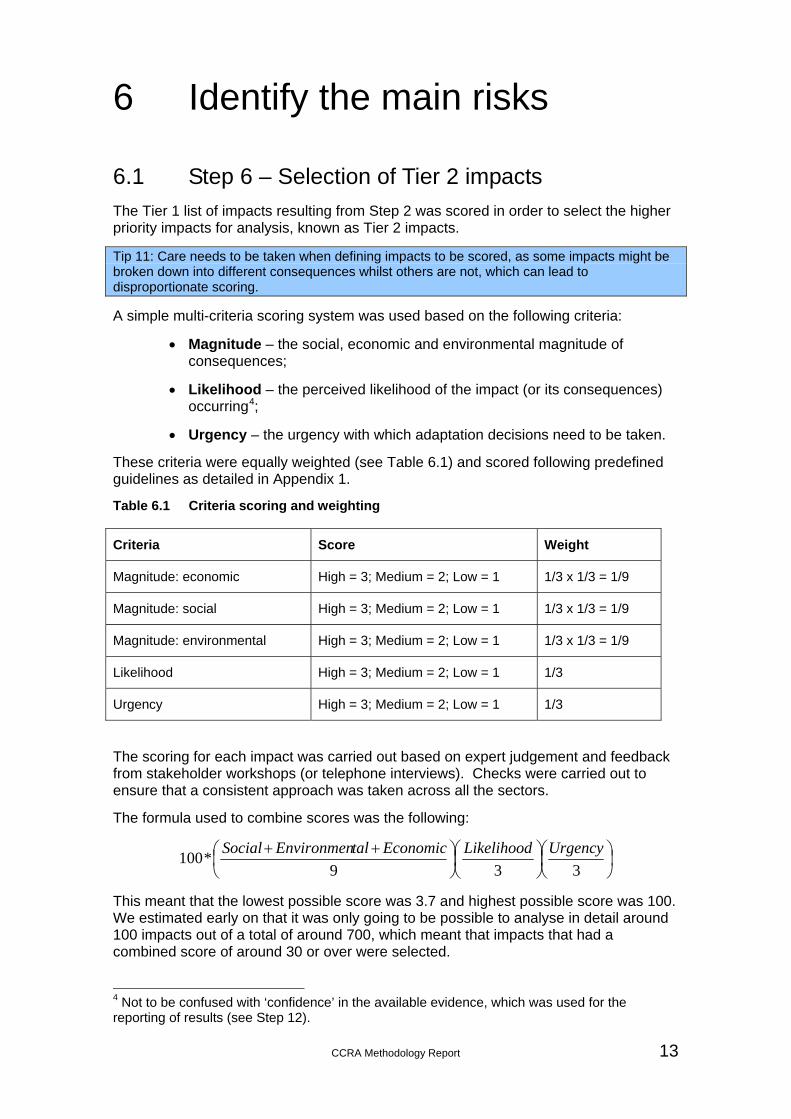
The Tier 1 list of impacts resulting from Step 2 was scored in order to select the higher priority impacts for analysis, known as Tier 2 impacts.
Tip 11: Care needs to be taken when defining impacts to be scored, as some impacts might be broken down into different consequences whilst others are not, which can lead to disproportionate scoring.
A simple multi-criteria scoring system was used based on the following criteria:
Magnitude – the social, economic and environmental magnitude of consequences;
Likelihood – the perceived likelihood of the impact (or its consequences) occurring4;
Urgency – the urgency with which adaptation decisions need to be taken.
These criteria were equally weighted (see Table 6.1) and scored following predefined guidelines as detailed in Appendix 1.
Table 6.1 Criteria scoring and weighting
Criteria Score Weight
Magnitude: economic High = 3; Medium = 2; Low = 1 1/3 x 1/3 = 1/9
Magnitude: social High = 3; Medium = 2; Low = 1 1/3 x 1/3 = 1/9
Magnitude: environmental High = 3; Medium = 2; Low = 1 1/3 x 1/3 = 1/9
Likelihood High = 3; Medium = 2; Low = 1 1/3
Urgency High = 3; Medium = 2; Low = 1 1/3
The scoring for each impact was carried out based on expert judgement and feedback from stakeholder workshops (or telephone interviews). Checks were carried out to ensure that a consistent approach was taken across all the sectors.
The formula used to combine scores was the following:
339*100
UrgencyLikelihoodEconomictalEnvironmenSocial
This meant that the lowest possible score was 3.7 and highest possible score was 100. We estimated early on that it was only going to be possible to analyse in detail around 100 impacts out of a total of around 700, which meant that impacts that had a combined score of around 30 or over were selected.
4 Not to be confused with ‘confidence’ in the available evidence, which was used for the reporting of results (see Step 12).
14 CCRA Methodology Report
The results of the scoring process for each sector are provided in the Sector Reports (see Section 1.2).
The Tier 2 list of impacts was not based on the availability of data; the scoring and selection process disregards how ‘easy’ it is to measure a particular impact.
Tip 12: When looking at impacts for society as a whole, not just for Government, some impacts threaten particular groups at the same time as benefiting others. In such cases the threat and the opportunity should be scored separately, but if either scores highly enough both should be considered for taking forward for Tier 2 analysis.
Tip 13: There are alternative ways of combining magnitude, likelihood and urgency scores. For example, the urgency score could be kept separate and the selection process would then be based on two scores. It can prove helpful to carry out sensitivity testing of alternative scoring methods to see how much this affects the outcome.
Tip 14: Whichever selection process is adopted, it is important to critically appraise the impacts that are selected for more detailed analysis and ensure that these make sense. Whilst the selection process should be transparent and applied consistently, there can be occasions when important impacts are missing and the selection process needs to be revisited.
6.1.1 Review of Tier 2 lists for the DAs
The Tier 2 list for the UK did not necessarily reflect the specific priorities for Scotland, Wales and Northern Ireland. Hence, a refined version of this list was produced for each DA based on stakeholder feedback and further country specific literature reviews. This meant that some Tier 2 impacts for the UK were dropped from the list, whilst other Tier 1 impacts were promoted.
The subsequent steps described in the remainder of this report were then equally applied to these DA Tier 2 lists.
6.2 Step 7 – Identifying risk metrics
Once the Tier 2 list of impacts was finalised, the next step was to determine whether the impact could be measured and, if so, how.
For each impact in the Tier 2 list, one or more risk metrics were identified. Risk metrics provide a measure of the consequences of climate change, related to specific climate variables or biophysical impacts. For example, in the Water Sector Report one of the impacts identified was ‘major drought’ due to reduced precipitation. The risk metrics that were identified to measure the consequences of this impact included reductions in summer river flow (Q95), change in water available for public water supply and the population in areas with future deficits. The risk metrics were developed to provide a spread of information about economic, environmental and social consequences, recognising these are not always mutually exclusive and can be used to look at the same problem from different perspectives.
Tip 15: We found it useful to have a unique reference number and standard title for each risk metric to prevent ambiguity (although as the analysis work progressed and once feedback was received it was necessary to modify some of the titles).
Tip 16: Time should be spent identifying and developing ‘effective’ risk metrics, i.e. metrics that give a true measure of a consequence and relate closely to potential adaptation actions.
Tip 17: A review should be carried out of all selected risk metrics to ensure that these provide an effective ‘suite’ of metrics that complement each other, avoiding spurious ones creeping in and obvious ones being left out.
CCRA Methodology Report 15
7 Assess current and future risk
7.1 Step 8 – Response functions
The purpose of this step is to understand the sensitivity of risk metrics to changing climate conditions. This step was carried out by developing a ‘response function’, which is a relationship to show how the risk metric varies as the climate varies.
The response functions were developed in various ways from the very simple to the more complex, depending on the data and modelling available. For example:
Sensitivity analysis of detailed models was carried out to develop a relationship between the risk metric and one or more climate variables;
Historical data were used to produce a simple statistical relationship between a risk metric and one or more climate variables;
Expert elicitation approaches5 were adopted where data and modelling was not available.
For this first CCRA, approximately half of the risk metrics could be analysed either fully or semi-quantitatively, with the remaining impacts being assessed qualitatively.
Tip 18: Whichever analysis approach is adopted, it is important to identify and record the associated assumptions and uncertainties.
This step is where greatest flexibility was needed in applying the agreed methodology and full details of how this step was undertaken for individual risk metrics can be found in the Sector Reports (see Section 1.2).
Tip 19: Particular care is required if using historical data of insufficient length or extrapolating a relationship beyond the available evidence, as there may be thresholds in natural and social systems that may either dampen or exacerbate consequences of climate change (via feedbacks). In a few cases detailed research has already been completed to identify critical thresholds in systems, but more often these thresholds are unknown and a combination of cautious qualitative assessment and expert opinion is required.
Tip 20: Adopting a common methodology across all sectors does not necessarily fit comfortably with how assessments might have been previously carried out in some sectors. Having to do things differently, however, can be insightful and encourage advances within sectors. In defining a common methodology across diverse sectors it is helpful to provide guidance on applying the method given different limitations of knowledge, data, modelling, etc. For example, the sole use of response functions in sectors such as Biodiversity & Ecosystem Services could potentially be misleading because of the multiple variables involved (both climate and non-climate) and because species, habitats and ecosystems have variable responses that are often non-linear through time. However, response functions can provide useful indicators of potential change that are then related to wider, more complex responses by interpretation of the broader evidence base.
Tip 21: Adopting a common methodology allows risks to be compared, but more detailed analysis may be required for some risks before adaptation planning can be undertaken.
5 Examples of approaches that can be applied include Cooke (1991) and Aspinall (2010).
16 CCRA Methodology Report
7.2 Step 9 – Estimates of changes in selected climate change scenarios
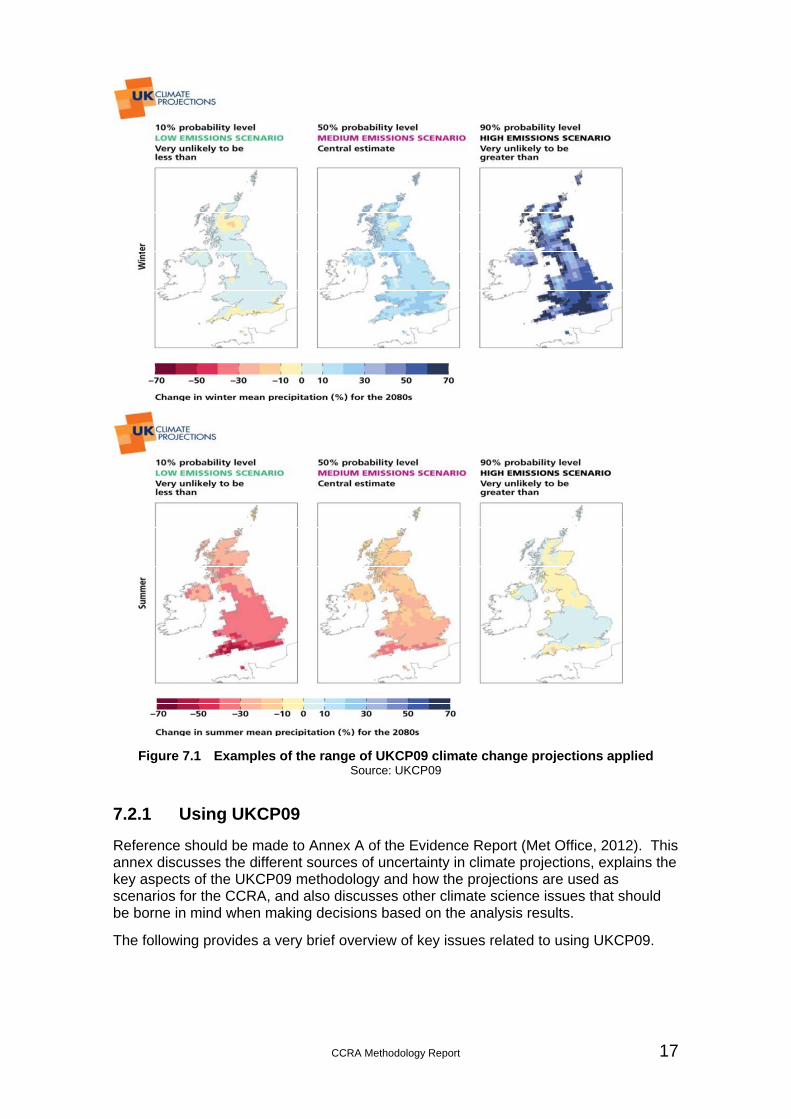
The response functions were used to assess the magnitude of consequences the UK may face due to climate change by applying (in most cases) the UKCP09 climate projections. This step used the response functions to provide estimates of future risk under three different emissions scenarios (High emissions, A1FI; Medium emissions, A1B; Low emissions, B1), three future 30-year time periods (centred on the 2020s, 2050s and 2080s) and for three climate probability levels (10%, 50% and 90%).
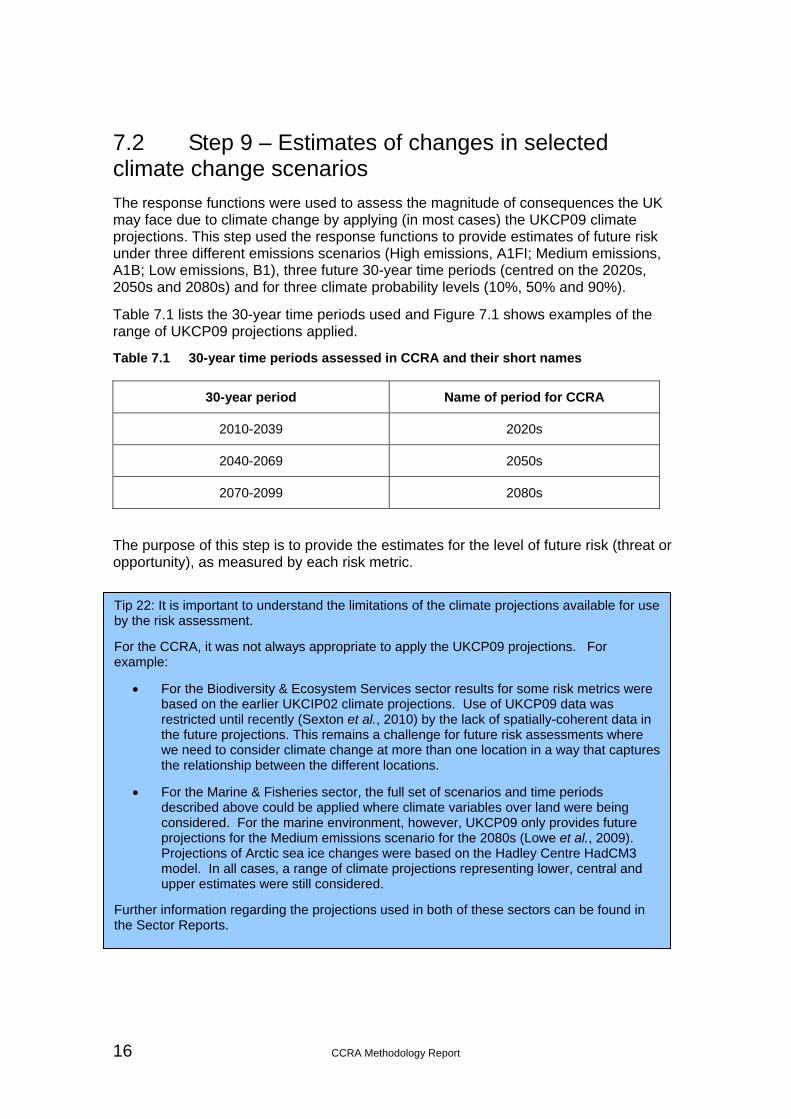
Table 7.1 lists the 30-year time periods used and Figure 7.1 shows examples of the range of UKCP09 projections applied.
Table 7.1 30-year time periods assessed in CCRA and their short names
30-year period Name of period for CCRA
2010-2039 2020s
2040-2069 2050s
2070-2099 2080s
The purpose of this step is to provide the estimates for the level of future risk (threat or opportunity), as measured by each risk metric.
Tip 22: It is important to understand the limitations of the climate projections available for use by the risk assessment.
For the CCRA, it was not always appropriate to apply the UKCP09 projections. For example:
For the Biodiversity & Ecosystem Services sector results for some risk metrics were based on the earlier UKCIP02 climate projections. Use of UKCP09 data was restricted until recently (Sexton et al., 2010) by the lack of spatially-coherent data in the future projections. This remains a challenge for future risk assessments where we need to consider climate change at more than one location in a way that captures the relationship between the different locations.
For the Marine & Fisheries sector, the full set of scenarios and time periods described above could be applied where climate variables over land were being considered. For the marine environment, however, UKCP09 only provides future projections for the Medium emissions scenario for the 2080s (Lowe et al., 2009). Projections of Arctic sea ice changes were based on the Hadley Centre HadCM3 model. In all cases, a range of climate projections representing lower, central and upper estimates were still considered.
Further information regarding the projections used in both of these sectors can be found in the Sector Reports.
CCRA Methodology Report 17
Figure 7.1 Examples of the range of UKCP09 climate change projections applied Source: UKCP09
7.2.1 Using UKCP09
Reference should be made to Annex A of the Evidence Report (Met Office, 2012). This annex discusses the different sources of uncertainty in climate projections, explains the key aspects of the UKCP09 methodology and how the projections are used as scenarios for the CCRA, and also discusses other climate science issues that should be borne in mind when making decisions based on the analysis results.
The following provides a very brief overview of key issues related to using UKCP09.
18 CCRA Methodology Report
Emissions scenarios
In UKCP09, and hence the CCRA, no judgements are made on the relative probability of the three different emissions scenarios used. When the project started in 2009, it was unclear whether actual emissions were following any particular scenario.
Probability levels
The estimated climate probability levels provided by UKCP09 are cumulative and denote the degree of confidence in the projected change in climate. The results are expressed in terms of the probability of changes in key climate variables being smaller than the result in question, so the 10th percentile of temperature change indicates that there was estimated to be a 10% probability that the warming would be smaller than that value (and consequently a 90% probability of warming being greater than that value). For changes that could be of either sign, such as precipitation, the 10th percentile occurred towards the drier end of the range of possible changes irrespective of whether the overall change was an increase or decrease in precipitation. Conversely, the 90th percentile occurred towards the wetter end of the range. Further details can be found in the UKCP09 technical documentation (Murphy et al., 2009).
These probabilities, however, should not be used to describe the projections generated from the response functions, as further translation into biophysical impacts and climate change consequences introduces additional uncertainties that render the probabilities meaningless. Instead, the CCRA provided a plausible range of outcomes from the ‘lower’ to an ‘upper’ estimate of future changes in climate. A ‘central’ estimate was also provided, but it is very important to recognise that this does not represent the ‘most likely’ outcome; no indication of a ‘most likely’ outcome was given.
Individual extreme years or seasons were not considered, as the UKCP09 climate projections are based on 30-year averages. It should be borne in mind, therefore, that climate events outside of the ‘plausible range’ can still be expected to occur from time to time.
Tip 23: It is important that a range in the climate projections is considered and that the assessment is not just based on a central estimate.
For example, the UKCP09 changes in annual average temperature are generally positive, but for some variables the range covers both negative and positive changes. Therefore, the results for a particular risk metric may also range from a decrease to an increase.
Baselines
All of the changes given in the UKCP09 projections are relative to a 1961-1990 baseline. The requirement of the CCRA, however, was to assess changes in climate risk relative to a ‘present-day’ baseline. Since climate change has already been occurring for the last few decades, this means that the 1961-1990 baseline may not be representative of the present-day, with the latter being defined in CCRA as the few years around 2010.
The CCRA baseline for the present-day was defined as a reasonable estimate of present-day conditions based on at least one decade of climate data. In many cases the data for the risk metrics of interest were only available for the last two decades. The length of record needed to provide a reasonable estimate depends on the variable being considered. For example, any estimate of extremes requires a long length of record, at least from the 1960s to present, whereas estimates of annual average temperature can be made (within reasonable errors) with a decade of data.
CCRA Methodology Report 19
As the CCRA study did not include trend detection or climate change attribution studies, no attempt was made at quantifying how climate change may have already influenced current risks. Details of the analysis completed, however, were provided and any differences between the present-day and the 1961-1990 climate that may affect estimation of current and future risks were recorded (see Sector Reports).
Tip 24: It is important that the baseline used by a response function is consistent with the baseline used for the climate projections and any difference or assumptions recorded.
Extremes
In order to develop a true risk assessment, it is important to consider changes affecting average climate and a range of more extreme events that take account of long-term climate change and natural variability. UKCP09 does not provide sufficient information on extreme floods, heat waves or droughts, although follow up research using UKCP09 is available regarding changes in peak river flows (Kay et al., 2010). Future assessments should look to use improved projections of potential changes in extremes, where possible.
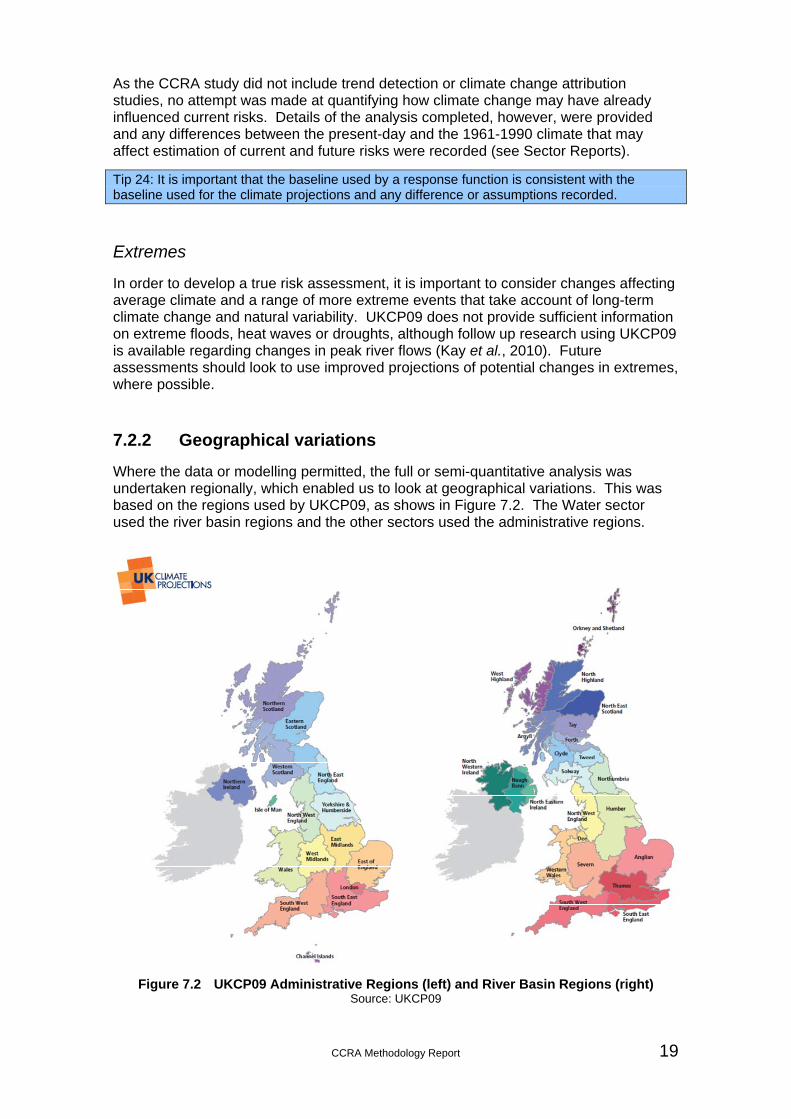
7.2.2 Geographical variations
Where the data or modelling permitted, the full or semi-quantitative analysis was undertaken regionally, which enabled us to look at geographical variations. This was based on the regions used by UKCP09, as shows in Figure 7.2. The Water sector used the river basin regions and the other sectors used the administrative regions.
Figure 7.2 UKCP09 Administrative Regions (left) and River Basin Regions (right) Source: UKCP09
20 CCRA Methodology Report
There was also some variation in the geographical extent of the analysis, as this depended on the availability of suitable data. This varied significantly between England, Wales, Scotland and Northern Ireland. For example, the analysis for the Water sector covered the whole of the UK at the regional scale, but the analysis for the Floods and Coastal Erosion sector only covered the regions of England and Wales, with qualitative assessments based on informed judgement alone for Scotland and Northern Ireland.
Tip 25: Where there is uneven data coverage across regions, care needs to be taken when disaggregating national results or making assumptions for regions without data based on results for other regions.
For example, the uneven data coverage across the UK meant that it was often necessary to undertake a qualitative assessment specific to the DA, using informed judgement. This was deemed to be more appropriate than to accept the findings of the UK analysis where this had been based on data available for other parts of the UK.
Tip 26: It is important to bear in mind that the potential consequences at the regional scale, such as social vulnerability, may prove to be a more significant factor in the overall risk for a region than differences in climatic conditions.
7.3 Step 10 – Socio-economic change
The way in which the social and economic future of the UK develops will influence future risks to climate change. It is recognised that many of the risk metrics in the CCRA are influenced by a wide range of drivers, not just by climate change.
Note that this step is different from Step 4, which considers how the risks may affect society; whereas this step considers how changes in society may affect the risks.
Growth in population is one of the major drivers in influencing risk metrics and may result in much larger changes than if the present day population is assumed.
The CCRA used a standard set of population projections across all sectors and these were particularly important for floods, water supply and demand, health, built environment and energy risk metrics where the number of people and properties has a significant influence on future risks. In order to capture the wide range of uncertainty in future population, three projection variants were used (Low Population, Principal and High Population) which were derived from the Office of National Statistics “2008-based National Population Projections”. These variants combine high and low assumptions in the main demographic components of change. Three time horizons (2025, 2055 and 2085) were selected to correspond with the central year of key 30 year UKCP09 time periods (2010-2039, 2040-2069 and 2070-2099). A baseline year of 2008 was used in the regional calculations.
For all of the sectors, a discussion is also provided regarding how different changes in our society and economy may influence future risks and opportunities. The dimensions of socio-economic change originated from a workshop with sector authors which gradually narrowed down the major contextual influences on climate risks levels. These included:
Population needs/demands (high/low);
Global stability (high/low);
Distribution of wealth (even/uneven);
Consumer driver values and wealth (sustainable/unsustainable);
CCRA Methodology Report 21
Level of Government decision making (local/national);
Land use change/management (high/low Government input).
The full details of these dimensions and the assessment of the influence they have on the sector is provided in the Sector Reports.
Tip 27: There may be benefits in developing socio-economic scenarios that could be used to produce more sophisticated projections of future change. However, for the CCRA we found that different drivers were important for different sectors, which makes the task of providing generic scenarios difficult.
Tip 28: If socio-economic scenarios are applied, there may be merit in swapping the order of Steps 9 and 10 and applying socio-economic change before climate change.
7.3.1 Autonomous or planned adaptation
In general, the CCRA did not take into account future responses to climate change risks (e.g. future or planned Government policies or private adaptation investment plans). Excluding these factors from the analysis provides a robust baseline against which the effects of different plans and policies can be more easily assessed. However, it was recognised that Government and key organisations are already taking action in many areas to minimise climate change risks and these interventions need to be considered when assessing where further action may be needed or best directed (which was not within the scope of the CCRA).
For the Floods and Coastal Erosion sector, in particular, this presented a challenge. The assessment of flood risk, therefore, assumed that there are no changes in existing flood and coastal erosion risk management measures; the analysis took account of current flood defences and protection against coastal erosion, but did not include any future changes as a result of adaptation policies or deterioration of existing flood defences and coastal protection measures.
Tip 29: Any change from this approach that may be adopted by future risk assessments would need to be considered at an early stage, as this may influence the response functions in Step 8.
7.4 Step 11 – Economic impacts
A monetisation exercise was carried out to provide an indicative cost per year of economic, environmental and social consequences that have an effect on human welfare.
Based on standard investment appraisal approaches (HM Treasury, 2003) and existing evidence, the Tier 2 risk metrics were expressed in monetary terms where possible. This provided a broad estimate of the costs associated with the risks. A more detailed analysis of the costs of climate change was carried out in the separate project looking at the ‘Economics of Climate Resilience’.
Tip 30: Although this step comes near the end of the assessment process, it is beneficial to start work on this step from the outset. Team members involved in this step should also be involved in identifying suitable risk metrics (see Step 7) as some risk metrics lend themselves more readily to monetisation than others (although, of course, you should avoid focusing on these alone). Early involvement is also important to allow sufficient time to collect the data required for the monetisation exercise.
22 CCRA Methodology Report
7.4.1 Aim of monetisation exercise
Climate change adaptation decisions that are designed to reduce climate change risks inevitably involve making trade-offs concerning the use of scarce economic resources. To the extent that economic efficiency is an important criterion in informing such decision-making, it is useful to express climate change risks in monetary terms, so that they can be:
Assessed and compared directly (using £ as a common metric); and
Compared against the costs of reducing such risks by adaptation.
For the CCRA, a monetisation exercise was undertaken to allow an initial comparison of the relative significance of different risks within and between sectors. Since money is a metric with which people are familiar, it also serves as an effective way of communicating the possible extent of climate change risks and help raise awareness.
It is important to note, however, that this exercise focuses on the effect on overall human welfare for the UK. The intrinsic value of elements of the natural environment is not captured, nor is the variation in social vulnerability considered. Therefore, the indicative ‘value rankings’ determined by this exercise do not always represent all factors that make a particular risk significant; additional non-quantified dimensions need to be considered. These other dimensions are discussed and taken into consideration in the overall categorisation of risks provided in the final reporting (see Step 12).
7.4.2 Approach
Where possible, an attempt was made to express the magnitude of individual risks in monetary terms (cost per year). The aim was to express the risk in terms of its effects on human welfare, as measured by the preferences of individuals in the affected population. The total value to society of any risk is taken to be the sum of the values of the different individuals affected. This distinguishes this system of values from one based on ‘expert’ preferences, or on the preferences of political leaders.
Individual preferences are expressed in two, theoretically equivalent, ways. These are:
The minimum payment an individual is willing to accept (WTA) for bearing the risk; or
The maximum amount an individual is willing to pay (WTP) to avoid the risk.
However, due to the availability of data, it was sometimes necessary to use alternative approaches (e.g. repair or adaptation costs) to provide indicative estimates.
A variety of methods were used to determine these costs. A detailed description of the data considered in the valuation of each risk is provided in the Sector Reports.
In broad terms, these methods can be categorised according to whether they are based on:
Market prices (MP);
Non-market values (NMV); or
Informed judgement (IJ).
Informed judgement was used where there was no quantitative evidence and was based on extrapolation and/or interpretation of existing data.
CCRA Methodology Report 23
In general terms, these three categories of method have differing degrees of uncertainty attached to them, with market prices being the most certain and informed judgement being the least certain. It is important to stress that the confidence and uncertainty of risks differ. Therefore, care must be taken in directly comparing the results. A further caveat is that whilst an attempt was made to use the best monetary valuation data available, the matching-up of physical and monetary data is to be understood as an approximation only.
In general, the approach adopted for the DAs was consistent with that used for the UK. In general, valuations were scaled from the UK analysis for each DA context, but account was also taken of differences between the situation in each DA compared to the UK as a whole. Where projections were quantified at the DA scale, these were applied directly to the analysis instead.
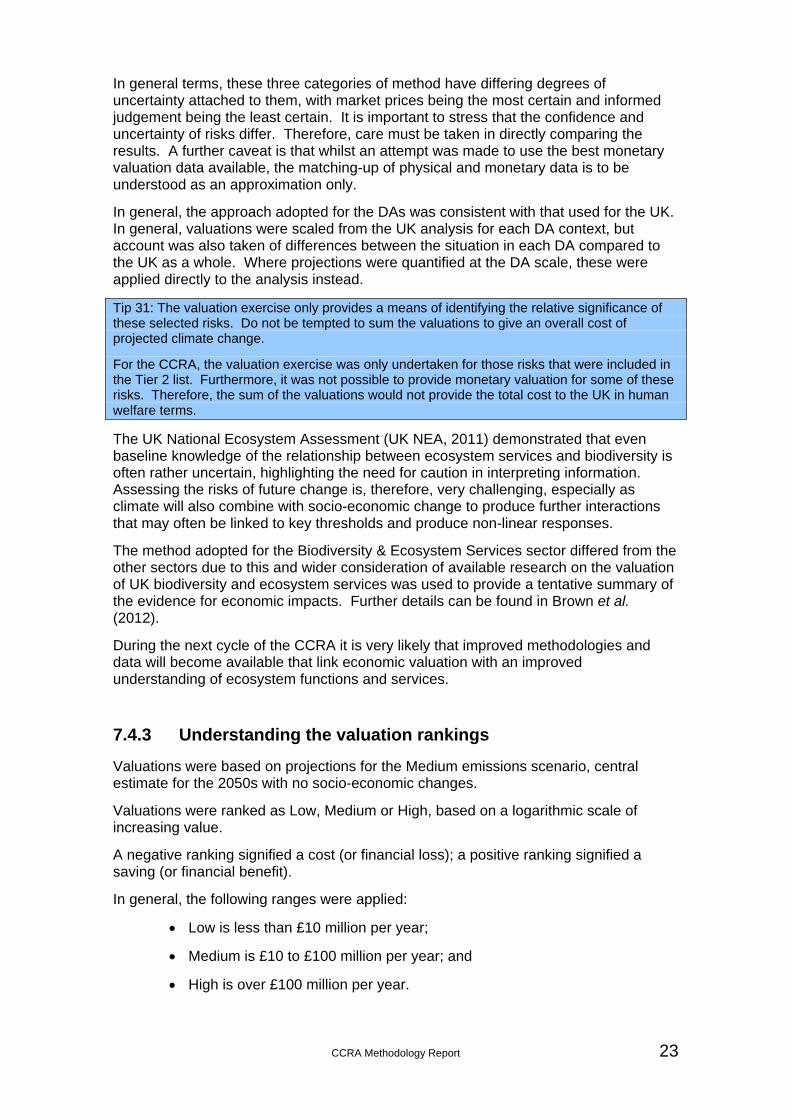
Tip 31: The valuation exercise only provides a means of identifying the relative significance of these selected risks. Do not be tempted to sum the valuations to give an overall cost of projected climate change.
For the CCRA, the valuation exercise was only undertaken for those risks that were included in the Tier 2 list. Furthermore, it was not possible to provide monetary valuation for some of these risks. Therefore, the sum of the valuations would not provide the total cost to the UK in human welfare terms.
The UK National Ecosystem Assessment (UK NEA, 2011) demonstrated that even baseline knowledge of the relationship between ecosystem services and biodiversity is often rather uncertain, highlighting the need for caution in interpreting information. Assessing the risks of future change is, therefore, very challenging, especially as climate will also combine with socio-economic change to produce further interactions that may often be linked to key thresholds and produce non-linear responses.
The method adopted for the Biodiversity & Ecosystem Services sector differed from the other sectors due to this and wider consideration of available research on the valuation of UK biodiversity and ecosystem services was used to provide a tentative summary of the evidence for economic impacts. Further details can be found in Brown et al. (2012).
During the next cycle of the CCRA it is very likely that improved methodologies and data will become available that link economic valuation with an improved understanding of ecosystem functions and services.
7.4.3 Understanding the valuation rankings
Valuations were based on projections for the Medium emissions scenario, central estimate for the 2050s with no socio-economic changes.
Valuations were ranked as Low, Medium or High, based on a logarithmic scale of increasing value.
A negative ranking signified a cost (or financial loss); a positive ranking signified a saving (or financial benefit).
In general, the following ranges were applied:
Low is less than £10 million per year;
Medium is £10 to £100 million per year; and
High is over £100 million per year.
24 CCRA Methodology Report
However, there are exceptions; for example, if a large proportion of a business that is vital for the sustainability of a region is affected then this would result in a High ranking even if the total cost was less than £100 million per year.
CCRA Methodology Report 25
8 Report on risks
8.1 Step 12 – Report outputs
The main reports used to present the CCRA findings are listed in Section 3. Further discussion of their purpose can be found in the Recommendations Report (CCRA, 2012a) and reference should also be made to the reports themselves to understand fully what they provide. These are not going to be discussed further here. Instead, this section lays out the principles that were followed when presenting the CCRA findings and how results were summarised.
8.1.1 Guidance on presenting results
1. Present information on the current risks or consequences of climate alongside future risks. Where possible tabulate the current risks alongside future risks and provide changes from the base year in percentage terms or as a multiple of the base year. There is no single best way of presenting future changes, for example the ‘multiple approach’ will be misleading if current consequences are close to zero. It is important to be clear on whether the figures presented are absolute values or changes in risk, as the change may be large but the overall risk may be low.
2. Present the full spread of results so that it is made clear to the reader that there is uncertainty associated with the projections. Present central estimates where this is helpful, for example to show changes for different time periods or for different regions, but always include the full range of emissions scenarios and possible outcomes (lowest to highest). This might be done by providing the full range in brackets in the text or as ranges on figures.
3. Provide some form of categorisation of the results that indicates the ‘strength of evidence’ or ‘overall confidence’ for individual risks and provide clear definitions of these categories. If the ‘strength of evidence’ is ‘very weak’ or ‘weak’ (scores 0 and 1), confidence is clearly ‘very low’ or ‘low’; the strength of evidence scores feed into the confidence assessment which describes the validity of a finding, based on the type, amount, quality, consistency of evidence in qualitative terms from ‘very low’ to ‘very high’ confidence. Confidence should not be described probabilistically; instead use a simple scoring system (between 1 and 5 say) or an even simpler categorisation, such as low to high.
4. Make reference to ‘plural’ and ‘conditional’ views and do not be constrained to providing a ‘single’ or ‘best estimate’ based on the methodology. For some risks there will be limited consensus and the strength of evidence will be weak. Different assumptions may lead to very different consequences or change the direction of the response. For example, food production depends on whether CO2 fertilisation is included in modelling or the ‘net risks’ may be reduced substantially if different assumptions are made about autonomous adaptation.
5. Avoid numerical estimates of risk (probability x consequence); instead make use of categories and descriptive labels. At present
26 CCRA Methodology Report
probabilities can only be provided for a very small number of risks based on detailed modelling (e.g. flood risks) or derived climate variables (e.g. relative aridity, cooling degree days, etc.) or biophysical impacts (e.g. soil moisture deficits). Even so, future projections of risk remain dependent on which emissions scenario is considered and probabilities of these are not provided (see Section 7.2.1).
6. Only use UKCP09 probabilistic language and terminology (10%, 90%, etc) for risks that are based on UKCP09 derived climate variables, e.g. heating degree days or relative aridity. The UKCP09 probabilistic terminology should not be used for climate change consequences that involve a much greater ‘cascade of uncertainties’, including combined climate and socio-economic probabilities and assumptions; instead report upper and lower limits without probability terminology, being clear in the text about what the presented range includes.
7. Do not add up the regional results for UKCP09 10% and 90% or lowest and highest estimates to provide headline national figures, instead show maps or tables of regional results and only quote the central estimates as national figures with an upper and lower range (with a description of the limitations associated with doing this). Due to the lack of spatial coherence in UKCP09 projections, headline figures adding up the most extreme results may exaggerate the impacts at the national scale.
8. For extreme events (heat-waves, droughts and floods) be clear about the ‘strength of evidence’ and assumptions used in the analyses. Overall confidence will be low if the analysis is based on UKCP09 sampled data only as a fair amount of detailed work is needed to extract information of extremes from Regional Climate Models or through use of the Weather Generator.
9. Do not present precise results, i.e. no decimal places and typically to just two significant figures. For example, a change in grassland yields may be plus 20% (5% - 40%) for the 2080s, frequent flooding of agricultural land may increase two to five-fold by the 2050s and 10,000 (5,000 to 15,000) people may be affected by skin cancers for 2050s Low Emissions scenario.
10. Avoid definite language and saying that specific outcomes will happen. Instead describe outcomes that may occur under certain conditions, being explicit about what those conditions are, such as all emissions scenarios or a proportion of scenarios considered.
8.1.2 Presenting summary results
The main challenges of reporting the findings from the CCRA were:
Presenting uncertainties in the findings in an explicit and accessible way;
Ensuring that the overall confidence in the findings was also expressed effectively (recognising that this is different from uncertainty); and
Communicating the relative importance of different risks across multiple sectors when they have very different characteristics, varying levels of uncertainty and different levels of confidence attributed to them.
CCRA Methodology Report 27
There was a need for criteria that could be applied across all risks, such as magnitude, at the same time as retaining the more detailed narrative and, where possible, quantitative descriptions of individual risks.
In consultation with experts outside of the project team and stakeholders and reference to new guidance on the treatment of uncertainties by the IPCC (Mastrandrea et al., 2010), a number of different methods for presenting risks were tested. For the purposes of this first CCRA we chose to use two different ways of summarising results (onset plots and scorecards), which are described below.
Tip 32: There are different ways that results can be reported and there may be benefits in looking at developing alternative approaches, based on feedback from stakeholders. The earlier that this can be taken into consideration the better, as this may influence the risk assessment method.
Themes
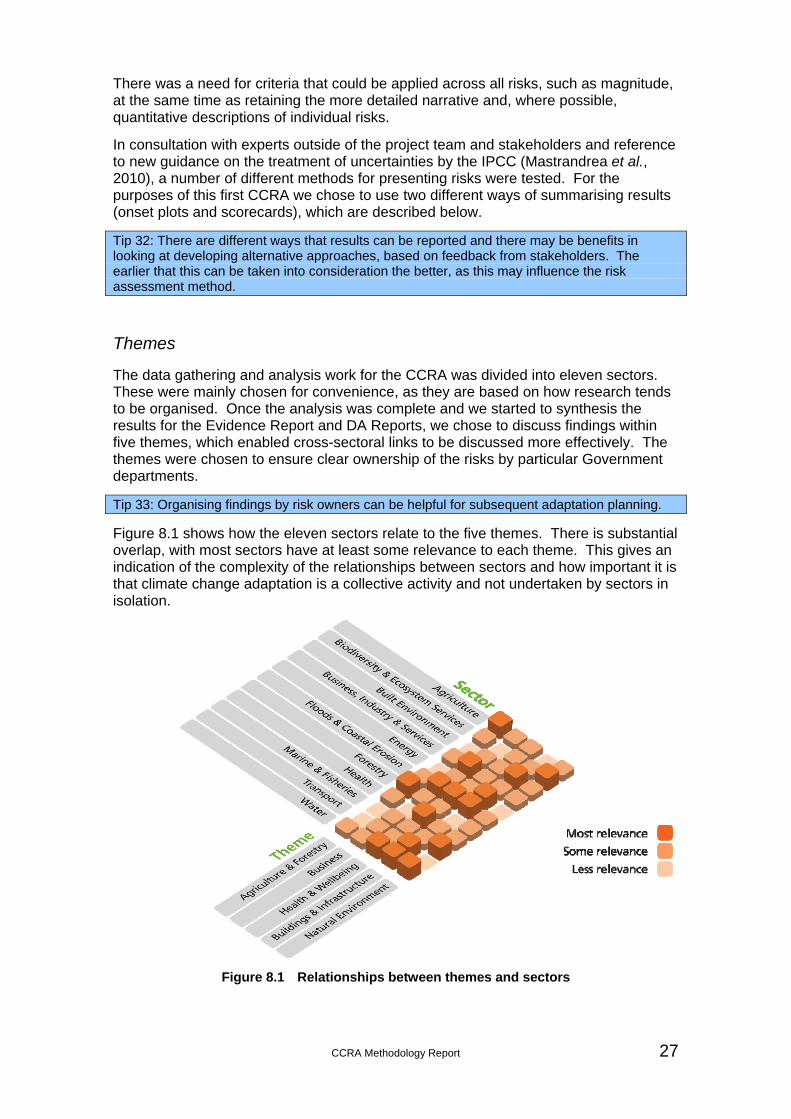
The data gathering and analysis work for the CCRA was divided into eleven sectors. These were mainly chosen for convenience, as they are based on how research tends to be organised. Once the analysis was complete and we started to synthesis the results for the Evidence Report and DA Reports, we chose to discuss findings within five themes, which enabled cross-sectoral links to be discussed more effectively. The themes were chosen to ensure clear ownership of the risks by particular Government departments.
Tip 33: Organising findings by risk owners can be helpful for subsequent adaptation planning.
Figure 8.1 shows how the eleven sectors relate to the five themes. There is substantial overlap, with most sectors have at least some relevance to each theme. This gives an indication of the complexity of the relationships between sectors and how important it is that climate change adaptation is a collective activity and not undertaken by sectors in isolation.
Figure 8.1 Relationships between themes and sectors
28 CCRA Methodology Report
Scoring
There is no single measure of risk that can be used across themes and for different sectors. Some risks, like damage due to flooding, can be expressed in monetary terms but others are more difficult to quantify. In addition, when looking at risks for UK as a whole, not just for the UK Government, some risks threaten particular groups at the same time as benefiting others. Therefore any categorisation is imperfect and comparative assessment needs to consider multiple dimensions of risk, including economic, social and environmental consequences for the UK.
The risk metrics considered in this first CCRA varied in character and whilst some were quantified others had to rely on expert elicitation, or a narrative based on the literature. To allow comparison of these different risks, they were categorised as having either ‘high’, ‘medium’ or ‘low’ magnitude consequences and either a ‘high’, ‘medium’ or ‘low’ confidence.
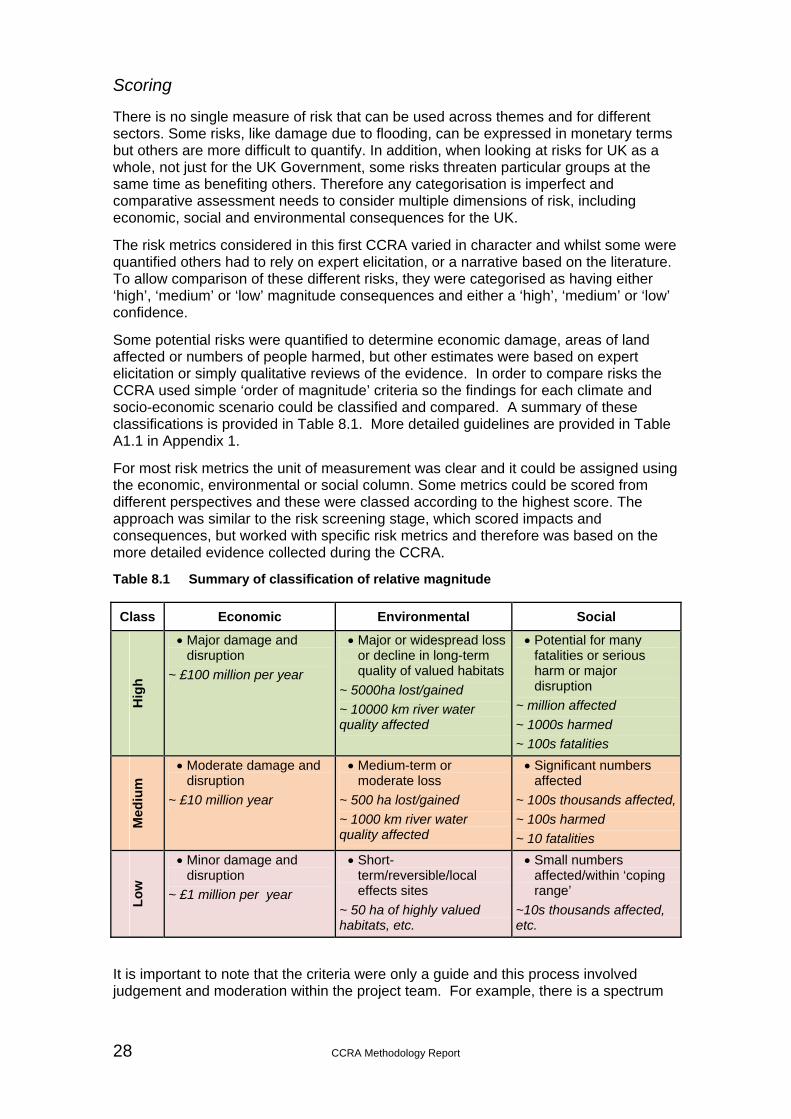
Some potential risks were quantified to determine economic damage, areas of land affected or numbers of people harmed, but other estimates were based on expert elicitation or simply qualitative reviews of the evidence. In order to compare risks the CCRA used simple ‘order of magnitude’ criteria so the findings for each climate and socio-economic scenario could be classified and compared. A summary of these classifications is provided in Table 8.1. More detailed guidelines are provided in Table A1.1 in Appendix 1.
For most risk metrics the unit of measurement was clear and it could be assigned using the economic, environmental or social column. Some metrics could be scored from different perspectives and these were classed according to the highest score. The approach was similar to the risk screening stage, which scored impacts and consequences, but worked with specific risk metrics and therefore was based on the more detailed evidence collected during the CCRA.
Table 8.1 Summary of classification of relative magnitude
Class Economic Environmental Social
Hig
h
Major damage and disruption
~ £100 million per year
Major or widespread loss or decline in long-term quality of valued habitats
~ 5000ha lost/gained
~ 10000 km river water quality affected
Potential for many fatalities or serious harm or major disruption
~ million affected
~ 1000s harmed
~ 100s fatalities
Med
ium
Moderate damage and disruption
~ £10 million year
Medium-term or moderate loss
~ 500 ha lost/gained
~ 1000 km river water quality affected
Significant numbers affected
~ 100s thousands affected,
~ 100s harmed
~ 10 fatalities
Lo
w
Minor damage and disruption
~ £1 million per year
Short-term/reversible/local effects sites
~ 50 ha of highly valued habitats, etc.
Small numbers affected/within ‘coping range’
~10s thousands affected, etc.
It is important to note that the criteria were only a guide and this process involved judgement and moderation within the project team. For example, there is a spectrum
CCRA Methodology Report 29
of possible consequence for people between being ‘affected’ and being ‘harmed’ by risks such as overheating of buildings, respiratory problems, UV exposure and so on.
Users of the CCRA should also make use of the available reports and data rather than using the classification to support decisions. Indeed, regional and sector decision-makers are guided to considering their own criteria and developing more targeted methods for their own risk assessment and adaptation planning.
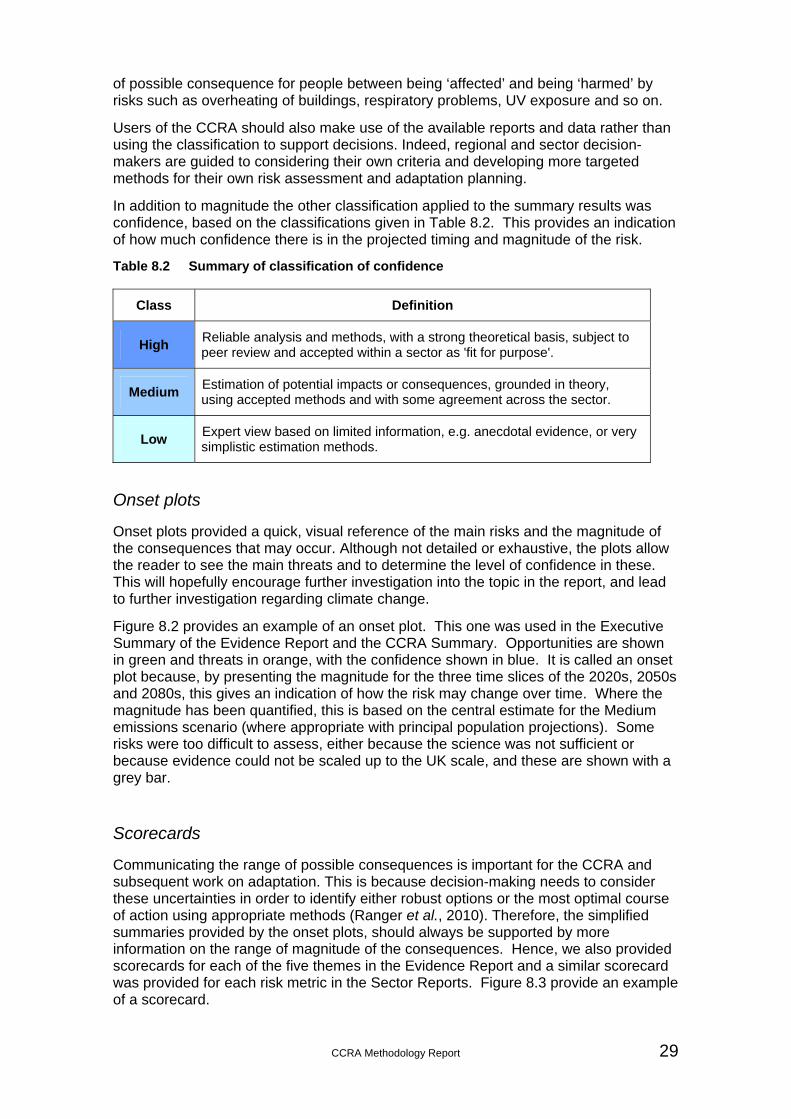
In addition to magnitude the other classification applied to the summary results was confidence, based on the classifications given in Table 8.2. This provides an indication of how much confidence there is in the projected timing and magnitude of the risk.
Table 8.2 Summary of classification of confidence
Class Definition
High Reliable analysis and methods, with a strong theoretical basis, subject to peer review and accepted within a sector as 'fit for purpose'.
Medium Estimation of potential impacts or consequences, grounded in theory, using accepted methods and with some agreement across the sector.
Low Expert view based on limited information, e.g. anecdotal evidence, or very simplistic estimation methods.
Onset plots
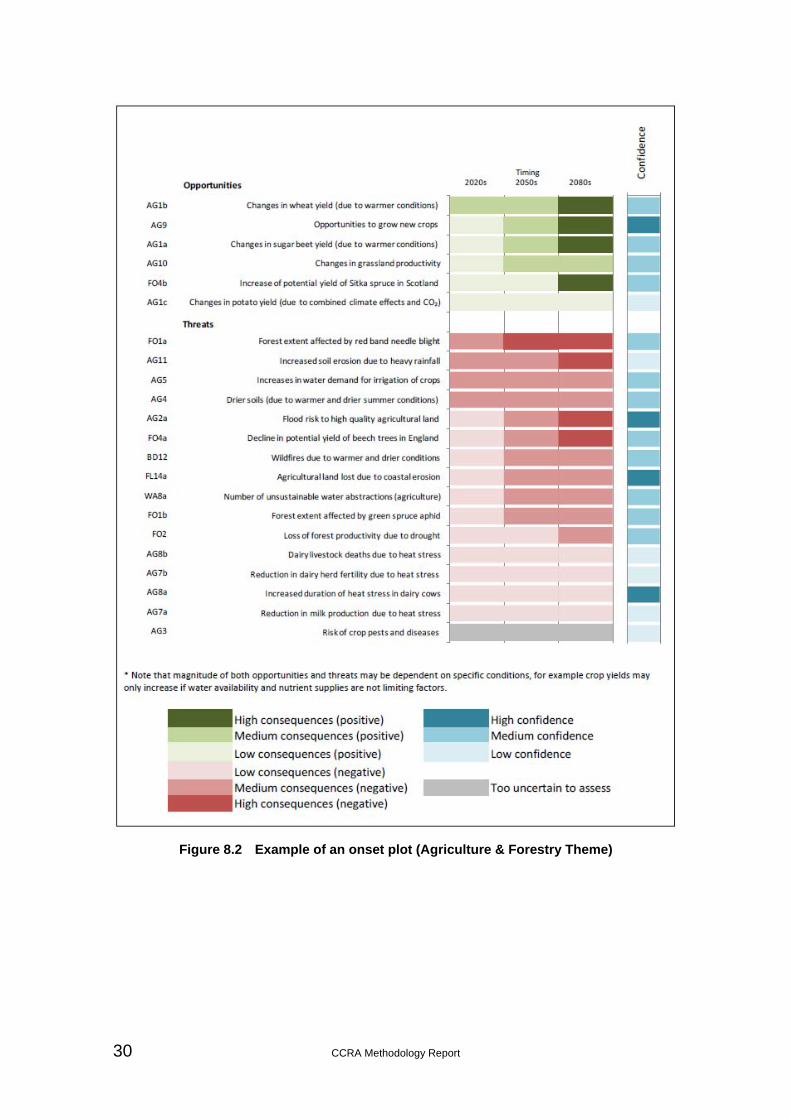
Onset plots provided a quick, visual reference of the main risks and the magnitude of the consequences that may occur. Although not detailed or exhaustive, the plots allow the reader to see the main threats and to determine the level of confidence in these. This will hopefully encourage further investigation into the topic in the report, and lead to further investigation regarding climate change.
Figure 8.2 provides an example of an onset plot. This one was used in the Executive Summary of the Evidence Report and the CCRA Summary. Opportunities are shown in green and threats in orange, with the confidence shown in blue. It is called an onset plot because, by presenting the magnitude for the three time slices of the 2020s, 2050s and 2080s, this gives an indication of how the risk may change over time. Where the magnitude has been quantified, this is based on the central estimate for the Medium emissions scenario (where appropriate with principal population projections). Some risks were too difficult to assess, either because the science was not sufficient or because evidence could not be scaled up to the UK scale, and these are shown with a grey bar.
Scorecards
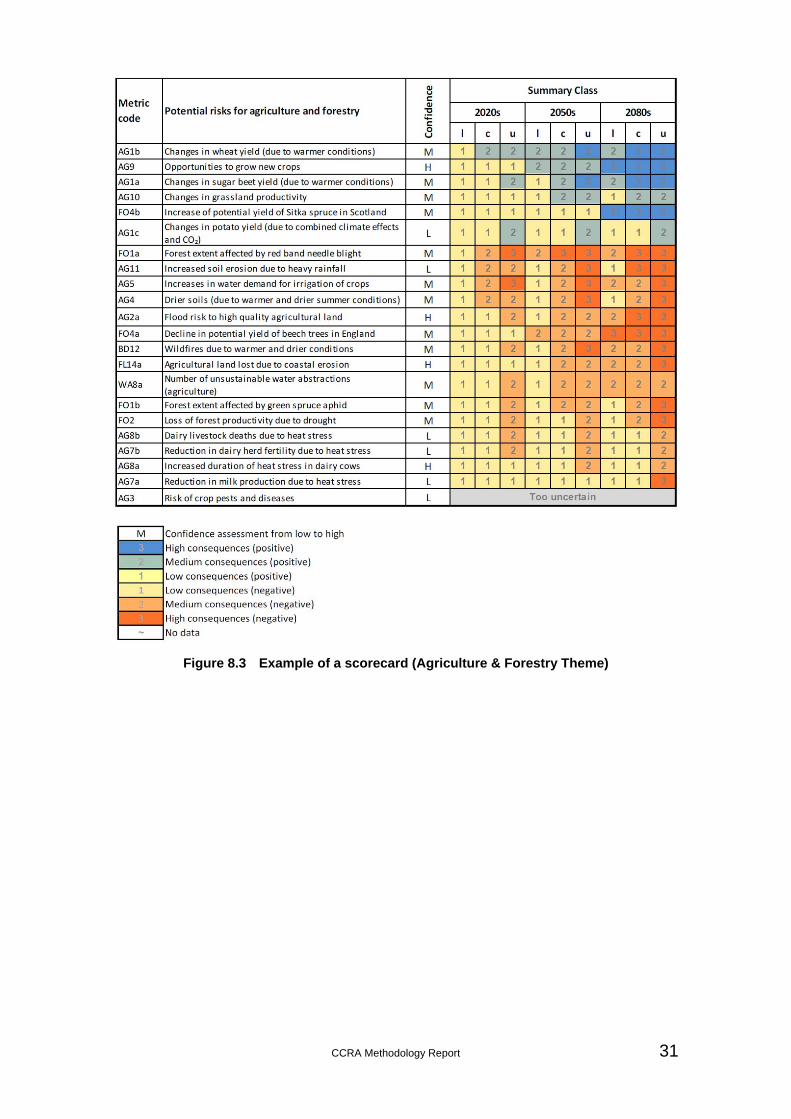
Communicating the range of possible consequences is important for the CCRA and subsequent work on adaptation. This is because decision-making needs to consider these uncertainties in order to identify either robust options or the most optimal course of action using appropriate methods (Ranger et al., 2010). Therefore, the simplified summaries provided by the onset plots, should always be supported by more information on the range of magnitude of the consequences. Hence, we also provided scorecards for each of the five themes in the Evidence Report and a similar scorecard was provided for each risk metric in the Sector Reports. Figure 8.3 provide an example of a scorecard.
30 CCRA Methodology Report
Figure 8.2 Example of an onset plot (Agriculture & Forestry Theme)
CCRA Methodology Report 31
Figure 8.3 Example of a scorecard (Agriculture & Forestry Theme)
32 CCRA Methodology Report
9 References Aspinall, W. (2010). A route to more tractable expert advice. Nature, Vol 463. 21 January 2010.
Baglee, A., Haworth, A. and Anastasi, S. (2012) CCRA Risk Assessment for the Business, Industry and Services Sector. UK 2012 Climate Change Risk Assessment, Defra, London.
Ballard, D (2009) Working paper on adaptive capacity. Working Paper 1 for the UK's Climate Change Risk Assessment 2012 and Adaptation Economic Analysis. Alexander Ballard Ltd for HR Wallingford Ltd.
Ballard, D.I., Black, D.G. and Lonsdale, K. (2011) Assessment of the UK’s Adaptive Capacity for responding to the impacts of climate change. UK 2012 Climate Change Risk Assessment, Defra, London.
Brown, I., Ridder, B., Alumbaugh, P., Barnett, C., Brooks, A., Duffy, L., Webbon, C., Nash, E., Townend, I., Black, H. and Hough, R. (2012) CCRA Risk Assessment for the Biodiversity and Ecosystem Services Sector. UK 2012 Climate Change Risk Assessment, Defra, London.
Capon, R. and Oakley, G. (2012) CCRA Risk Assessment for the Built Environment Sector. UK 2012 Climate Change Risk Assessment, Defra, London.
CCRA (2011) Systematic mapping report. UK 2012 Climate Change Risk Assessment, Defra, London, Report No: D.2.7.3 by HR Wallingford Ltd, The Met Office, Alexander Ballard Ltd, Collingwood Environmental Planning, Entec Ltd UK, Paul Watkiss Associates, Metroeconomica.
CCRA (2012a) Climate Change Risk Assessment Recommendations Report. UK 2012 Climate Change Risk Assessment, Defra, London, by HR Wallingford, AMEC, The Met Office, Collingwood Environmental Planning, Alexander Ballard ltd, Paul Watkiss Associates, Metroeconomica.
CCRA (2012b) The UK Climate Change Risk Assessment 2012: Evidence Report, Defra, London.
CCRA (2012c) A climate change risk assessment for Northern Ireland, Defra, London.
CCRA (2012d) A climate change risk assessment for Scotland, Defra, London.
CCRA (2012e) A climate change risk assessment for Wales, Defra, London.
Cooke, R. M. (1991) Experts in Uncertainty: Opinion and Subjective. Probability in Science, Oxford University Press.
Defra (2010a) Method for undertaking the CCRA, UK 2012 Climate Change Risk Assessment, Defra, London, Report No: D.1.3.3 by HR Wallingford Ltd, The Met Office, Alexander Ballard Ltd, Collingwood Environmental Planning, Entec Ltd UK, Paul Watkiss Associates, Metroeconomica.
Defra (2010b) Method for undertaking the CCRA Part II – Detailed Method Stage 3: Assess Risk, UK 2012 Climate Change Risk Assessment, Defra, London, Report No: D2.1.1 by HR Wallingford Ltd, The Met Office, Alexander Ballard Ltd, Collingwood
CCRA Methodology Report 33
Environmental Planning, Entec Ltd UK, Paul Watkiss Associates and Metroeconomica. http://randd.defra.gov.uk/Document.aspx?Document=GA0204_9587_TRP.pdf
Hames, D. and Vardoulakis, S. (2012) CCRA Risk Assessment for the Health Sector. UK 2012 Climate Change Risk Assessment, Defra, London.
H.M. Treasury (2003) Appraisal and evaluation in central government. http://www.hm-treasury.gov.uk/data_greenbook_index.htm
IPCC (2007) Climate Change 2007: The Physical Science Basis. Contribution of Working Group I to the Fourth Assessment Report of the Intergovernmental Panel on Climate Change [Solomon, S., Qin, D., Manning, M., Chen, Z., Marquis, M., Averyt, K.B., Tignor, M. and Miller, H. L. (eds.)]. Cambridge University Press, Cambridge, United Kingdom and New York, NY, USA.
Kay, A.L. Crooks, S., Davies, H.N., Prudhomme, C. and Reynard, N.S. (2010) Practicalities for implementing regionalised allowances for climate change on flood flows, Defra/EA Flood and Coastal Erosion Risk Management R&D Programme. Final Technical Report – Project FD2648.
Knox, J.W., Hurford, A., Hargreaves, L. and Wall, E. (2012) CCRA Risk Assessment for the Agriculture Sector. UK 2012 Climate Change Risk Assessment, Defra, London.
Lindner, M., Maroschek, M., Netherer, S., Kremer, A., Barbati, A., Garcia-Gonzalo, J., Seidl, R., Delzon, S., Corona, P., Kolstrom, M., Lexer, M. J. and Marchetti, M. (2010) Climate change impacts, adaptive capacity and vulnerability of European forest ecosystems. Forest Ecology and Management, 259, 698 – 709.
Lowe, J. A., Howard, T. P., Pardaens, A., Tinker, J., Holt, J., Wakelin, S., Milne, G., Leake, J., Wolf, J., Horsburgh, K., Reeder, T., Jenkins, G., Ridley, J., Dye, S., Bradley, S. (2009) UK Climate Projections science report: Marine and coastal projections. Met Office Hadley Centre, Exeter.
Mastrandrea, M.D., C.B. Field, T.F. Stocker, O. Edenhofer, K.L. Ebi, D.J. Frame, H. Held, E. Kriegler, K.J. Mach, P.R. Matschoss, G.-K. Plattner, G.W. Yohe, and F.W. Zwiers, 2010: Guidance Note for Lead Authors of the IPCC Fifth Assessment Report on Consistent Treatment of Uncertainties. Intergovernmental Panel on Climate Change.
McColl, L., Betts, R. and Angelini, T. (2012) CCRA Risk Assessment for the Energy Sector. UK 2012 Climate Change Risk Assessment, Defra, London.
Met Office (2012) The UK Climate Change Risk Assessment 2012 Evidence Report, Annex A: Scenarios of climate variability and change, Defra, London.
Moffat, A.J., Morison, J.I.L., Nicoll, B., and Bain, V. (2012) CCRA Risk Assessment for the Forestry Sector. UK 2012 Climate Change Risk Assessment, Defra, London.
Murphy, J.M. Sexton, D., Jenkins, G., Boorman, P., Booth, B., Brown, K., Clark, R., Collins, M., Harris, G. and, Kendon, E. (2009) UKCP09 Climate change projections. ISBN 978-1-906360-02-3.
Pinnegar, J., Watt, T., and Kennedy, K. (2012) CCRA Risk Assessment for the Marine and Fisheries Sector. UK 2012 Climate Change Risk Assessment, Defra, London.
Ramsbottom, D., Sayers, P. and Panzeri, M. (2012) CCRA Risk Assessment for the Floods and Coastal Erosion Sector. UK 2012 Climate Change Risk Assessment, Defra, London.
34 CCRA Methodology Report
Rance, J., Wade, S.D., Hurford, A.P., Bottius, E. and Reynard, N.S. (2012) CCRA Risk Assessment for the Water Sector. UK 2012 Climate Change Risk Assessment, Defra, London.
Ranger, N., Millner, A., Dietz, S., Fankhauser, S., Lopez, A., Ruta, G. (2010). Adaptation in the UK: a decision making process. London School of Economics and Political Science, Centre for Climate Change Economics and Policy and the Grantham Research Institute on Climate Change and the Environment. Research commissioned by the Adaptation Sub-Committee.
Sexton, D., Harris, G. and Murphy, J. (2010) UKCP09: Spatially coherent projections. UKCP09 additional product. Met Office Hadley Centre, Exeter, November 2010. http://ukclimateprojections.defra.gov.uk/media.jsp?mediaid=87838&filetype=pdf
Thornes, J., Rennie, M., Marsden, H. and Chapman, L. (2012) CCRA Risk Assessment for the Transport Sector. UK 2012 Climate Change Risk Assessment, Defra, London.
Twigger-Ross, C. and Orr, P. (2012) The UK Climate Change Risk Assessment 2012 Evidence Report, Annex B: Social vulnerability to climate change impacts, Defra, London.
UKCIP (2003) Climate adaptation: Risk, uncertainty and decision making. Willows, R. and Connell, R., UK Climate Impacts Programme, Oxford, UK.
UK NEA (2011) UK National Ecosystem Assessment: Synthesis of the Key Findings. UNEP-WCMC, Cambridge.

CCRA Methodology Report 35
Appendices

36 CCRA Methodology Report
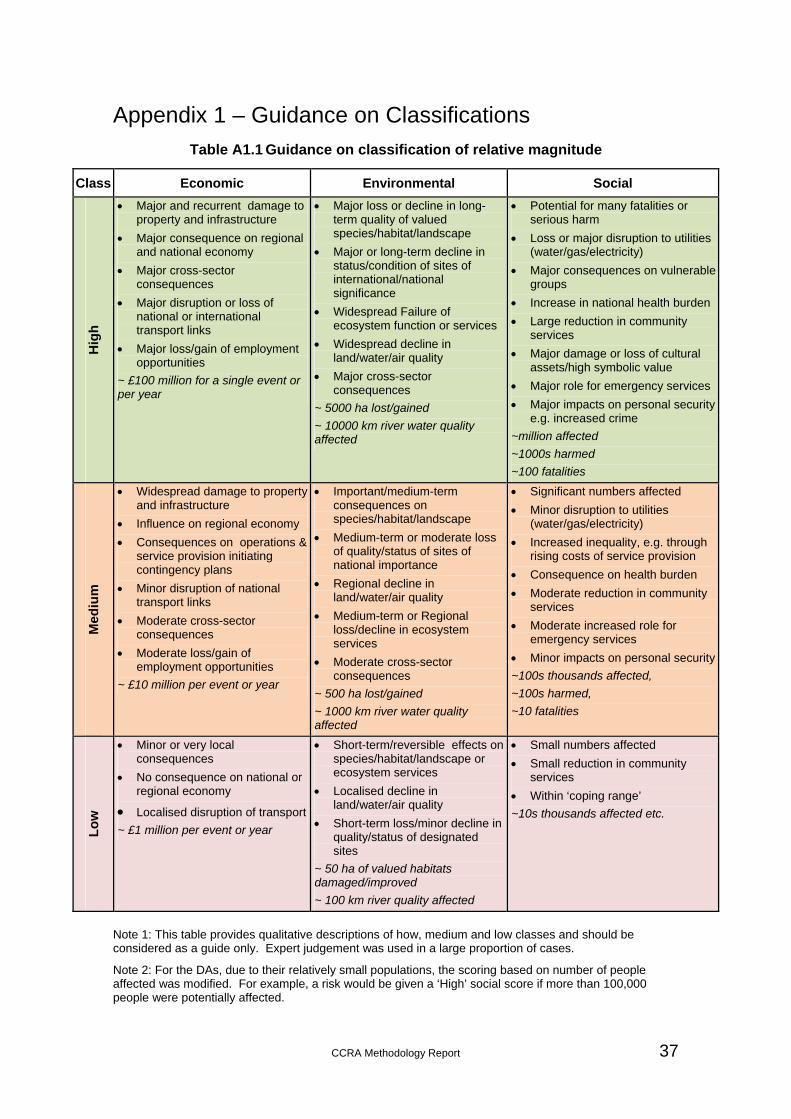
CCRA Methodology Report 37
Appendix 1 – Guidance on Classifications
Table A1.1 Guidance on classification of relative magnitude
Class Economic Environmental Social
Hig
h
Major and recurrent damage to property and infrastructure
Major consequence on regional and national economy
Major cross-sector consequences
Major disruption or loss of national or international transport links
Major loss/gain of employment opportunities
~ £100 million for a single event or per year
Major loss or decline in long-term quality of valued species/habitat/landscape
Major or long-term decline in status/condition of sites of international/national significance
Widespread Failure of ecosystem function or services
Widespread decline in land/water/air quality
Major cross-sector consequences
~ 5000 ha lost/gained
~ 10000 km river water quality affected
Potential for many fatalities or serious harm
Loss or major disruption to utilities (water/gas/electricity)
Major consequences on vulnerable groups
Increase in national health burden
Large reduction in community services
Major damage or loss of cultural assets/high symbolic value
Major role for emergency services
Major impacts on personal security e.g. increased crime
~million affected
~1000s harmed
~100 fatalities
Med
ium
Widespread damage to property and infrastructure
Influence on regional economy
Consequences on operations & service provision initiating contingency plans
Minor disruption of national transport links
Moderate cross-sector consequences
Moderate loss/gain of employment opportunities
~ £10 million per event or year
Important/medium-term consequences on species/habitat/landscape
Medium-term or moderate loss of quality/status of sites of national importance
Regional decline in land/water/air quality
Medium-term or Regional loss/decline in ecosystem services
Moderate cross-sector consequences
~ 500 ha lost/gained
~ 1000 km river water quality affected
Significant numbers affected
Minor disruption to utilities (water/gas/electricity)
Increased inequality, e.g. through rising costs of service provision
Consequence on health burden
Moderate reduction in community services
Moderate increased role for emergency services
Minor impacts on personal security
~100s thousands affected,
~100s harmed,
~10 fatalities
Lo
w
Minor or very local consequences
No consequence on national or regional economy
Localised disruption of transport ~ £1 million per event or year
Short-term/reversible effects on species/habitat/landscape or ecosystem services
Localised decline in land/water/air quality
Short-term loss/minor decline in quality/status of designated sites
~ 50 ha of valued habitats damaged/improved
~ 100 km river quality affected
Small numbers affected
Small reduction in community services
Within ‘coping range’
~10s thousands affected etc.
Note 1: This table provides qualitative descriptions of how, medium and low classes and should be considered as a guide only. Expert judgement was used in a large proportion of cases.
Note 2: For the DAs, due to their relatively small populations, the scoring based on number of people affected was modified. For example, a risk would be given a ‘High’ social score if more than 100,000 people were potentially affected.
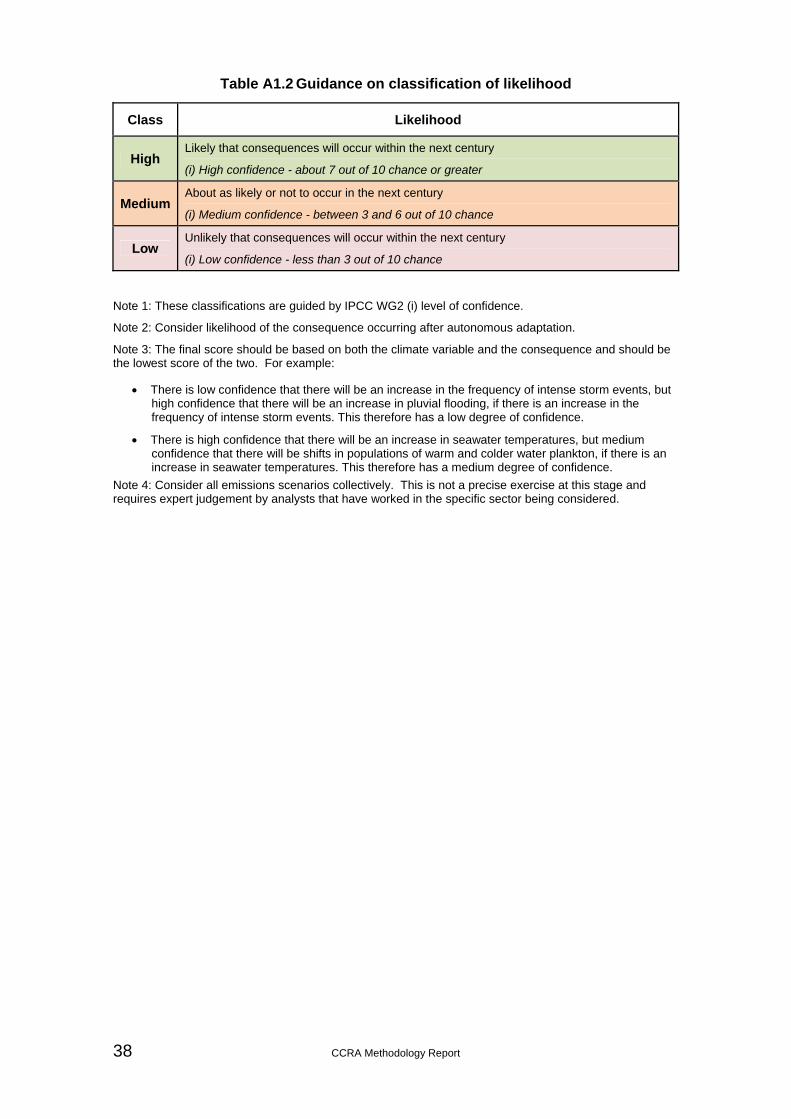
38 CCRA Methodology Report
Table A1.2 Guidance on classification of likelihood
Class Likelihood
High Likely that consequences will occur within the next century
(i) High confidence - about 7 out of 10 chance or greater
Medium About as likely or not to occur in the next century
(i) Medium confidence - between 3 and 6 out of 10 chance
Low Unlikely that consequences will occur within the next century
(i) Low confidence - less than 3 out of 10 chance
Note 1: These classifications are guided by IPCC WG2 (i) level of confidence.
Note 2: Consider likelihood of the consequence occurring after autonomous adaptation.
Note 3: The final score should be based on both the climate variable and the consequence and should be the lowest score of the two. For example:
There is low confidence that there will be an increase in the frequency of intense storm events, but high confidence that there will be an increase in pluvial flooding, if there is an increase in the frequency of intense storm events. This therefore has a low degree of confidence.
There is high confidence that there will be an increase in seawater temperatures, but medium confidence that there will be shifts in populations of warm and colder water plankton, if there is an increase in seawater temperatures. This therefore has a medium degree of confidence.
Note 4: Consider all emissions scenarios collectively. This is not a precise exercise at this stage and requires expert judgement by analysts that have worked in the specific sector being considered.
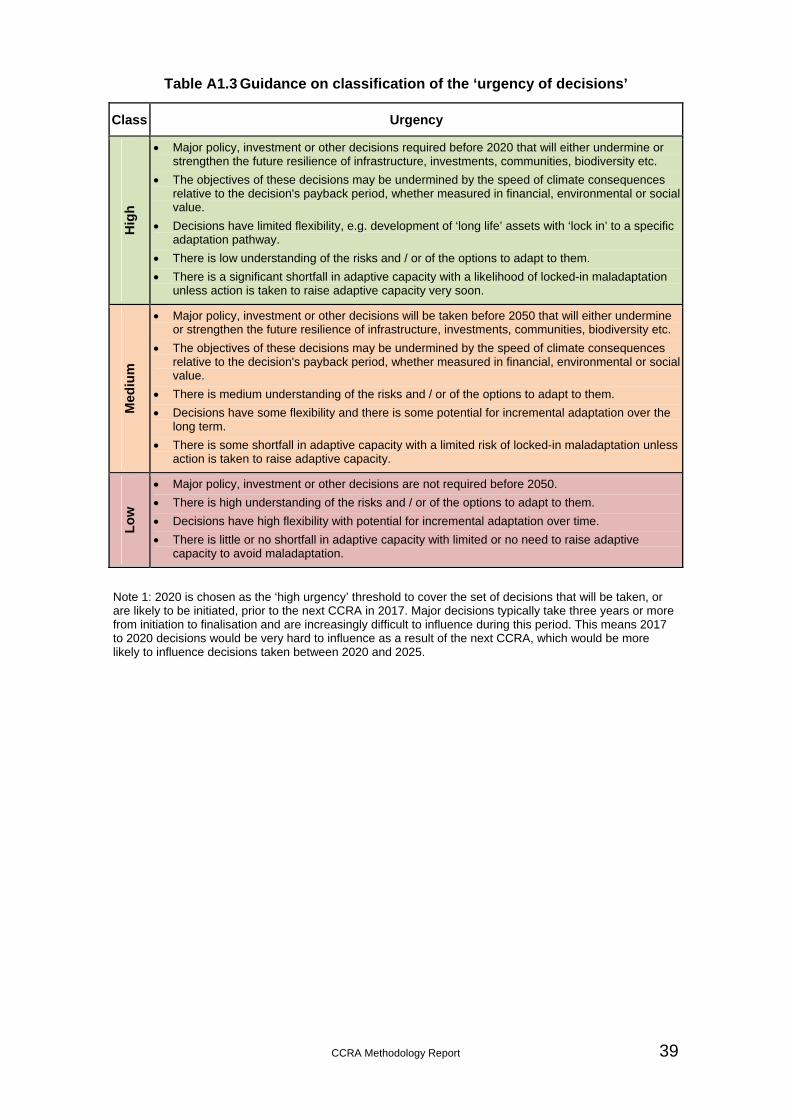
CCRA Methodology Report 39
Table A1.3 Guidance on classification of the ‘urgency of decisions’
Class Urgency H
igh
Major policy, investment or other decisions required before 2020 that will either undermine or
strengthen the future resilience of infrastructure, investments, communities, biodiversity etc.
The objectives of these decisions may be undermined by the speed of climate consequences relative to the decision's payback period, whether measured in financial, environmental or social value.
Decisions have limited flexibility, e.g. development of ‘long life’ assets with ‘lock in’ to a specific adaptation pathway.
There is low understanding of the risks and / or of the options to adapt to them.
There is a significant shortfall in adaptive capacity with a likelihood of locked-in maladaptation unless action is taken to raise adaptive capacity very soon.
Med
ium
Major policy, investment or other decisions will be taken before 2050 that will either undermine or strengthen the future resilience of infrastructure, investments, communities, biodiversity etc.
The objectives of these decisions may be undermined by the speed of climate consequences relative to the decision's payback period, whether measured in financial, environmental or social value.
There is medium understanding of the risks and / or of the options to adapt to them.
Decisions have some flexibility and there is some potential for incremental adaptation over the long term.
There is some shortfall in adaptive capacity with a limited risk of locked-in maladaptation unless action is taken to raise adaptive capacity.
Lo
w
Major policy, investment or other decisions are not required before 2050.
There is high understanding of the risks and / or of the options to adapt to them.
Decisions have high flexibility with potential for incremental adaptation over time.
There is little or no shortfall in adaptive capacity with limited or no need to raise adaptive capacity to avoid maladaptation.
Note 1: 2020 is chosen as the ‘high urgency’ threshold to cover the set of decisions that will be taken, or are likely to be initiated, prior to the next CCRA in 2017. Major decisions typically take three years or more from initiation to finalisation and are increasingly difficult to influence during this period. This means 2017 to 2020 decisions would be very hard to influence as a result of the next CCRA, which would be more likely to influence decisions taken between 2020 and 2025.