Embed Size (px)
Citation preview

1
Climate Change, Perceptions and the Heterogeneity of Adaptation and
Rice Productivity: Evidence from Indonesian Villages1
Author(s):
Futoshi Yamauchi (1), Hiroyuki Takeshima
(2), Sony Sumaryanto
(3), Reno Dewina
(4)
and Akiko Haruna (5)
Affiliation and Contact information: (1) World Bank, Washington, DC. [email protected].
(2) International Food Policy Research Institute, Washington, DC. [email protected]
(3 )Indonesian Center for Agriculture Socio Economic and Policy Studies, Bogor, Indonesia.
[email protected] (4)World Bank, Washington, DC. [email protected] (5)
International Food Policy Research Institute, Washington, DC. [email protected]
Revised version: June 2012
Selected Poster prepared for presentation at the International Association of Agricultural
Economists (IAAE) Triennial Conference, Foz do Iguaçu, Brazil, 18-24 August, 2012.
Copyright 2012 by Futoshi Yamauchi. All rights reserved. Readers may make verbatim copies
of this document for non-commercial purposes by any means, provided that this
copyright notice appears on all such copies.
1 We would like t thank Homi Kharas, Megumi Muto, Shinobu Shimokoshi and workshop participants in the Indonesian Ministry of Agriculture for helpful comments. We are grateful to the Japan International Cooperation Agency (JICA) for their collaboration and financial support. Special thanks are offered to Ali Subandoro who led IMDG-1 2007 survey. We would also like to thank all field supervisors and enumerators who collected data. Remaining errors are our own.
2
Abstract
This paper examines how change in rainfall patterns induces autonomous adaptation of
farmers and affects their rice production. Based on recently collected household data
from seven provinces in Indonesia, the analysis clearly demonstrate delays in the onset
of rainy season and increased uncertainty in rainfall patterns in the region. Farmers
make sequential decisions: adjusting planting timing in response to delays in the onset
of rainy season while changing crop variety responding to delays in the end of the
previous year’s rainy season. In the case of rice production, (i) delay in the onset
significantly decreases land productivity growth in rice production; one month delay
offsets the average growth observed in 1999-2007, and (ii) though irrigation share
significantly explains the growth of land productivity, delayed onset increasingly
constrains the role of irrigation.
Key words: climate change, rainy season, adaptation, rice production, irrigation,
Indonesia
3
1. Introduction
Climate change is currently highlighted in the international community as a
potential threat to food security. Increasing sets of evidence support the linkages
between global warming, natural disaster and changes in climate patterns
including unpredictability of monsoon rainy season (e.g., Adrian and Susanto,
2003; Hamada et al., 2002; Haylock et al., 2001; Morton, et al., 2007; Naylor, et al.,
2007; Robertson, et al., 2007). Rice farming system is sensitive to draught and
change in rainfall patterns, thus some adaptation practices are necessary with
climate change (Tabi et al. 2012).
Rice is the most important strategic crop in Indonesian agriculture, which
comprise about a half of the country’s per capita calorie consumption (C. Peter
Timmer 2010). However, the growth in rice productivity in the recent decade has
been stabilized at low rate around 1% (Simatupang and Peter Timmer 2008). Rice
production in Indonesia largely falls short of the demand at times, especially
when a delay in the rainfall onset caused by El Nino-Southern Oscillation (ENSO)
brings delay in planting date and following decrease in planting area. Such delay
in the onset of rainy season may happen more frequently in future with the effect
of climate change (Naylor et al. 2007). Climate change is also told to add drought
risk in Indonesian agriculture (Roehlano M. Briones 2011). Although regional
scale climate projection entails large uncertainty (Naylor, et al., 2002, 2007).=
climate change adaptation of the rice farming systems will be critical for
mitigating dire impact of climate change. The relevant research in Indonesia is,

4
however, still limited.
Climate change adaptation is possible through farmers’ perception on changes
and their autonomous response to the changes, aside from planned
implementation of adaptation policy. Such autonomous adaptation usually
happens on ad-hoc basis, triggered by climate variability and extreme events.
Economic wealth, technology, information and skills, infrastructure, institutions,
and equity all affect adaptive capacity of a community (Smit and Pilfosova 2001).
Maddison (2007) found that in African continent, experienced farmers are likely
to sensitively perceive the climate change, and the perception is influenced by
neighbors. Quality of weather information also affect their success in perceiving
the change (James W Hansen et al. 2007; Vermeulen et al. 2010), as a gap
increases between ongoing changes and empirical knowledge on climate.
In effect, Indonesian farmers report that the start of the rainy season has become
ambiguous, and thus it is becoming harder for them to identify the onset of rainy
season (see Section 2). Even after the rainy season has started, or appears to have
started, farmers often experience discontinuities of rainfall. Furthermore, farmers
find that the rainfall pattern they observed has become more erratic, causing
excessive rainfall and more frequent floods.
Farmers’ abilities to adapt to the change they detect depend on their capacity and
resources. For example, more educated farmers, or large scale farms tend to be
able to adapt (Maddison 2007). Rice farmers in Africa who perceive change in
5
climate adopt through various measures such as change of the planting date, use
of fertilizer, change of crop varieties, or use of herbicide ( Tabi et al. 2012), but
only small number of farmers change water management control practice with
limited capacity of irrigation facilities.
Indeed, one of the most critical resources to cope with the delay in the rainfall is
the availability, access and the capacity of irrigation systems and technologies. In
Indonesia, however, irrigation system relies predominantly on surface water
sources, such as river and swamp, while the use of groundwater is still limited
(FAO, 2010). In addition, there is a serious rate of degradation of irrigation
systems in Indonesia with decreasing government funding since end of 1999
(Fuglie and Piggott 2006). These facts imply that rainfall may affect the capacity
of irrigation systems to stabilize water, while the functionality of the systems is
deteriorating. The availability of surface water sources tend to be variable relative
to groundwater (Schoengold and Zilberman, 2007) and may be more directly
affected by the rainfall.
Furthermore, due to an increasing competition for water with the urban sector of
the country (Kristianto and Sitompul, 2007), irrigation may increasingly rely on
more marginal water sources which are more susceptible to rainfall variability.
Change in certain rainfall patterns, particularly delayed onset of rainy season,
may therefore reduce the water availability even in the areas equipped for
irrigation at the planting time. In addition, rapid deforestation in various parts of
Indonesia in recent years (Hunt, 2010; Klasen et al 2010) might have reduced the
6
stable water supply. With such limiting factors of water allocation and supply to
agriculture, irrigation may not be able to overcome the water shortage at the
planting time when onset of rainy season is delayed. and therefore, the benefit of
irrigation may be reduced, compared to the environment with timely onset of
rainy season.
We collected the information directly from farmers in Indonesia in 1999 and
2007, to understand (i) how farmers perceive the change in rainfall patterns?
(ii) how the perception affects their adaptation strategy? and, (iii) how the
perceived change in climate affects rice productivity and roles of irrigation
The next section describes our data. Section 3 summarizes changes in rainfall
patterns that farmers reported and their adaptation behaviors. In general, the
rainfall pattern has shifted during the last twenty years. We, however, observe
some interesting heterogeneity across provinces. In Lampung, Central and East
Java, and West Nusa Tenggara (NTB, hereafter), the perceived patterns of
rainfalls are different from those of South Kalimantan, North and South Sulawesi.
Farmers in the former group of provinces perceived that the duration of rainy
season became shorter and the total number of rainy days declines, while in the
latter province group, the opposite trends emerged in the perceptions. However,
in all the provinces that we surveyed, farmers perceived that the onset of rainy
season tends to be delayed.
Sections 4 and 5 analyze (i) adaptation behaviors and (ii) the effect of perceived
7
change in rainfall onset on land productivity (yield) in rice farming, respectively.
We focus on the perceived onset of rainy season because it dominantly influences
planting date, which affects the yields (e.g., Rosenzweig and Binswanger, 1993;
Naylor et al., 2007). The result of our research reveals unique interactions
between the delayed onset of rainfall, effect of irrigation and rice productivity in
Indonesia. The results have two important implications. First, the analysis shows
that farmers change planting date in response to the delays in the onset of rainy
season. Farmers also change crop variety in response to the delays in the end of
the previous year’s rainy season. Therefore, farmers make decisions sequentially.
Second, we found that irrigation significantly increases rice land productivity, but
the positive effect of irrigation can be offset by the delayed onset of the rainy
season. Policy implications are discussed in the conclusion.
2. Data
In this study, we use two rounds of household survey conducted in Indonesia:
PATANAS 1999 by ICASEPS and Indonesian Millennium Development Goals
(IMDG) project in 2007.2 The PATANAS surveys covered agricultural production
activities in 48 villages chosen from different agro-climatic zones in seven
provinces (Lampung, Central Java, East Java, NTB, South Sulawesi, North
Sulawesi, and South Kalimantan). In 2007, we revisited the PATANAS sample
2 See also Yamauchi (2012) and Yamauchi et al. (2011) for more details of the survey and data characteristics.

8
villages, except those in Ache, to build household panel data on the sample of the
1994/95 and 1999 PATANAS survey. However, we added new villages in each
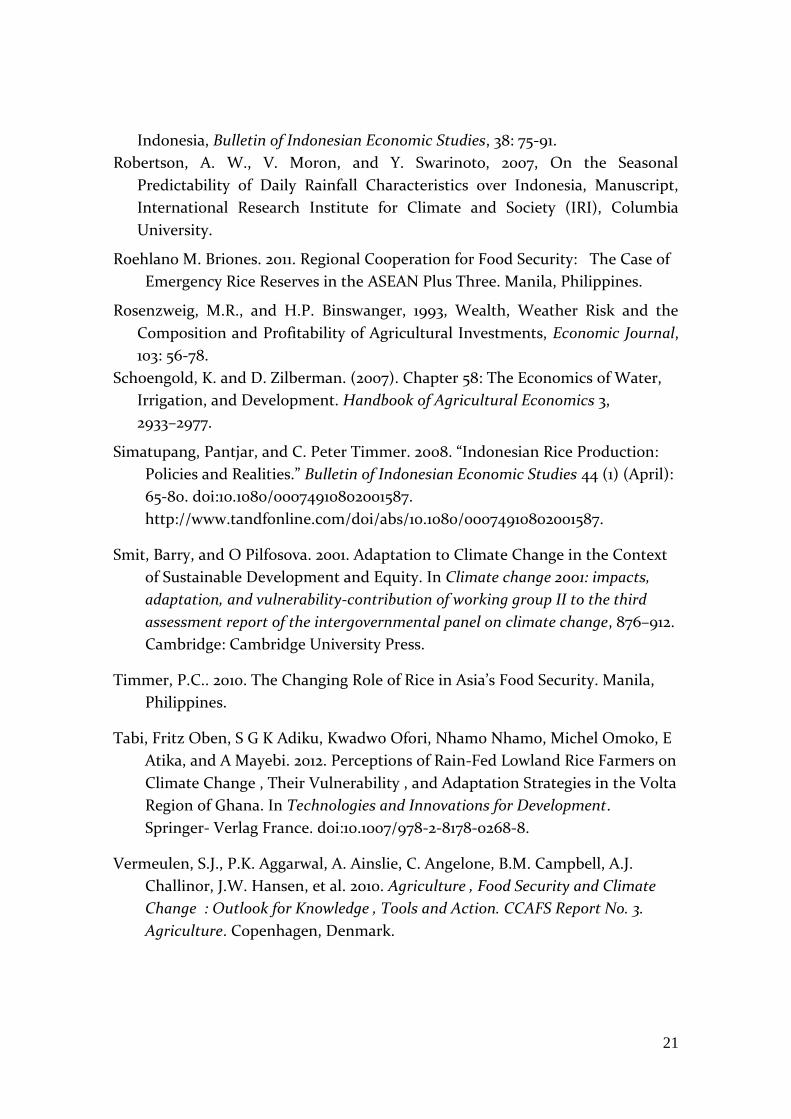
province. In total 98 villages were covered. Figure 1 shows locations of surveyed
villages.3
Data for rice production and the production growth are obtained from the panel
constructed from the 1997 and 2007 data. The IMDG in 2007 differs from
PATANAS 1999 in the following aspects: (i) we reduced the number of
households per village from 50 to 20however, it is on average 25 if including split
households),and added new villages in each province. (ii) the production data in
2007 is calculated based on the management unit which is not necessarily plot,
but PATANAS 1999 captures production activities of households for each plot
and season. In 2007, the survey only covers production for main commodities
including paddy rice. (iii) In 2007, for each management unit, we collected the
information on irrigation type. (iv) The value and size of unique market
arrangements such as Tebasan and Ijon are also collected if they are applicable.
(v)
IMDG 2007 also captured households split from the original households after
1999, residing in the same villages as the original ones. We aggregated the
original and split households so as to make the unit of observations comparable
with the 1999 production unit.
4 Province codes are as follows. 18: Lampung, 33: Central Java, 35: East Java, 52: West Nusa Tenggara (NTB),
63: South Kalimantan, 71: North Sulawesi, 73: South Sulawesi.
9
We dropped South Kalimantan from the 1999 data, since the 1999 PATANAS data
had some technical problems in the province. All the other methods of data
collection and treatment used in the 1999 survey are also applied to the 2007
survey.
Quantity of rice is standardized by converting all the units of production into
kilogram unit of ‘wet paddy’ by using SUSENAS conversion, as data for four
different types of rice products were collected: (i) wet paddy; (ii) unhusked rice;
(iii) unhusked rice for storage and (iv) rice ready for sales. Productivity of rice is
measured as the value of production per land. In the area surveyed, the rice is
cultivated only during the rainy season. For households who had a non-market
portion of the crop output, we used the average of village prices to impute the
value. We also estimated the approximate production value for the Tebasan
system using the prices computed in the above method. Lastly, we computed the
proportion of irrigated land at the household level. The proportion of each type is
the weighted average of irrigation type indicator using plot sizes as weights.
3. Climate Change - Rainfall, Magnitude, and Heterogeneity
This section describes changes in rainfall pattern that farmers reported in the
2007 survey. Our data directly elicit farmers’ perceptions on changes in rainfall
patterns during the recent decades, including the change in the onset of rainy

10
season, and their response to adapt perceived changes.
Figure 1 to be inserted
Farmers perceive the changes in rainfall patterns in various ways. Perceptions
among farmers vary even within a village, which also explains the variations in
farmers’ reactions to the changes.
Figures 2 to be inserted
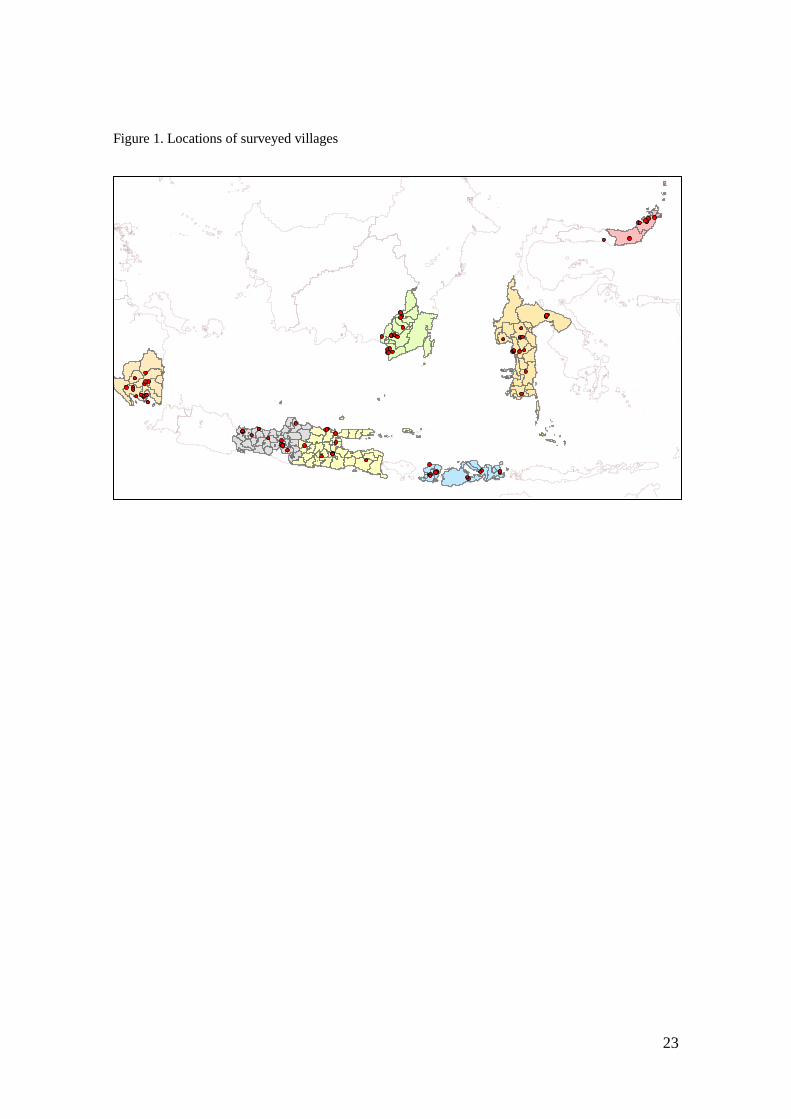
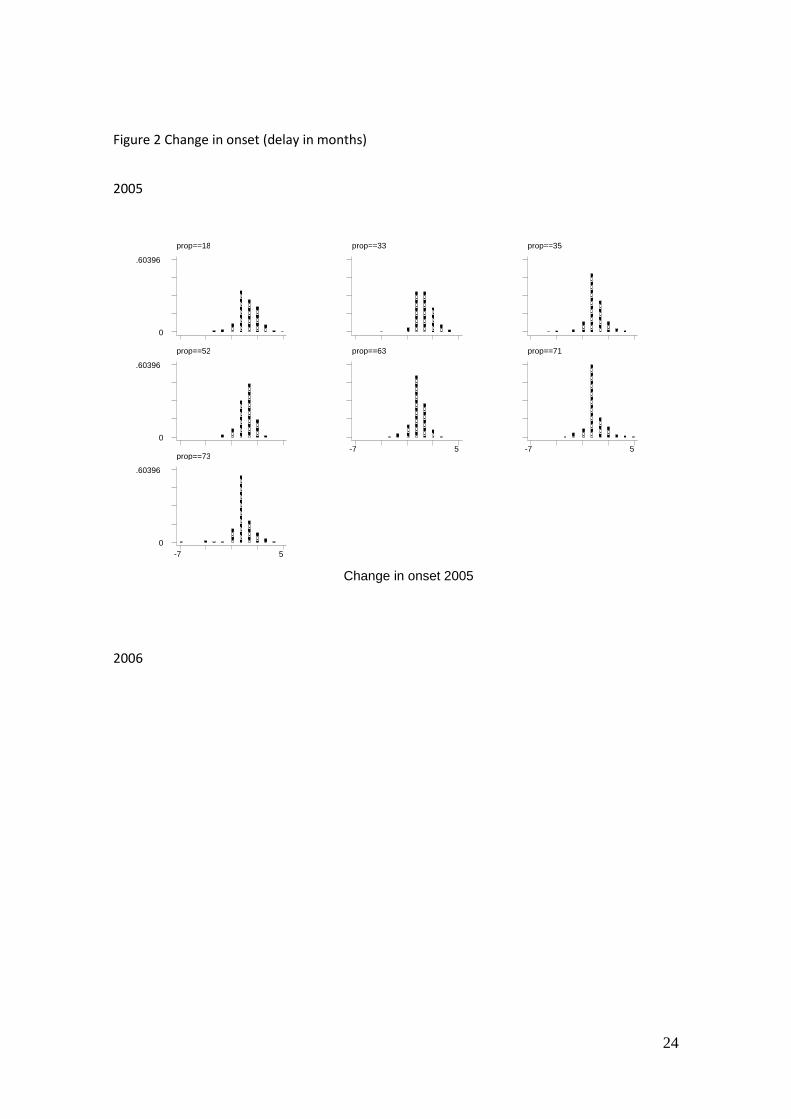
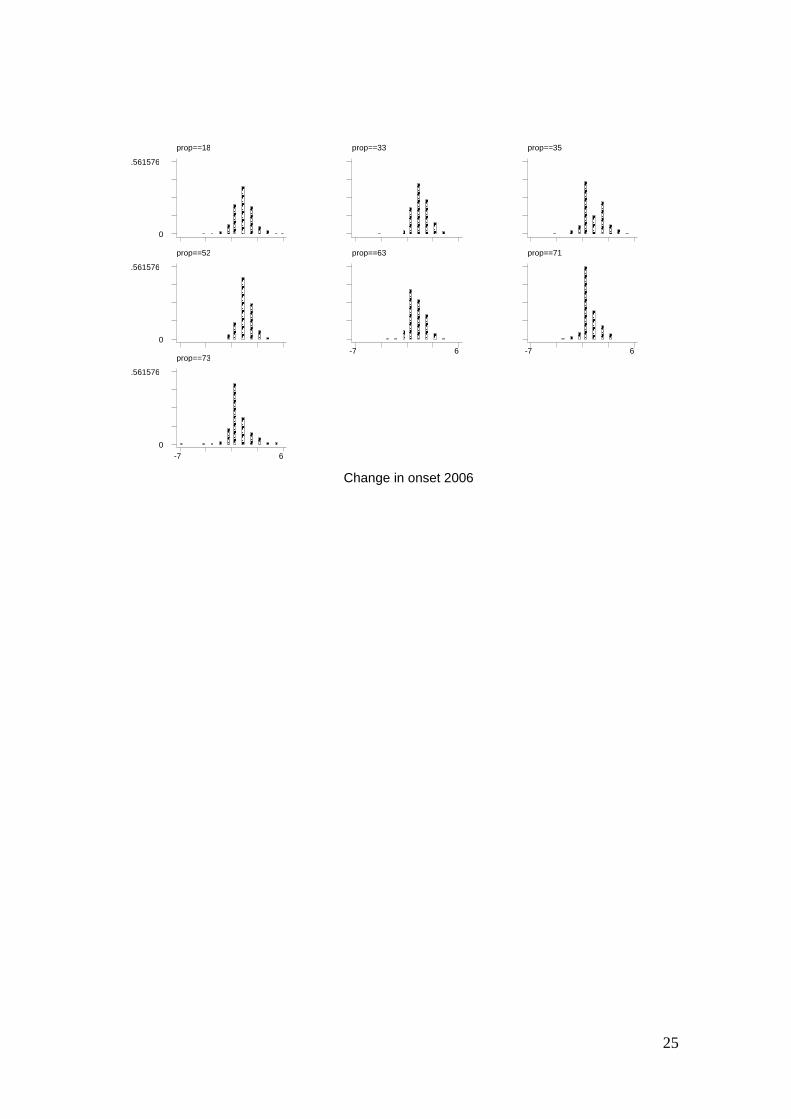
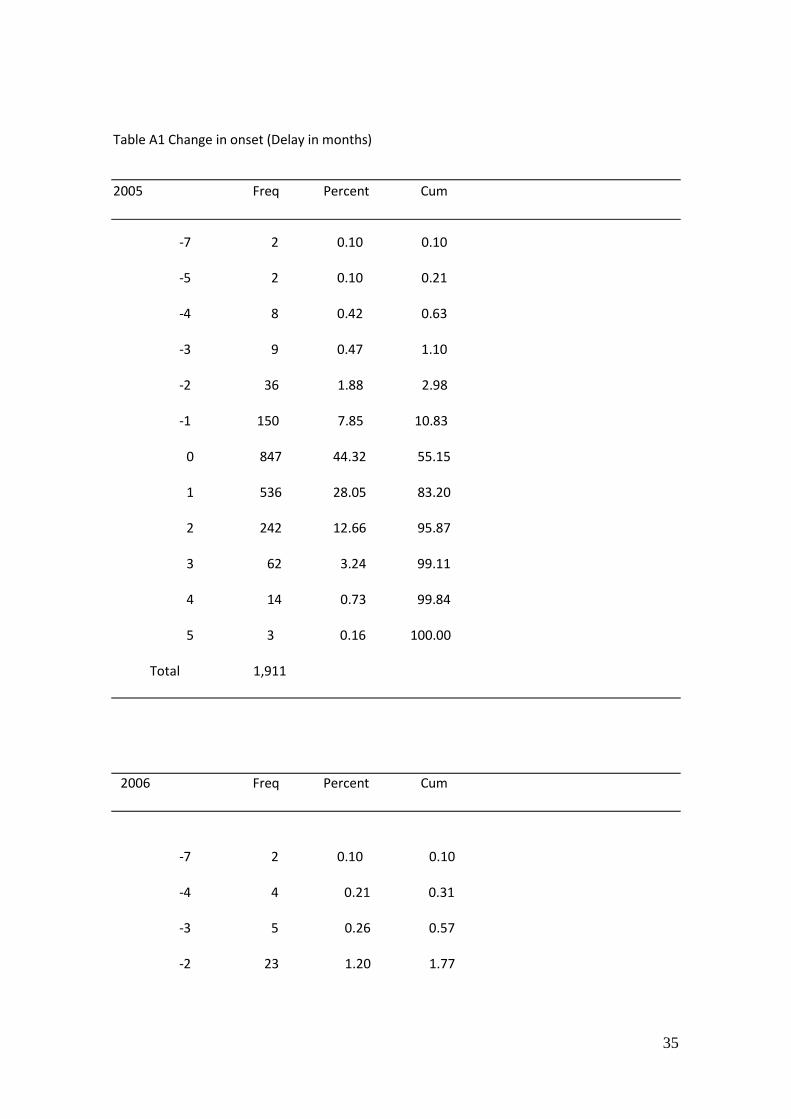
Figures 2 shows the distribution of the reported changes in the onset of rainy
season (in months) in 2005 and 2006 crop years, within each of the seven
provinces.4 We use as a benchmark the date which farmers reported to be the
standard onset of rainy season twenty years ago, and take the difference between
the date and the reported onset time for 2005 and 2006.5 Farmers recognize that,
on average, over the past twenty years the onset of rainy season has been delayed
by 0.86 months. The perceptions of the delayed onset of rainy season are
common across the provinces, although some variations among the provinces are
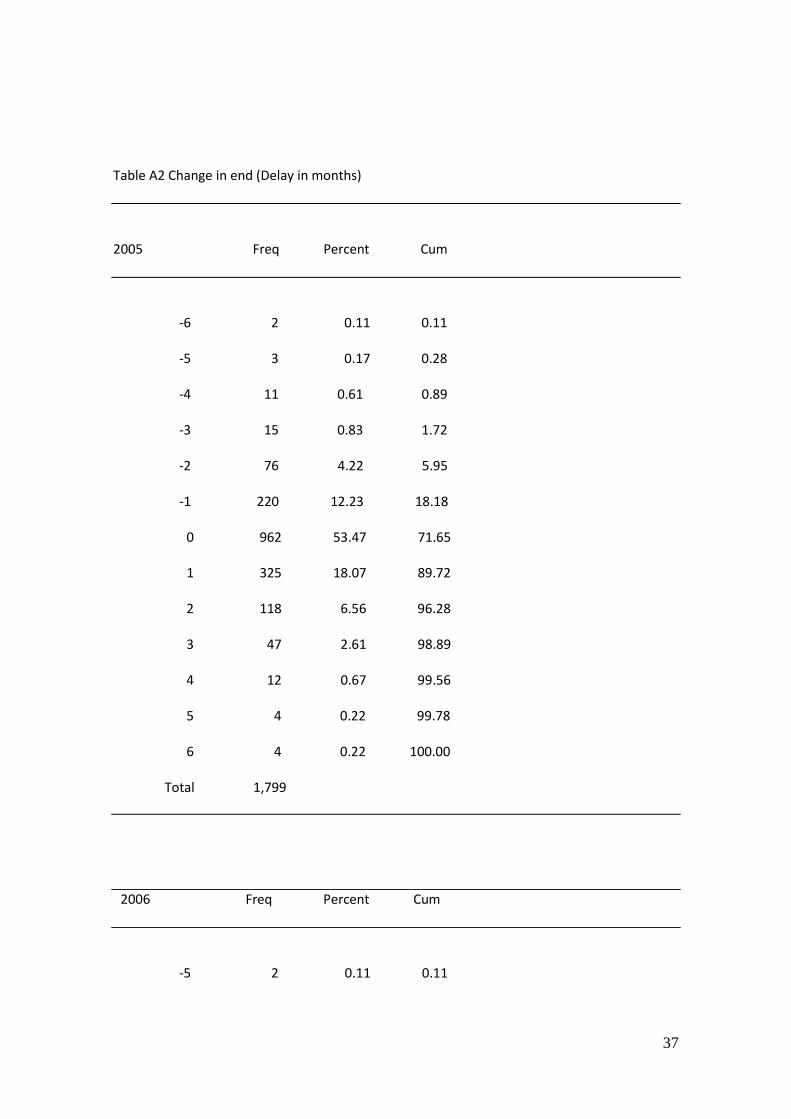
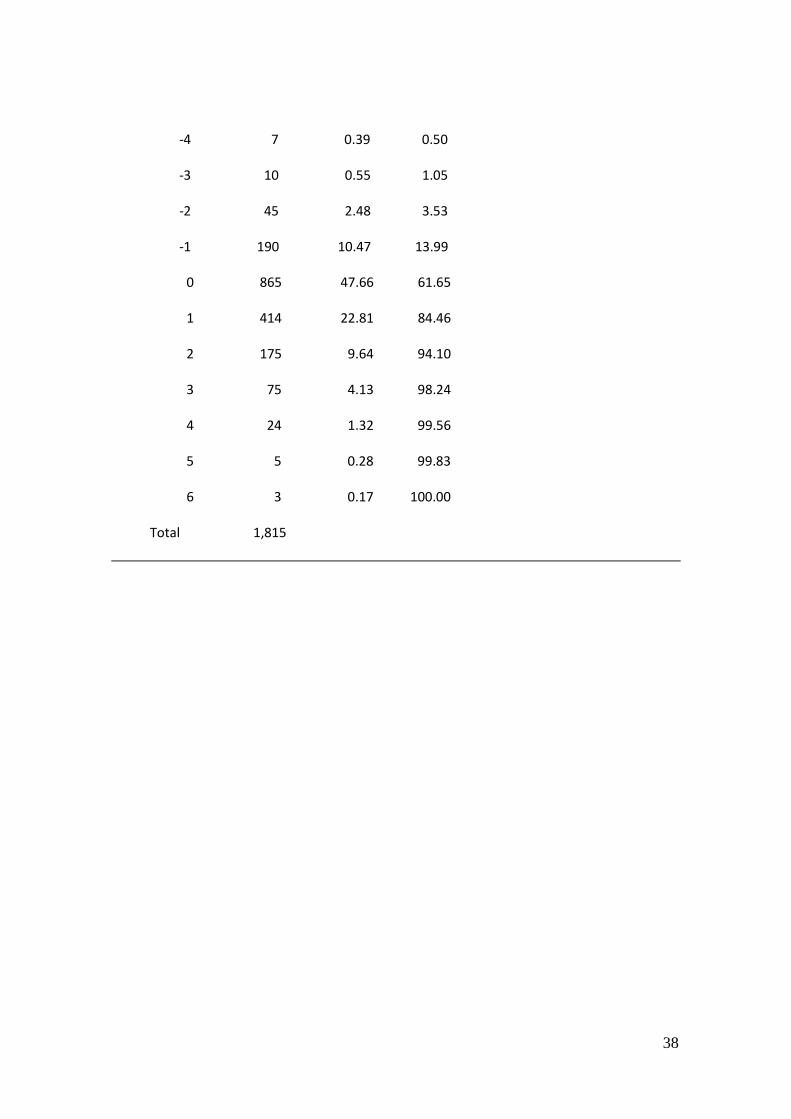
observed (Figure 4). We also confirm that, in farmers’ recognition, the end of
rainy season tends to be delayed, though this change is not as clearly recognized
as that of the onset. The commonly observed delays in the onset of rainy season
motivate this paper.
4 Province codes are as follows. 18: Lampung, 33: Central Java, 35: East Java, 52: West Nusa Tenggara (NTB),
63: South Kalimantan, 71: North Sulawesi, 73: South Sulawesi. 5 Tables A1 and A2 show tabulations of delays in month for the onset and end of rainy season for each of
2005 and 2006 compared to 20 years ago.
11
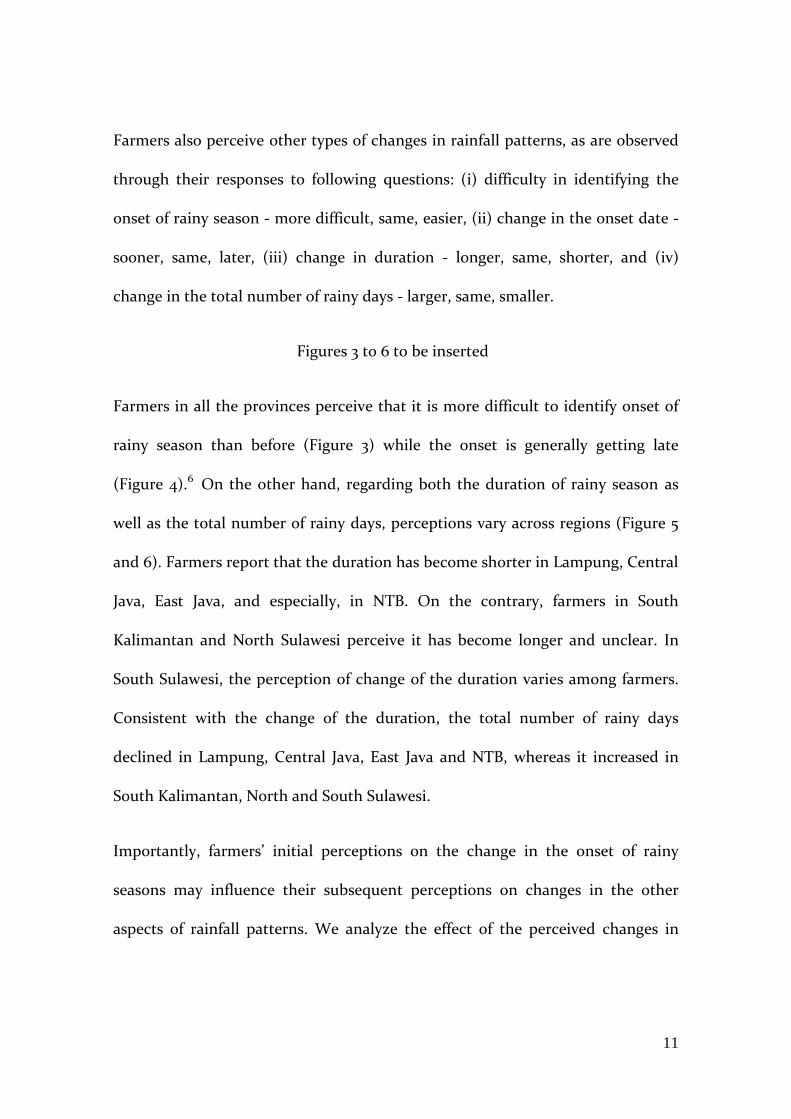
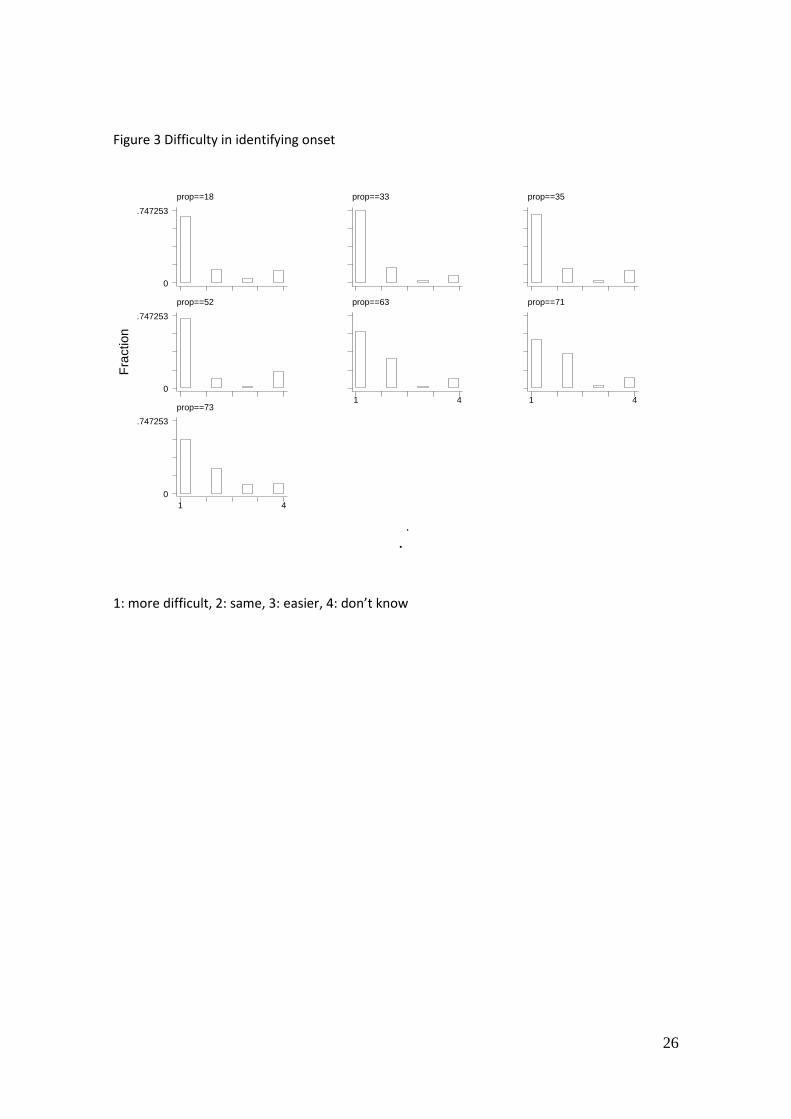
Farmers also perceive other types of changes in rainfall patterns, as are observed
through their responses to following questions: (i) difficulty in identifying the
onset of rainy season - more difficult, same, easier, (ii) change in the onset date -
sooner, same, later, (iii) change in duration - longer, same, shorter, and (iv)
change in the total number of rainy days - larger, same, smaller.
Figures 3 to 6 to be inserted
Farmers in all the provinces perceive that it is more difficult to identify onset of
rainy season than before (Figure 3) while the onset is generally getting late
(Figure 4).6 On the other hand, regarding both the duration of rainy season as
well as the total number of rainy days, perceptions vary across regions (Figure 5
and 6). Farmers report that the duration has become shorter in Lampung, Central
Java, East Java, and especially, in NTB. On the contrary, farmers in South
Kalimantan and North Sulawesi perceive it has become longer and unclear. In
South Sulawesi, the perception of change of the duration varies among farmers.
Consistent with the change of the duration, the total number of rainy days
declined in Lampung, Central Java, East Java and NTB, whereas it increased in
South Kalimantan, North and South Sulawesi.
Importantly, farmers’ initial perceptions on the change in the onset of rainy
seasons may influence their subsequent perceptions on changes in the other
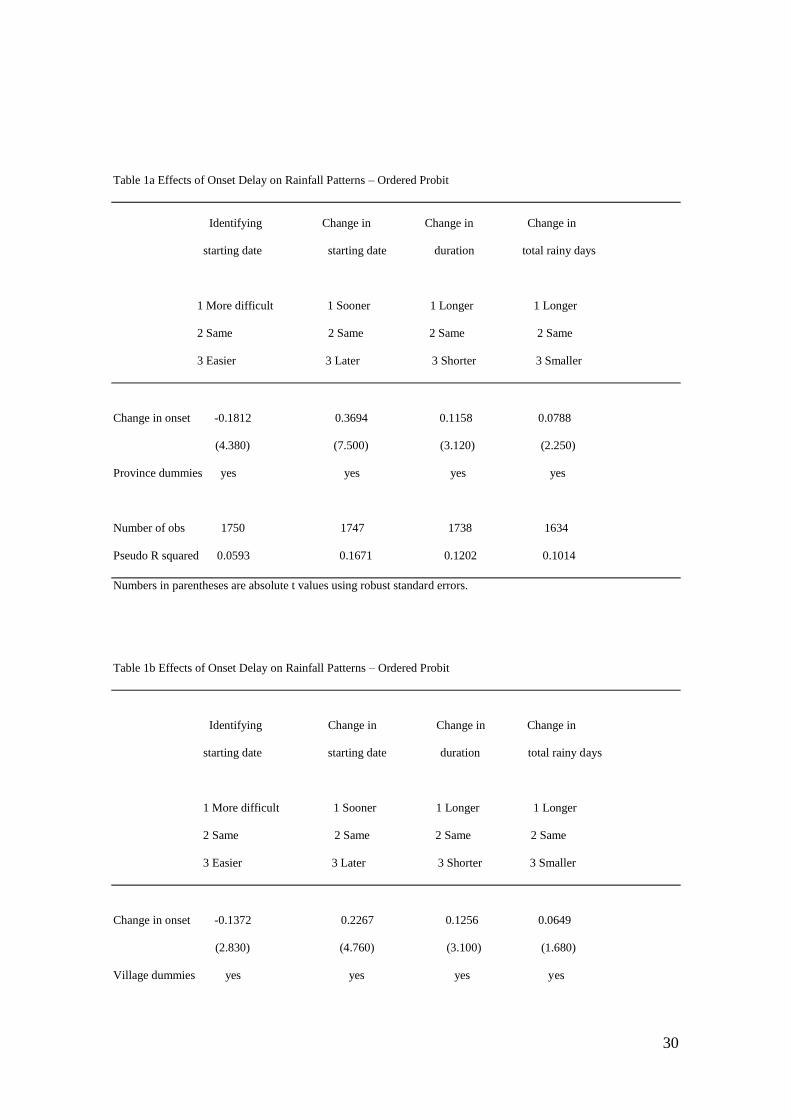
aspects of rainfall patterns. We analyze the effect of the perceived changes in

12
onset on the above mentioned other changes in rainfall patterns, using ordered
probit (Tables 1a and 1b). The results show that, when province dummies are
controlled, delays in the onset of rainy season significantly explains the other
changes in rainfall patterns (Table 1a).
Tables 1a and 1b to be inserted
Similar effects are observed when we control village fixed effects to examine the
effect of within-village variations (Table 1b). We confirm that the delays in onset
significantly explain the other changes in rainfall patterns, although the
parameter of the estimates becomes smaller in absolute value (due to bias that
arises from a correlation between village-level unobserved fixed error
components and delays in onset). Heterogeneity in the perceived changes of the
onset therefore also affects the perceived changes of rainfall patterns.
4. Adaptations: Planting Timing and Crop Variety
This section summarizes the empirical results regarding the effect of delays in the
onset of rainy season on farmers’ decisions in production. We first examine how
delays in the onset explain farmer’s choices to adapt the changes. We define an
indicator variable which takes the value of one, if a farmer considers each of the
6 The Meteorological Department defines onset of rainy season based on a threshold point in rainfall in
13
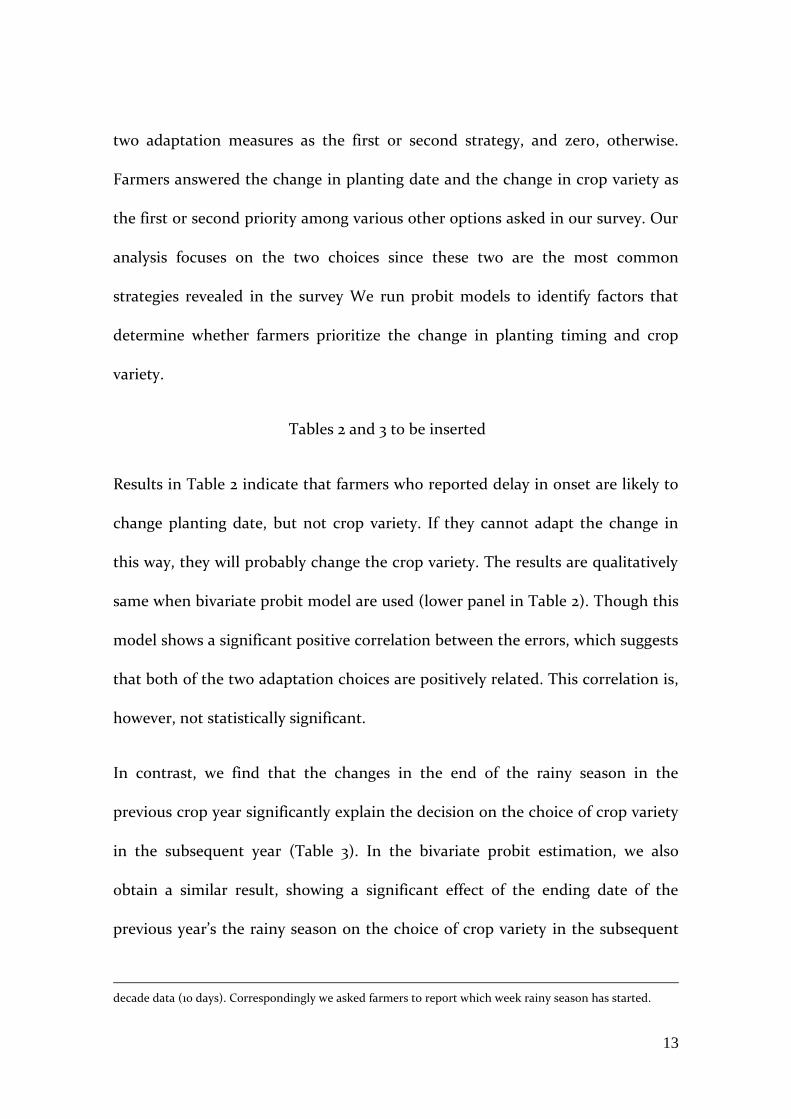
two adaptation measures as the first or second strategy, and zero, otherwise.
Farmers answered the change in planting date and the change in crop variety as
the first or second priority among various other options asked in our survey. Our
analysis focuses on the two choices since these two are the most common
strategies revealed in the survey We run probit models to identify factors that
determine whether farmers prioritize the change in planting timing and crop
variety.
Tables 2 and 3 to be inserted
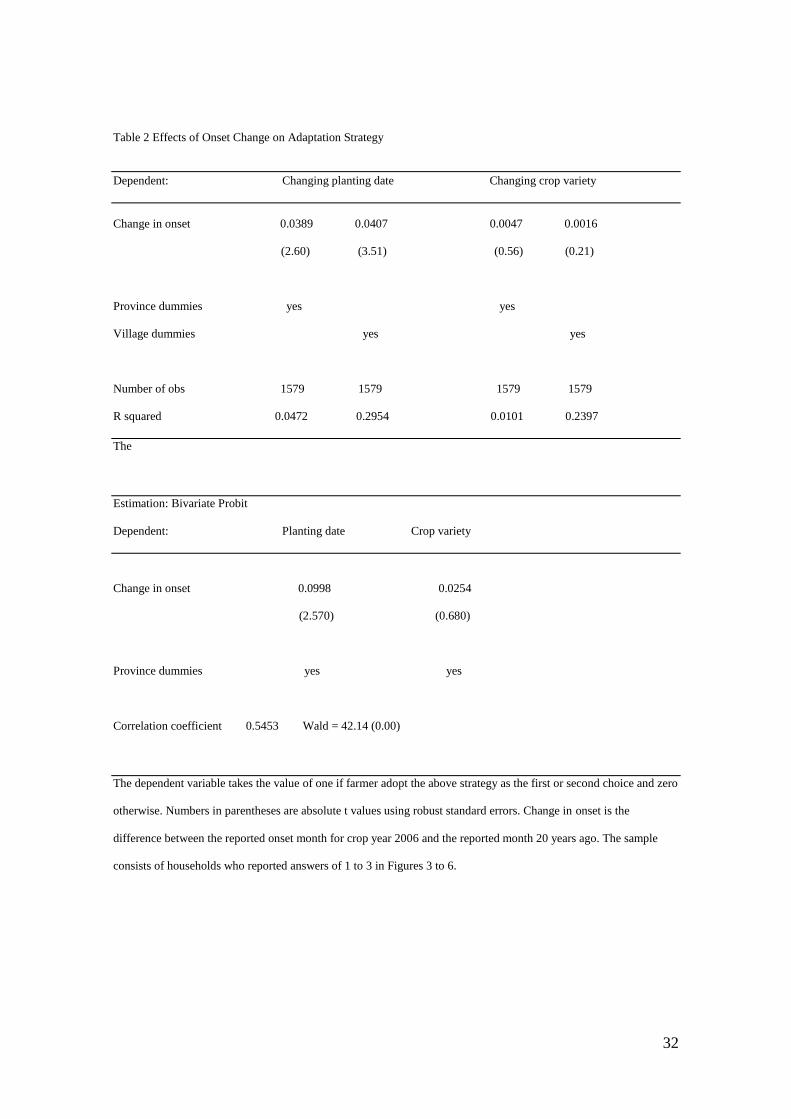
Results in Table 2 indicate that farmers who reported delay in onset are likely to
change planting date, but not crop variety. If they cannot adapt the change in
this way, they will probably change the crop variety. The results are qualitatively
same when bivariate probit model are used (lower panel in Table 2). Though this
model shows a significant positive correlation between the errors, which suggests
that both of the two adaptation choices are positively related. This correlation is,
however, not statistically significant.
In contrast, we find that the changes in the end of the rainy season in the
previous crop year significantly explain the decision on the choice of crop variety
in the subsequent year (Table 3). In the bivariate probit estimation, we also
obtain a similar result, showing a significant effect of the ending date of the
previous year’s the rainy season on the choice of crop variety in the subsequent
decade data (10 days). Correspondingly we asked farmers to report which week rainy season has started.

14
year. On the other hand, the shift in the end date of rainy season does not affect
planting date of the next year. These behaviors seem reasonable, considering the
fact that a choice of crop variety requires a sufficient time and investment while
decision on planting date is a result of judgment based on day-to-day
observations around the beginning of the rainy season.
5. Case Study: Rice Production
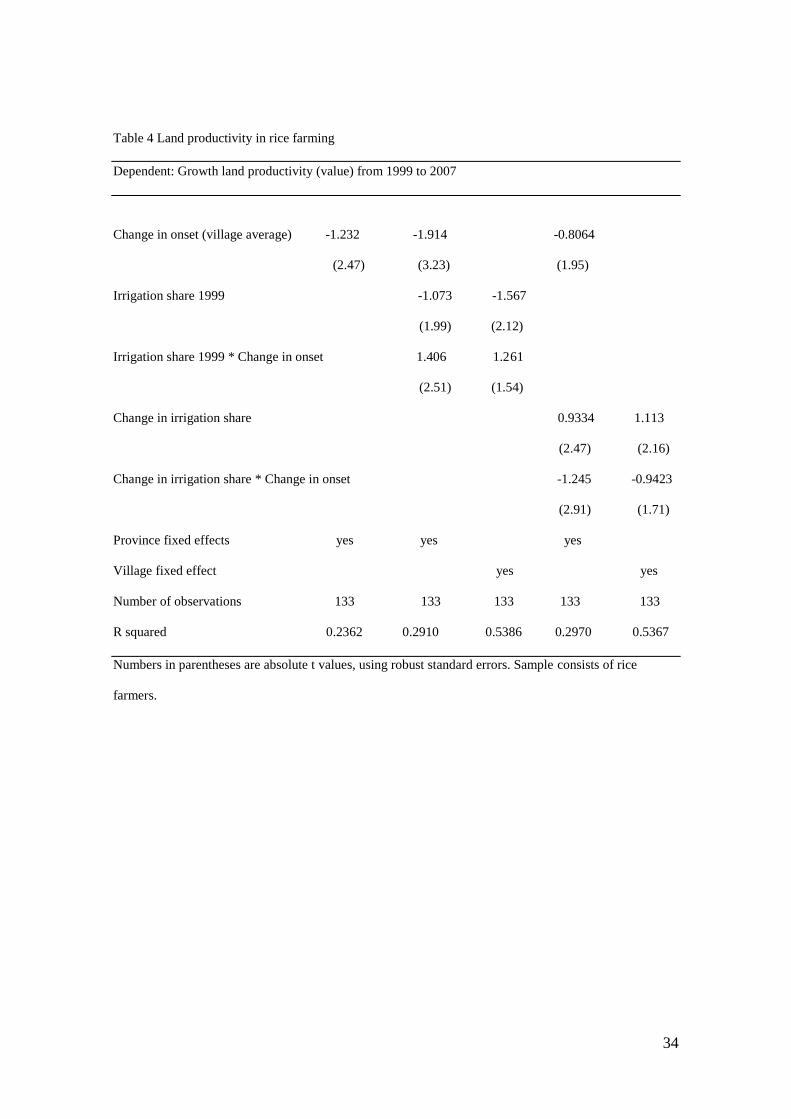
Next we examine the effects of changes in the rainfall patterns on rice
productivity growth during the period of 1999 to 2007 (Table 4). The dependent
variable is the growth rate of rice output value per harvested area. In all the
specifications for regressions we perform, we include either province or village
dummies to control province-wise price changes. Note that logarithm
transformation separates the price change from the real growth rate of rice
production.7 8 In this analysis, adaptation behavior is not explicitly structured
since we do not have identifying instruments for this component, and therefore
the estimated impact below includes both direct effects of climate change and
partly offsetting effects of adaptation behavior.
7 The numbers of rice farmers in IMDG 2007 and PATANAS 1999 surveys are 676 (including South
Kalimantan) and 633 (not including South Kalimantan), respectively. A half of the sample villages of IMDG 2007 are PATANAS 1999 villages and a half of sample households in PATANAS 1991 (and 1994/1995) were revisited in IMDG 2007 since we decided to reduce sample size within each village to 20 original households. Nearly 100 rice farmers discontinued farming until 2007. 8 We also bootstrapped the estimation with 100 repetitions to obtain asymptotic standard errors overcoming
the small sample size problem. Though t-values slightly decreased with bootstrapping, the results remain robust.
15
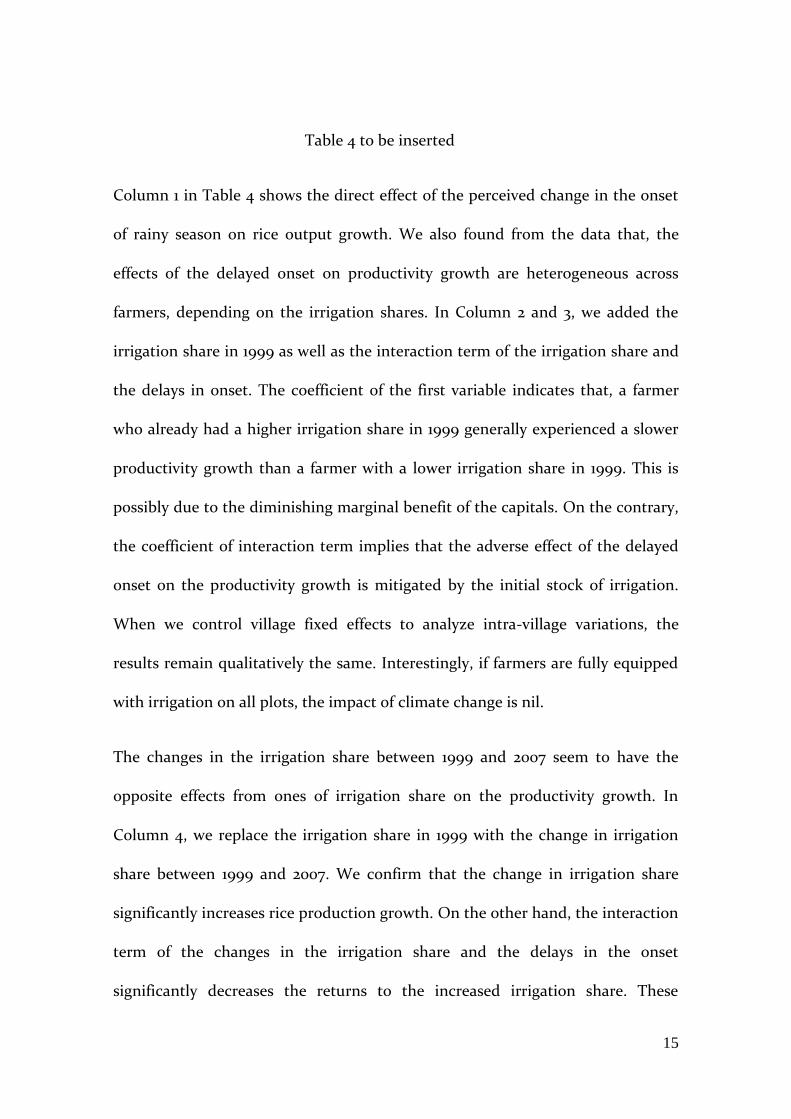
Table 4 to be inserted
Column 1 in Table 4 shows the direct effect of the perceived change in the onset
of rainy season on rice output growth. We also found from the data that, the
effects of the delayed onset on productivity growth are heterogeneous across
farmers, depending on the irrigation shares. In Column 2 and 3, we added the
irrigation share in 1999 as well as the interaction term of the irrigation share and
the delays in onset. The coefficient of the first variable indicates that, a farmer
who already had a higher irrigation share in 1999 generally experienced a slower
productivity growth than a farmer with a lower irrigation share in 1999. This is
possibly due to the diminishing marginal benefit of the capitals. On the contrary,
the coefficient of interaction term implies that the adverse effect of the delayed
onset on the productivity growth is mitigated by the initial stock of irrigation.
When we control village fixed effects to analyze intra-village variations, the
results remain qualitatively the same. Interestingly, if farmers are fully equipped
with irrigation on all plots, the impact of climate change is nil.
The changes in the irrigation share between 1999 and 2007 seem to have the
opposite effects from ones of irrigation share on the productivity growth. In
Column 4, we replace the irrigation share in 1999 with the change in irrigation
share between 1999 and 2007. We confirm that the change in irrigation share
significantly increases rice production growth. On the other hand, the interaction
term of the changes in the irrigation share and the delays in the onset
significantly decreases the returns to the increased irrigation share. These
16
coefficients indicate an interesting finding: one-month delay of the rainy season
onset almost cancels the marginal benefit from the increase in irrigation. Both of
the results employing province fixed effects and village fixed effects (Columns 4
and 5), are qualitatively the same, although statistical significance is slightly
lower with village fixed effects.
It is also important to describe additional findings that we didn’t describe in the
table. We observed heterogeneity within the villages both of the impact of
irrigation share. The heterogeneity remains present even after the village-specific
effects are controlled from productivity growth. In addition, we found that a
dynamic productivity gain of the farmers with the increased irrigation share is
significantly smaller in villages that experienced larger delays in onset of the
rainy season. These findings are robust to spurious correlations arising from
unobserved village-specific factors.
Our results show the negative effects of the delayed onset on the rice productivity
growth. They also highlighted both the potential and the limitation of irrigation
to mitigate such effects. A high irrigation share in 1999 indicates that the farmer’s
productivity growth after 1999 has been slower, since he/her already attained
high productivity at that time of 1999. On the contrary, an increase in the
irrigation share after 1999 generally drove the productivity growth. When
coupled with the delayed onset in the rainy season, however, the effect of the
increase in the irrigation share becomes smaller and heterogeneous among
farmers and villages.

17
These characteristics are possibly due to the newly developed irrigation system’s
susceptibility to rainfall patterns. Farmers who had larger irrigation share than
others in 1999 are likely to have had a better access to stable water sources
being less susceptible to the change in rainfall patterns. Their irrigation systems
may also be less influenced by water uptake by other farmers. On the contrary,
the increase in the irrigation share after 1999 might have been achieved using
more marginal water sources such as downstream, which are less stable and more
susceptible to the change in rainfall patterns. When the onset of the rainy season
is delayed, therefore, the newly irrigated areas may not be able to avoid the water
shortage.
In sum, our empirical results show that returns to irrigations can be eroded when
onset of the rainy season is delayed. Such trend has been increasingly common in
Indonesia, potentially due to the expansion of irrigation using marginal water
sources. For rice farming in Indonesia, climate change decreases rather than
increases returns on irrigation infrastructure. Such reduced benefit from
irrigation is consistent with our earlier observations. While irrigation technology
may stabilize the water supply from the erratic rainfall during the rainy season,
either the technology employed in the surveyed villages may not have the
capacity to obtain water from deep aquifer underground. The limited capacity of
irrigation to overcome the water shortage at the time of planting is also
consistent with our findings that many farmers delay their planting when the
onset is delayed. The farmers choose the option of the delayed planting despite

18
the various risks associated such as lower yields and longer lean season for rice.
This suggests that the irrigation system is not functioning enough as an
adaptation to the changes in climate.
6. Summary and policy implications
This paper analyzed Indonesian rice farmers’ perceptions on rainfalls, adaptive
behaviors according to their perceptions, and the effects of such changes on the
rice productivity. The perceived changes in rainfall patterns induce farmers’
adaptive behaviors, such as shifting the planting date. Such patterns of
adaptation behavior are similar to other geographic regions but yet partially
unique. In Indonesia, some other strategies such as changing crop varieties are
less commonly observed, which could be a tendency specific to rice farming. The
possible reason is because farmers feel difficulty in converting paddy rice field to
other purposes, and/or because it requires large investments in converting the
land to suit for other crops than rice production. It is worth investigating the
relevance of the change in crop variety in non-rice production as an adaptation
behavior, though this is beyond the scope of our paper.
Our empirical results show that the delays in the onset of the rainy season
substantially decrease the rice production growth. Indeed, in the areas of study,
one-month delay in the onset of the rainy season cancels the average growth of
19
rice production. Furthermore, the results reveal some important insights on
returns to irrigation when rainfall patterns are under the change. Irrigation has a
potential to mitigate negative effects of the delayed onset in areas where
relatively stable water supply are available and accessible to the users of the
system. The supply should be less susceptible to rainfall to mitigate the adverse
effect of the change in the rainfall patterns. Irrigation in Indonesia, on the other
hand, may be increasingly relying on the marginal water sources, which are more
susceptible to the rainfall. Therefore, the return on irrigation in Indonesia may be
increasingly constrained by the delayed onset of the rainy season.
These insights lead to several important policy implications. First, a strong
initiative by policy makers for planned adaptation is important. Farmers’
autonomous adaptation has a limitation both in predicting short and long term
change and variability (Howden et al). An effective climate information services
can increase the success rate of adaptation and efficiency of resource use for rice
production. Farmers’ interest in such information service is in general reported to
be high (Hansen et al.). Coordinated investments are needed into increasing
resources for monitoring, data collection, data processing and delivery on
climates in Indonesia.
Second, as the capacity of irrigation becomes increasingly limited to mitigate the
effect of delayed onset of the rainy season, public investment may be needed to
support farmers to take alternative adaptation strategies, including a new seed
variety that can mitigate their exposures to climate effects.For example, famers’

20
access to varieties with shorter growth duration can be improved.
References
Adrian, E. and R.D. Susanto, 2003, Identification of Three Dominant Rainfall
Regions within Indonesia and their Relationship to Sea Surface Temperature,
International Journal of Climatology, 23: 1435-1452.
Food and Agricultural Organization (FAO). 2010. AQUASTAT: Indonesia.
Available online at
http://www.fao.org/nr/water/aquastat/countries/indonesia/index.stm.
Accessed May 18, 2011.
Fuglie, C., Keith O., and Roley R. Piggott. 2006. Indonesia: Coping with Economic
and Political Instability. In Agricultural R&D in the Developing World: Too
Little, Too Late?, ed. Philip G. Pardey, Julian M. Alston, and Roley R. Piggott,
65-104. Washington, D.C.: International Food Policy Research Institute.
Hansen, James W.,Walter Baethgen, Dan Osgood, Pietro Ceccato, and Robinson
Kinuthia Ngugi. 2007. “Innovations in Climate Risk Management: Protecting
and Building Rural Livelihoods in a Variable and Changing Climate.” Journal
of Semi-Arid Tropical Agricultural Research 4 (1): 1-12.
Hamada, J.L., M.D. Yamanaka, J. Matsumoto, S. Fukao, P.A. Winarso, and T.
Sribimawati, 2002, Spatial and Temporal Variations of the Rainy Season over
Indonesia and their Link to ENSO, Journal of Meteorological Society of Japan,
80: 285-310.
Haylock, M., and J. McBride, 2001, Spatial Coherence and Predictability of
Indonesian Wet Season Rainfall, Journal of Climate, 14: 3882-3887.
Maddison, David. 2007. The Perception of and Adaptation to Climate Change in
Africa. Washington, DC.
Morton, V., A. Robertson and R. Boer, 2007, Spatial coherence and seasonal
predictability of monsoon onset over Indonesia, Manuscript, CEREGE, France.
Naylor, R., D. Battisti, D. Vimont, W. Falcon, and M. Burke, 2007, Assessing Risks
of Climate Variability and Climate Change for Indonesian Rice Agriculture,
The Proceedings of the National Academy of Sciences (PNAS), 104: 7752-7757.
Naylor, R.L., W. Falcon, N. Wada, and D. Rochberg, 2002, Using El-Nino
Southern Oscillation Climate Data to Improve Food Policy Planning in
21
Indonesia, Bulletin of Indonesian Economic Studies, 38: 75-91.
Robertson, A. W., V. Moron, and Y. Swarinoto, 2007, On the Seasonal
Predictability of Daily Rainfall Characteristics over Indonesia, Manuscript,
International Research Institute for Climate and Society (IRI), Columbia
University.
Roehlano M. Briones. 2011. Regional Cooperation for Food Security: The Case of
Emergency Rice Reserves in the ASEAN Plus Three. Manila, Philippines.
Rosenzweig, M.R., and H.P. Binswanger, 1993, Wealth, Weather Risk and the
Composition and Profitability of Agricultural Investments, Economic Journal,
103: 56-78.
Schoengold, K. and D. Zilberman. (2007). Chapter 58: The Economics of Water,
Irrigation, and Development. Handbook of Agricultural Economics 3,
2933–2977.
Simatupang, Pantjar, and C. Peter Timmer. 2008. “Indonesian Rice Production:
Policies and Realities.” Bulletin of Indonesian Economic Studies 44 (1) (April):
65-80. doi:10.1080/00074910802001587.
http://www.tandfonline.com/doi/abs/10.1080/00074910802001587.
Smit, Barry, and O Pilfosova. 2001. Adaptation to Climate Change in the Context
of Sustainable Development and Equity. In Climate change 2001: impacts,
adaptation, and vulnerability-contribution of working group II to the third
assessment report of the intergovernmental panel on climate change, 876–912.
Cambridge: Cambridge University Press.
Timmer, P.C.. 2010. The Changing Role of Rice in Asia’s Food Security. Manila,
Philippines.
Tabi, Fritz Oben, S G K Adiku, Kwadwo Ofori, Nhamo Nhamo, Michel Omoko, E
Atika, and A Mayebi. 2012. Perceptions of Rain-Fed Lowland Rice Farmers on
Climate Change , Their Vulnerability , and Adaptation Strategies in the Volta
Region of Ghana. In Technologies and Innovations for Development.
Springer- Verlag France. doi:10.1007/978-2-8178-0268-8.
Vermeulen, S.J., P.K. Aggarwal, A. Ainslie, C. Angelone, B.M. Campbell, A.J.
Challinor, J.W. Hansen, et al. 2010. Agriculture , Food Security and Climate
Change : Outlook for Knowledge , Tools and Action. CCAFS Report No. 3.
Agriculture. Copenhagen, Denmark.

22
Yamauchi, F., 2012, “Prenatal Seasonality, Child Growth and Schooling
Investments: Evidence from Rural Indonesia,” Forthcoming, Journal of
Development Studies.
Yamauchi, F., M. Muto, S. Chowdhury, R. Dewina, and S. Sumaryanto. 2011.
“Schooling and Roads are Complementary? Evidence from Income Dynamics
in Rural Indonesia,” World Development 39: 2232-2244.
23
Figure 1. Locations of surveyed villages
24
Figure 2 Change in onset (delay in months)
2005
2006
Change in onset 2005
prop==18
0
.60396 prop==33 prop==35
prop==52
0
.60396 prop==63
-7 5
prop==71
-7 5 prop==73
-7 5 0
.60396
25
Change in onset 2006
prop==18
0
.561576 prop==33 prop==35
prop==52
0
.561576 prop==63
-7 6
prop==71
-7 6 prop==73
-7 6 0
.561576
26
Figure 3 Difficulty in identifying onset F
raction
..
prop==18
0
.747253
prop==33 prop==35
prop==52
0
.747253
prop==63
1 4
prop==71
1 4prop==73
1 4
0
.747253
1: more difficult, 2: same, 3: easier, 4: don’t know

27
Figure 4 Change in onset date
Fra
ction
..
prop==18
0
.826797
prop==33 prop==35
prop==52
0
.826797
prop==63
1 4
prop==71
1 4prop==73
1 4
0
.826797
1: sooner, 2: same, 3: later, 4: don’t know

28
Figure 5 Change in duration
Fra
ction
..
prop==18
0
.732899
prop==33 prop==35
prop==52
0
.732899
prop==63
1 4
prop==71
1 4prop==73
1 4
0
.732899
1: longer, 2: same, 3: shorter, 4: don’t know

29
Figure 6 Change in total number of rainy days
Fra
ction
..
prop==18
0
.628664
prop==33 prop==35
prop==52
0
.628664
prop==63
1 4
prop==71
1 4prop==73
1 4
0
.628664
1: larger, 2: same, 3: smaller, 4: don’t know
30
Table 1a Effects of Onset Delay on Rainfall Patterns – Ordered Probit
Identifying Change in Change in Change in
starting date starting date duration total rainy days
1 More difficult 1 Sooner 1 Longer 1 Longer
2 Same 2 Same 2 Same 2 Same
3 Easier 3 Later 3 Shorter 3 Smaller
Change in onset -0.1812 0.3694 0.1158 0.0788
(4.380) (7.500) (3.120) (2.250)
Province dummies yes yes yes yes
Number of obs 1750 1747 1738 1634
Pseudo R squared 0.0593 0.1671 0.1202 0.1014
Numbers in parentheses are absolute t values using robust standard errors.
Table 1b Effects of Onset Delay on Rainfall Patterns – Ordered Probit
Identifying Change in Change in Change in
starting date starting date duration total rainy days
1 More difficult 1 Sooner 1 Longer 1 Longer
2 Same 2 Same 2 Same 2 Same
3 Easier 3 Later 3 Shorter 3 Smaller
Change in onset -0.1372 0.2267 0.1256 0.0649
(2.830) (4.760) (3.100) (1.680)
Village dummies yes yes yes yes

31
Number of obs 1750 1747 1738 1638
Pseudo R squared 0.0492 0.1269 0.1175 0.0977
Numbers in parentheses are absolute t values using robust standard errors.
32
Table 2 Effects of Onset Change on Adaptation Strategy
Dependent: Changing planting date Changing crop variety
Change in onset 0.0389 0.0407 0.0047 0.0016
(2.60) (3.51) (0.56) (0.21)
Province dummies yes yes
Village dummies yes yes
Number of obs 1579 1579 1579 1579
R squared 0.0472 0.2954 0.0101 0.2397
The
Estimation: Bivariate Probit
Dependent: Planting date Crop variety
Change in onset 0.0998 0.0254
(2.570) (0.680)
Province dummies yes yes
Correlation coefficient 0.5453 Wald = 42.14 (0.00)
The dependent variable takes the value of one if farmer adopt the above strategy as the first or second choice and zero
otherwise. Numbers in parentheses are absolute t values using robust standard errors. Change in onset is the
difference between the reported onset month for crop year 2006 and the reported month 20 years ago. The sample
consists of households who reported answers of 1 to 3 in Figures 3 to 6.

33
Table 3 Effects of End Change on Adaptation Strategy in the subsequent year
Dependent: Changing planting date Changing crop variety
Change in end -0.0002 0.0084 0.0165 0.0162
(0.02) (0.81) (2.22) (2.10)
Province dummies yes yes
Village dummies yes yes
Number of obs 1454 1454 1454 1454
R squared 0.0328 0.2909 0.0152 0.2432
Estimation: Bivariate Probit
Dependent: Planting date Crop variety
Change in end 0.0351 0.0719
(1.15) (2.09)
Province dummies yes yes
Correlation coefficient 0 .5112 Wald = 36.17 (0.00)
The dependent variable takes the value of one if farmer adopt the above strategy as the first or second choice and zero
otherwise. Numbers in parentheses are absolute t values using robust standard errors. Change in end is the difference
between the reported ending month for crop year 2005 and the reported month 20 years ago. The sample consists of
households who reported answers of 1 to 3 in Figures 3 to 6.
34
Table 4 Land productivity in rice farming
Dependent: Growth land productivity (value) from 1999 to 2007
Change in onset (village average) -1.232 -1.914 -0.8064
(2.47) (3.23) (1.95)
Irrigation share 1999 -1.073 -1.567
(1.99) (2.12)
Irrigation share 1999 * Change in onset 1.406 1.261
(2.51) (1.54)
Change in irrigation share 0.9334 1.113
(2.47) (2.16)
Change in irrigation share * Change in onset -1.245 -0.9423
(2.91) (1.71)
Province fixed effects yes yes yes
Village fixed effect yes yes
Number of observations 133 133 133 133 133
R squared 0.2362 0.2910 0.5386 0.2970 0.5367
Numbers in parentheses are absolute t values, using robust standard errors. Sample consists of rice
farmers.
35
Table A1 Change in onset (Delay in months)
2005 Freq Percent Cum
-7 2 0.10 0.10
-5 2 0.10 0.21
-4 8 0.42 0.63
-3 9 0.47 1.10
-2 36 1.88 2.98
-1 150 7.85 10.83
0 847 44.32 55.15
1 536 28.05 83.20
2 242 12.66 95.87
3 62 3.24 99.11
4 14 0.73 99.84
5 3 0.16 100.00
Total 1,911
2006 Freq Percent Cum
-7 2 0.10 0.10
-4 4 0.21 0.31
-3 5 0.26 0.57
-2 23 1.20 1.77

36
-1 122 6.37 8.14
0 634 33.09 41.23
1 596 31.11 72.34
2 381 19.89 92.22
3 112 5.85 98.07
4 29 1.51 99.58
5 7 0.37 99.95
6 1 0.05 100.00
Total 1,916
37
Table A2 Change in end (Delay in months)
2005 Freq Percent Cum
-6 2 0.11 0.11
-5 3 0.17 0.28
-4 11 0.61 0.89
-3 15 0.83 1.72
-2 76 4.22 5.95
-1 220 12.23 18.18
0 962 53.47 71.65
1 325 18.07 89.72
2 118 6.56 96.28
3 47 2.61 98.89
4 12 0.67 99.56
5 4 0.22 99.78
6 4 0.22 100.00
Total 1,799
2006 Freq Percent Cum
-5 2 0.11 0.11
38
-4 7 0.39 0.50
-3 10 0.55 1.05
-2 45 2.48 3.53
-1 190 10.47 13.99
0 865 47.66 61.65
1 414 22.81 84.46
2 175 9.64 94.10
3 75 4.13 98.24
4 24 1.32 99.56
5 5 0.28 99.83
6 3 0.17 100.00
Total 1,815