Embed Size (px)
Citation preview
Vol. 9: 147-155.1997 CLIMATE RESEARCH
Clim Res I Published December 29
Climate change impacts on the hydrologic resources of South America: an annual,
continental scale assessment
David N. Yates*
National Center for Atmospheric Research, PO Box 3000. Boulder, Colorado 80301, USA
ABSTRACT: Two empirical annual runoff models which represent point estimates of river basin dis- charge were used for assessing the potential impact of climate change on runoff over South America. The first model is an annual regression relationship which relates temperature and precipitation to basin discharge. The second relationship is based on observed climatological variables and relates annual precipitation and potential evapotranspiration to runoff. A Geographic Information System (GIS) was used to implement these annual models in order to assess runoff on a O.SO X 0.5' grid over South America using mean annual temperature, precipitation, and computed potential evapotranspira- tion images. Annual changes in precip~tation (percent change) and temperature (absolute change) were gathered from 4 Global Circulation Models (GCMs) and were used to derive new runoff esti- mates. Generally, these climate change scenarios consistently showed increases in runoff over the northwest and southern regions of South America, while the central and northeast regions were a mix- ture of increases and decreases depending on the GCM scenario. Comparisons with detailed, basin level models with shorter time-steps are necessary to validate the use of these annual approaches for continental scale assessment.
KEY WORDS: Climate change. Water resources. Runoff. Annual models. South America
1. INTRODUCTION
1.1. Water resource management
Water resource management is the interaction of natural processes, technology, economics and institu- tions, working together to balance water supply with water demand. There are still a number of possible water projects in South America, with the potential of generating secured supplies and massive amounts of hydro-electric power. Water managers in South Amer- ica are faced with growing populations pressing for improved living standards, and increased pressure for the incorporation of environmental protection objec- tives into the operation of the existing and future water resource system. The issue is efficient water manage- ment. With environmental concerns severely con- straining new developments, water managers are ask-
ing what modifications might be necessary to the cur- rent and future management of water systems to adapt to climate change. Water resources management by its very nature is an adaptive process on various time scales, and continued experience provides a wealth of knowledge to the practice.
However, it is very important in assessing potential climate change impacts on water resources to address the issues of water resource development. Water man- agers in Latin America are facing growing economies with many environmental problems. With develop- ment and increased demands of a growing population demanding improved water supply and sanitation, massive capital expenditures are needed to develop the required infrastructure. With planning and con- struction times of 20 to 30 yr or more for major water development projects, the question asked by many water resource managers in these countries is how cli- mate change might impact the design of new water resource infrastructure.
O Inter-Research 1997
148 Clim Res 9: 147-155, 1997
Uncertainties exist at the local and regional level of climate change impacts on unmanaged hydrologic re- sources, which will then be propagated into uncertainty of the managed water resource system, in terms of sup- ply. Additionally, the same local and regional uncer- tainties will add to already uncertain future water de- mands which are driven by socio-economic processes.
The goal of this paper is to provide the reader with understanding of the sensitivity of South American hydrologic resources-river runoff-to potential cli- mate changes. This paper, while reporting country specific results based on average national values, does not imply a local scale impact assessment of climate change. Rather the paper attempts to characterize cli- matological or geographical patterns of water resource vulnerability across South America.
1.2. Climate change impacts on the water resource system
Water resource development has taken place to pro- tect socio-economic systems from climate variability. Arguably, the most important component in the water resource infrastructure is the reservoir. This technolog- ical element is designed to change the natural tempo- ral distribution of water supply to meet economically derived demands and/or flood protection. This entails storing water in wet periods of the year for release in dry periods, storing damaging flood waters for slow non-damaging releases, or to provide a constant annual yield of highly variable yearly flows.
In all these cases, large capital expenses are often incurred to construct a design based on a hydrologic regime assumed to be driven by historic climate condi- tions. However, should climate change, river runoff could be reduced or increased. In short, climate change could bring a departure from what has gener- ally been observed over previous decades. Both increases and decreases in river runoff imply changes in the hydrologic design conditions. In both cases, we will be able to adapt, but at what cost? Reduced flow will mean less supply and potential economic dam- ages. Increased flow may mean an under-designed reservoir or spillway with potential flood risk. These flood risks may be reduced by additional capital expenses or non-structural management, but both will have costs.
The main message is that climate change will impact the water resource systems of the world. Yes, we will be able to adapt, but at what economic, social and eco- logical costs? The problem is that the sensitivities, impacts, and costs are probably not uniformly distrib- uted across South America and appear to be highest in the southern countries.
2. HYDROLOGIC MODELING AND CLIMATE CHANGE
Todini (1988) states that hydrologic models generally consist of one of two components (or a combination of the two): a physical component that uses a priori knowledge of the physical system and a stochastic component which uses statistical terms to represent what can not be explained by the physical element. Hydrologic models are a class of mathematical models used to describe the response of watersheds to climatic inputs. Four classifications or methodologies for mod- eling hydrologic processes have been identified by Todini (1988). In increasing order of data needs these approaches can be identified as: stochastic models, lumped integral models, distributed integral models, and distributed differential models.
The stochastic modeling approach centers around developing relationships that describe an output vari- able like runoff in terms of input variables such as pre- cipitation and temperature, without a prescription of the physical processes that occur.
The lumped integral approach normally makes use of the fewest number of parameters that can describe the basin's response to climatological events. These models are designed to look at medium to large water- shed areas and are often referred to as 'water balance models'. These models are not usually applicable to event scale processes (daily or hourly precipitation events), but are normally used after uniformly lumping a sequence of events (precipitation and runoff) to monthly mean values. The catchment or subcatchment is modeled as a single, homogeneous unit subject to uniform events and parameters. Parameters for this model type usually are not meant to represent physical catchment characteristics.
Attention to spatial and temporal variations is un- doubtedly important, and applicability of the lumped model can be questioned for this reason. Over a large catchment saturated and unsaturated conditions exist simultaneously; near rivers and streams saturation conditions prevail while slopes and areas with certain soil types could never reach saturation. Most concep- tual models, whether lumped or distributed, usually operate on the assumption that soil water is evenly distributed over the whole area. This means that runoff will only occur when the ectire catchment reaches a certain level of saturation (Diimenil & Todini 1993).
The distributed integral model is the third model class. A catchment is sub-divided into sub-basins and spatial heterogenities are taken into account, giving a more realistic representation of the actual catchment. In this approach, all phenomena are represented at a subcatchment scale using empirical formulas or
Yates: Climate change impacts on South American water resources 149
2.1. Applied methodology: annual approaches
impulse responses of the subsystem. These Turc-Pike Model models attempt to maintain physical meaning 1.2 7-
Dooge (1992) suggests a fundamental theorem in hydrologic theory, the lumped form of the continuity equation (Eq. 1). When looking at the long-tern~ water balance of a large catchment or region, an appropriate assumption is that the change in storage can be assumed to be zero. Therefore the water balance equa- tion can be written as
to model parameters. This type of model is really an elaboration of the lumped integral I --
Given as annual long-term averages, P, is the precipi- tation, Et, is evapotranspiration, and Q, is basin runoff. Dooge (1992) points out that 'any estimate of the effect of climate change on water resources depends on the ability to relate changes in actual evapotranspiration to the predicted changes in precipitation and potential evapotranspiration.'
Here, annual average climatological values of pre- cipitation and temperature are used to derive point estimates of runoff using simple mathematical rela- tionships. The first annual model uses an expression developed by Turc (Kaczmarek 1991, 1993), who attempted to relate precipitation and temperature to runoff. A second annual model was given by Turc (1954) and Pike (1964) (Turc-Pike) which relates pre- cipitation, evapotranspiration, and potential evapo- transpiration to runoff (Dooge 1992). The annual models make use of this 'fundamental theorem' by
. . . . . . . . . . . . . . . . . . . . . . . . . Et = PET
2.2. Annual models: Turc and Turc-Pike
model. In all catchments, daily or time event based processes are undoubtedly very irnpor- 0.8 -- tant, and the distributed integral model is an attempt to characterize these processes. This type of model includes the Stanford, Sacra- mento, and U.S. National Weather Service models. However, accurate characterization of the parameters in these models is difficult Arid - Semi Arid - SavannaiHumid - Rainforest Tundra
(Todini 1988). The fourth and final model type is known as O ~ C T o = Z z - ? - ? ? = ? m - - - -
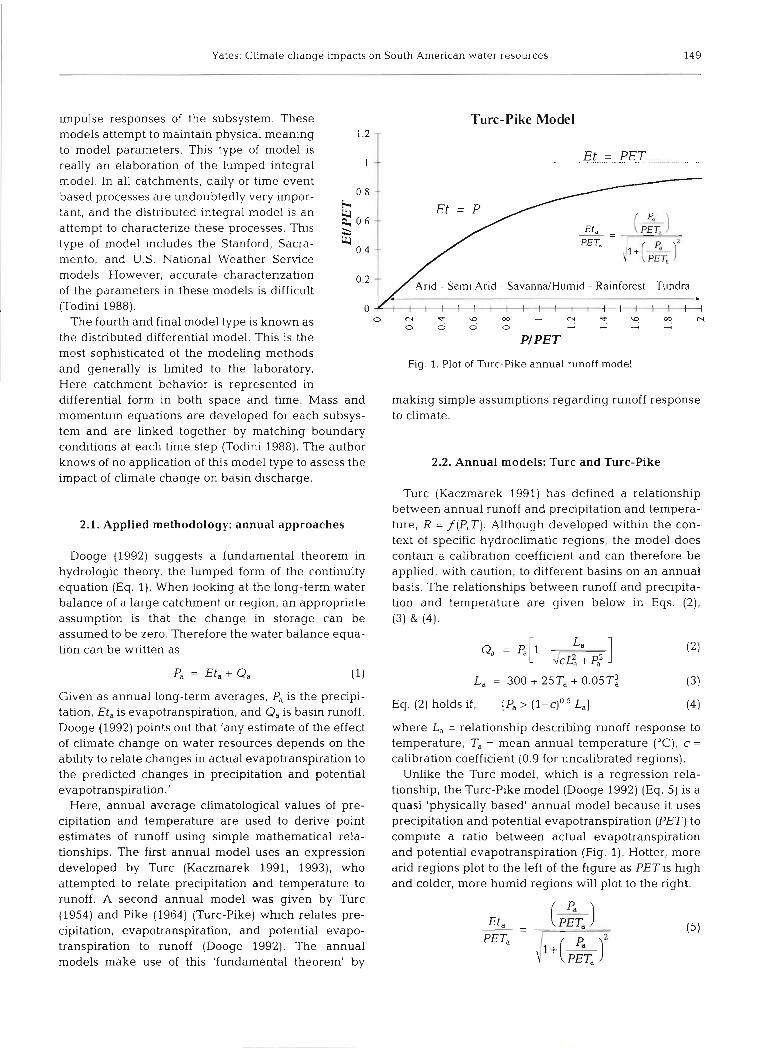
the distributed differential model. This is the PIPET most sophisticated of the modeling methods and generally is limited to the laboratory. Fig. 1. Plot of Turc-Pike annual runoff model
Here catchment behavior is represented in differential form in both space and time. Mass and making simple assumptions regarding runoff response momentum equations are developed for each subsys- to climate. tem and are linked together by matching boundary conditions at each time step (Todini 1988). The author knows of no application of this model type to assess the impact of climate change on basin discharge.
Turc (Kaczmarek 1991) has defined a relationship between annual runoff and precipitation and tempera- ture, R = f (P,T). Although developed within the con- text of specific hydroclimatic regions, the model does contain a calibration coefficient and can therefore be applied, with caution, to different basins on an annual basis. The relationships between runoff and precipita- tion and temperature are given below in Eqs. (2), (3 ) & (4) .
Eq. (2) holds if, [P, > ( l - ~ ) ~ . ~ L,]
where L, = relationship describing runoff response to temperature, Ta = mean annual temperature ("C), c = calibration coefficient (0.9 for uncalibrated regions).
Unlike the Turc model, which is a regression rela- tionship, the Turc-Pike model (Dooge 1992) (Eq. 5) is a quasi 'physically based' annual model because it uses precipitation and potential evapotranspiration (PET) to compute a ratio between actual evapotranspiration and potential evapotranspiration (Fig. 1). Hotter, more arid regions plot to the left of the figure as PET is high and colder, more humid regions will plot to the right.
Clim Res 9: 147-155, 1997
The difficulty in using this approach is the need to estimate PET. This work used an empirically based temperature model (Thornthwaite & Holzman 1939) to estimate annual PET (mm) on a 0.5" X 0.5" grid over South America. Mean monthly temperatures at 0.5" X
0.5" resolution were used to derive annual PET based on Eqs. (6) through (8).
10% PET,,, = 1.6N,(T).
I = xim = X(%) for m = 1, ..., 12 (7)
where PET, = monthly potential evapotranspiration (mm d-l), N,,, = average daily sunshine hours for each month m, and I,,, = average daily temperature ("C) for month m.
2.3. The South American analysis
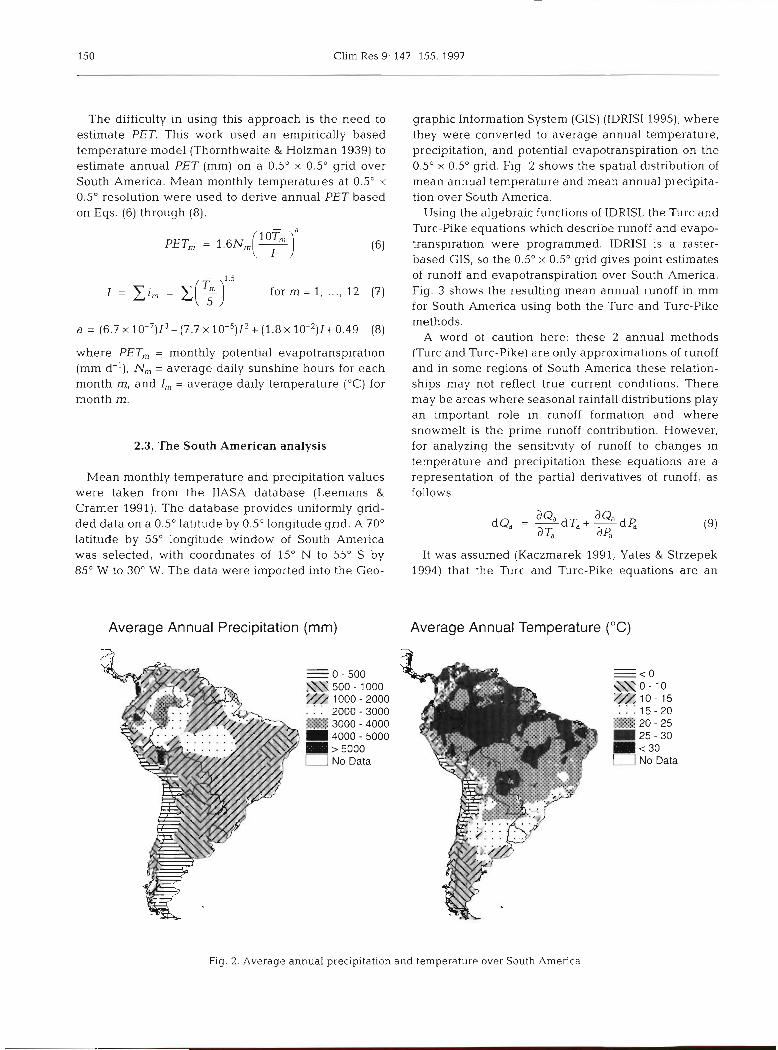
Mean monthly temperature and precipitation values were taken from the IIASA database (Leemans & Cramer 1991). The database provides uniformly grid- ded data on a 0.5" latitude by 0.5" longitude grid. A 70" latitude by 55" longitude window of South America was selected, with coordinates of 15" N to 55" S by 85' W to 30" W. The data were imported into the Geo-
Average Annual Precipitation (mm) -
graphic Information System (GIS) (IDRISI 1995), where they were converted to average annual temperature, precipitation, and potential evapotranspiration on the 0.5" X 0.5" grid. Fig. 2 shows the spatial distribution of mean annual temperature and mean annual precipita- tion over South America.
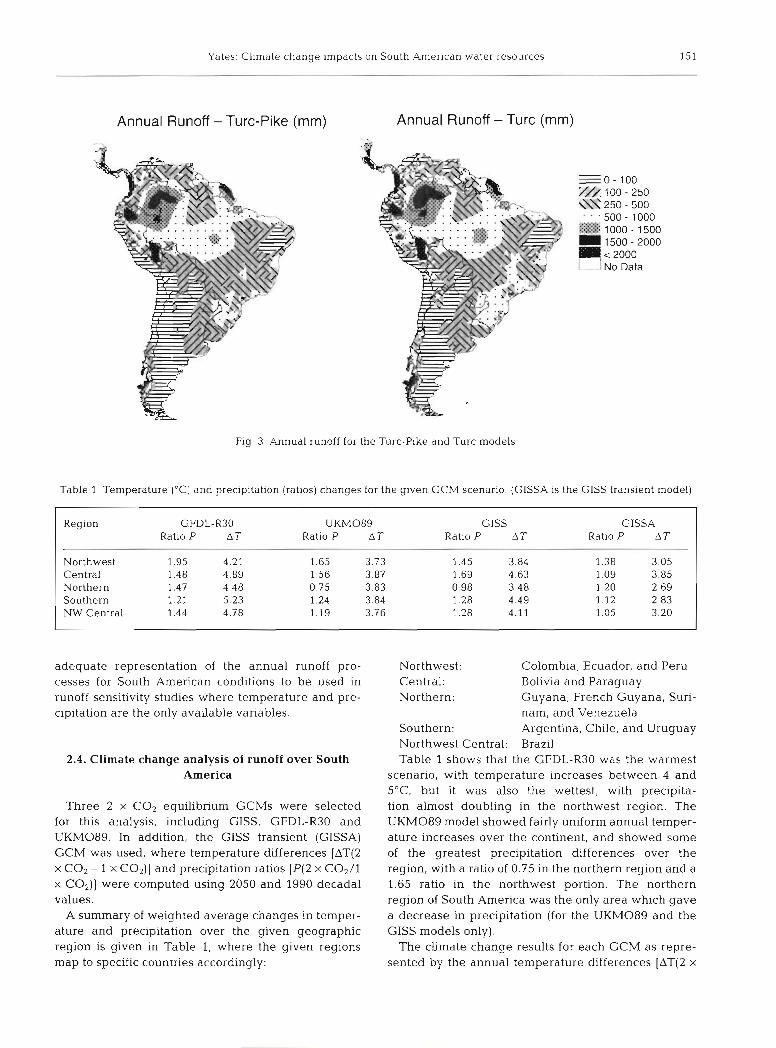
Using the algebraic functions of IDRISI, the Turc and Turc-Pike equations which describe runoff and evapo- transpiration were programmed. IDRISI is a raster- based GIS, so the 0.5" X 0.5" grid gives point estimates of runoff and evapotranspiration over South America. Fig. 3 shows the resulting mean annual runoff in mm for South America using both the Turc and Turc-Pike methods.
A word of caution here: these 2 annual methods (Turc and Turc-Pike) are only approximations of runoff and in some regions of South America these relation- ships may not reflect true current conditions. There may be areas where seasonal rainfall distributions play an important role in runoff formation and where snowmelt is the prime runoff contribution. However, for analyzing the sensitivity of runoff to changes in temperature and precipitation these equations are a representation of the partial derivatives of runoff, as follows:
It was assumed (Kaczmarek 1991, Yates & Strzepek 1994) that the Turc and Turc-Pike equations are an
- - - 0 - 500 m 500 - l000 g!!@# l000 - 2000 . . . . . . 2000 - 3000 m 3000 - 4000 8 4,0~~0i5000
No Data
Average Annual Temperature ("C) -
Fig. L. Average annual precipitation and temperature over South America
Yates: Climate change impacts on South American water resources 151
Annual Runoff - Turc-Pike (n
W
Annual Runoff - Turc (mm)
Fig. 3. Annual runoff for the Turc-Pike and Turc models
I - -1 No Data
Table 1 Temperature ("C) and precipitation (ratios) changes for the given GCM scenario. (GISSA is the GISS transient model)
Region GFDL-R30 Ratio P AT
Northwest 1.95 4.21 Central 1.48 4.89 Northern 1.47 4.48 Southern 1.21 5.23 NW Central 1.44 4.78
UKM089 Ratio P AT
GISS Ratio P AT
GISSA RatioP AT
1.38 3.05 1.09 3.85 1.20 2.69 1.12 2.83 1.05 3.20
adequate representation of the annual runoff pro- cesses for South American conditions to be used in runoff sensitivity studies where temperature and pre- cipitation are the only available variables.
2.4. Climate change analysis of runoff over South America
Three 2 X CO2 equilibrium GCMs were selected for this analysis, including GISS, GFDL-R30 and UKM089. In addition, the GISS transient (GISSA) GCM was used, where temperature differences [AT(2 X CO2 - 1 X CO2)] and precipitation ratios [P (2 X COz/l X COz)] were computed using 2050 and 1990 decadal values.
A summary of weighted average changes in temper- ature and precipitation over the given geographic region is given in Table 1, where the given regions map to specific countries accordingly:
Northwest: Colombia, Ecuador, and Peru Central: Bolivia and Paraguay Northern: Guyana, French Guyana, Suri-
nam, and Venezuela Southern: Argentina, Chile, and Uruguay Northwest Central: Brazil Table 1 shows that the GFDL-R30 was the warmest
scenario, with temperature increases between 4 and 5°C but it was also the wettest, with precipita- tion almost doubling in the northwest region. The UKM089 model showed fairly uniform annual temper- ature increases over the continent, and showed some of the greatest precipitation differences over the region, with a ratio of 0.75 in the northern region and a 1.65 ratio in the northwest portion. The northern region of South America was the only area which gave a decrease in precipitation (for the UKM089 and the GISS models only).
The climate change results for each GCM as repre- sented by the annual temperature differences [AT(2 X
152 Clim Res 9: 147-155, 1997
GFDL-R30 UKM089 GISS GISSA
Costa Rica 21.9 49.8 8.3 36.3 Nicaragua -6.8 17.2 3.7 39.2 Panama 34.9 78.6 2.1 32.2 Colombia 148.3 50.4 12.5 17.7 Venezuela 87.7 -62.6 -15.1 20.6 Ecuador 152.7 118.2 102.5 96.1 Peru 158.7 156.4 78.9 56.2 Bolivia 123.4 148.4 134.8 -17.2 Brazil 62.7 18.0 36.0 -10.3 Chile 18.6 -8.4 1.9 6.4 Argentina -3.9 32.6 26.0 7.6 Paraguay -27.9 86.1 67.0 12.1 Uruguay -7.2 59.3 0.7 0.5 Guyana 28.2 -50.6 -44.8 -8.5 Surinam 36.2 -71.1 -47.3 -10.3 French Guyana 37.3 -48.2 -46.0 -2.8
Table 3. National results for annual runoff sensitivity (%) for the Turc-Pike model
GFDL-R30 UKM089 GlSS GISSA
Costa Rica 33.8 51.0 17.1 44.7 Nicaragua 6 8 23.0 14.7 49.8 Panama 53 8 77.1 14.9 44.0 Colombia 174.2 54.0 24.3 26.9 Venezuela 117.1 -41.6 -1.0 33.5 Ecuador 183.6 119.7 123.0 112.4 Peru 188.7 149.5 98.9 70.4 Bolivia 186.5 151.2 201.6 2.9 Brazil 94.7 29.7 60.0 3.8 Chile 30.2 -4.2 5.6 12.4 Argentina 31.4 40.8 68.0 32.4 Paraguay 4.2 43.7 108.8 32.9 Uruguay 25.8 65.2 25.0 14.5 Guyana 55.5 -35.3 -28.0 5.8 Surinam 62.7 -50.0 -32.6 3.0 French Guyana 53.7 -36.0 -39.4 4.9
CO2 - 1 X CO2)] and the annual precipitation ratios of [P(2 X C 0 2 / l X CO2)] were entered into the GIS system and interpolated to the 0.5' X 0.5" grid. To develop each climate scenario, the GCM tem- perature change was added to the cur-
Table 2. National results for annual runoff sensitivity (%) for derive a new precipitation image for each GCM-based the Turc model scenario.
With these precipitation and temperature or poten- tial evapotranspiration scenarios, based on the respec- tive GCM output, the Turc and Turc-Pike models were used to calculate, for each grid cell, annual runoff in millimeters. The runoff calculated for each GCM was divided by the runoff calculated using the current cli- mate image to produce a 0.5" X 0.5" grid of relative runoff changes for each GCM. Aggregated results (averaged over the grid cells) on a national basis are presented for each GCM for the Turc and Turc-Pike models in Tables 2 & 3. Tables 4 & 5 are regional changes in runoff based on the country mapping given above. The results for both the Turc and Turc-Pike models are also presented in Figs. 4, 5, 6 & 7 for the GFDL-R30, UKM089, GISS, and GISS transient mod- els. respectively.
Three of the four GCMs (GISS, GISS transient and UKM089) showed decreases in runoff over the north- ern countries of South America (Guyana, Surinam and French Guyana) with the Turc model (Table 2), while the Turc-Pike model gave decreases in runoff for these countries for two GCMs (GISS and UKM089) (Table 3). Three countries (Colombia, Ecuador and Peru) showed increased runoff under all scenarios and both models, while the remaining countries gave both increases and decreases depending on the GCM sce- nario and annual model-either Turc or Turc-Pike.
Regional results are presented in Tables 4 & 5. These results were generated by averaging country level changes over the given regions according to the asso- ciations shown earlier in this section. The results show that, on a continental scale, South America has a fairly significant increase in runoff for many regions under several of the GCM scenarios.
The Turc model showed greater sensitivity to in- creased temperatures, giving smaller (larger) in- creases (decreases) in runoff with increasing (decreas- ing) precipitation (see tables). The GISS transient model suggested moderate decreases in the central regions of South America for the Turc model and slight increases using the Turc-Pike model. Where increases
rent temperature for each grid cell for the Turc method. For the Turc-Pike method, PET was computed using the Thornthwaite method based on tem- perature. It was assumed each 1°C increase led to a 3.5 % increase in PET (Nemec & Shaake 1982). For both Turc-Pike and Turc, the GCM precipi- tation ratio was multiplied by the cur- rent precipitation in each grid cell to
Table 4. Annual change (%) in regional runoff over South America for the Turc model
Region % land GFDL-R30 UKM089 GISS GISSA
Northwest 15.3 153.2 102.6 49.6 41.6 Central 8.4 82.1 131.4 116.3 -9.2 Northern 7.6 67.0 -59.7 -27.1 10.1 Southern 20.7 6.6 15.3 12.4 6.4 NW Central 48.0 62.7 18.0 36.0 -10.3
Yates: Climate change impacts on South American water resources 153
Table 5. Annual change (%) in regional runoff over South America for the Turc-Pike model
3. CONCLUSIONS
The results of this analysis are a
1 NW Central
Region % land GFDL-R30 UKM089 GISS GISSA
Northwest 15.3 181.2 122.8 64.9 53.1 130.8 Central 8.4 187.3 173.3 12.1
Northern 7.6 93.3 -49.1 -14.1 22.1 Southern 20.7 30.3 35.6 33.7 21.0
in runoff were observed, the Turc-Pike model consis- tently gave larger increases in runoff and where decreases in runoff were computed Turc-Pike gave more moderate decreases.
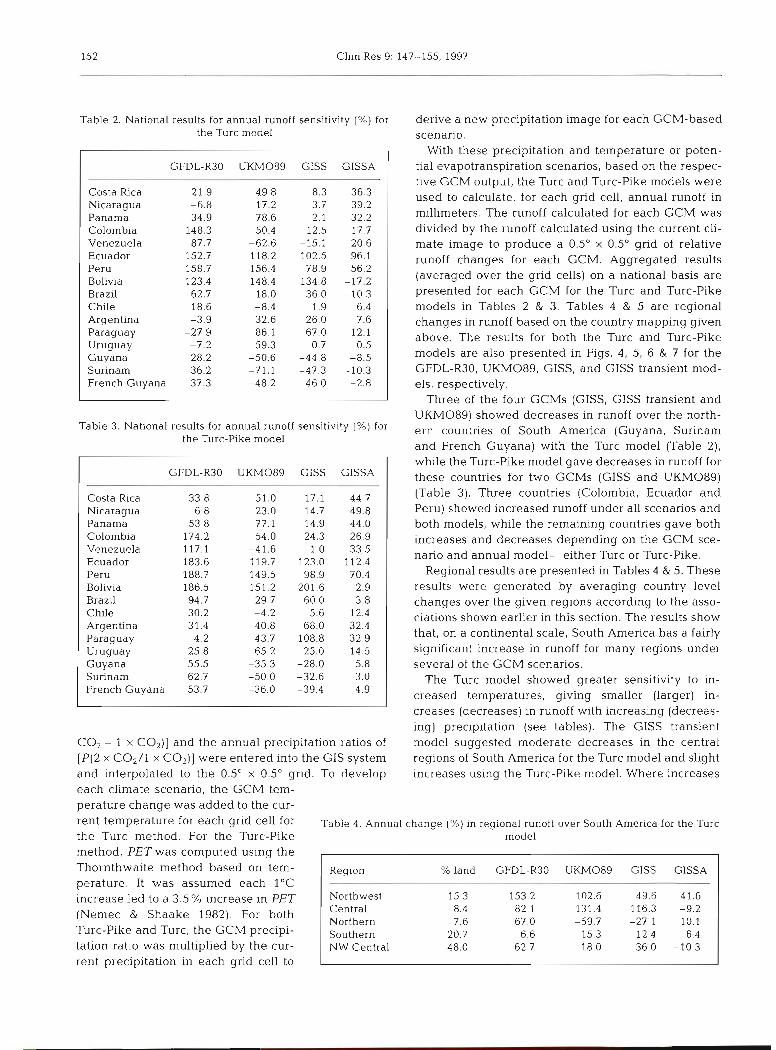
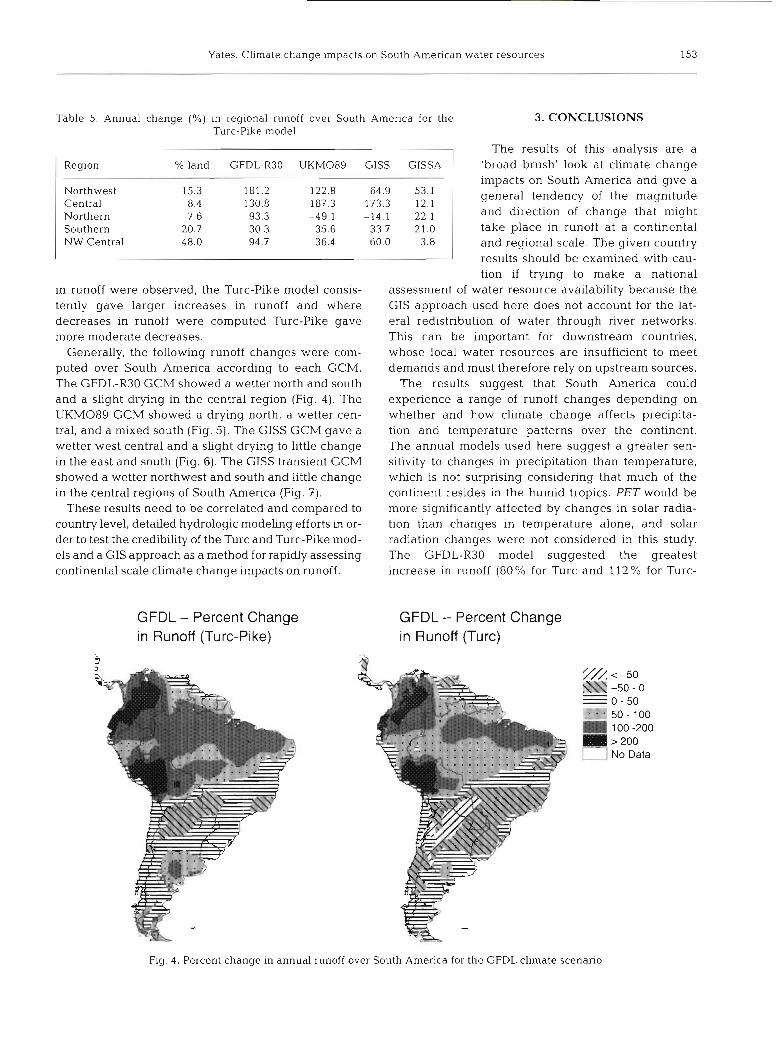
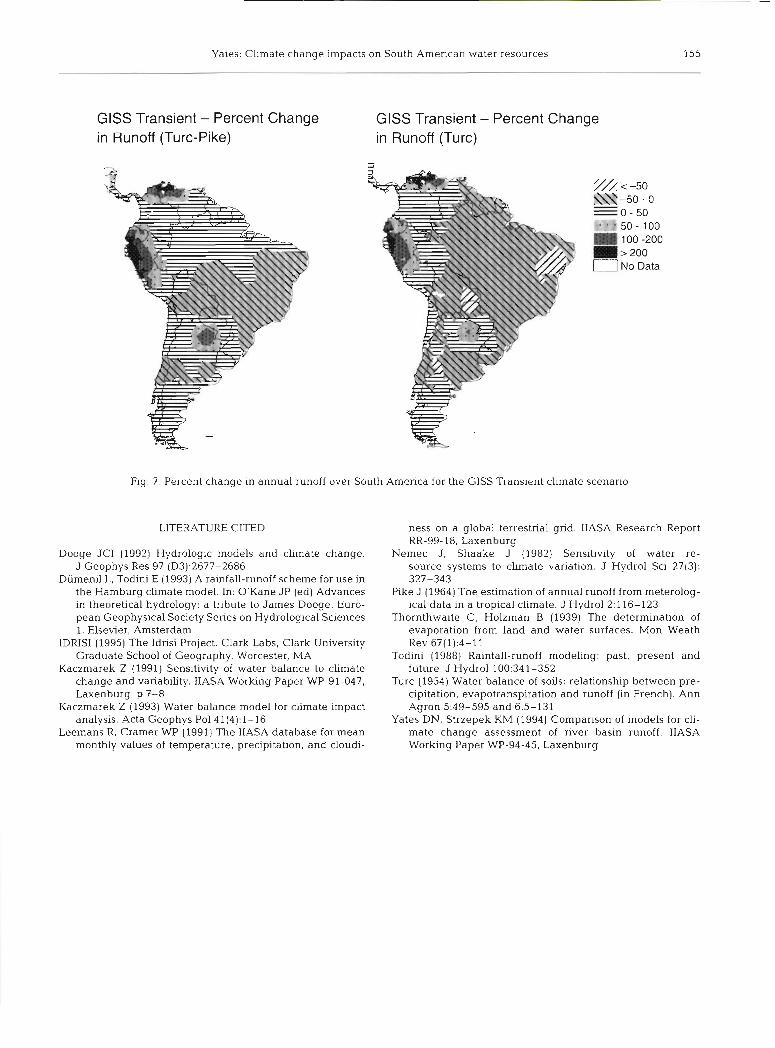
Generally, the following runoff changes were com- puted over South America according to each GCM. The GFDL-R30 GCM showed a wetter north and south and a slight drying in the central region (Fig. 4 ) . The UKM089 GCM showed a drying north, a wetter cen- tral, and a mixed south (Fig. 5). The GISS GCM gave a wetter west central and a slight drying to little change in the east and south (Fig. 6 ) . The GISS transient GCM showed a wetter northwest and south and little change in the central regions of South America (Fig. 7).
These results need to be correlated and compared to country level, detailed hydrologic modeling efforts in or- der to test the credibility of the Turc and Turc-Pike mod- els and a GIS approach as a method for rapidly assessing continental scale climate change impacts on runoff.
'broad brush' look at climate change impacts on South America and give a general tendency of the magnitude and direction of change that might take place in runoff at a continental
GFDL - Percent Change in Runoff (Turc-Pike)
and regional scale. The given country 3 results should be examined with cau- tion if trying to make a national
assessment of water resource availability because the GIS approach used here does not account for the lat- eral redistribution of water through river networks. This can be important for downstream countries, whose local water resources are insufficient to meet demands and must therefore rely on upstream sources.
The results suggest that South America could experience a range of runoff changes depending on whether and how climate change affects precipita- tion and temperature patterns over the continent. The annual models used here suggest a greater sen- sitivity to changes in precipitation than temperature, which is not surprising considering that much of the continent resides in the humid tropics. PET would be more significantly affected by changes in solar radia- tion than changes in temperature alone, and solar radiation changes were not considered in this study. The GFDL-R30 model suggested the greatest increase in runoff (80 % for Turc and 112 % for Turc-
GFDL - Percent Change in Runoff (Turc)
y& -50 m -50 - 0 - 0 - 5 0
5 0 - 100 100 -200 > 200
U No Data
Fig. 4. Percent change in annual runoff over South America for the GFDL climate scenario
154 Clim Res 9: 147-155, 1997
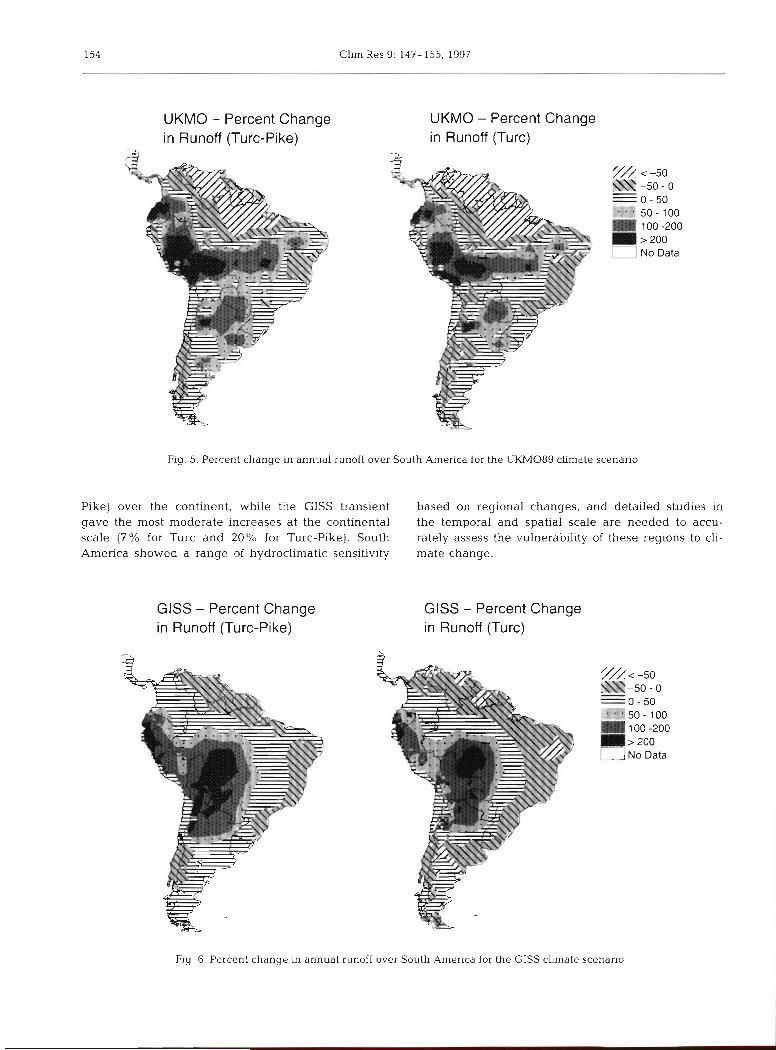
UKMO - Percent Change in Runoff (Turc-Pike)
UKMO - Percent Change in Runoff (Turc)
1- _] No Data
Fig. 5. Percent change in annual runoff over South America for the UKM089 climate scenario
Pike) over the continent, while the GISS transient based on regional changes, and detailed studies in gave the most moderate increases at the continental the temporal and spatial scale are needed to accu- scale (7% for Turc and 20% for Turc-Pike). South rately assess the vulnerability of these regions to cli- America showed a range of hydroclimatic sensitivity mate change.
GISS - Percent Change in Runoff (Turc-Pike)
GISS - Percent Change in Runoff (Turc)
y// C -50 - 5 0 - 0 - 0 - 5 0 5 0 - 100
100 -200 > 200 No Data
Fig. 6. Percent change in annual runoff over South America for the GISS climate scenario
Yates: Climate change impacts on South American water resources
GISS Transient - Percent Change in Runoff (Turc-Pike)
GISS Transient - Percent Change in Runoff (Turc)
1 1 No Data
Fig. 7. Percent change in annual runoff over South America for the GISS Transient climate scenario
LITERATURE CITED
Dooge JCI (1992) Hydrologic models and climate change. J Geophys Res 97 (D3):2677-2686
Diimenil L, Todini E (1993) A rainfall-runoff scheme for use in the Hamburg climate model. In: O'Kane JP (ed) Advances in theoretical hydrology: a tribute to James Dooge. Euro- pean Geophysical Society Series on Hydrological Sciences 1. Elsevier, Amsterdam
IDRISI (1995) The Idrisi Project. Clark Labs, Clark University Graduate School of Geography, Worcester, MA
Kaczmarek Z (1991) Sensitivity of water balance to climate change and variability. IIASA Working Paper WP-91-047, Laxenburg, p 7-8
Icaczmarek Z (1993) Water balance model for climate impact analysis. Acta Geophys Pol 41(4):1-16
Leemans R, Cramer WP (1991) The IIASA database for mean monthly values of temperature, precipitation, and cloudi-
ness on a global terrestrial grid. IIASA Research Report RR-99-18, Laxenburg
Nemec J , Shaake J (1982) Sensitivity of water re- source systems to climate variation. J Hydrol Sci 27(3): 327-343
Pike J (1964) The estimation of annual runoff from meterolog- ical data in a tropical climate. J Hydrol 2:116-123
Thornthwaite C , Holzman B (1939) The determination of evaporation from land and water surfaces. Mon Weath Rev 67(1):4-11
Todini (1988) Rainfall-runoff modeling: past, present and future. J Hydrol 100:341-352
Turc (1954) Water balance of soils: relationship between pre- cipitation, evapotranspiration and runoff (in French). Ann Agron 549-595 and 6:5-131
Yates DN, Strzepek KM (1994) Comparison of models for cli- mate change assessment of nver basin runoff. IIASA Working Paper WP-94-45, Laxenburg