Embed Size (px)
Citation preview

Climate change and soil C sequestration potential in
south-east Asia
K.R. Islam, Y. Raut, R. Shrestha, and R. Lal
State University


Several Arabian scientists (such as al-Razi, Ali b. Ridhwan, Ya‘qub al-Israili, and Ibn al-Nafis) dating back from 9th to 13th century addressed environmental pollution especially air and water contamination by human activities.
ttp://www.muslimheritage.com/

Squeezing earth for resources to emit C, N, and S based gases:
Carbon dioxide, methane, sulfur dioxide, nitrogen oxides, ammonia, smoke, etc.

http://www.worldviewofglobalwarming.org/


Loss of SOM as CO2

Total CO2 emissions ranking1/2 China/USA
4 India
34 Pakistan
67 Bangladesh
88 Sri Lanka
126 Nepal
162 Maldives
163 Afghanistan
175 Bhutan
(CDIAC 2008)

Per capita CO2 emissions (metric ton)1 Qatar 21.6
9 USA 5.6
109 Maldives 0.7
129 India 0.34
152 Pakistan 0.23
161 Sri-Lanka 0.16
175 Bangladesh 0.07
182 Bhutan 0.05
193 Nepal 0.03
205 Afghanistan 0.01
(CDIAC 2008)

Change in CO2 emission over time…_________________________________________Country 1972 2004 Change
_____ (M Mg) ______ (%)____________________________________________________________________________________________________________
Global 54999 98870 80Afghanistan 0.52 0.24 -54Bangladesh 1.16 12.7 995Bhutan 0.001 0.14 11200India 73.7 457.9 521Maldives 0.001 0.25 19500Nepal 0.09 0.10 14Pakistan 6.42 42.9 568Sri Lanka 1.17 3.93 235Total 83.1 518.1 524
(CDIAC 2008)

Global warming potentials___________________________________________Tropospheric Lifetime Global warmingGases (years) potential___________________________________________Carbon dioxide 50-200 1Methane 9-15 21Nitrous oxide 120 310CFC’s 1.5 - 264 140 - 11700___________________________________________
Fossil fuel emissions ~ 6.3 billion ton CO2/yrLand-use & deforestation ~ 1.9 billion ton CO2/yr
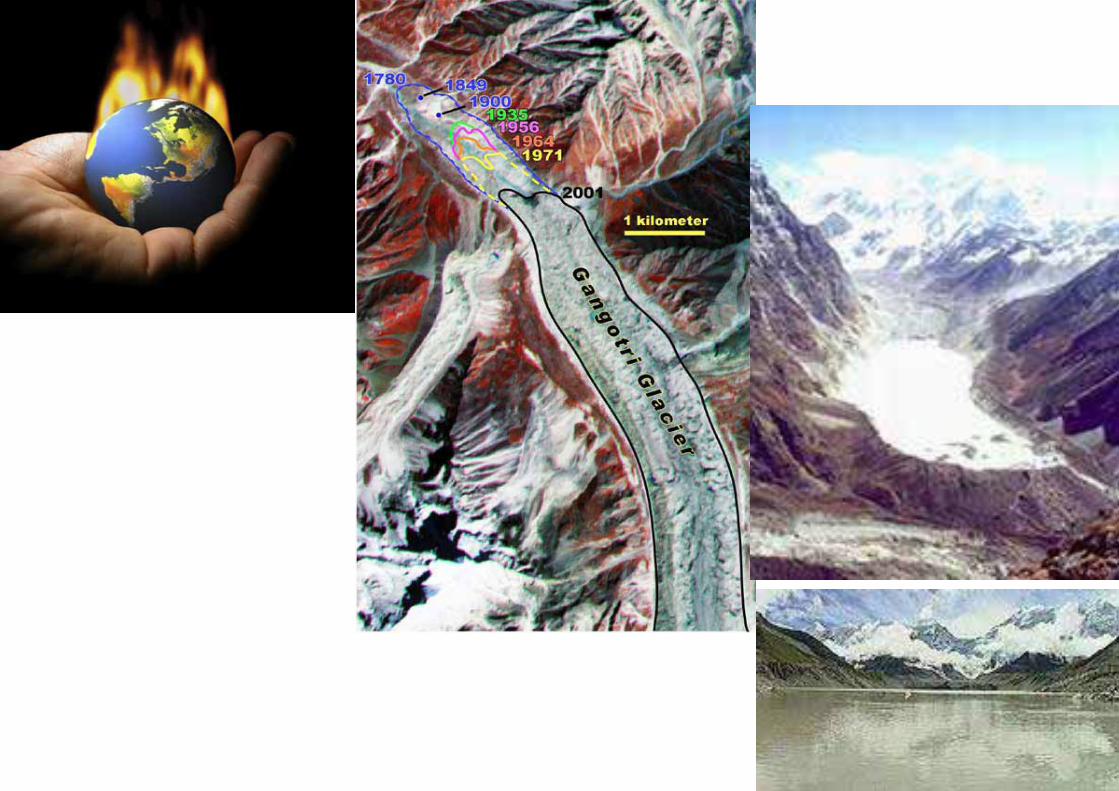

Evidence of climate change isundeniable
Climate change will affect every components and production system on earth
for Solutions

All the atmospheric CO2 ~ only 40% of the soil’s C holding capacity (Wallace 1984)

31.632.536.5Sri Lanka61.14.532.6Pakistan30.740.229.5Nepal70.03.326.7Maldives16.123.060.8India23.666.011.6Bhutan18.414.569.3Bangladesh39.12.658.3Afghanistan
__________(%)__________landsareaareaOtherForestedAgric.Country
Land use in South East Asia……

6.815.514.2Sri Lanka6.50.925.2Pakistan
12.10.916.5Nepal3.330.013.3Maldives3.73.154.0India8.80.42.3Bhutan4.63.461.3Bangladesh
46.00.212.1Afghanistan___________ (%) __________
landcropslandPasturePermanentArableCountry
Land use in South east Asia……


What to do?

•Increase in photosynthesis•Maximize water/nutrient use efficiency•Improve plant growth ~40%
~10 - 60%↑ in shoot production
~ 60 - 140%↑ in root production
Since plants are the primary receptors of CO2, any increase in [CO2] will have positive effects on plants:
Mulchi and Islam (2002)

No-Tillage +
Cover Crop
Re-aggregation
Cover + Crop roots
Continuous C flux
Active “Pool”Slow “Pool”Passive “Pool”
New Steady State
Continuous porosity
Natural Vegetation
Litter + roots
Active “Pool”Slow “Pool”Passive “Pool”
Continuous porosity
SteadyState
Aggregates
Forming
Continuous C flux
Conventional Tillage
Aeration + mix to Crop
Residue
Active MCB and high CO2 flux
Structure disrupted
InstableSOM Losses
Basic differences among land management systems

Conventional tillage to No-till: Bangladesh
In NT system, 30% residues left annually which is equivalent to 0.6 t/ha/yr. If crop residue decomposition is 0.25 then soil C content will be
> (0.6*0.75)*(58/100) -> 260 kg/ha/yr
If r (0.25) is the soil C that left in the 2nd yr after the decomposition of the soil C formed in the 1st yr, then the soil C sequestration after 10 yr will be
Y = soil C * (1 - rn)/(1 - r)
Y = 0.26*(1- 0.7510)/(1- 0.75) > 950 kg/ha

Land useWoodland Rangeland Farmland
C s
eque
stra
tion
(kg
ha-1
yr-
1 )
0
20
40
60
80
100
120
140
160
180
Afghanistan (Khan and Lal 2007)

Soil depth (cm)0-15 15-30 30-45 45-60
Tota
l C (M
g ha
-1)
0
5
10
15
20
25
30
Protected forest (2000) Initial (1982) Degraded forest (2000)
Natural forest Reforested Grassland Cultivated
Tota
l C (M
g ha
-1)
0
2
4
6
8
10
12
14
Bangladesh (Islam and Weil 2000)
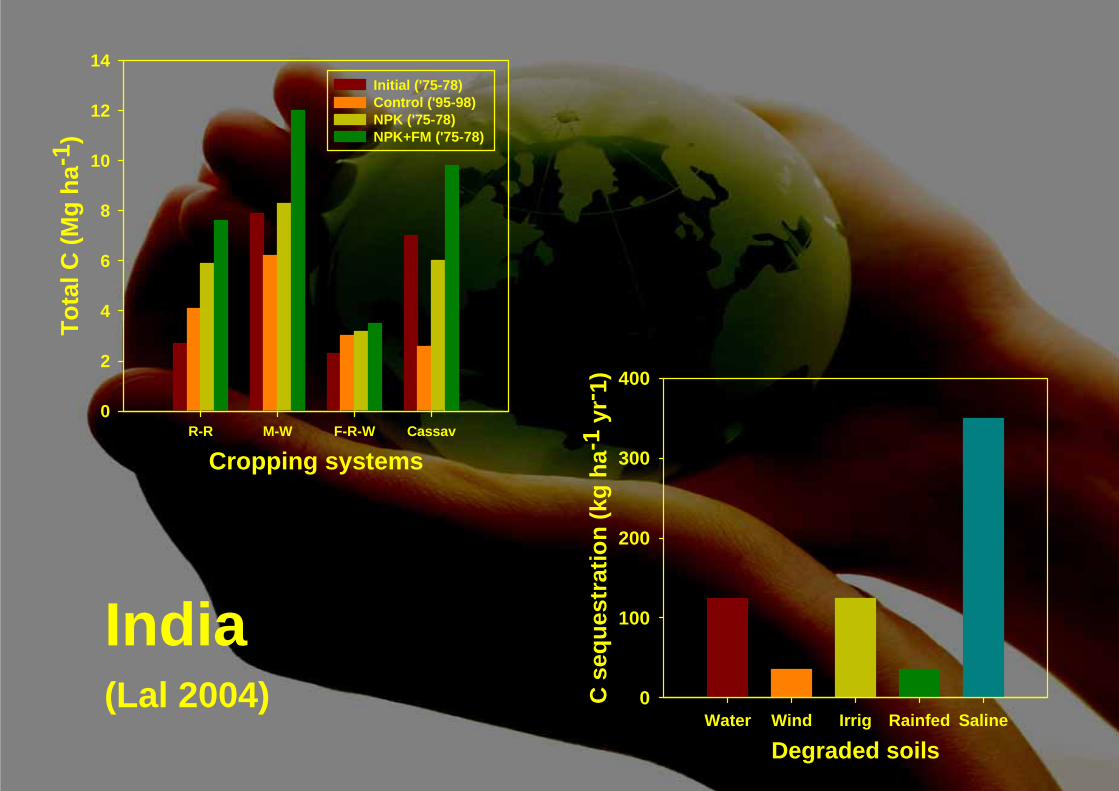
Cropping systemsR-R M-W F-R-W Cassav
Tota
l C (M
g ha
-1)
0
2
4
6
8
10
12
14Initial ('75-78) Control ('95-98) NPK ('75-78) NPK+FM ('75-78)
Degraded soilsWater Wind Irrig Rainfed Saline
C s
eque
stra
tion
(kg
ha-1
yr-
1)
0
100
200
300
400
India(Lal 2004)
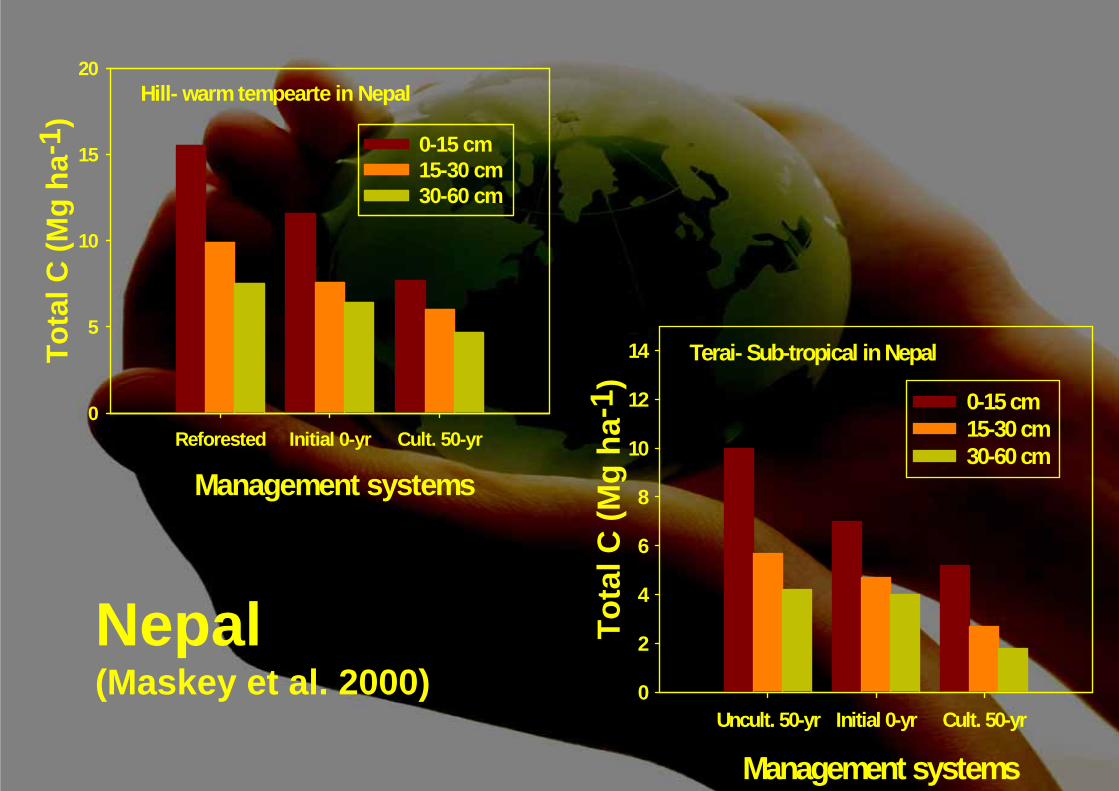
Management systemsReforested Initial 0-yr Cult. 50-yr
Tota
l C (M
g ha
-1)
0
5
10
15
20
0-15 cm 15-30 cm 30-60 cm
Hill- warm tempearte in Nepal
Management systemsUncult. 50-yr Initial 0-yr Cult. 50-yr
Tota
l C (M
g ha
-1)
0
2
4
6
8
10
12
14
0-15 cm 15-30 cm 30-60 cm
Terai- Sub-tropical in Nepal
Nepal(Maskey et al. 2000)

Time (year)0 2 4 6
Tota
l C (M
g ha
-1)
0
20
40
60
80
C sequestration = 9.3 Mg ha-1 y-1
N fertilization (kg ha-1)0 20 40 60 80 100C
seq
uest
ratio
n (k
g ha
-1 y
r-1 )
0
100
200
300
400
500
600
700
Farm manure Crop residue Mung bean
Pakistan(Khan and Lal 2005)

Afg
hani
stan
Ban
glad
esh
Bhu
tan
Indi
a
Mal
dive
s
Nep
al
Paki
stan
Sri L
anka
C s
eque
stra
tion
(kg
ha-1
yr-
1)
0
100
200
300
400
500
600
Lal 2004

Afg
hani
stan
Ban
glad
esh
Bhu
tan
Indi
a
Mal
dive
s
Nep
al
Paki
stan
Sri L
anka
Tota
l
Tota
l pot
entia
l (Tg
C)
0
5
10
15
20
Lal 2004
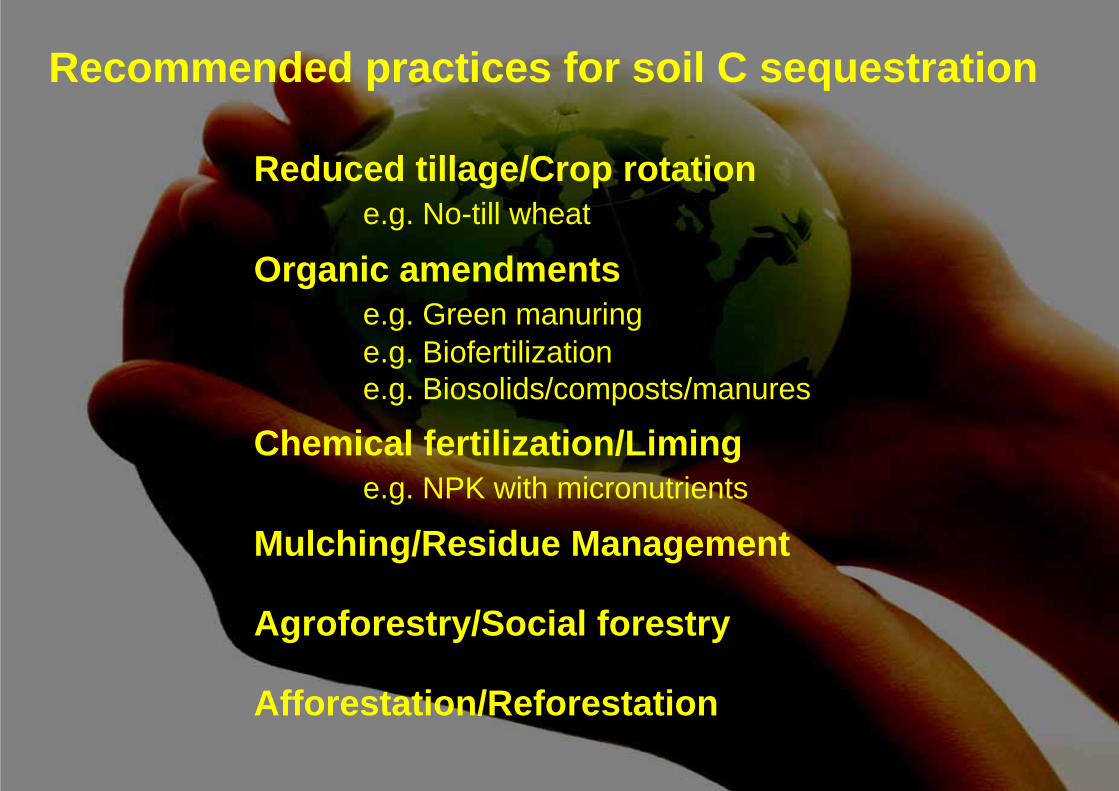
Recommended practices for soil C sequestration
Reduced tillage/Crop rotatione.g. No-till wheat
Organic amendmentse.g. Green manuringe.g. Biofertilizatione.g. Biosolids/composts/manures
Chemical fertilization/Liminge.g. NPK with micronutrients
Mulching/Residue Management
Agroforestry/Social forestry
Afforestation/Reforestation

Climate ChangeSong or Cry!
Who Cares?


![Tuhfat Al-Nafis[VirginiaMatheson]1997.pdf](https://img.pdfslide.us/doc/110x75/56d6c0181a28ab301698ebd0/tuhfat-al-nafisvirginiamatheson1997pdf.jpg)