Embed Size (px)
Citation preview
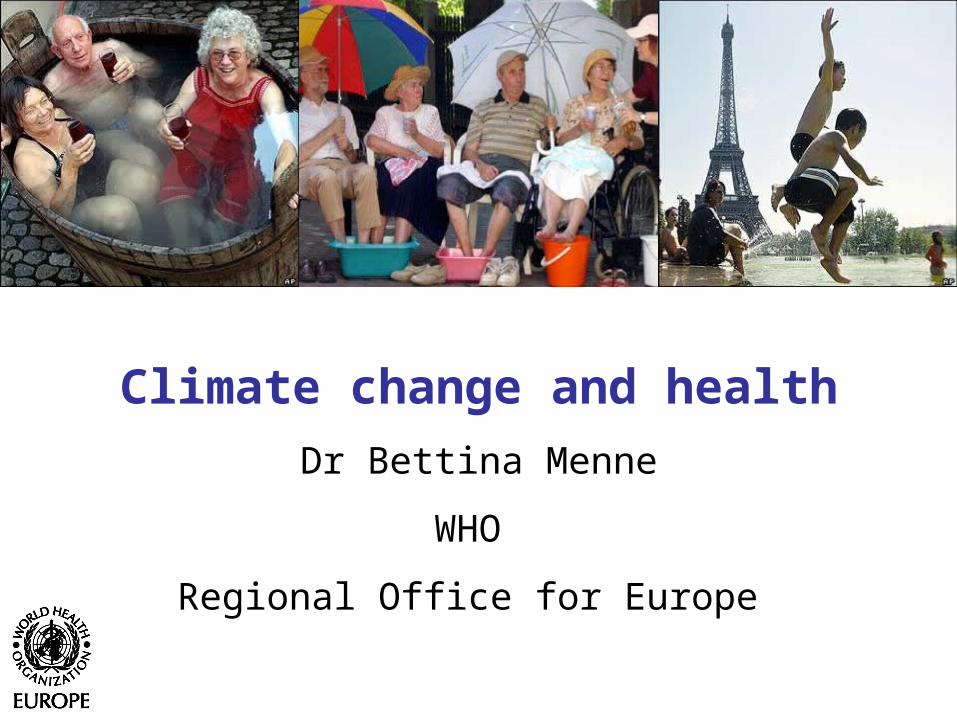
Climate change and health
Dr Bettina Menne
WHO
Regional Office for Europe
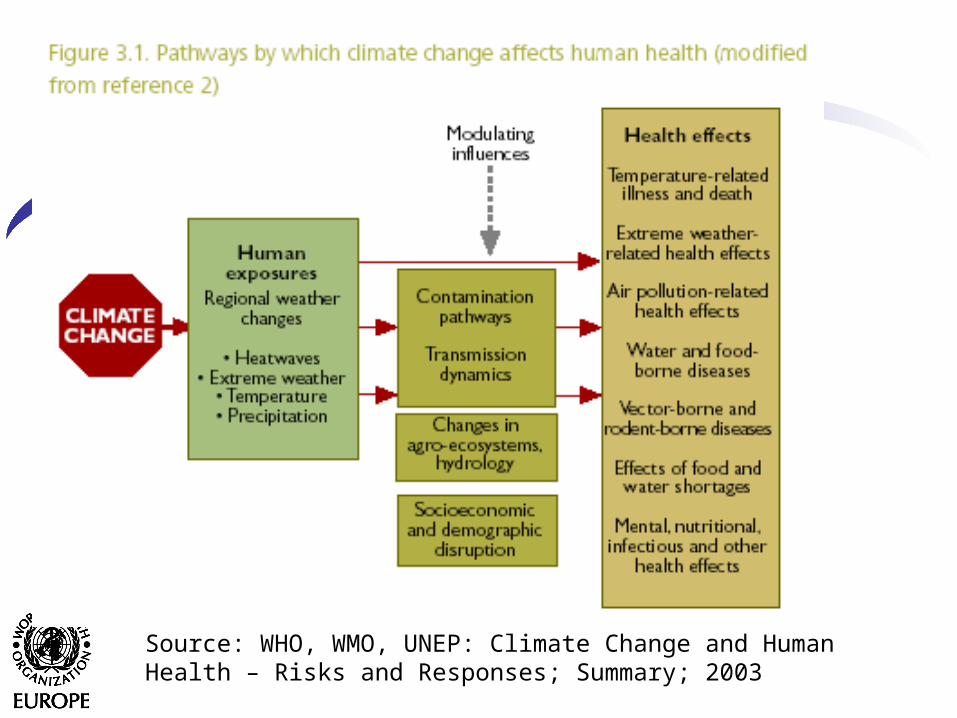
Source: WHO, WMO, UNEP: Climate Change and Human Health – Risks and Responses; Summary; 2003
Content
• What are the observed climatic changes?
• Has population health been affected?
• What are future potential changes,
• and How could health be affected?
• What actions are needed?
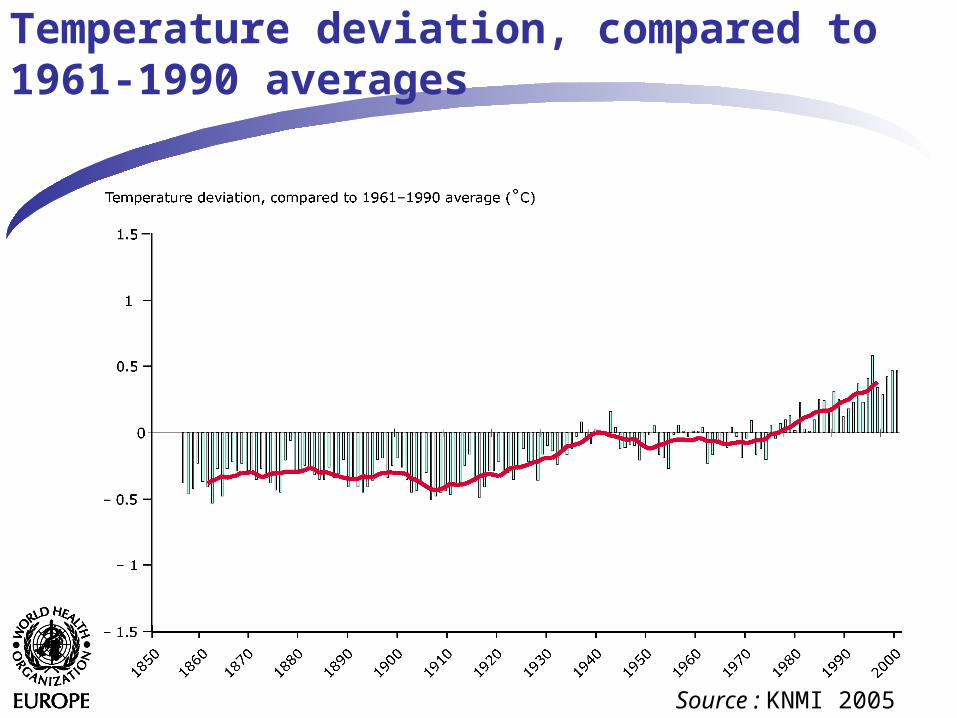
Source : KNMI 2005
Temperature deviation, compared to 1961-1990 averages
Source : KNMI 2005
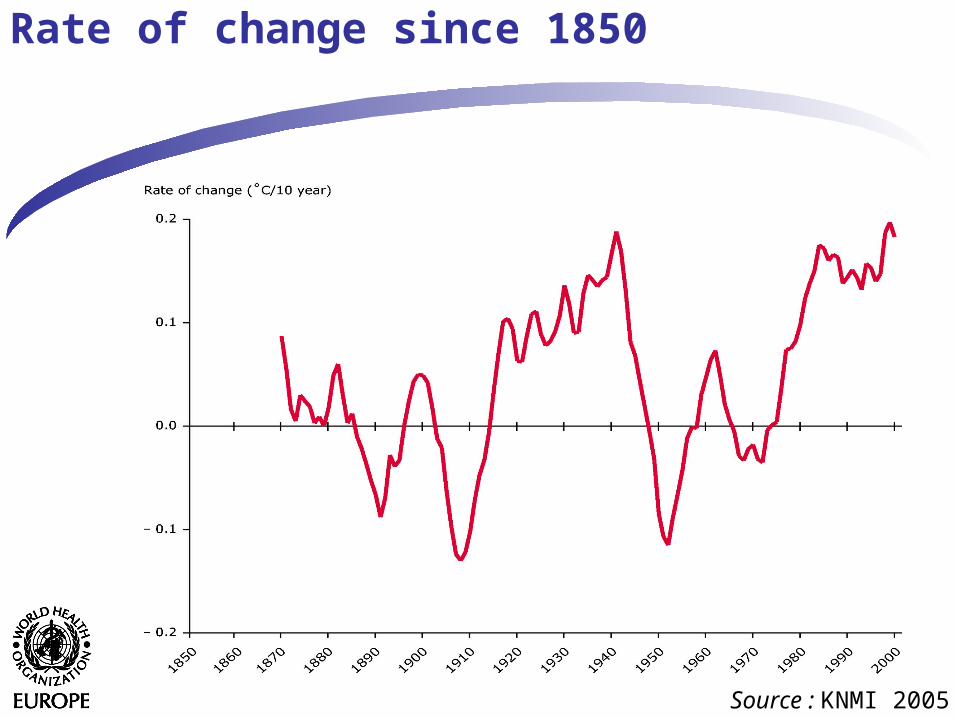
Rate of change since 1850
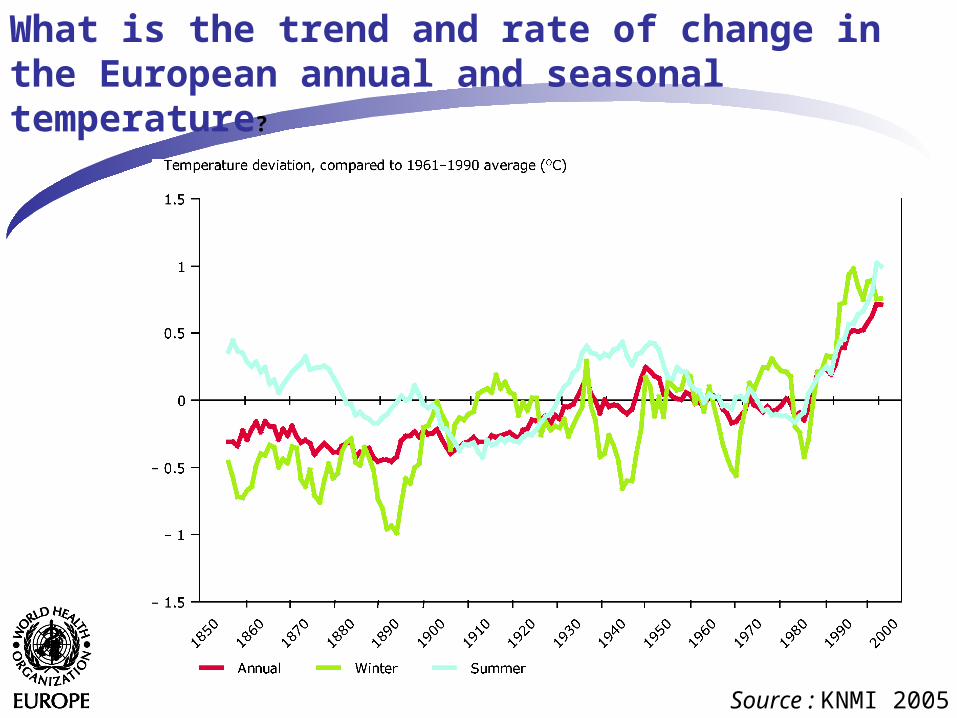
What is the trend and rate of change in the European annual and seasonal temperature?
Source : KNMI 2005
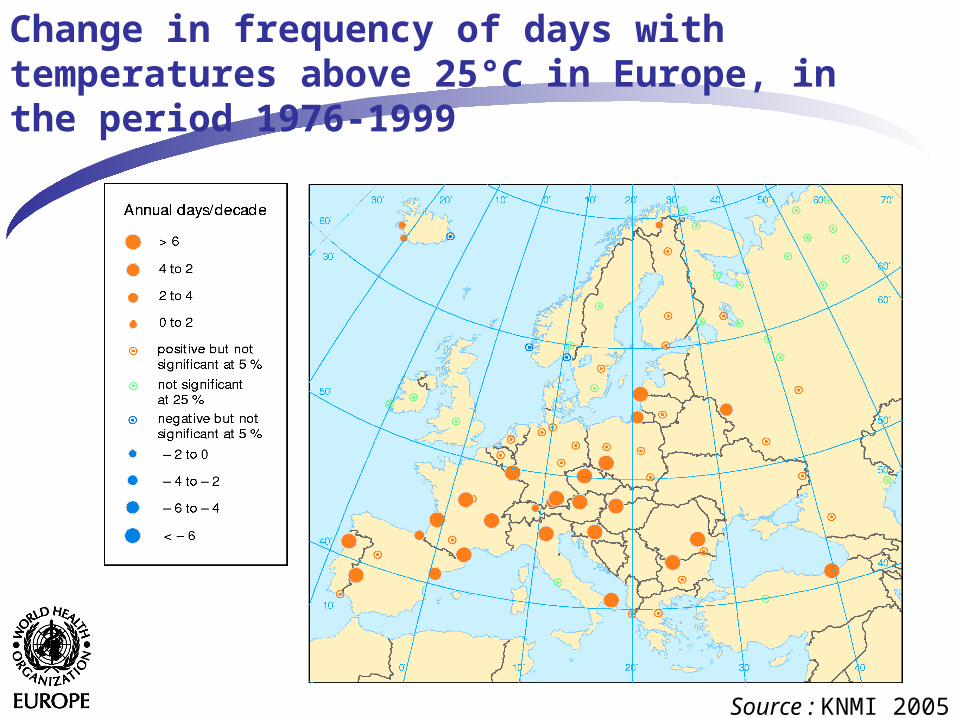
Change in frequency of days with temperatures above 25°C in Europe, in the period 1976-1999
Source : KNMI 2005
Year
210
Le
ngth
(d
ays
) 200
190
180
170160
150
1401890 1900 1910 1920 1930 1940 1950 1960 1970 1980 1990
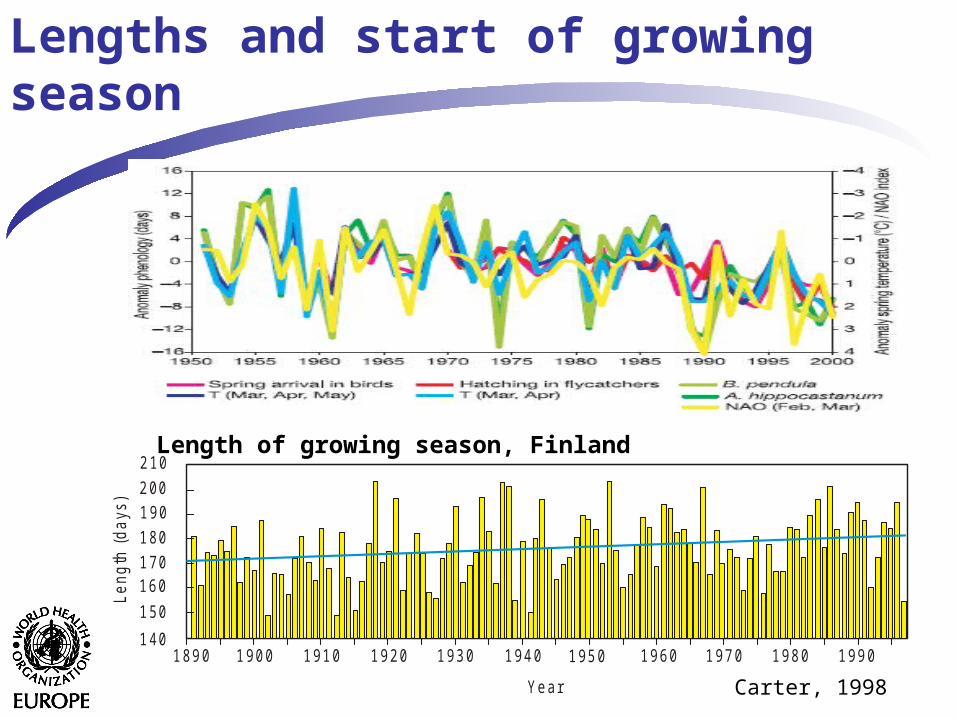
Lengths and start of growing season
Length of growing season, Finland
Carter, 1998
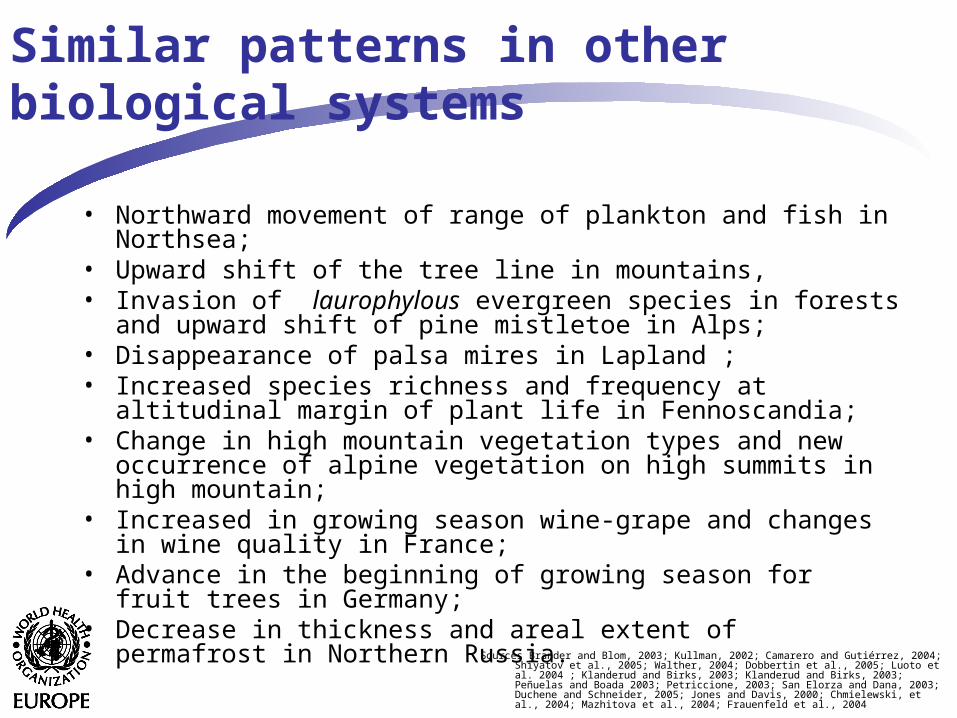
Similar patterns in other biological systems
• Northward movement of range of plankton and fish in Northsea;• Upward shift of the tree line in mountains, • Invasion of laurophylous evergreen species in forests and
upward shift of pine mistletoe in Alps;• Disappearance of palsa mires in Lapland ; • Increased species richness and frequency at altitudinal margin of
plant life in Fennoscandia; • Change in high mountain vegetation types and new occurrence of
alpine vegetation on high summits in high mountain;• Increased in growing season wine-grape and changes in wine
quality in France;• Advance in the beginning of growing season for fruit trees in
Germany;• Decrease in thickness and areal extent of permafrost in Northern
Russia.Sources Brander and Blom, 2003; Kullman, 2002; Camarero and Gutiérrez, 2004;
Shiyatov et al., 2005; Walther, 2004; Dobbertin et al., 2005; Luoto et al. 2004 ; Klanderud and Birks, 2003; Klanderud and Birks, 2003; Peñuelas and Boada 2003; Petriccione, 2003; San Elorza and Dana, 2003; Duchene and Schneider, 2005; Jones and Davis, 2000; Chmielewski, et al., 2004; Mazhitova et al., 2004; Frauenfeld et al., 2004
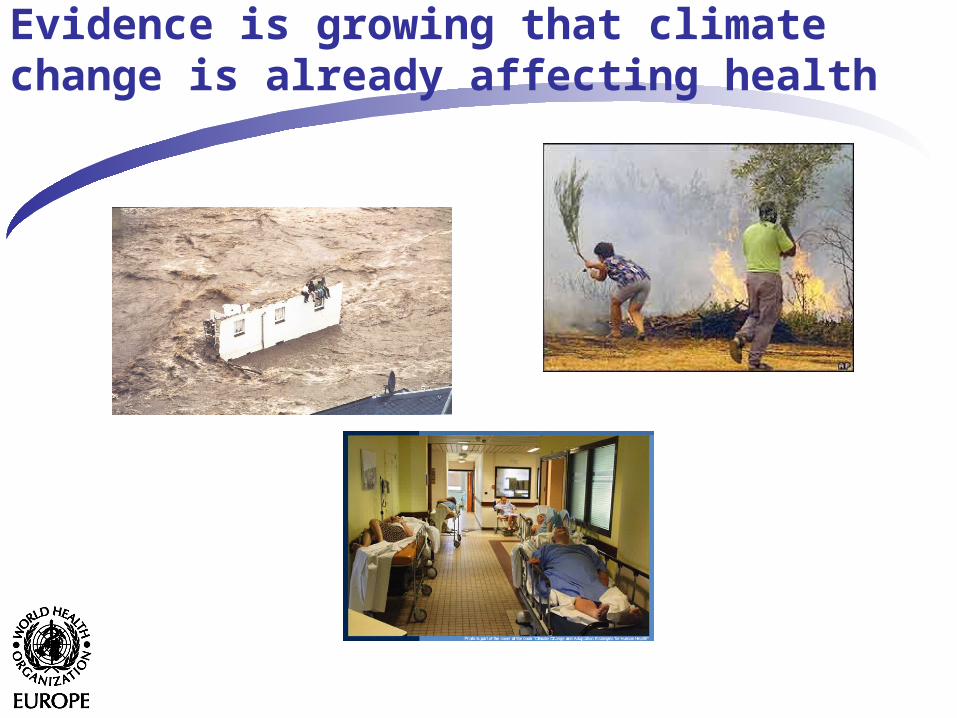
Evidence is growing that climate change is already affecting health
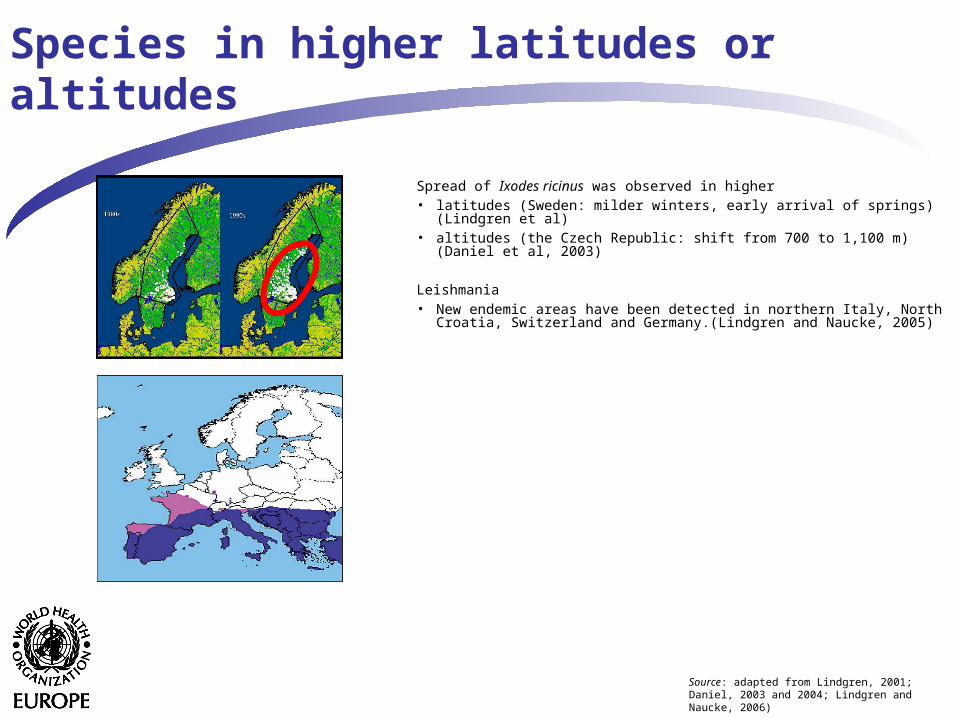
Spread of Ixodes ricinus was observed in higher • latitudes (Sweden: milder winters, early arrival of springs)(Lindgren
et al)• altitudes (the Czech Republic: shift from 700 to 1,100 m) (Daniel et
al, 2003)
Leishmania• New endemic areas have been detected in northern Italy, North
Croatia, Switzerland and Germany.(Lindgren and Naucke, 2005)
Species in higher latitudes or altitudes
Source: adapted from Lindgren, 2001; Daniel, 2003 and 2004; Lindgren and Naucke, 2006)
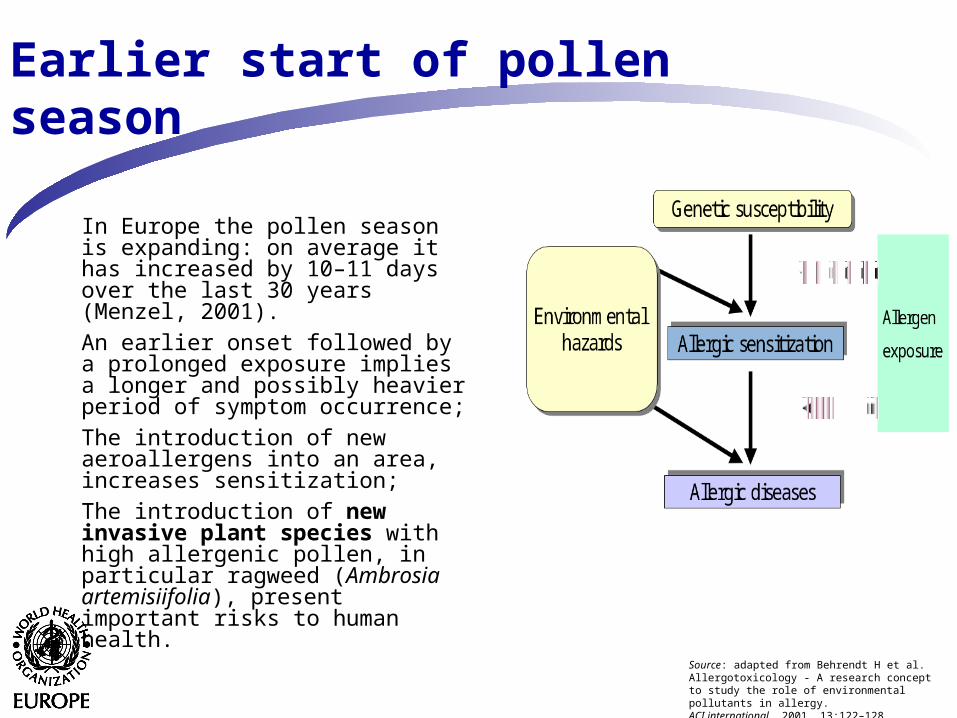
In Europe the pollen season is expanding: on average it has increased by 10–11 days over the last 30 years (Menzel, 2001).
An earlier onset followed by a prolonged exposure implies a longer and possibly heavier period of symptom occurrence;
The introduction of new aeroallergens into an area, increases sensitization;
The introduction of new invasive plant species with high allergenic pollen, in particular ragweed (Ambrosia artemisiifolia), present important risks to human health.
Earlier start of pollen season
Source: adapted from Behrendt H et al. Allergotoxicology - A research concept to study the role of environmental pollutants in allergy. ACI international, 2001, 13:122–128.
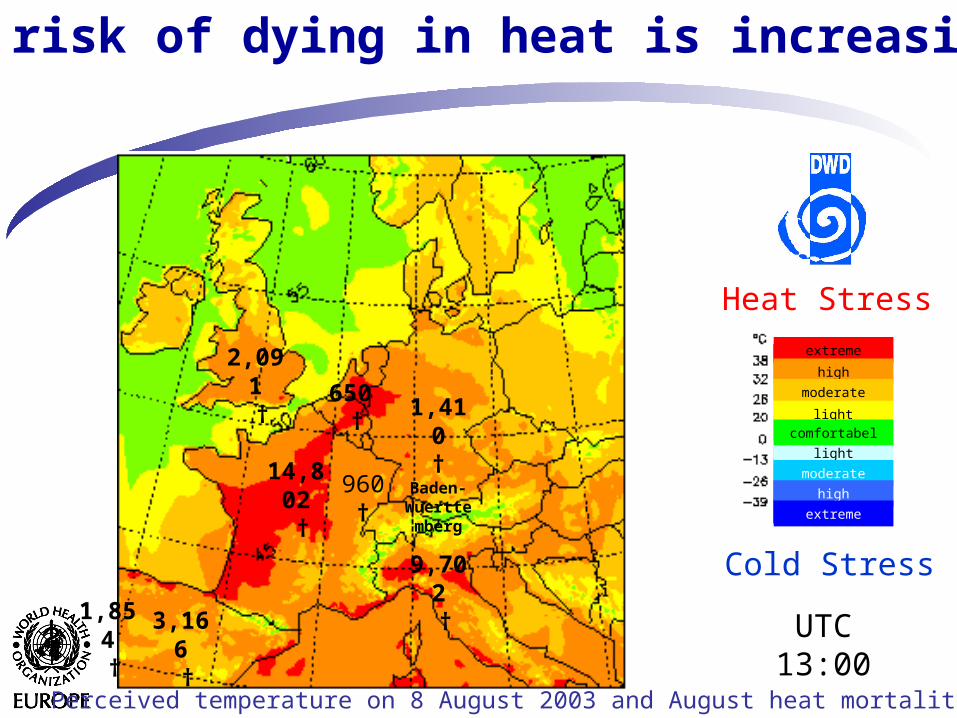
The risk of dying in heat is increasing
UTC13:00
Heat Stress
Cold Stress
light
extreme
high
moderate
light
comfortabel
moderate
high
extreme
14,802 †
1,410†
Baden-Wuerttemberg
3,166 †
2,091 † 650
†
9,702 †
1,854 †
960†
Perceived temperature on 8 August 2003 and August heat mortality
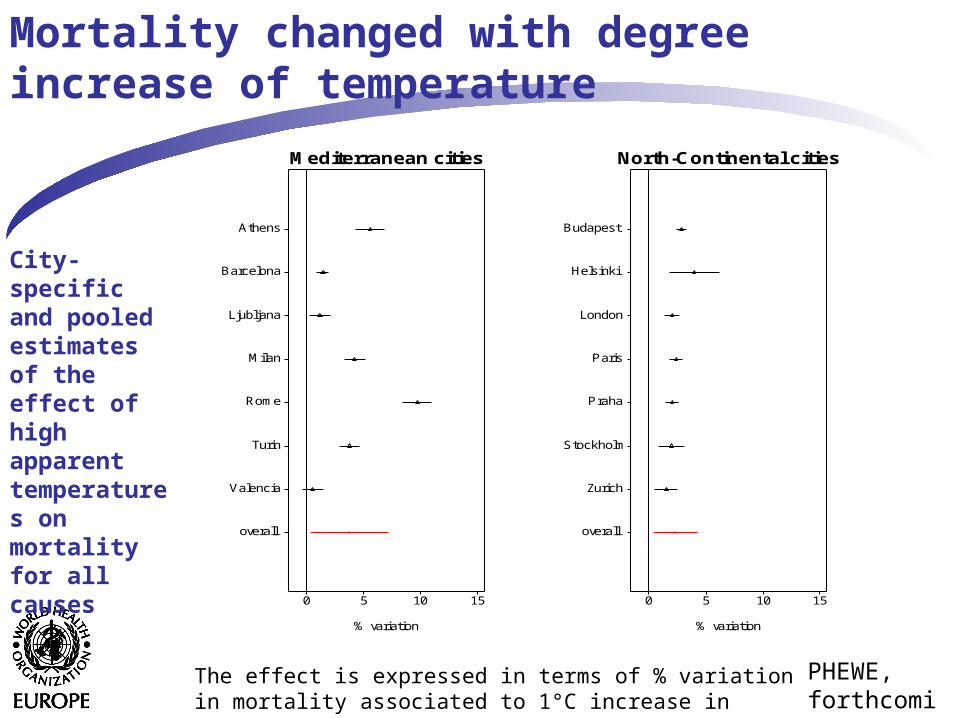
Mortality changed with degree increase of temperature
Mediterranean cities
% variation
overall
Valencia
Turin
Rome
Milan
Ljubljana
Barcelona
Athens
0 5 10 15
North-Continental cities
% variation
overall
Zurich
Stockholm
Praha
Paris
London
Helsinki
Budapest
0 5 10 15
The effect is expressed in terms of % variation in mortality associated to 1°C increase in exposure.
PHEWE, forthcoming
City-specific and pooled estimates of the effect of high apparent temperatures on mortality for all causes
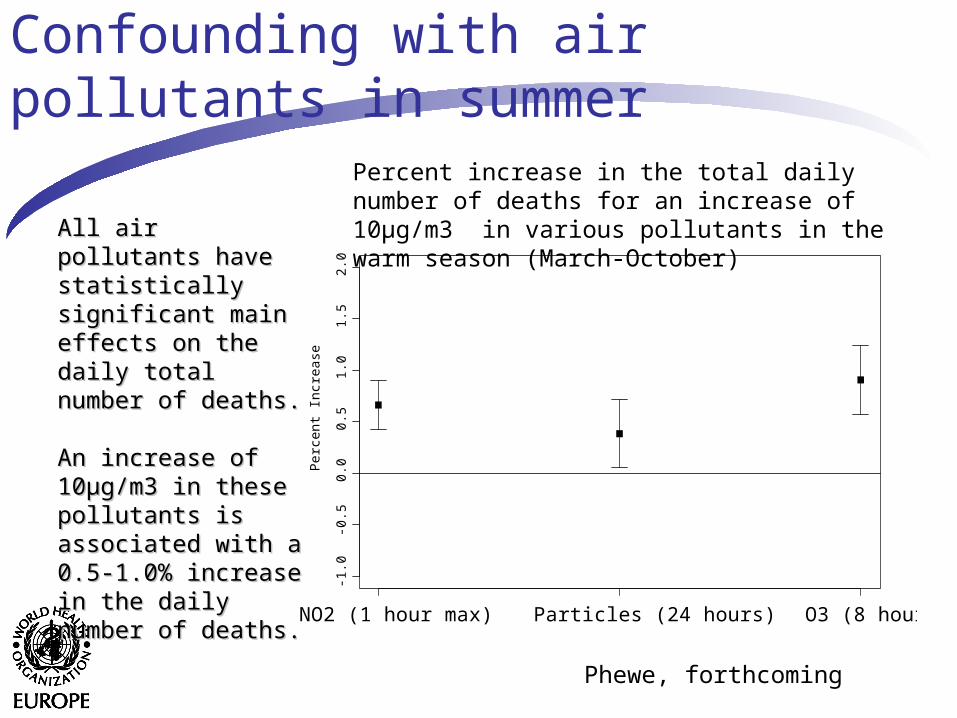
Confounding with air pollutants in summer
Per
cent
Incr
ease
-1.0
-0.5
0.0
0.5
1.0
1.5
2.0
NO2 (1 hour max) Particles (24 hours) O3 (8 hours)
Percent increase in the total daily number of deaths for an increase of 10μg/m3 in various pollutants in the warm season (March-October)All air pollutants have All air pollutants have
statistically significant statistically significant main effects on the main effects on the daily total number of daily total number of deaths. deaths. An increase of An increase of 1010μμg/m3 in these g/m3 in these pollutants is pollutants is associated with a 0.5-associated with a 0.5-1.0% increase in the 1.0% increase in the daily number of daily number of deaths.deaths.
Phewe, forthcoming
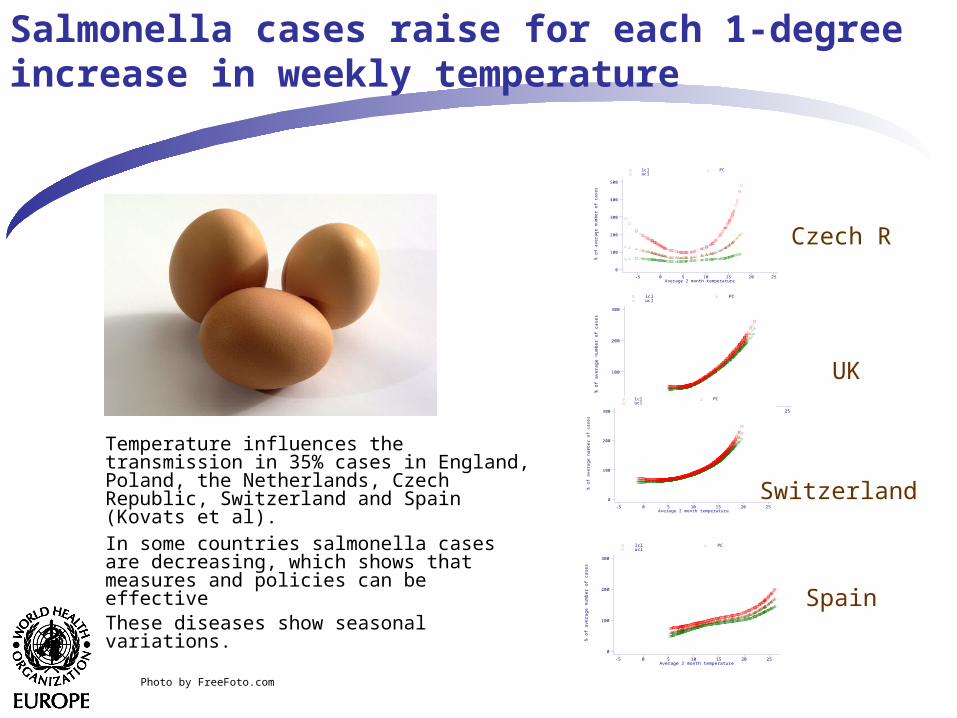
Temperature influences the transmission in 35% cases in England, Poland, the Netherlands, Czech Republic, Switzerland and Spain (Kovats et al).
In some countries salmonella cases are decreasing, which shows that measures and policies can be effective These diseases show seasonal variations.
Salmonella cases raise for each 1-degree increase in weekly temperature
Photo by FreeFoto.com
% o
f ave
rag
e n
um
be
r o
f ca
ses
Average 2 month temperature
lcl PC ucl
-5 0 5 10 15 20 25
0
100
200
300
400
500
% o
f ave
rag
e n
um
be
r o
f ca
ses
Average 2 month temperature
lcl PC ucl
-5 0 5 10 15 20 25
0
100
200
300
% o
f a
ve
rag
e n
um
be
r o
f ca
se
s
Average 2 month temperature
lcl PC ucl
-5 0 5 10 15 20 25
0
100
200
300
% o
f ave
rag
e n
um
be
r o
f ca
ses
Average 2 month temperature
lcl PC ucl
-5 0 5 10 15 20 25
0
100
200
300
Czech R
UK
Switzerland
Spain
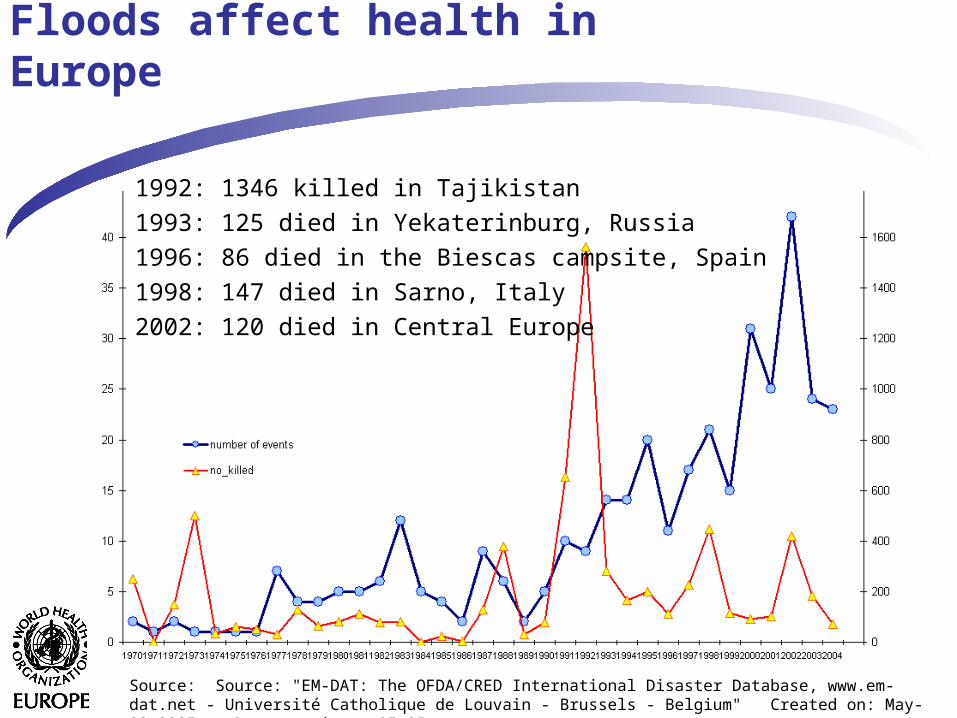
Floods affect health in Europe
Source: EM-DAT database, May 2005
1992: 1346 killed in Tajikistan
1993: 125 died in Yekaterinburg, Russia
1996: 86 died in the Biescas campsite, Spain
1998: 147 died in Sarno, Italy
2002: 120 died in Central Europe
Source: Source: "EM-DAT: The OFDA/CRED International Disaster Database, www.em-dat.net - Université Catholique de Louvain - Brussels - Belgium" Created on: May-23-2005. - Data version: v05.05
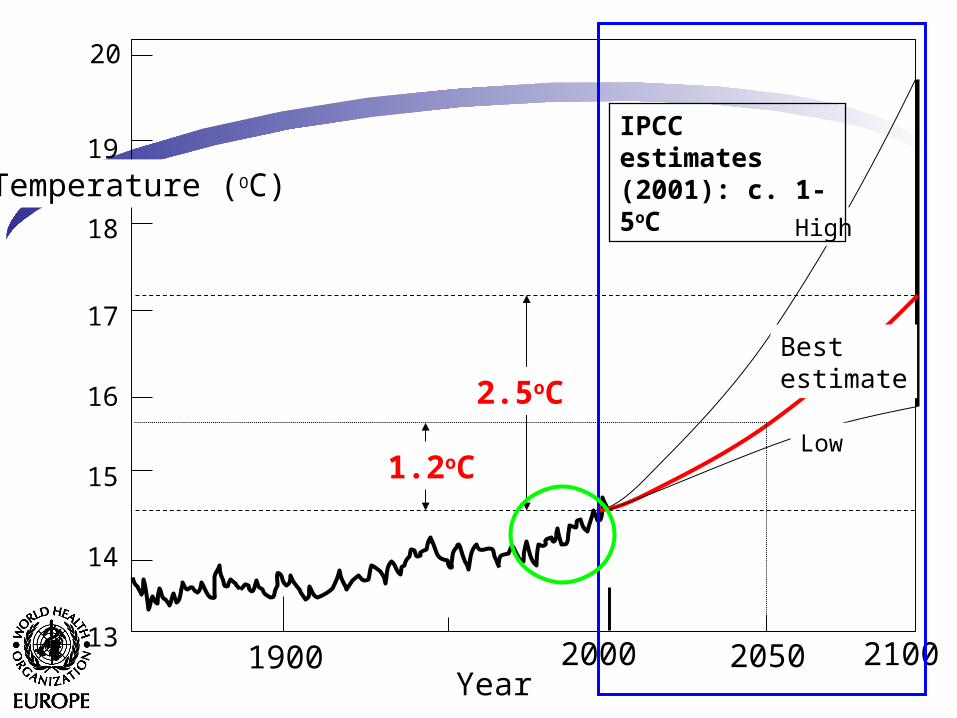
20
15
1900 21002000
14
16
17
18
13
19
Temperature (OC)
Year
2.5oC
Bestestimate
Low
High
IPCC estimates(2001): c. 1-5oC
1.2oC
2050
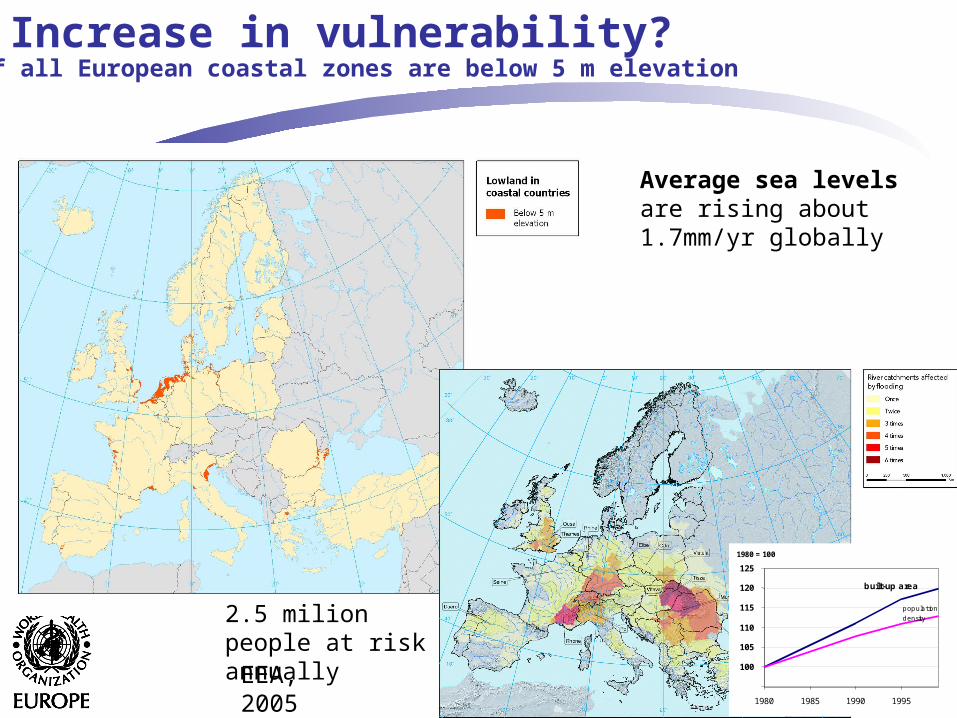
Increase in vulnerability?
Data-source: EEA, 2006EEA, 2005
2.5 milion people at risk annually
Average sea levels are rising about 1.7mm/yr globally
9% of all European coastal zones are below 5 m elevation
100
105
110
115
120
125
1980 1985 1990 1995
built-up area
1980 = 100
population density
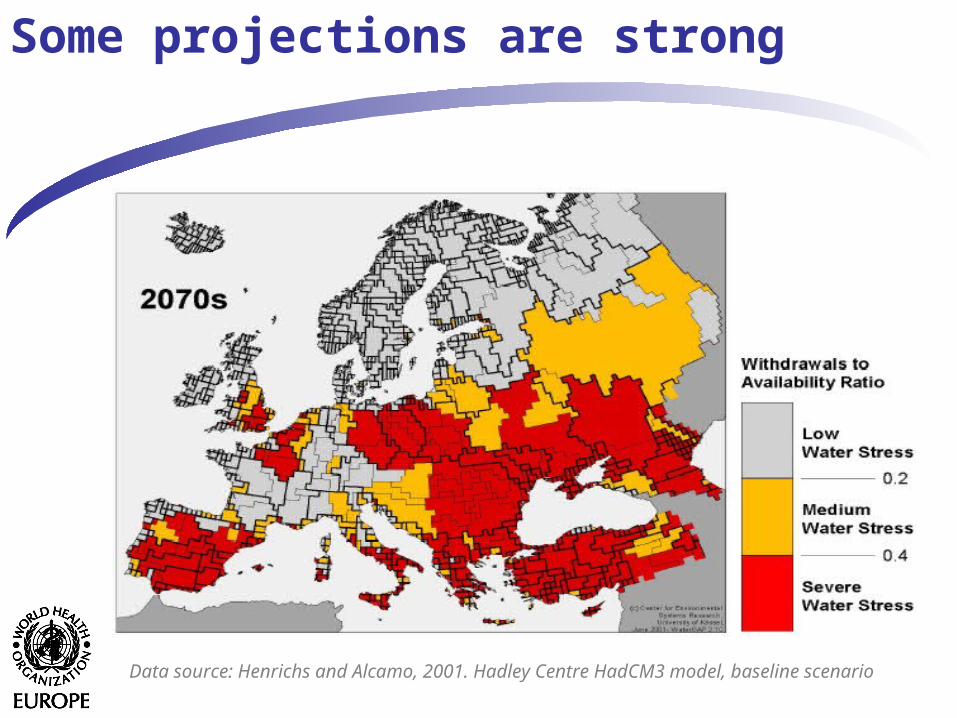
Data source: Henrichs and Alcamo, 2001. Hadley Centre HadCM3 model, baseline scenario
Some projections are strong
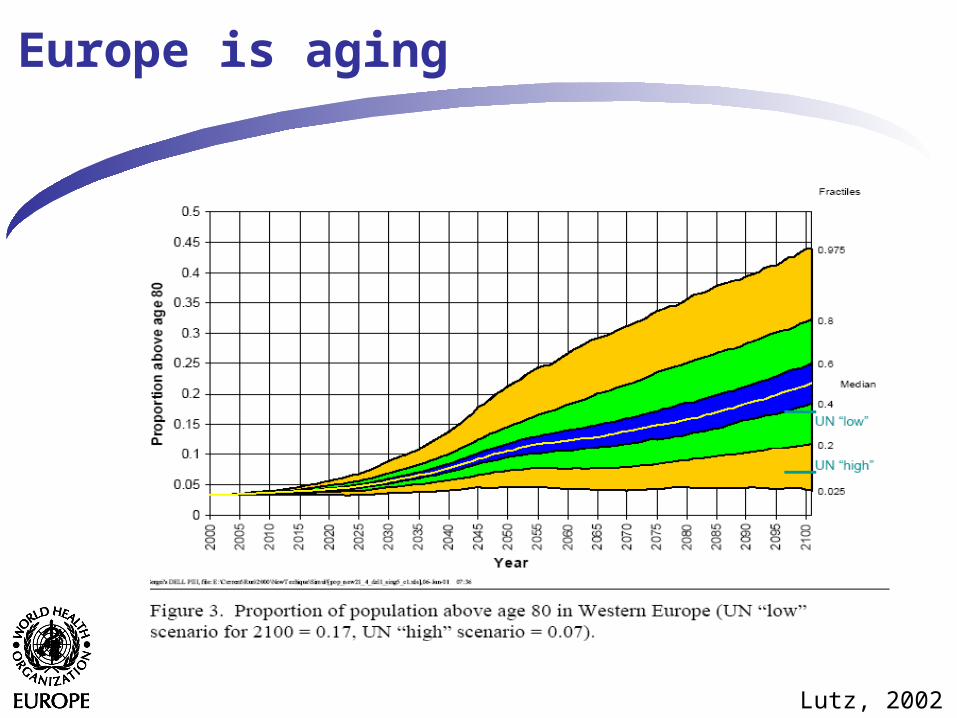
Europe is aging
Lutz, 2002
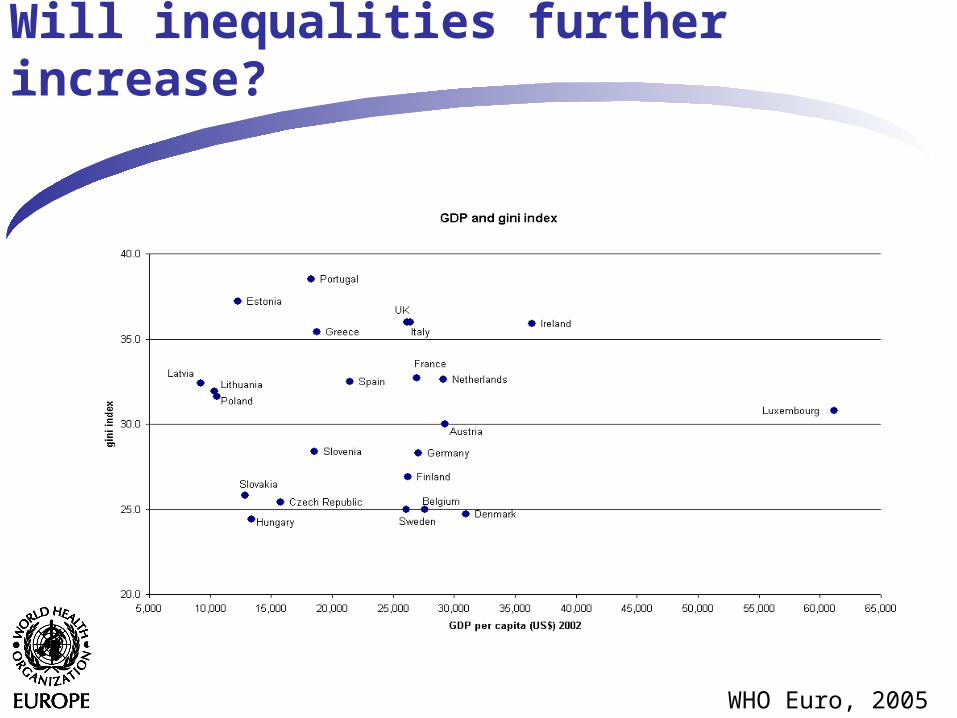
Will inequalities further increase?
WHO Euro, 2005
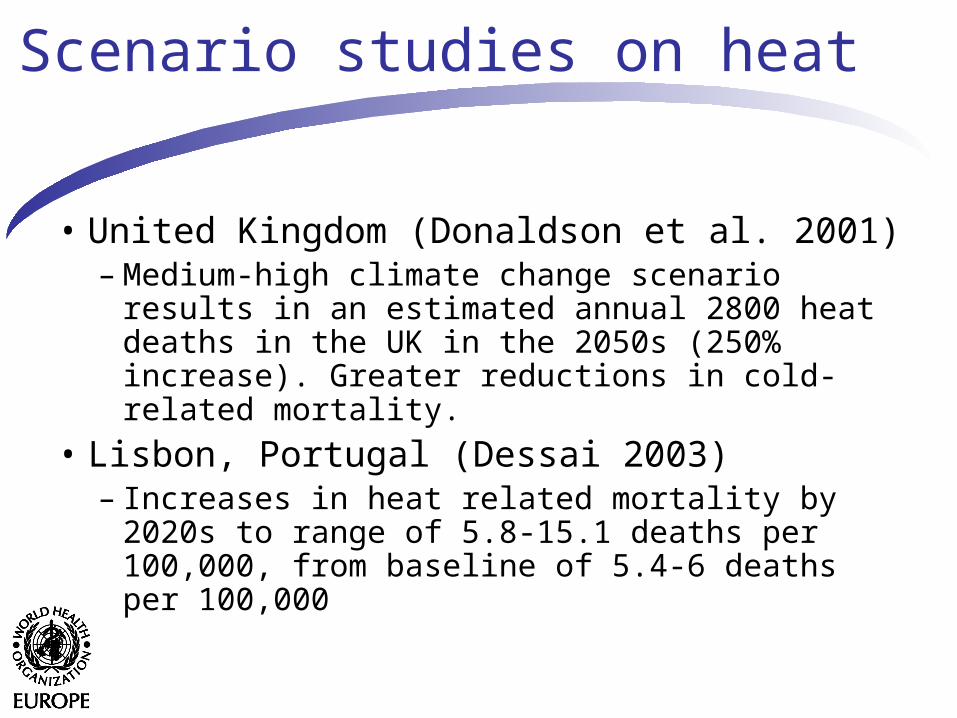
Scenario studies on heat
• United Kingdom (Donaldson et al. 2001)– Medium-high climate change scenario results
in an estimated annual 2800 heat deaths in the UK in the 2050s (250% increase). Greater reductions in cold-related mortality.
• Lisbon, Portugal (Dessai 2003) – Increases in heat related mortality by 2020s to
range of 5.8-15.1 deaths per 100,000, from baseline of 5.4-6 deaths per 100,000
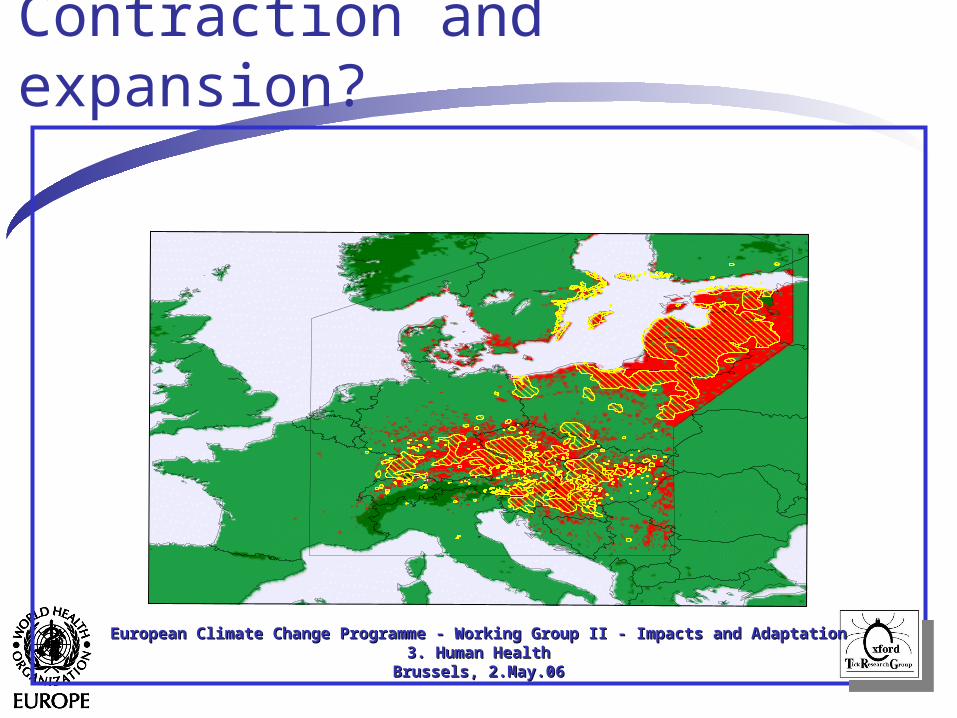
Contraction and expansion?
European Climate Change Programme - Working Group II - Impacts and AdaptationEuropean Climate Change Programme - Working Group II - Impacts and Adaptation3. Human Health3. Human Health
Brussels, 2.May.06Brussels, 2.May.06
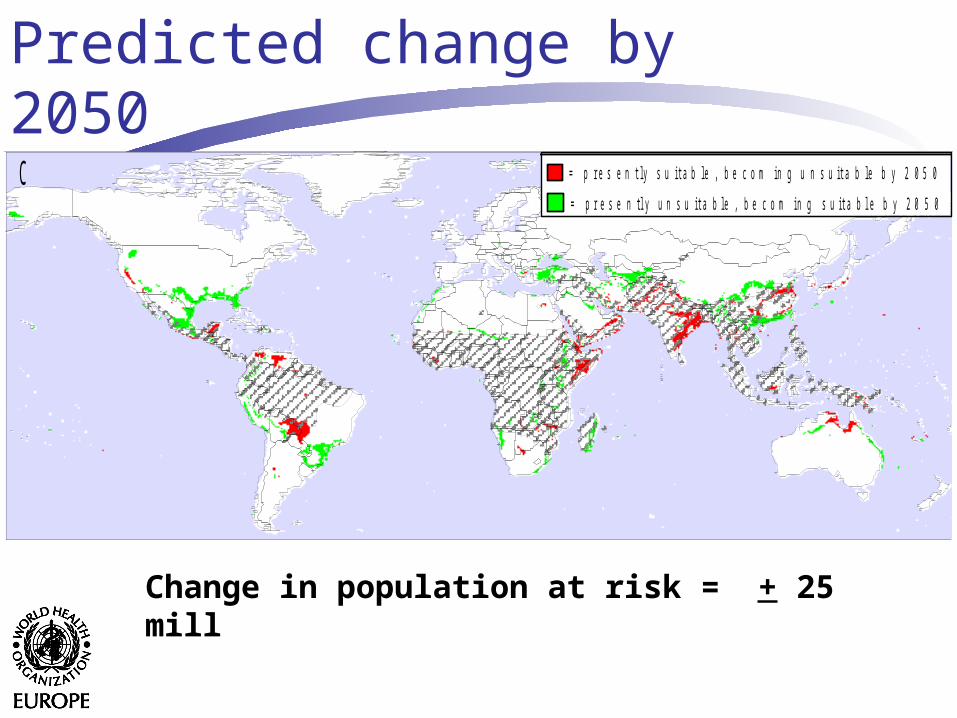
= p r e s e n t l y s u i t a b l e , b e c o m i n g u n s u i t a b l e b y 2 0 5 0
= p r e s e n t l y u n s u i t a b l e , b e c o m i n g s u i t a b l e b y 2 0 5 0
C
Change in population at risk = + 25 mill
Predicted change by 2050
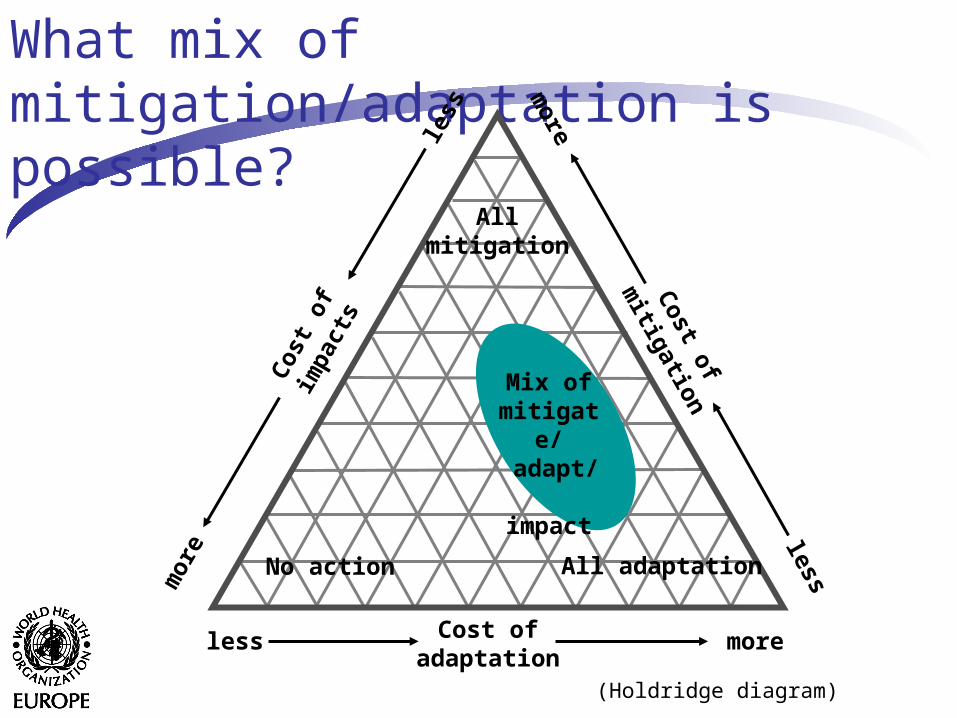
What mix of mitigation/adaptation is possible?
No action
Allmitigation
All adaptation
Mix ofmitigate/ adapt/
impact
Cost ofadaptation
less more
Cost of
mitigation
less
more
Cos
t of
impa
cts
less
mor
e
(Holdridge diagram)
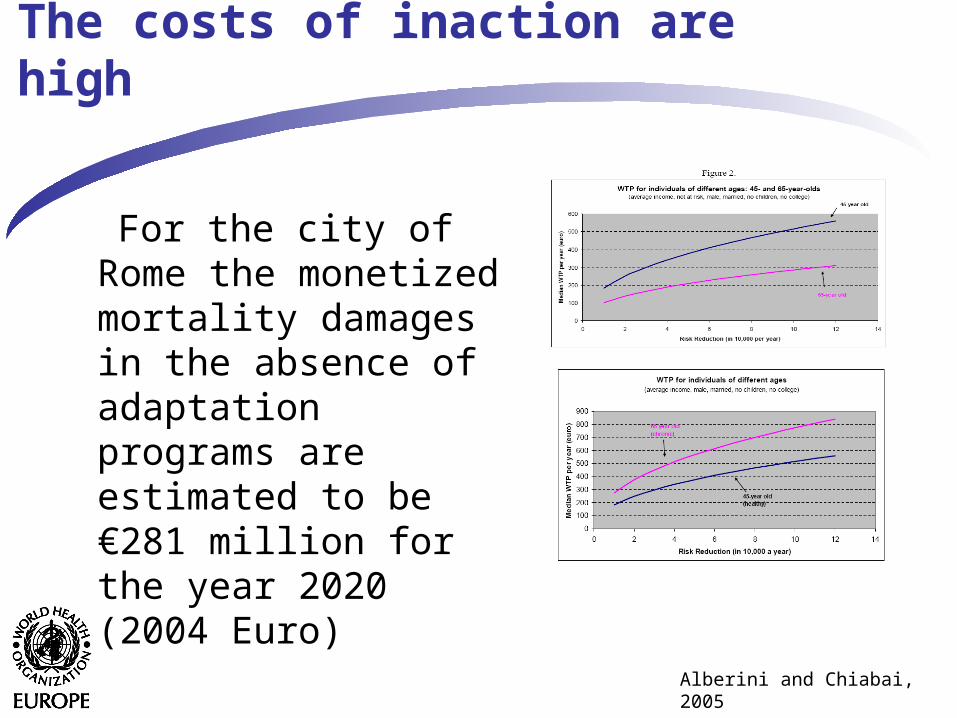
The costs of inaction are high
For the city of Rome the monetized mortality damages in the absence of adaptation programs are estimated to be €281 million for the year 2020 (2004 Euro)
Alberini and Chiabai, 2005
In summary
• Climate change affects health and will affect health
• Anticipatory thinking is needed to link the multiple global change exposures to anticipate risks to human health
• Adaptation strategies are needed to anticipate, detect and prevent the health effects
• Without the reduction of greenhousegases in the long run adaptation will not be suficient
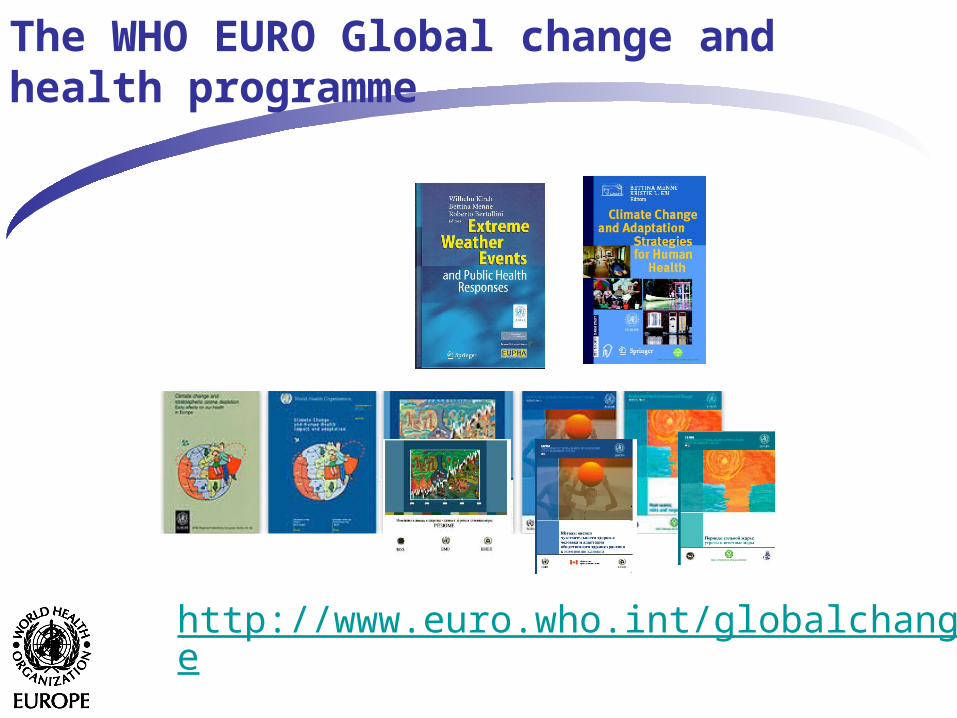
The WHO EURO Global change and health programme
http://www.euro.who.int/globalchange
Climate change and adaptation strategies for human health
http://www.euro.who.int/globalchange
WHO Regional Office for Europe
European Centre for Environment and Health