Embed Size (px)
DESCRIPTION
The purpose of the Climate and Water Report is to provide a snapshot of current and immediate past climatic conditions and other information useful to agricultural and water user interests in Utah.
Citation preview
Utah Climate and Water Report
July 2014
Raft River Mountains, June 2014 Photo by Kent Sutcliffe
Scale in cm
Utah Climate and Water Report The purpose of the Climate and Water Report is to provide a snapshot of current and immediate past climatic conditions and other information useful to agricultural and water user interests in Utah. The report utilizes data from several sources that represent specific parameters (streamflow data from the United States Geological Survey, reservoir data from the Bureau of Reclamation, and other sources), geography including high elevation United States Department of Agriculture (USDA), Natural Resources Conservation Service (NRCS) Snowpack Telemetry (SNOTEL) data, and agriculturally important data from the USDA-NRCS Soil Climate Analysis Network (SCAN). Data on precipitation, soil moisture, soil temperature, reservoir storage, and streamflow are analyzed and presented. These data analyses can be used to increase irrigation efficiency and agricultural production. As with all data and analyses, there are limitations due to data quality, quantity, and spatial application.
The U.S. Department of Agriculture (USDA) prohibits discrimination against its customers. If you believe you experienced discrimination when obtaining services from USDA, participating in a USDA program, or participating in a program that receives financial assistance from USDA, you may file a complaint with USDA. Information about how to file a discrimination complaint is available from the Office of the Assistant Secretary for Civil Rights. USDA prohibits discrimination in all its programs and activities on the basis of race, color, national origin, age, disability, and where applicable, sex (including gender identity and expression), marital status, familial status, parental status, religion, sexual orientation, political beliefs, genetic information, reprisal, or because all or part of an individual’s income is derived from any public assistance program. (Not all prohibited bases apply to all programs.) To file a complaint of discrimination, complete, sign, and mail a program discrimination complaint form, available at any USDA office location or online at www.ascr.usda.gov, or write to: USDA Office of the Assistant Secretary for Civil Rights 1400 Independence Avenue, SW. Washington, DC 20250-9410 Or call toll free at (866) 632-9992 (voice) to obtain additional information, the appropriate office or to request documents. Individuals who are deaf, hard of hearing, or have speech disabilities may contact USDA through the Federal Relay service at (800) 877-8339 or (800) 845-6136 (in Spanish). USDA is an equal opportunity provider, employer, and lender. Persons with disabilities who require alternative means for communication of program information (e.g., Braille, large print, audiotape, etc.) should contact USDA's TARGET Center at (202) 720-2600 (voice and TDD).
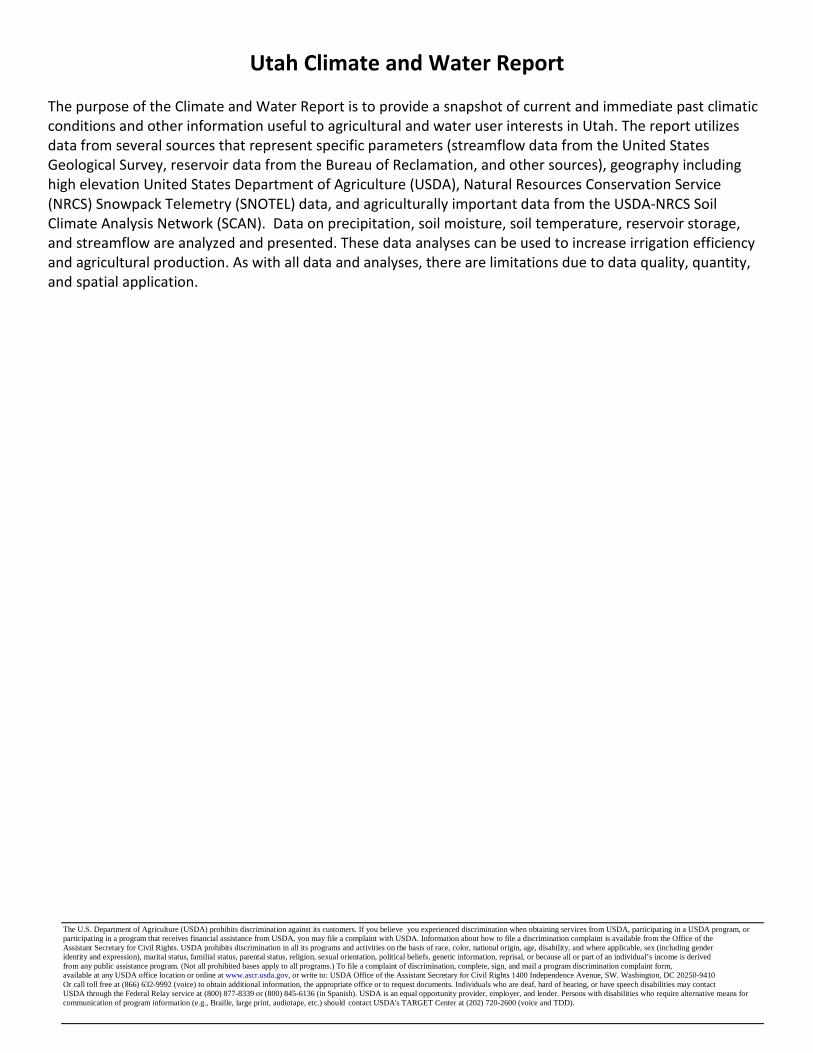
Climate and Water Information Soil Climate Analysis Network Soil Climate Analysis Network (SCAN) stations are primarily located on low- to mid-elevation, agriculturally important landscapes that maintain representative soils. Elevations range from 3,000 to 7,000 ft. The SCAN network provides real-time soil moisture and temperature data coupled with additional climate information for use in natural resource planning, drought assessment, water resource management, and resource inventory. Stations are situated on non-irrigated, native soils, are remotely located, and collect hourly atmospheric and soils data that are available to the public online.
In order to summarize SCAN data, the 35 sites in Utah are grouped by climate divisions (North Central, Northern Mountains, Uintah Basin, Southeast, South Central, Dixie, and Western).
Explanation of soil water capacity definitions. Field capacity (FC) and wilting point (WP) are calculated in the laboratory for each soil horizon. The amount of water held between field capacity and wilting point is plant available.
Visual explanation of soil water capacity definitions.
http://www.wcc.nrcs.usda.gov/scan/Utah/utah.html
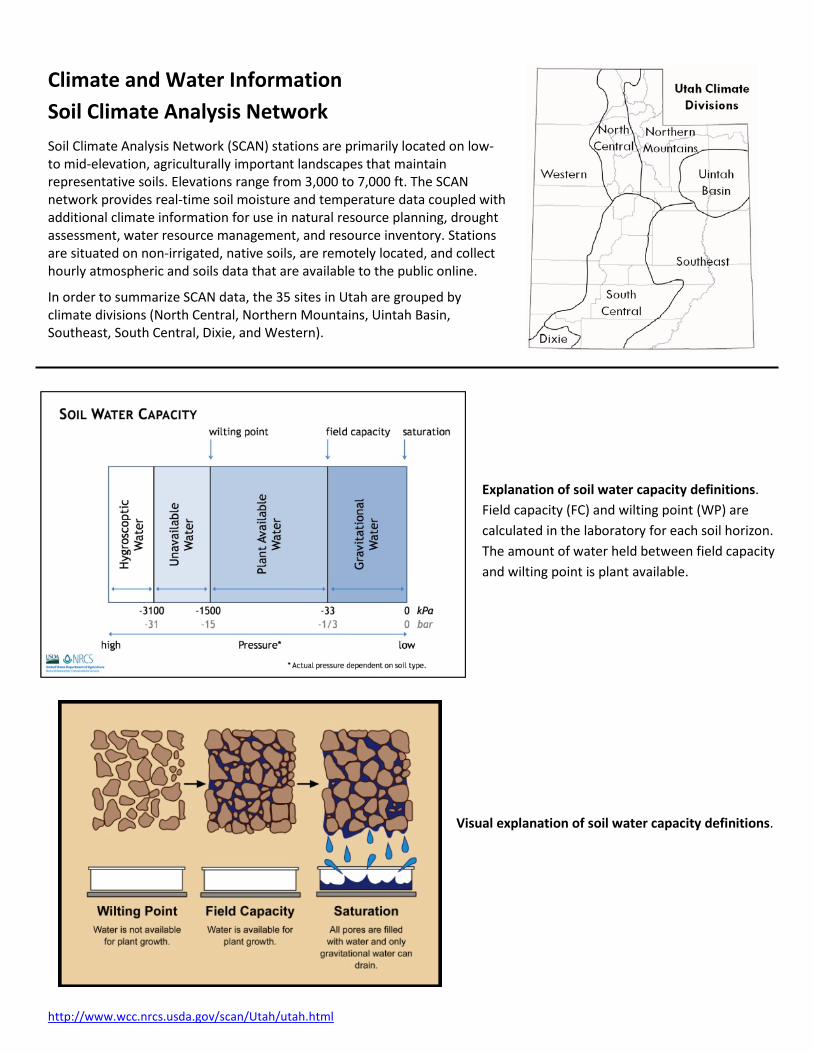
North Central Soil Climate Analysis Network (SCAN)
2" 4" 8" 20" 40" 2" 4" 8" 20" 40"
in. in.
NORTH CENTRALBlue Creek 9.5 0.7 14 18 24 31 21 70 73 71 65 60Cache Junction 12.9 1.3 21 19 29 28 38 63 65 63 60 56Grantsville 7.4 0.6 0 15 24 30 76 79 77 68 64
volume % o F
Site name Precip to Date*
Monthly Precip
Soil Moisture Soil Temperature
* Precipitation since October 1 (beginning of the water year). Monthly Precip is the amount of precipitation accumulated in the past month. SCAN sites utilize tipping bucket rain gauges which do not accurately measure precipitation in the form of snowfall. Soil moisture and temperature values reflect conditions measured on the first of the month.
0
10
20
30
40
50
Oct Nov Dec Jan Feb Mar Apr May Jun Jul Aug Sep
Volu
met
ric so
il m
oist
ure,
%
WY 2013 WY 2014
profile soil moisture
0
10
20
30
40
50
Oct Nov Dec Jan Feb Mar Apr May Jun Jul Aug Sep
Volu
met
ric so
il m
oist
ure,
%
WY 2013 WY 2014
profile soil moisture
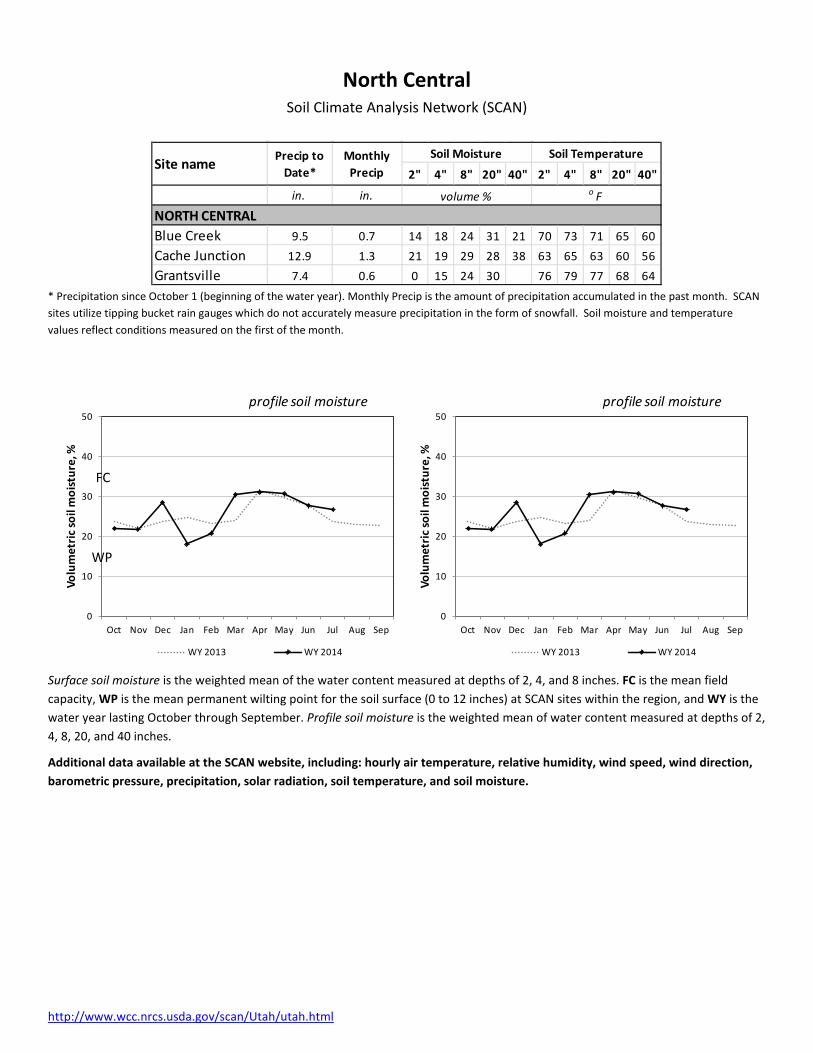
Surface soil moisture is the weighted mean of the water content measured at depths of 2, 4, and 8 inches. FC is the mean field capacity, WP is the mean permanent wilting point for the soil surface (0 to 12 inches) at SCAN sites within the region, and WY is the water year lasting October through September. Profile soil moisture is the weighted mean of water content measured at depths of 2, 4, 8, 20, and 40 inches.
Additional data available at the SCAN website, including: hourly air temperature, relative humidity, wind speed, wind direction, barometric pressure, precipitation, solar radiation, soil temperature, and soil moisture.
FC
WP
http://www.wcc.nrcs.usda.gov/scan/Utah/utah.html
Northern Mountains Soil Climate Analysis Network (SCAN)
2" 4" 8" 20" 40" 2" 4" 8" 20" 40"
in. in.
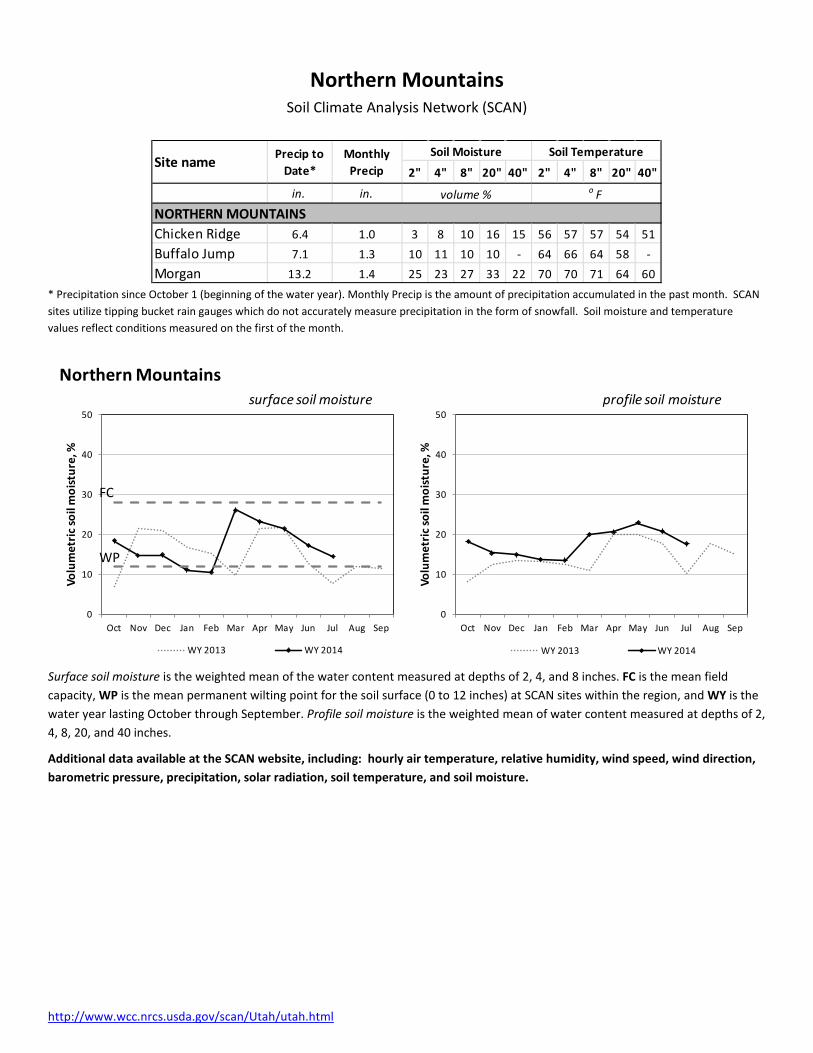
NORTHERN MOUNTAINSChicken Ridge 6.4 1.0 3 8 10 16 15 56 57 57 54 51Buffalo Jump 7.1 1.3 10 11 10 10 - 64 66 64 58 -Morgan 13.2 1.4 25 23 27 33 22 70 70 71 64 60
Site name
volume % o F
Soil Moisture Soil TemperaturePrecip to Date*
Monthly Precip
* Precipitation since October 1 (beginning of the water year). Monthly Precip is the amount of precipitation accumulated in the past month. SCAN sites utilize tipping bucket rain gauges which do not accurately measure precipitation in the form of snowfall. Soil moisture and temperature values reflect conditions measured on the first of the month.
0
10
20
30
40
50
Oct Nov Dec Jan Feb Mar Apr May Jun Jul Aug Sep
Volu
met
ric so
il m
oist
ure,
%
Northern Mountains
WY 2013 WY 2014
surface soil moisture
0
10
20
30
40
50
Oct Nov Dec Jan Feb Mar Apr May Jun Jul Aug Sep
Volu
met
ric so
il m
oist
ure,
%
WY 2013 WY 2014
profile soil moisture
Surface soil moisture is the weighted mean of the water content measured at depths of 2, 4, and 8 inches. FC is the mean field capacity, WP is the mean permanent wilting point for the soil surface (0 to 12 inches) at SCAN sites within the region, and WY is the water year lasting October through September. Profile soil moisture is the weighted mean of water content measured at depths of 2, 4, 8, 20, and 40 inches.
Additional data available at the SCAN website, including: hourly air temperature, relative humidity, wind speed, wind direction, barometric pressure, precipitation, solar radiation, soil temperature, and soil moisture.
FC
WP
http://www.wcc.nrcs.usda.gov/scan/Utah/utah.html
Uintah Basin Soil Climate Analysis Network (SCAN)
2" 4" 8" 20" 40" 2" 4" 8" 20" 40"
in. in.
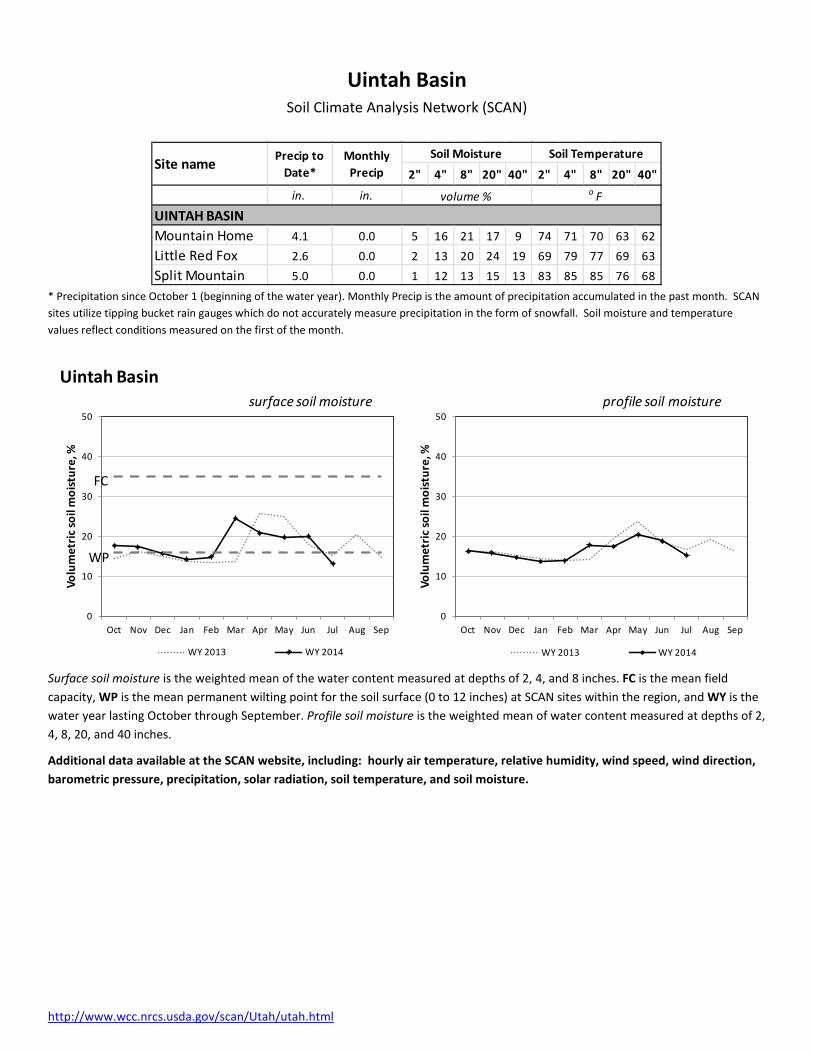
UINTAH BASINMountain Home 4.1 0.0 5 16 21 17 9 74 71 70 63 62Little Red Fox 2.6 0.0 2 13 20 24 19 69 79 77 69 63Split Mountain 5.0 0.0 1 12 13 15 13 83 85 85 76 68
Soil Temperature
volume % o F
Site name Precip to Date*
Monthly Precip
Soil Moisture
* Precipitation since October 1 (beginning of the water year). Monthly Precip is the amount of precipitation accumulated in the past month. SCAN sites utilize tipping bucket rain gauges which do not accurately measure precipitation in the form of snowfall. Soil moisture and temperature values reflect conditions measured on the first of the month.
0
10
20
30
40
50
Oct Nov Dec Jan Feb Mar Apr May Jun Jul Aug Sep
Volu
met
ric so
il m
oist
ure,
%
Uintah Basin
WY 2013 WY 2014
surface soil moisture
0
10
20
30
40
50
Oct Nov Dec Jan Feb Mar Apr May Jun Jul Aug Sep
Volu
met
ric so
il m
oist
ure,
%
WY 2013 WY 2014
profile soil moisture
Surface soil moisture is the weighted mean of the water content measured at depths of 2, 4, and 8 inches. FC is the mean field capacity, WP is the mean permanent wilting point for the soil surface (0 to 12 inches) at SCAN sites within the region, and WY is the water year lasting October through September. Profile soil moisture is the weighted mean of water content measured at depths of 2, 4, 8, 20, and 40 inches.
Additional data available at the SCAN website, including: hourly air temperature, relative humidity, wind speed, wind direction, barometric pressure, precipitation, solar radiation, soil temperature, and soil moisture.
FC
WP
http://www.wcc.nrcs.usda.gov/scan/Utah/utah.html
Southeast Soil Climate Analysis Network (SCAN)
2" 4" 8" 20" 40" 2" 4" 8" 20" 40"
in. in.
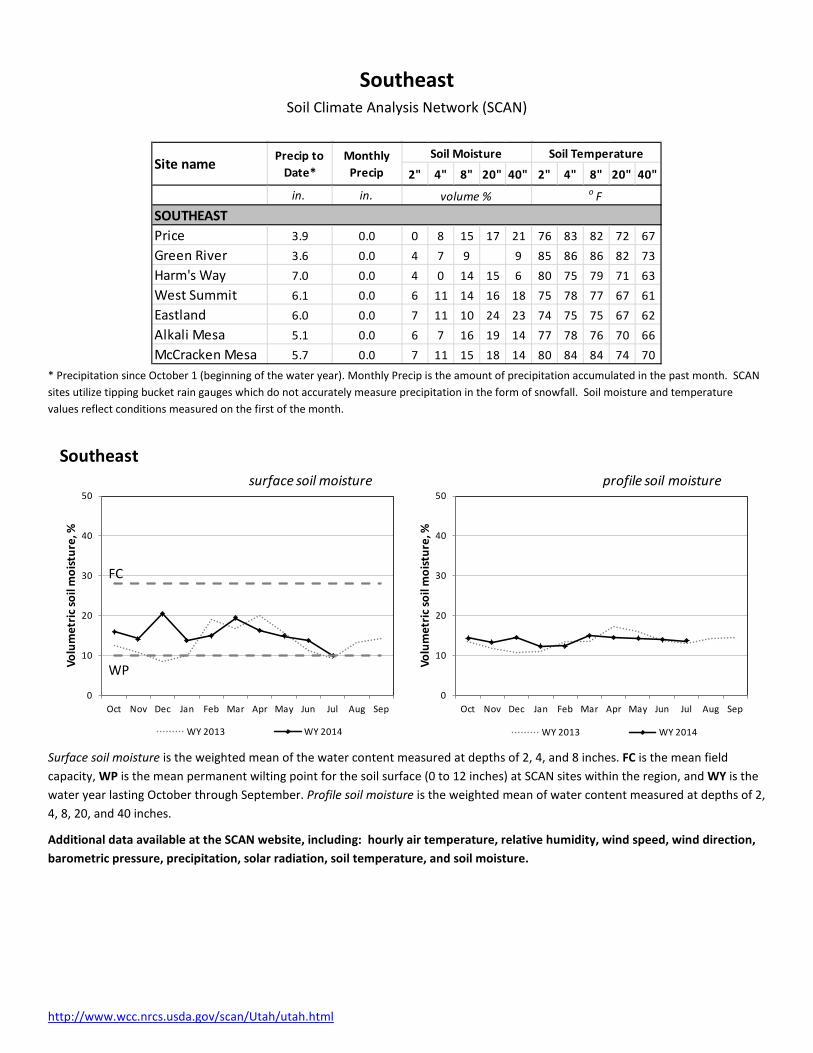
SOUTHEASTPrice 3.9 0.0 0 8 15 17 21 76 83 82 72 67Green River 3.6 0.0 4 7 9 9 85 86 86 82 73Harm's Way 7.0 0.0 4 0 14 15 6 80 75 79 71 63West Summit 6.1 0.0 6 11 14 16 18 75 78 77 67 61Eastland 6.0 0.0 7 11 10 24 23 74 75 75 67 62Alkali Mesa 5.1 0.0 6 7 16 19 14 77 78 76 70 66McCracken Mesa 5.7 0.0 7 11 15 18 14 80 84 84 74 70
Soil Temperature
volume % o F
Site name Precip to Date*
Monthly Precip
Soil Moisture
* Precipitation since October 1 (beginning of the water year). Monthly Precip is the amount of precipitation accumulated in the past month. SCAN sites utilize tipping bucket rain gauges which do not accurately measure precipitation in the form of snowfall. Soil moisture and temperature values reflect conditions measured on the first of the month.
0
10
20
30
40
50
Oct Nov Dec Jan Feb Mar Apr May Jun Jul Aug Sep
Volu
met
ric so
il m
oist
ure,
%
Southeast
WY 2013 WY 2014
surface soil moisture
0
10
20
30
40
50
Oct Nov Dec Jan Feb Mar Apr May Jun Jul Aug Sep
Volu
met
ric so
il m
oist
ure,
%
WY 2013 WY 2014
profile soil moisture
Surface soil moisture is the weighted mean of the water content measured at depths of 2, 4, and 8 inches. FC is the mean field capacity, WP is the mean permanent wilting point for the soil surface (0 to 12 inches) at SCAN sites within the region, and WY is the water year lasting October through September. Profile soil moisture is the weighted mean of water content measured at depths of 2, 4, 8, 20, and 40 inches.
Additional data available at the SCAN website, including: hourly air temperature, relative humidity, wind speed, wind direction, barometric pressure, precipitation, solar radiation, soil temperature, and soil moisture.
FC
WP
http://www.wcc.nrcs.usda.gov/scan/Utah/utah.html
South Central Soil Climate Analysis Network (SCAN)
2" 4" 8" 20" 40" 2" 4" 8" 20" 40"
in. in.
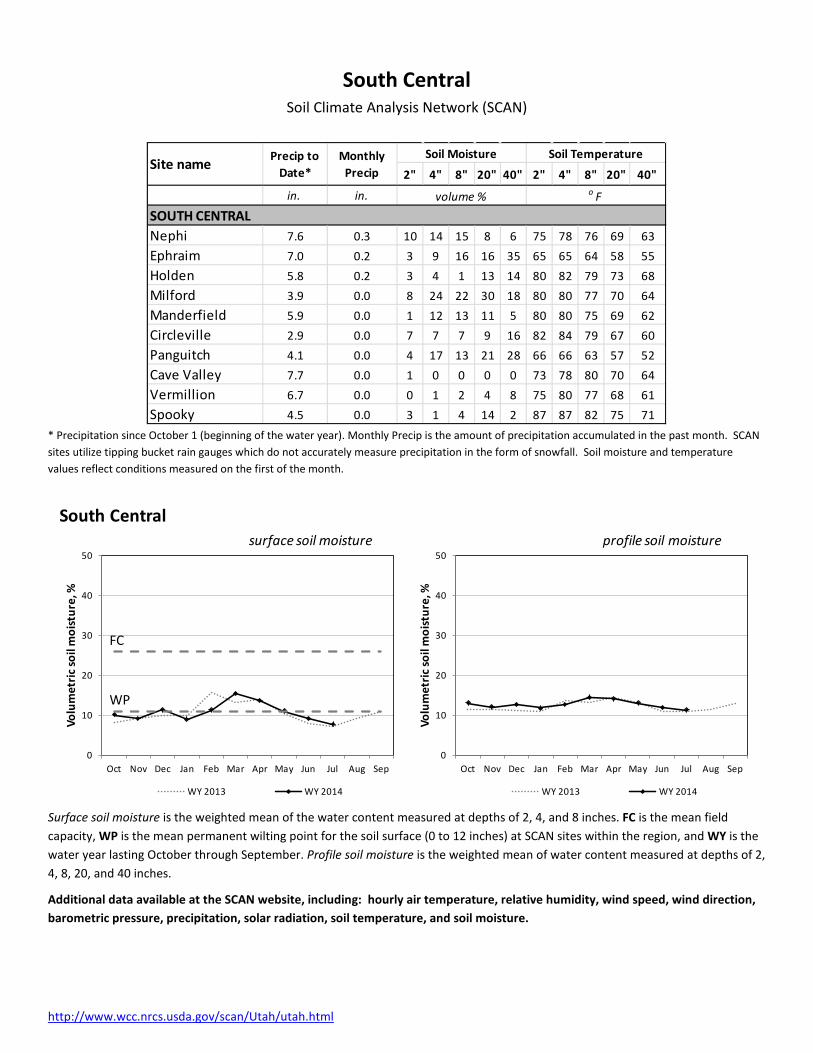
SOUTH CENTRALNephi 7.6 0.3 10 14 15 8 6 75 78 76 69 63Ephraim 7.0 0.2 3 9 16 16 35 65 65 64 58 55Holden 5.8 0.2 3 4 1 13 14 80 82 79 73 68Milford 3.9 0.0 8 24 22 30 18 80 80 77 70 64Manderfield 5.9 0.0 1 12 13 11 5 80 80 75 69 62Circleville 2.9 0.0 7 7 7 9 16 82 84 79 67 60Panguitch 4.1 0.0 4 17 13 21 28 66 66 63 57 52Cave Valley 7.7 0.0 1 0 0 0 0 73 78 80 70 64Vermillion 6.7 0.0 0 1 2 4 8 75 80 77 68 61Spooky 4.5 0.0 3 1 4 14 2 87 87 82 75 71
Soil Temperature
volume % o F
Site name Precip to Date*
Monthly Precip
Soil Moisture
* Precipitation since October 1 (beginning of the water year). Monthly Precip is the amount of precipitation accumulated in the past month. SCAN sites utilize tipping bucket rain gauges which do not accurately measure precipitation in the form of snowfall. Soil moisture and temperature values reflect conditions measured on the first of the month.
0
10
20
30
40
50
Oct Nov Dec Jan Feb Mar Apr May Jun Jul Aug Sep
Volu
met
ric so
il m
oist
ure,
%
South Central
WY 2013 WY 2014
surface soil moisture
0
10
20
30
40
50
Oct Nov Dec Jan Feb Mar Apr May Jun Jul Aug Sep
Volu
met
ric so
il m
oist
ure,
%
WY 2013 WY 2014
profile soil moisture
Surface soil moisture is the weighted mean of the water content measured at depths of 2, 4, and 8 inches. FC is the mean field capacity, WP is the mean permanent wilting point for the soil surface (0 to 12 inches) at SCAN sites within the region, and WY is the water year lasting October through September. Profile soil moisture is the weighted mean of water content measured at depths of 2, 4, 8, 20, and 40 inches.
Additional data available at the SCAN website, including: hourly air temperature, relative humidity, wind speed, wind direction, barometric pressure, precipitation, solar radiation, soil temperature, and soil moisture.
FC
WP
http://www.wcc.nrcs.usda.gov/scan/Utah/utah.html
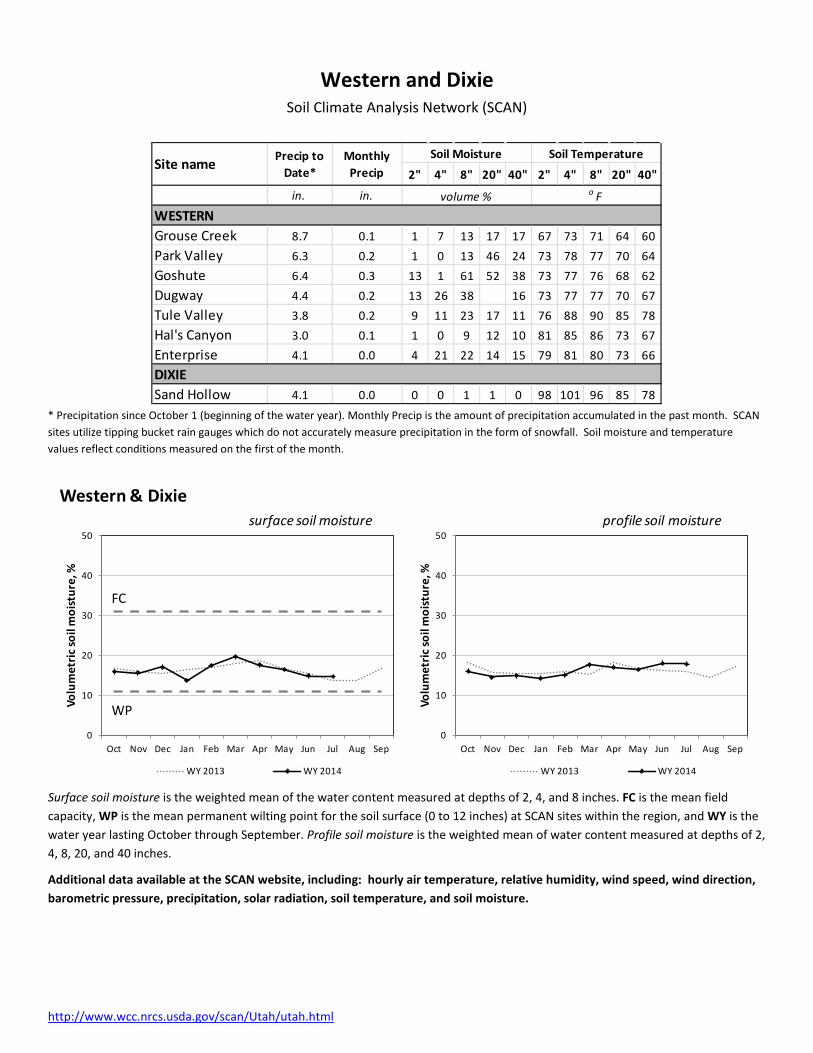
Western and Dixie Soil Climate Analysis Network (SCAN)
2" 4" 8" 20" 40" 2" 4" 8" 20" 40"
in. in.
WESTERNGrouse Creek 8.7 0.1 1 7 13 17 17 67 73 71 64 60Park Valley 6.3 0.2 1 0 13 46 24 73 78 77 70 64Goshute 6.4 0.3 13 1 61 52 38 73 77 76 68 62Dugway 4.4 0.2 13 26 38 16 73 77 77 70 67Tule Valley 3.8 0.2 9 11 23 17 11 76 88 90 85 78Hal's Canyon 3.0 0.1 1 0 9 12 10 81 85 86 73 67Enterprise 4.1 0.0 4 21 22 14 15 79 81 80 73 66DIXIESand Hollow 4.1 0.0 0 0 1 1 0 98 101 96 85 78
volume % o F
Site name Precip to Date*
Monthly Precip
Soil Moisture Soil Temperature
* Precipitation since October 1 (beginning of the water year). Monthly Precip is the amount of precipitation accumulated in the past month. SCAN sites utilize tipping bucket rain gauges which do not accurately measure precipitation in the form of snowfall. Soil moisture and temperature values reflect conditions measured on the first of the month.
0
10
20
30
40
50
Oct Nov Dec Jan Feb Mar Apr May Jun Jul Aug Sep
Volu
met
ric so
il m
oist
ure,
%
Western & Dixie
WY 2013 WY 2014
surface soil moisture
0
10
20
30
40
50
Oct Nov Dec Jan Feb Mar Apr May Jun Jul Aug Sep
Volu
met
ric so
il m
oist
ure,
%
WY 2013 WY 2014
profile soil moisture
Surface soil moisture is the weighted mean of the water content measured at depths of 2, 4, and 8 inches. FC is the mean field capacity, WP is the mean permanent wilting point for the soil surface (0 to 12 inches) at SCAN sites within the region, and WY is the water year lasting October through September. Profile soil moisture is the weighted mean of water content measured at depths of 2, 4, 8, 20, and 40 inches.
Additional data available at the SCAN website, including: hourly air temperature, relative humidity, wind speed, wind direction, barometric pressure, precipitation, solar radiation, soil temperature, and soil moisture.
FC
WP
http://www.wcc.nrcs.usda.gov/scan/Utah/utah.html
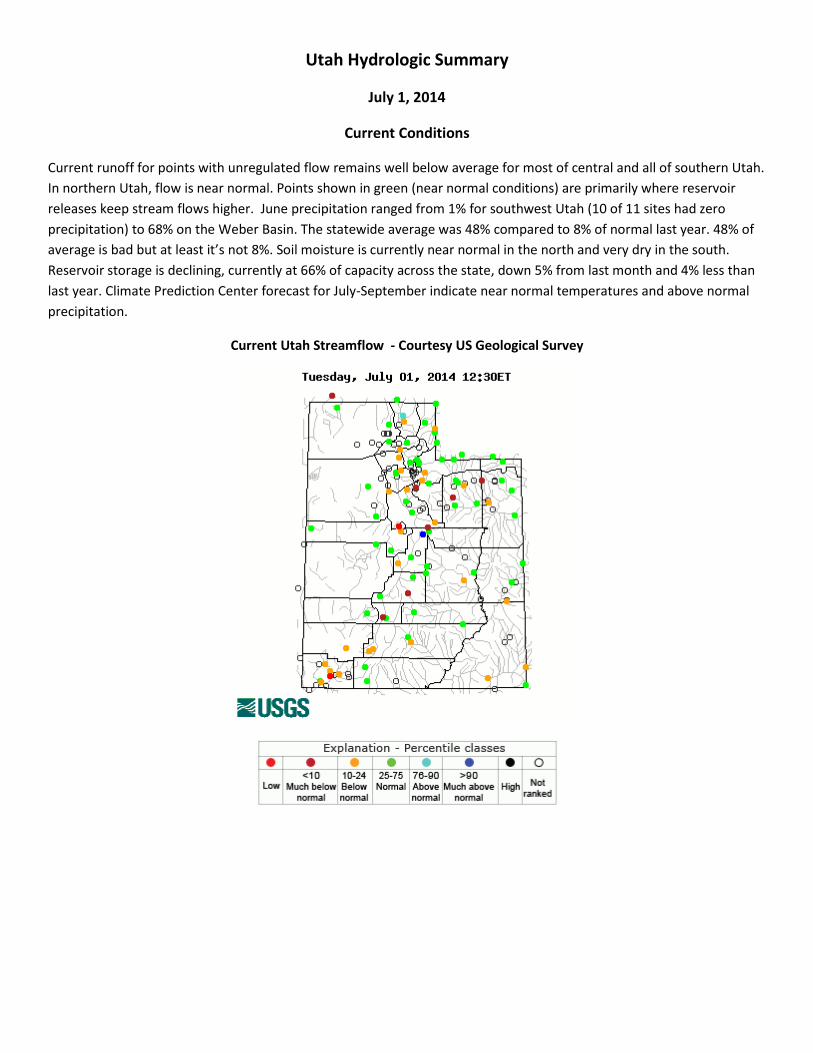
Utah Hydrologic Summary
July 1, 2014
Current Conditions
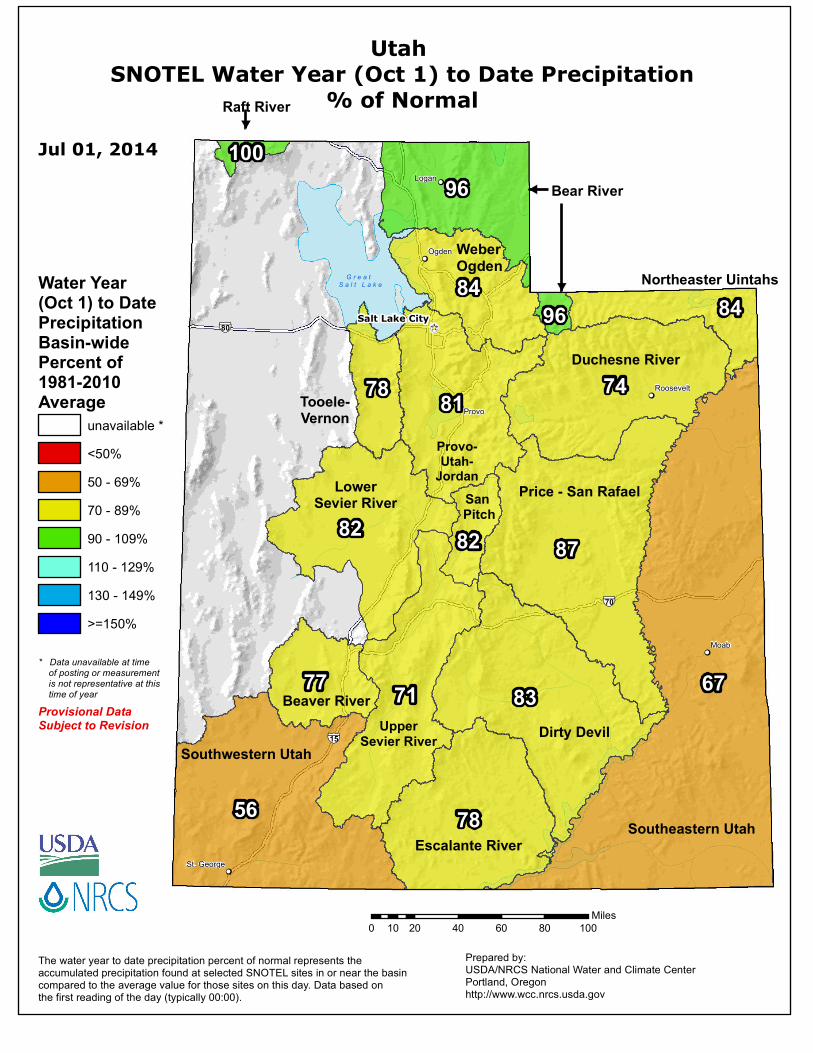
Current runoff for points with unregulated flow remains well below average for most of central and all of southern Utah.
In northern Utah, flow is near normal. Points shown in green (near normal conditions) are primarily where reservoir
releases keep stream flows higher. June precipitation ranged from 1% for southwest Utah (10 of 11 sites had zero
precipitation) to 68% on the Weber Basin. The statewide average was 48% compared to 8% of normal last year. 48% of
average is bad but at least it’s not 8%. Soil moisture is currently near normal in the north and very dry in the south.
Reservoir storage is declining, currently at 66% of capacity across the state, down 5% from last month and 4% less than
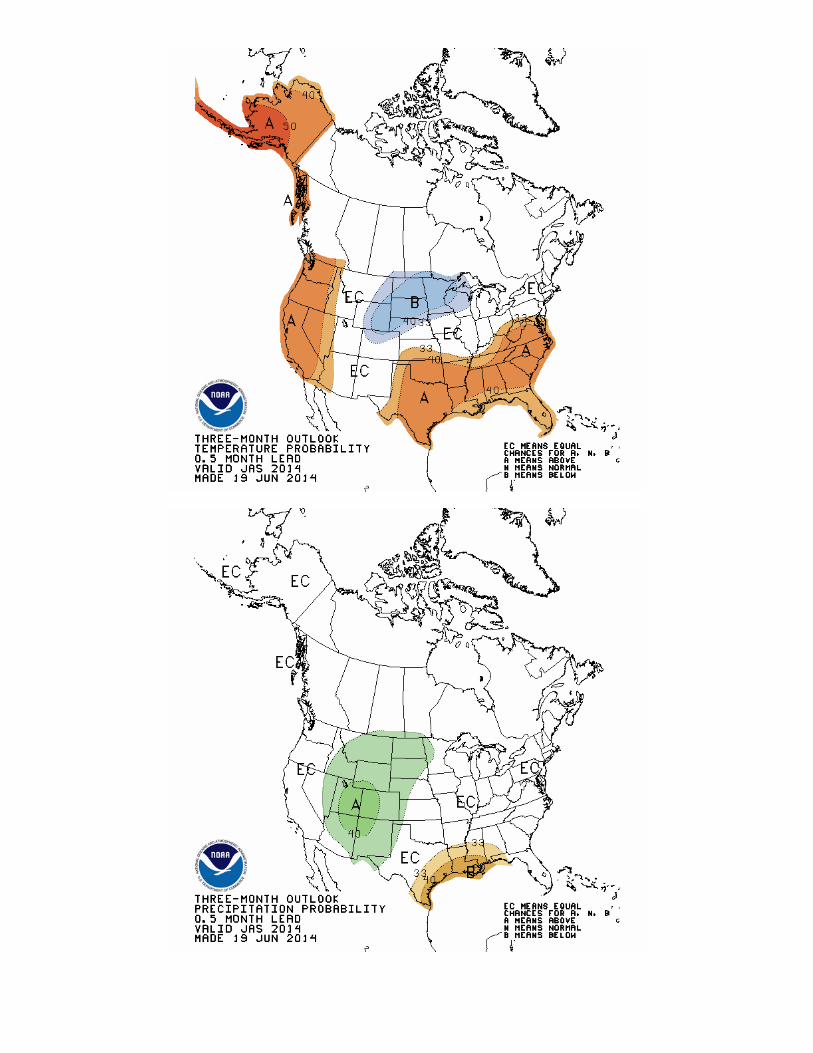
last year. Climate Prediction Center forecast for July-September indicate near normal temperatures and above normal
precipitation.
Current Utah Streamflow - Courtesy US Geological Survey
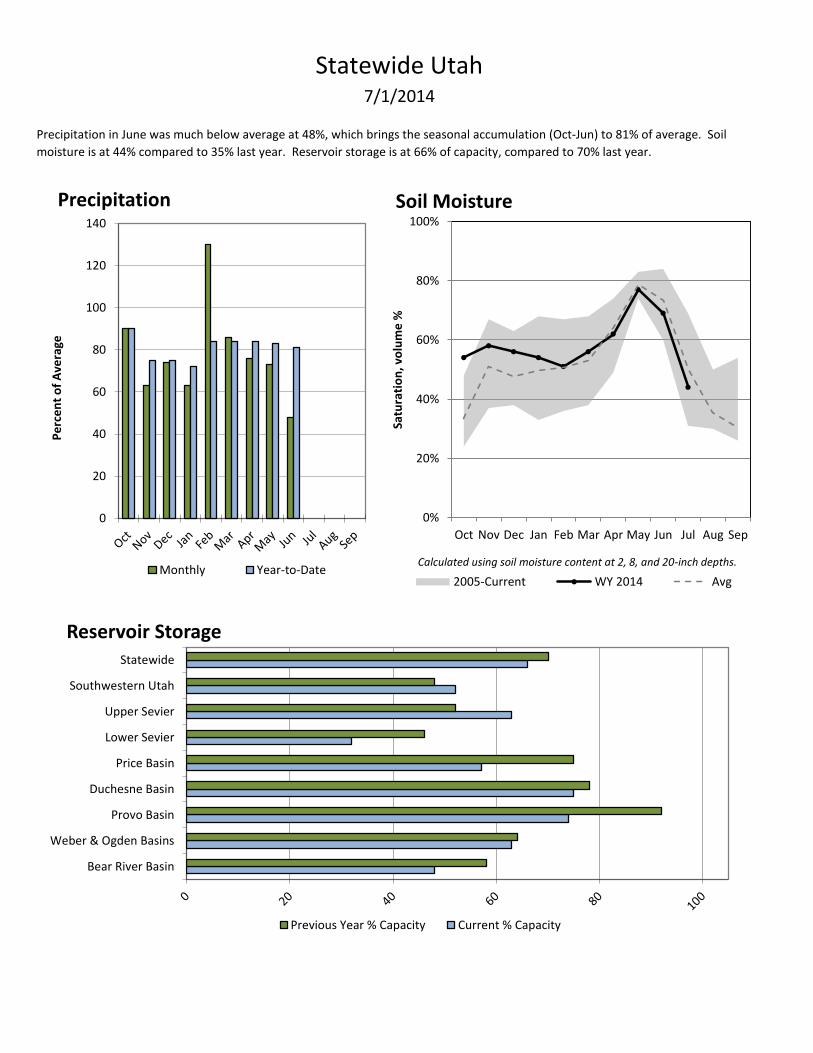
Statewide Utah
Reservoir ID
PREC
Oct
Nov
7/1/2014
Precipitation in June was much below average at 48%, which brings the seasonal accumulation (Oct-Jun) to 81% of average. Soil
moisture is at 44% compared to 35% last year. Reservoir storage is at 66% of capacity, compared to 70% last year.
Bear River Basin
Weber & Ogden Basins
Provo Basin
Duchesne Basin
Price Basin
Lower Sevier
Upper Sevier
Southwestern Utah
Statewide
Reservoir Storage
Previous Year % Capacity Current % Capacity
0%
20%
40%
60%
80%
100%
Oct Nov Dec Jan Feb Mar Apr May Jun Jul Aug Sep
Satu
rati
on
, vo
lum
e %
Soil Moisture
2005-Current WY 2014 Avg
Calculated using soil moisture content at 2, 8, and 20-inch depths.
0
20
40
60
80
100
120
140
Pe
rce
nt
of
Ave
rage
Precipitation
Monthly Year-to-Date
!!
!!
!!
!!
!!
!!
!_̂(
Moab
Provo
Ogden
Logan
Roosevelt
Salt Lake City
LowerSevier River
Southeastern Utah
Southwestern UtahDirty Devil
Raft River
Price - San Rafael
Duchesne River
Escalante River
Beaver River
Northeaster Uintahs
Provo-Utah-
Jordan
Tooele-Vernon
Bear River
67
56
87
83
74
78
71
82
81
96
84
77
84
78
82
96
100
§̈¦70
Utah SNOTEL Water Year (Oct 1) to Date Precipitation
% of Normal
0 20 40 60 80 10010Miles
§̈¦15
§̈¦80
Provisional Data Subject to Revision
G r e a t S a l t L a k eWater Year
(Oct 1) to Date PrecipitationBasin-wide Percent of 1981-2010Average
unavailable *<50%50 - 69%70 - 89%90 - 109%110 - 129%130 - 149%>=150%
Jul 01, 2014
St. George
* Data unavailable at time of posting or measurement is not representative at this time of year
Weber Ogden
Prepared by:USDA/NRCS National Water and Climate Center Portland, Oregonhttp://www.wcc.nrcs.usda.gov
The water year to date precipitation percent of normal represents the accumulated precipitation found at selected SNOTEL sites in or near the basin compared to the average value for those sites on this day. Data based on the first reading of the day (typically 00:00).
San Pitch
UpperSevier River
^
7/1/2014
MOAB
LOGAN
PROVO
OGDEN
Roosevelt
ST GEORGE
SALT LAKE CITY
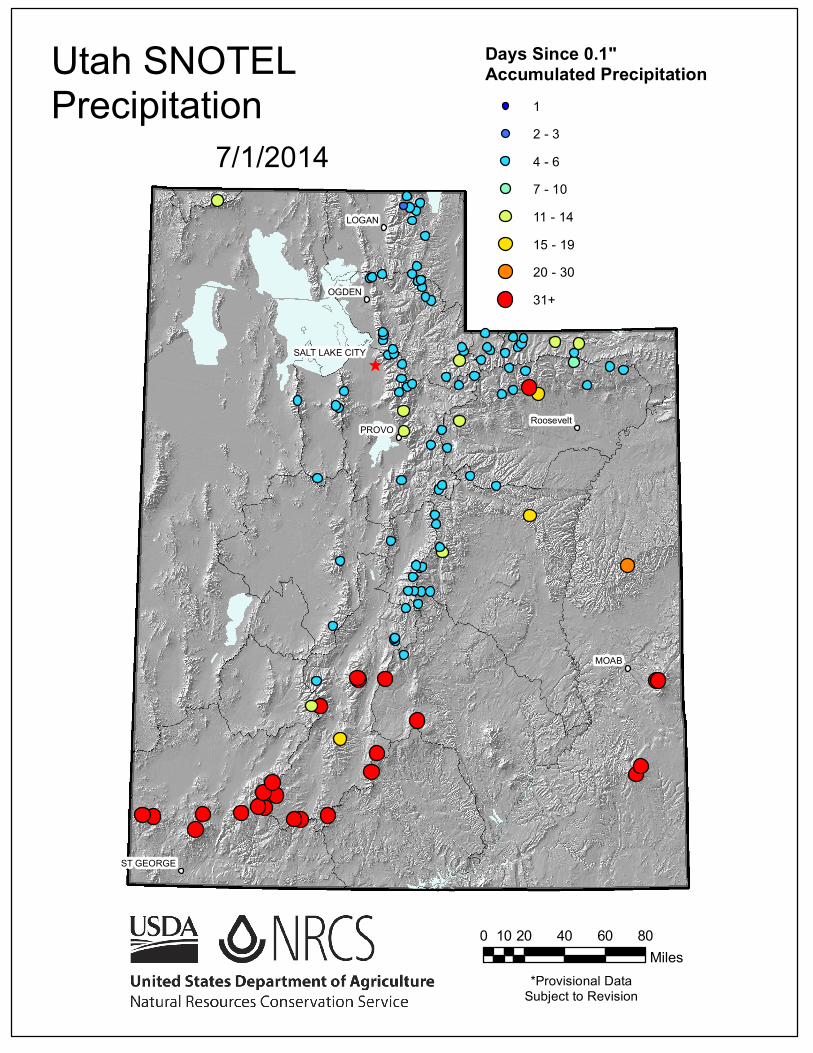
Days Since 0.1" Accumulated Precipitation
12 - 34 - 67 - 1011 - 1415 - 1920 - 3031+
Utah SNOTELPrecipitation
0 20 40 60 8010Miles
*Provisional DataSubject to Revision
^
7/1/2014
MOAB
LOGAN
PROVO
OGDEN
Roosevelt
ST GEORGE
SALT LAKE CITY
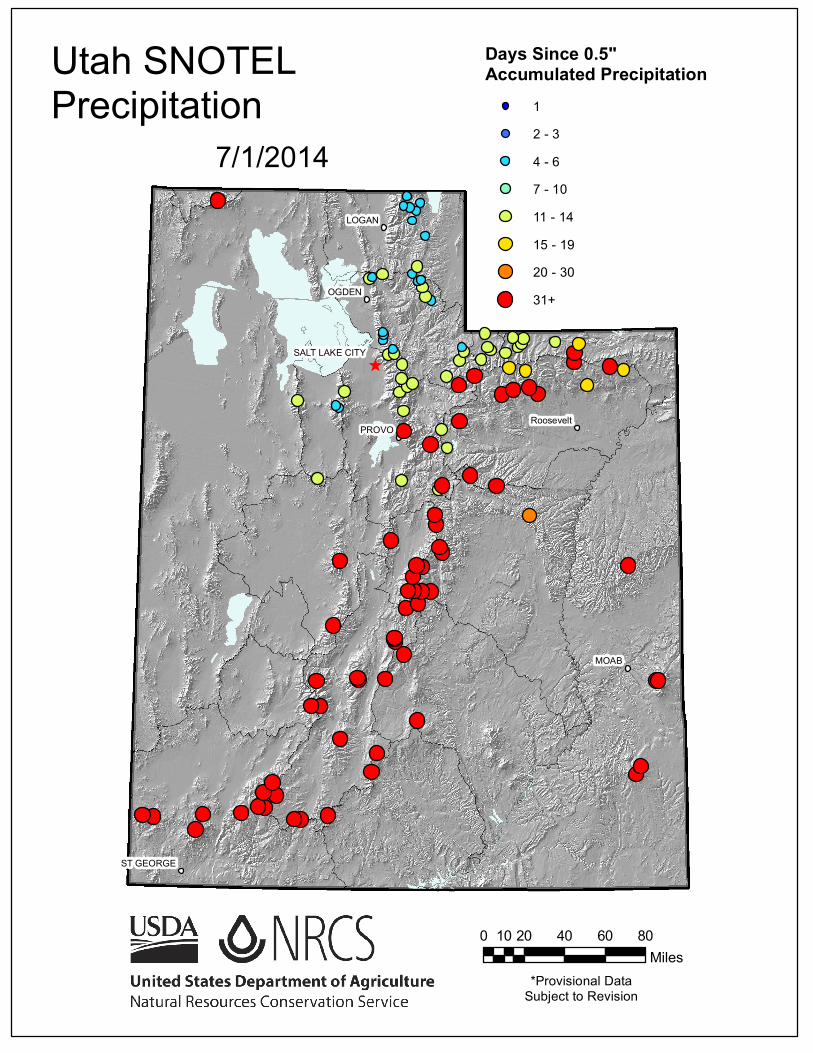
Days Since 0.5" Accumulated Precipitation
12 - 34 - 67 - 1011 - 1415 - 1920 - 3031+
Utah SNOTELPrecipitation
0 20 40 60 8010Miles
*Provisional DataSubject to Revision
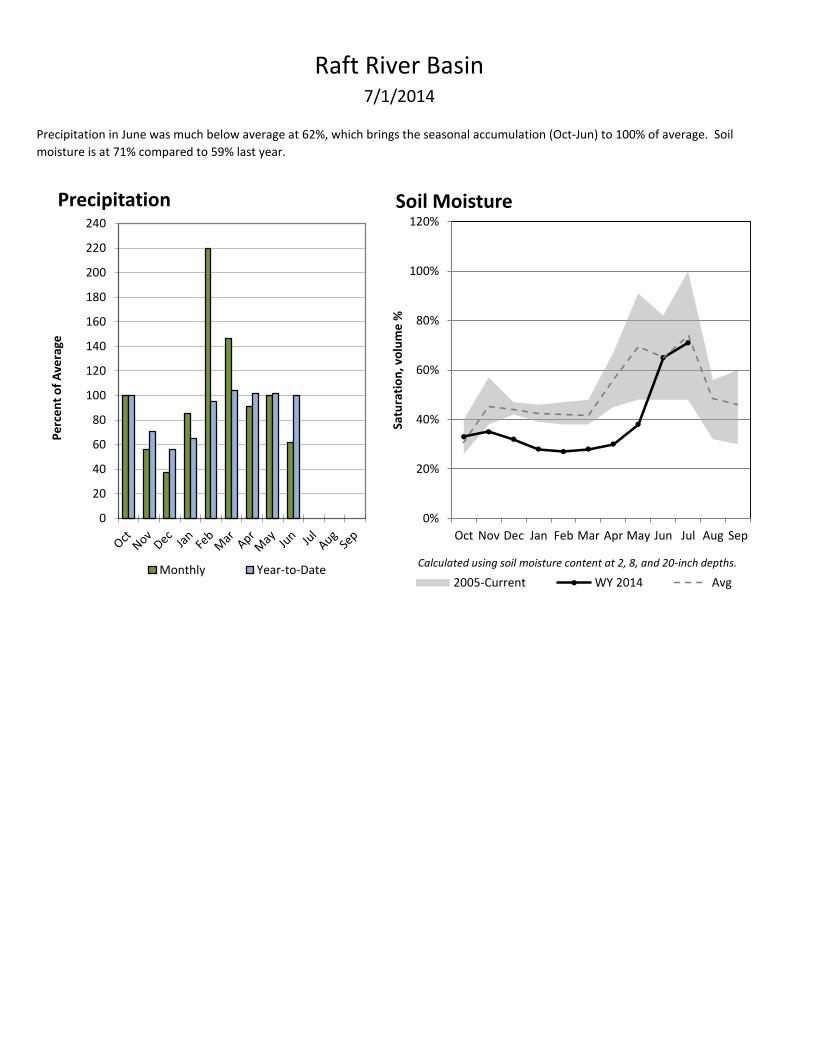
Raft River Basin
Reservoir ID
PREC
Oct
Nov
7/1/2014
Precipitation in June was much below average at 62%, which brings the seasonal accumulation (Oct-Jun) to 100% of average. Soil
moisture is at 71% compared to 59% last year.
0%
20%
40%
60%
80%
100%
120%
Oct Nov Dec Jan Feb Mar Apr May Jun Jul Aug Sep
Satu
rati
on
, vo
lum
e %
Soil Moisture
2005-Current WY 2014 Avg
Calculated using soil moisture content at 2, 8, and 20-inch depths.
0
20
40
60
80
100
120
140
160
180
200
220
240
Pe
rce
nt
of
Ave
rage
Precipitation
Monthly Year-to-Date
Bear River Basin
Reservoir ID
10055500
10107000
10105200
10020200
10UTWOOD
PREC
Oct
Nov
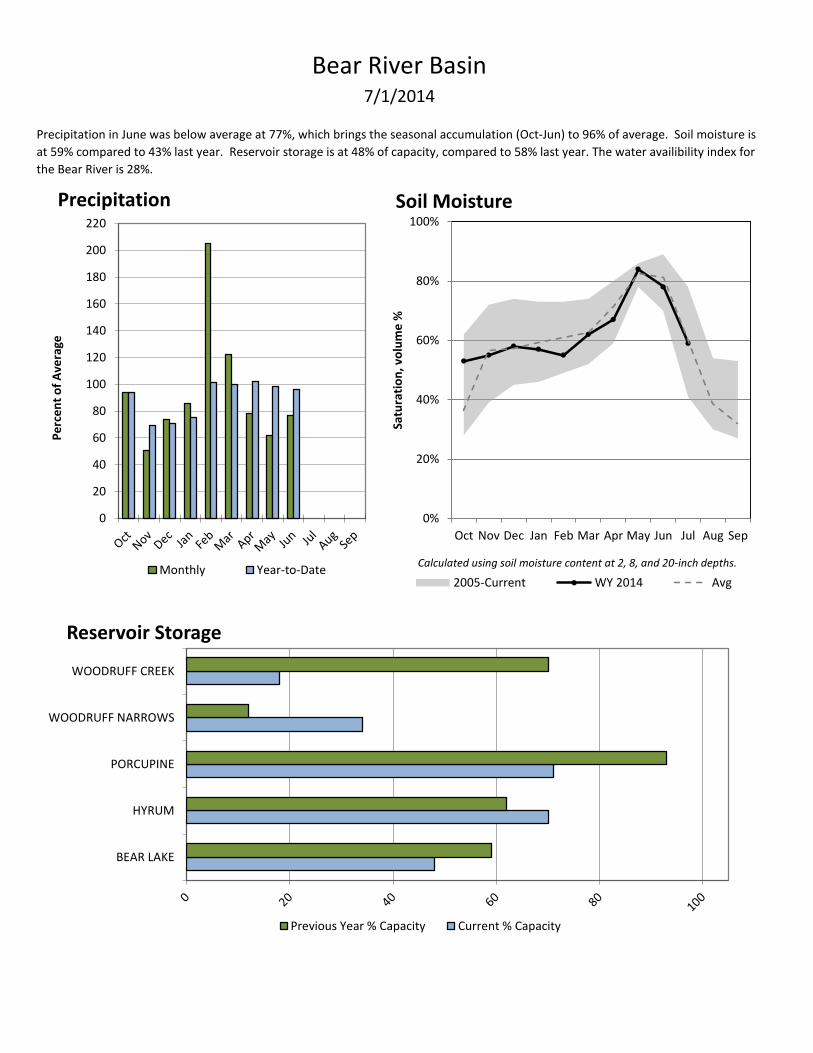
Precipitation in June was below average at 77%, which brings the seasonal accumulation (Oct-Jun) to 96% of average. Soil moisture is
at 59% compared to 43% last year. Reservoir storage is at 48% of capacity, compared to 58% last year. The water availibility index for
the Bear River is 28%.
7/1/2014
BEAR LAKE
HYRUM
PORCUPINE
WOODRUFF NARROWS
WOODRUFF CREEK
Reservoir Storage
Previous Year % Capacity Current % Capacity
0%
20%
40%
60%
80%
100%
Oct Nov Dec Jan Feb Mar Apr May Jun Jul Aug Sep
Satu
rati
on
, vo
lum
e %
Soil Moisture
2005-Current WY 2014 Avg
Calculated using soil moisture content at 2, 8, and 20-inch depths.
0
20
40
60
80
100
120
140
160
180
200
220
Pe
rce
nt
of
Ave
rage
Precipitation
Monthly Year-to-Date
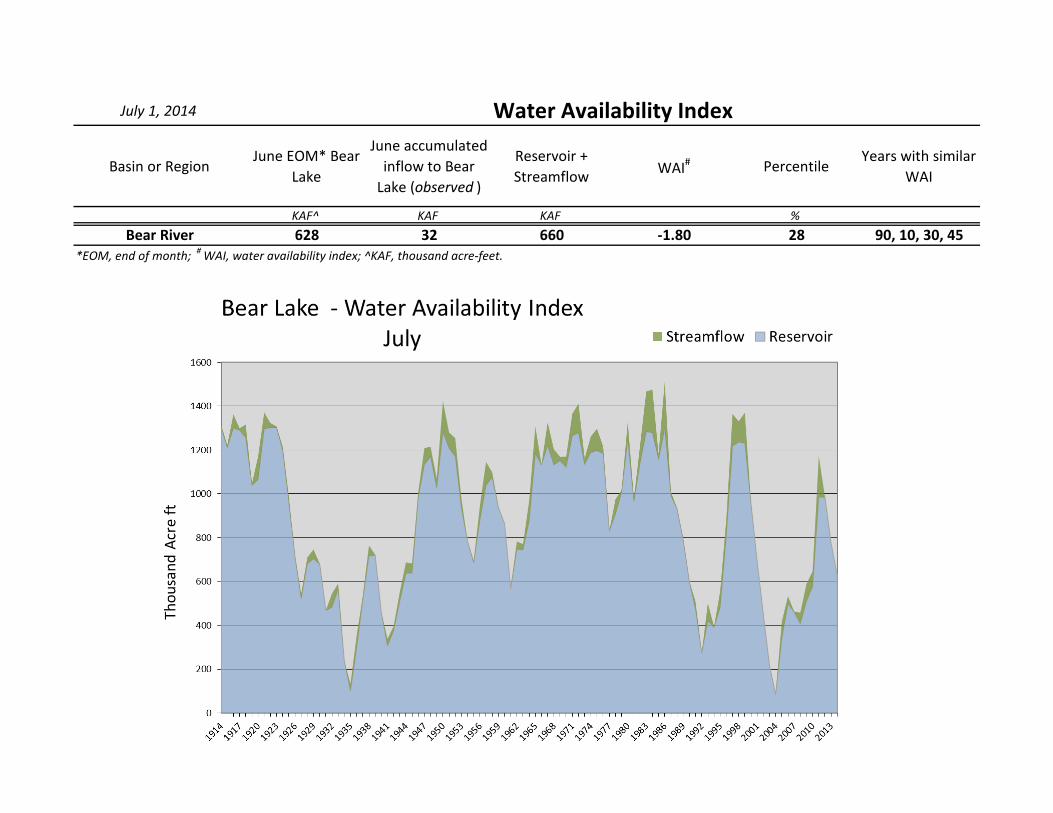
July 1, 2014
Basin or RegionJune EOM* Bear
Lake
June accumulated inflow to Bear
Lake (observed )
Reservoir + Streamflow WAI# Percentile
Years with similar WAI
KAF^ KAF KAF %Bear River 628 32 660 -1.80 28 90, 10, 30, 45
Water Availability Index
*EOM, end of month; # WAI, water availability index; ^KAF, thousand acre-feet.
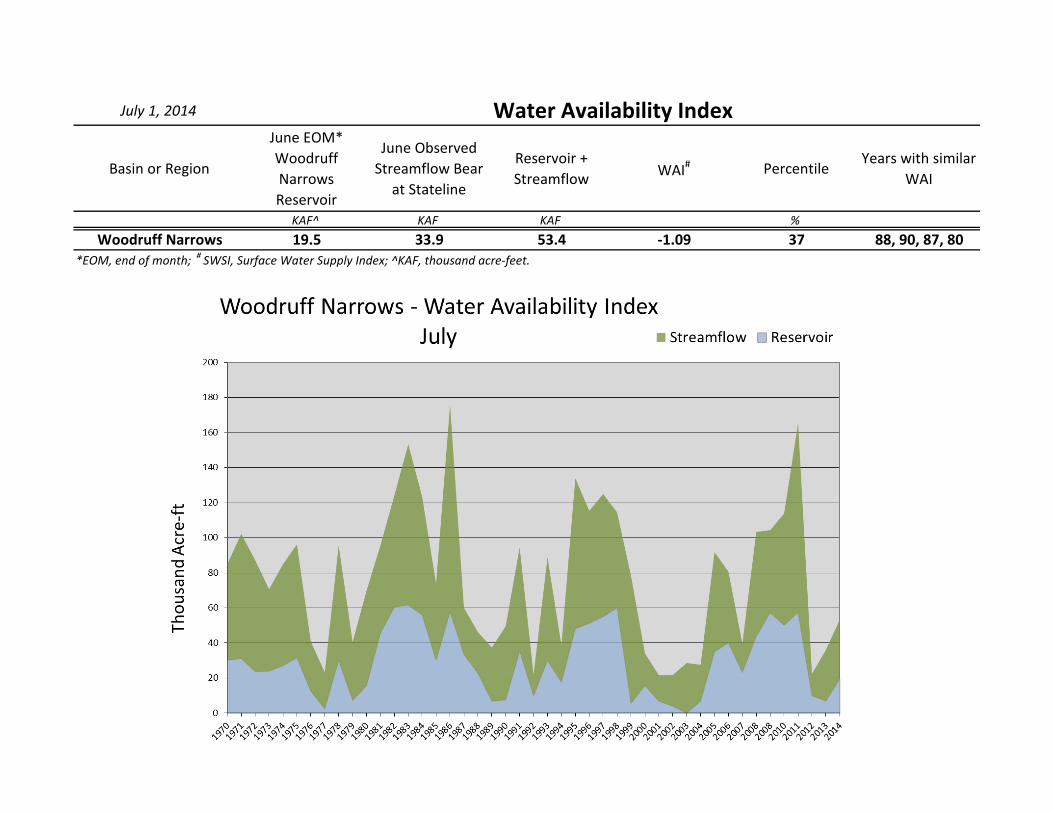
July 1, 2014
Basin or Region
June EOM* Woodruff Narrows Reservoir
June Observed Streamflow Bear
at Stateline
Reservoir + Streamflow WAI# Percentile
Years with similar WAI
KAF^ KAF KAF %Woodruff Narrows 19.5 33.9 53.4 -1.09 37 88, 90, 87, 80
*EOM, end of month; # SWSI, Surface Water Supply Index; ^KAF, thousand acre-feet.
Water Availability Index
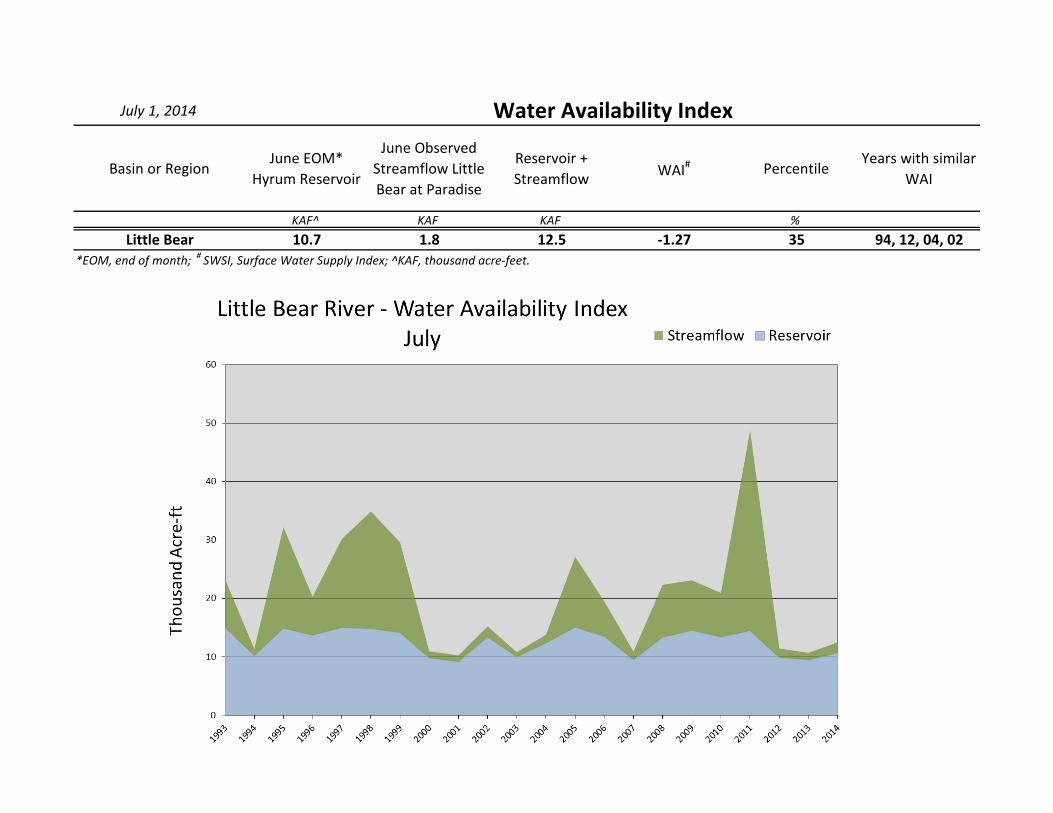
July 1, 2014
Basin or RegionJune EOM*
Hyrum Reservoir
June Observed Streamflow Little Bear at Paradise
Reservoir + Streamflow WAI# Percentile
Years with similar WAI
KAF^ KAF KAF %Little Bear 10.7 1.8 12.5 -1.27 35 94, 12, 04, 02
*EOM, end of month; # SWSI, Surface Water Supply Index; ^KAF, thousand acre-feet.
Water Availability Index
Weber & Ogden River Basins
Reservoir ID
10140800
10139000
10137290
10134000
10132490
10131500
10129400
10128000
PREC
Oct
Nov
7/1/2014
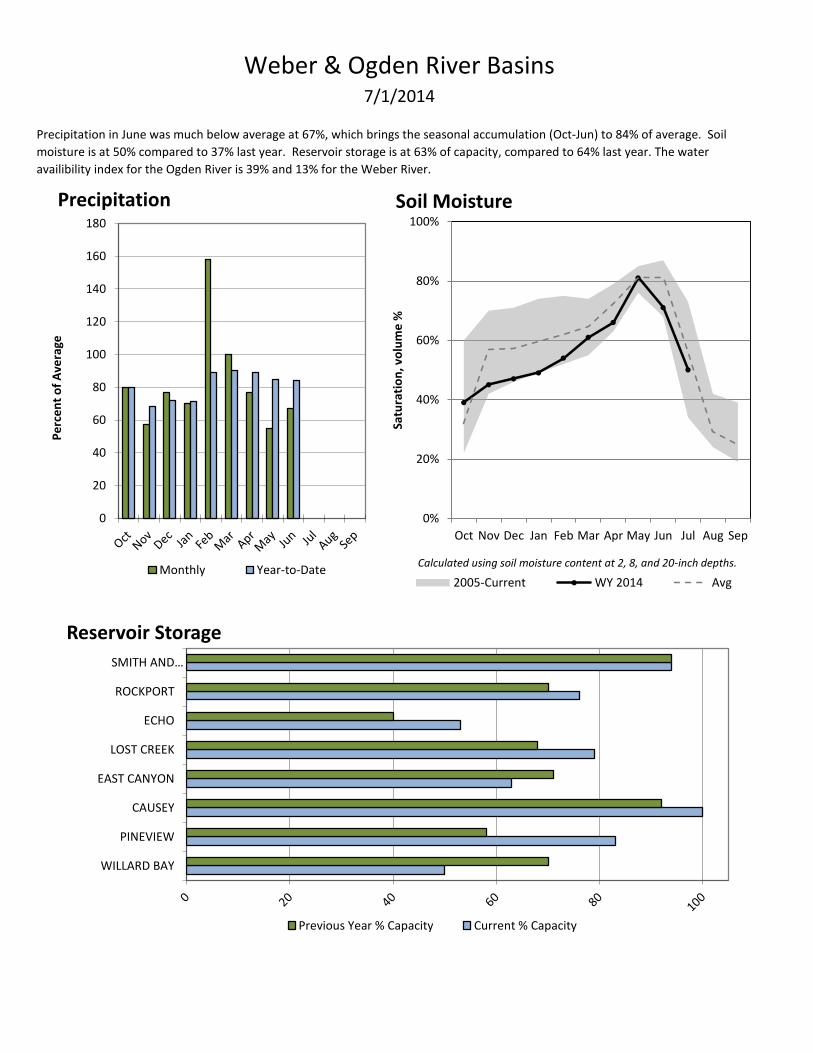
Precipitation in June was much below average at 67%, which brings the seasonal accumulation (Oct-Jun) to 84% of average. Soil
moisture is at 50% compared to 37% last year. Reservoir storage is at 63% of capacity, compared to 64% last year. The water
availibility index for the Ogden River is 39% and 13% for the Weber River.
WILLARD BAY
PINEVIEW
CAUSEY
EAST CANYON
LOST CREEK
ECHO
ROCKPORT
SMITH AND…
Reservoir Storage
Previous Year % Capacity Current % Capacity
0%
20%
40%
60%
80%
100%
Oct Nov Dec Jan Feb Mar Apr May Jun Jul Aug Sep
Satu
rati
on
, vo
lum
e %
Soil Moisture
2005-Current WY 2014 Avg
Calculated using soil moisture content at 2, 8, and 20-inch depths.
0
20
40
60
80
100
120
140
160
180
Pe
rce
nt
of
Ave
rage
Precipitation
Monthly Year-to-Date
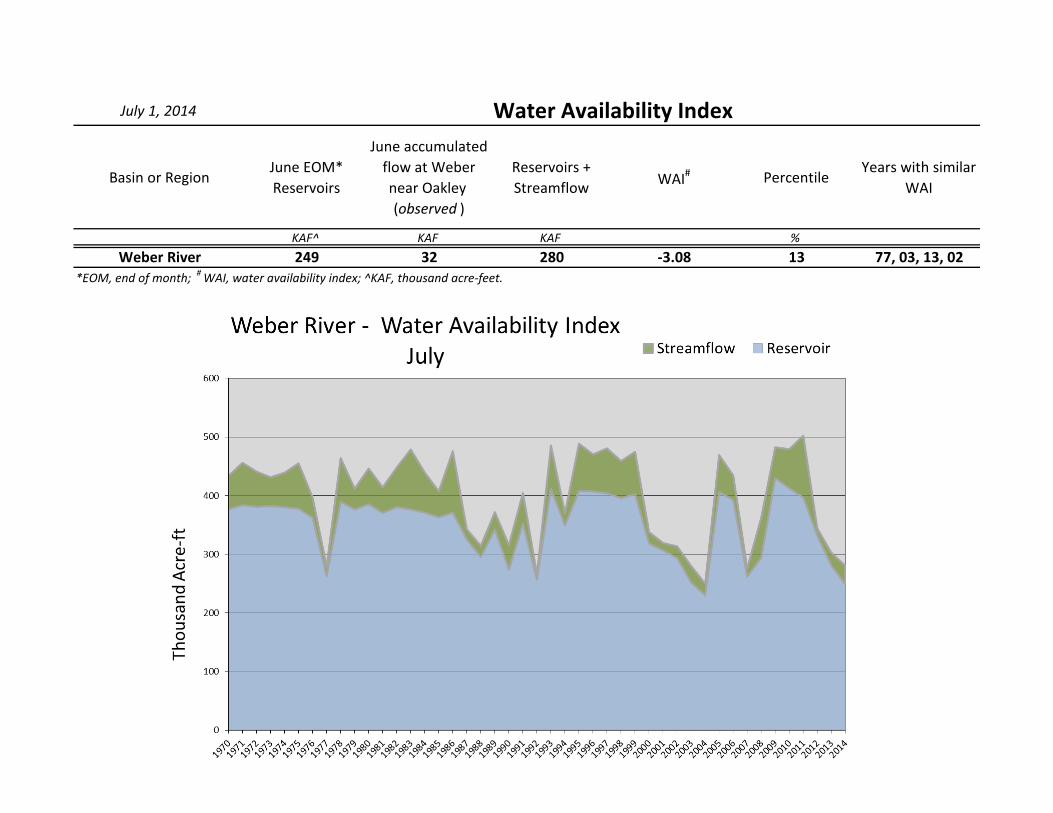
July 1, 2014
Basin or RegionJune EOM* Reservoirs
June accumulated flow at Weber near Oakley (observed )
Reservoirs + Streamflow WAI# Percentile
Years with similar WAI
KAF^ KAF KAF %Weber River 249 32 280 -3.08 13 77, 03, 13, 02
Water Availability Index
*EOM, end of month; # WAI, water availability index; ^KAF, thousand acre-feet.
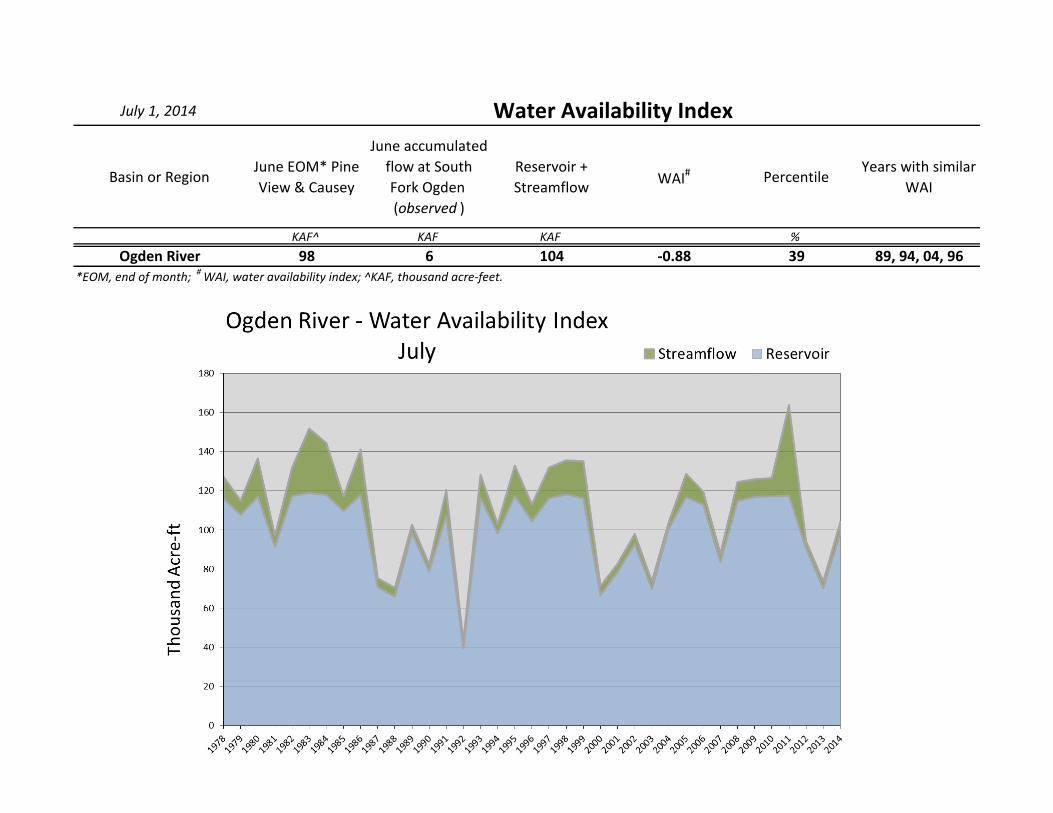
July 1, 2014
Basin or RegionJune EOM* Pine View & Causey
June accumulated flow at South Fork Ogden (observed )
Reservoir + Streamflow WAI# Percentile
Years with similar WAI
KAF^ KAF KAF %Ogden River 98 6 104 -0.88 39 89, 94, 04, 96
Water Availability Index
*EOM, end of month; # WAI, water availability index; ^KAF, thousand acre-feet.
Provo & Jordan River Basins
Reservoir ID
09282500
09278000
09UT06JJ10155050
10166500
PREC
Oct
Nov
7/1/2014
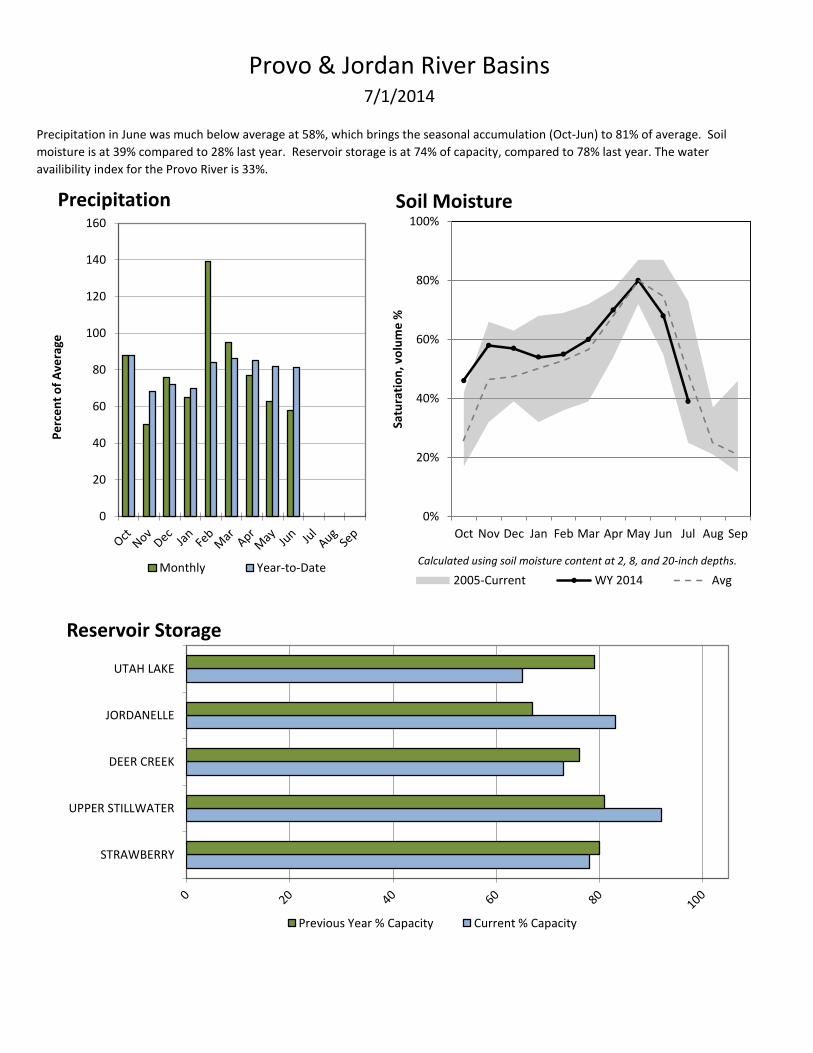
Precipitation in June was much below average at 58%, which brings the seasonal accumulation (Oct-Jun) to 81% of average. Soil
moisture is at 39% compared to 28% last year. Reservoir storage is at 74% of capacity, compared to 78% last year. The water
availibility index for the Provo River is 33%.
STRAWBERRY
UPPER STILLWATER
DEER CREEK
JORDANELLE
UTAH LAKE
Reservoir Storage
Previous Year % Capacity Current % Capacity
0%
20%
40%
60%
80%
100%
Oct Nov Dec Jan Feb Mar Apr May Jun Jul Aug Sep
Satu
rati
on
, vo
lum
e %
Soil Moisture
2005-Current WY 2014 Avg
Calculated using soil moisture content at 2, 8, and 20-inch depths.
0
20
40
60
80
100
120
140
160
Pe
rce
nt
of
Ave
rage
Precipitation
Monthly Year-to-Date
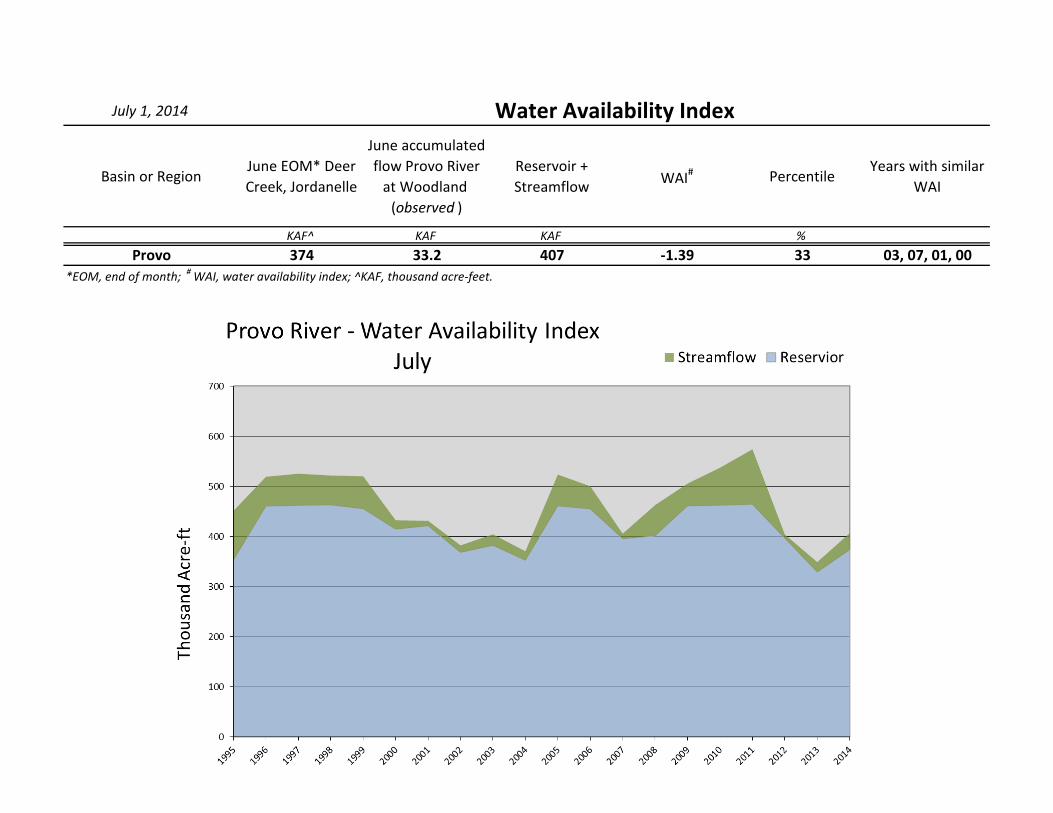
July 1, 2014
Basin or RegionJune EOM* Deer Creek, Jordanelle
June accumulated flow Provo River
at Woodland (observed )
Reservoir + Streamflow WAI# Percentile
Years with similar WAI
KAF^ KAF KAF %Provo 374 33.2 407 -1.39 33 03, 07, 01, 00
*EOM, end of month; # WAI, water availability index; ^KAF, thousand acre-feet.
Water Availability Index
Tooele & Vernon Creek Basins
Reservoir ID
10UTGTVL
10UT03JJ
10UTVERN
PREC
Oct
Nov
7/1/2014
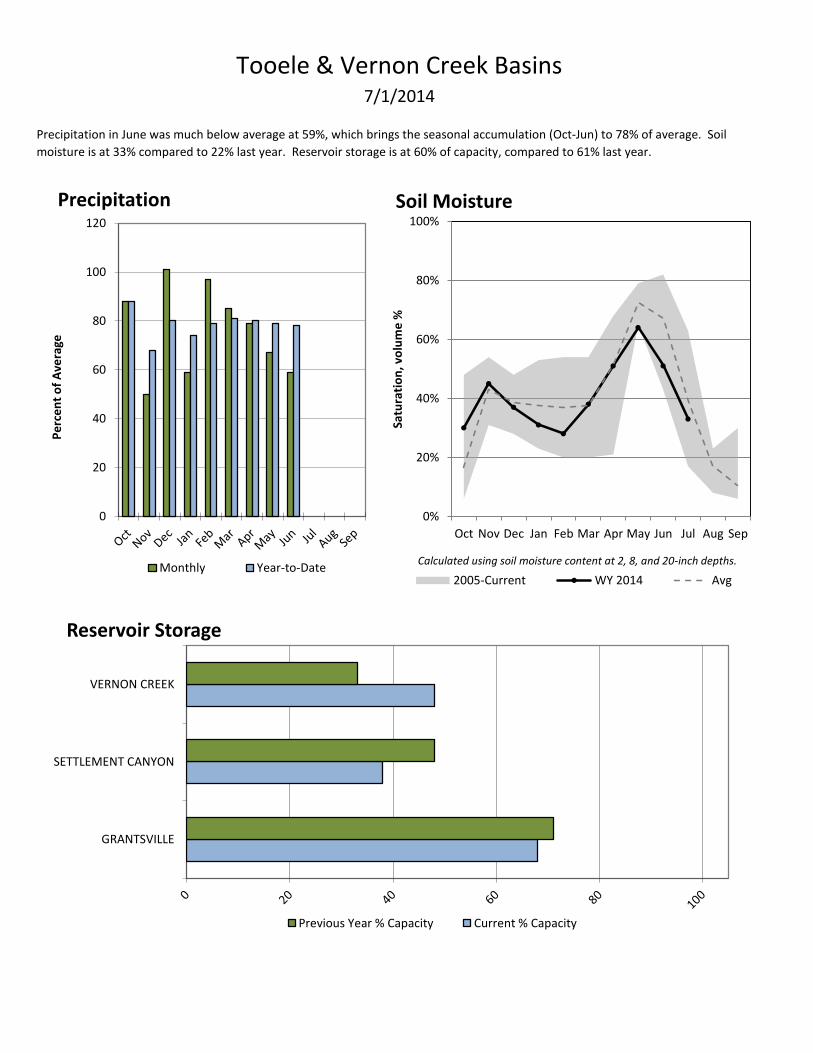
Precipitation in June was much below average at 59%, which brings the seasonal accumulation (Oct-Jun) to 78% of average. Soil
moisture is at 33% compared to 22% last year. Reservoir storage is at 60% of capacity, compared to 61% last year.
GRANTSVILLE
SETTLEMENT CANYON
VERNON CREEK
Reservoir Storage
Previous Year % Capacity Current % Capacity
0%
20%
40%
60%
80%
100%
Oct Nov Dec Jan Feb Mar Apr May Jun Jul Aug Sep
Satu
rati
on
, vo
lum
e %
Soil Moisture
2005-Current WY 2014 Avg
Calculated using soil moisture content at 2, 8, and 20-inch depths.
0
20
40
60
80
100
120
Pe
rce
nt
of
Ave
rage
Precipitation
Monthly Year-to-Date
Northeastern Uintah Basin
Reservoir ID
09234400
09219600
09218400
PREC
Oct
Nov
7/1/2014
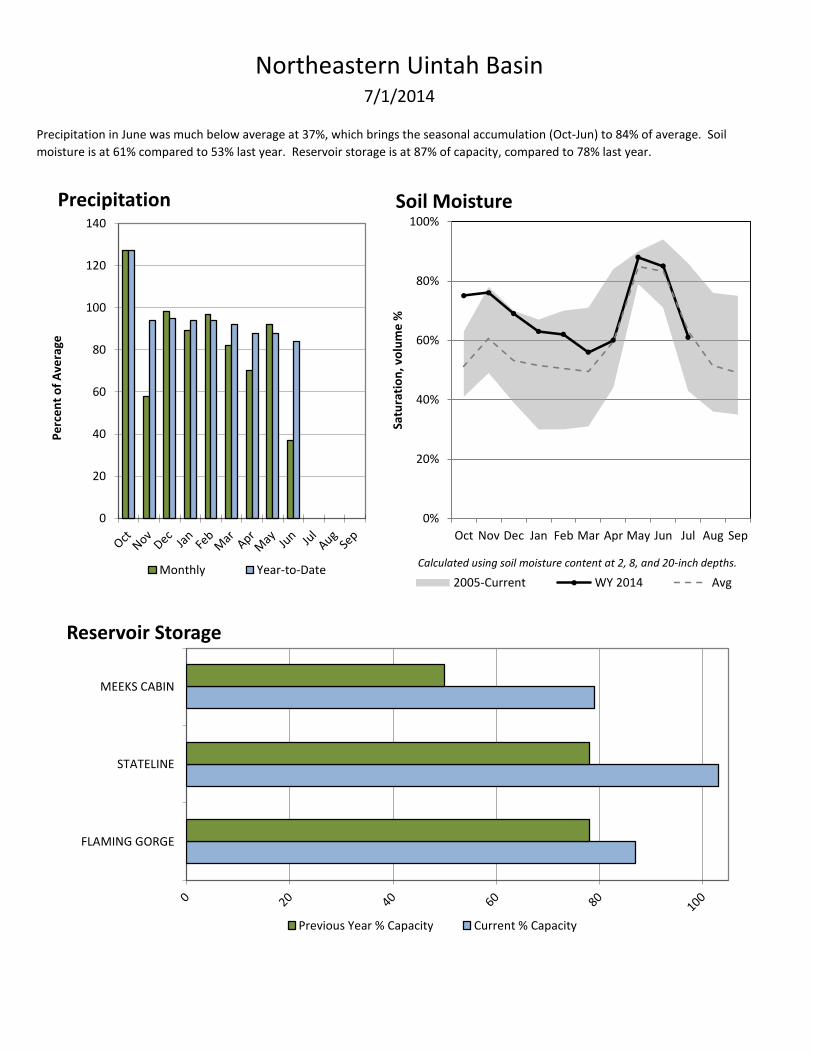
Precipitation in June was much below average at 37%, which brings the seasonal accumulation (Oct-Jun) to 84% of average. Soil
moisture is at 61% compared to 53% last year. Reservoir storage is at 87% of capacity, compared to 78% last year.
FLAMING GORGE
STATELINE
MEEKS CABIN
Reservoir Storage
Previous Year % Capacity Current % Capacity
0%
20%
40%
60%
80%
100%
Oct Nov Dec Jan Feb Mar Apr May Jun Jul Aug Sep
Satu
rati
on
, vo
lum
e %
Soil Moisture
2005-Current WY 2014 Avg
Calculated using soil moisture content at 2, 8, and 20-inch depths.
0
20
40
60
80
100
120
140
Pe
rce
nt
of
Ave
rage
Precipitation
Monthly Year-to-Date
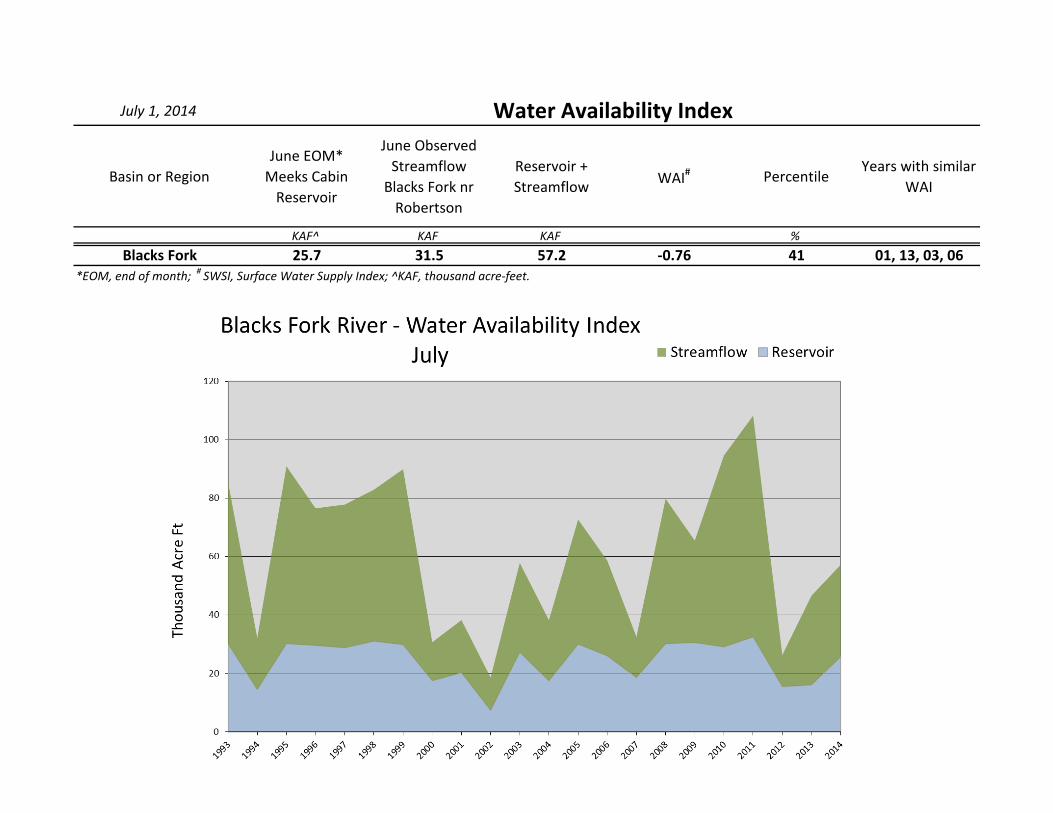
July 1, 2014
Basin or RegionJune EOM*
Meeks Cabin Reservoir
June Observed Streamflow
Blacks Fork nr Robertson
Reservoir + Streamflow WAI# Percentile
Years with similar WAI
KAF^ KAF KAF %Blacks Fork 25.7 31.5 57.2 -0.76 41 01, 13, 03, 06
*EOM, end of month; # SWSI, Surface Water Supply Index; ^KAF, thousand acre-feet.
Water Availability Index
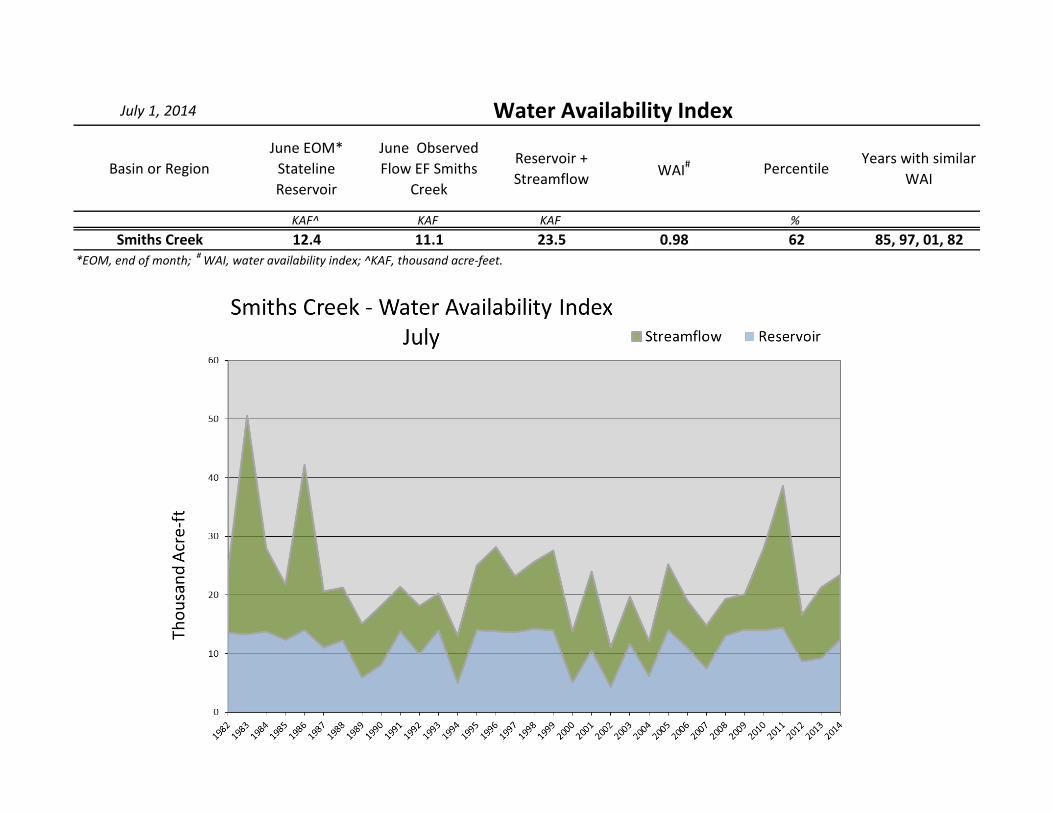
July 1, 2014
Basin or RegionJune EOM*
Stateline Reservoir
June Observed Flow EF Smiths
Creek
Reservoir + Streamflow WAI# Percentile
Years with similar WAI
KAF^ KAF KAF %Smiths Creek 12.4 11.1 23.5 0.98 62 85, 97, 01, 82
Water Availability Index
*EOM, end of month; # WAI, water availability index; ^KAF, thousand acre-feet.
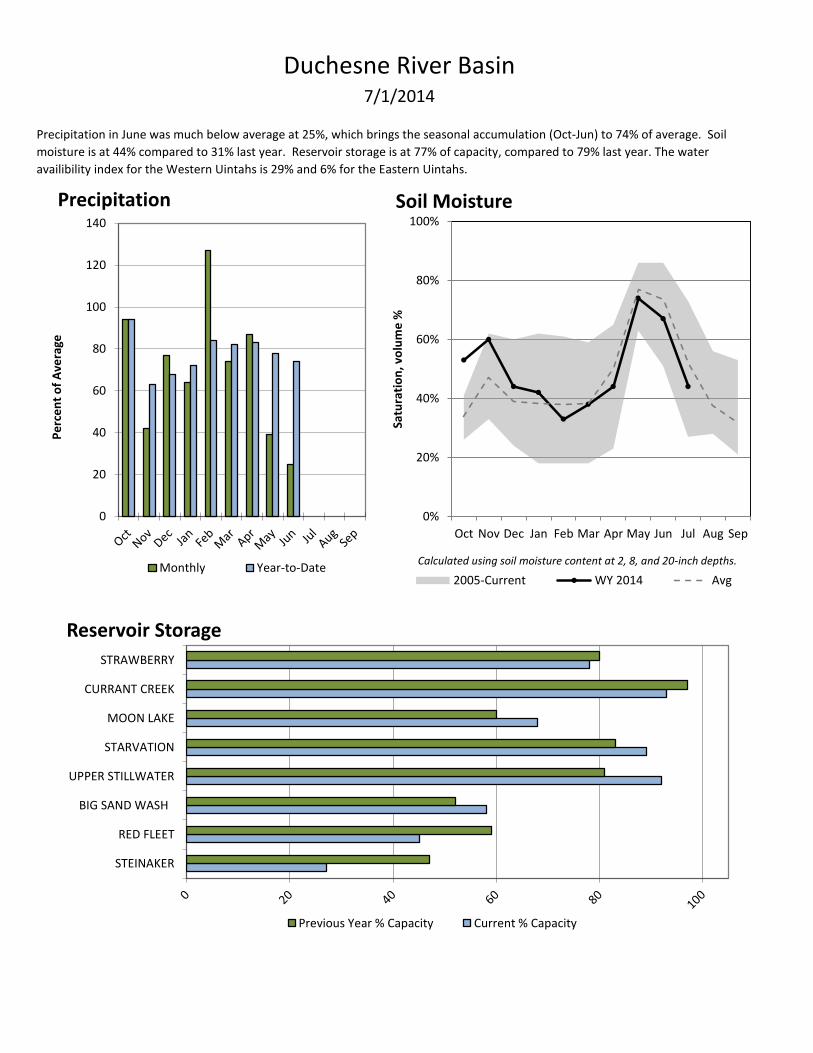
Duchesne River Basin
Reservoir ID
09271300
09UTREDF
09UTBSWR09278000
09UT02JJ
09290500
09UTCURR
09282500
PREC
Oct
Nov
7/1/2014
Precipitation in June was much below average at 25%, which brings the seasonal accumulation (Oct-Jun) to 74% of average. Soil
moisture is at 44% compared to 31% last year. Reservoir storage is at 77% of capacity, compared to 79% last year. The water
availibility index for the Western Uintahs is 29% and 6% for the Eastern Uintahs.
STEINAKER
RED FLEET
BIG SAND WASH
UPPER STILLWATER
STARVATION
MOON LAKE
CURRANT CREEK
STRAWBERRY
Reservoir Storage
Previous Year % Capacity Current % Capacity
0%
20%
40%
60%
80%
100%
Oct Nov Dec Jan Feb Mar Apr May Jun Jul Aug Sep
Satu
rati
on
, vo
lum
e %
Soil Moisture
2005-Current WY 2014 Avg
Calculated using soil moisture content at 2, 8, and 20-inch depths.
0
20
40
60
80
100
120
140
Pe
rce
nt
of
Ave
rage
Precipitation
Monthly Year-to-Date
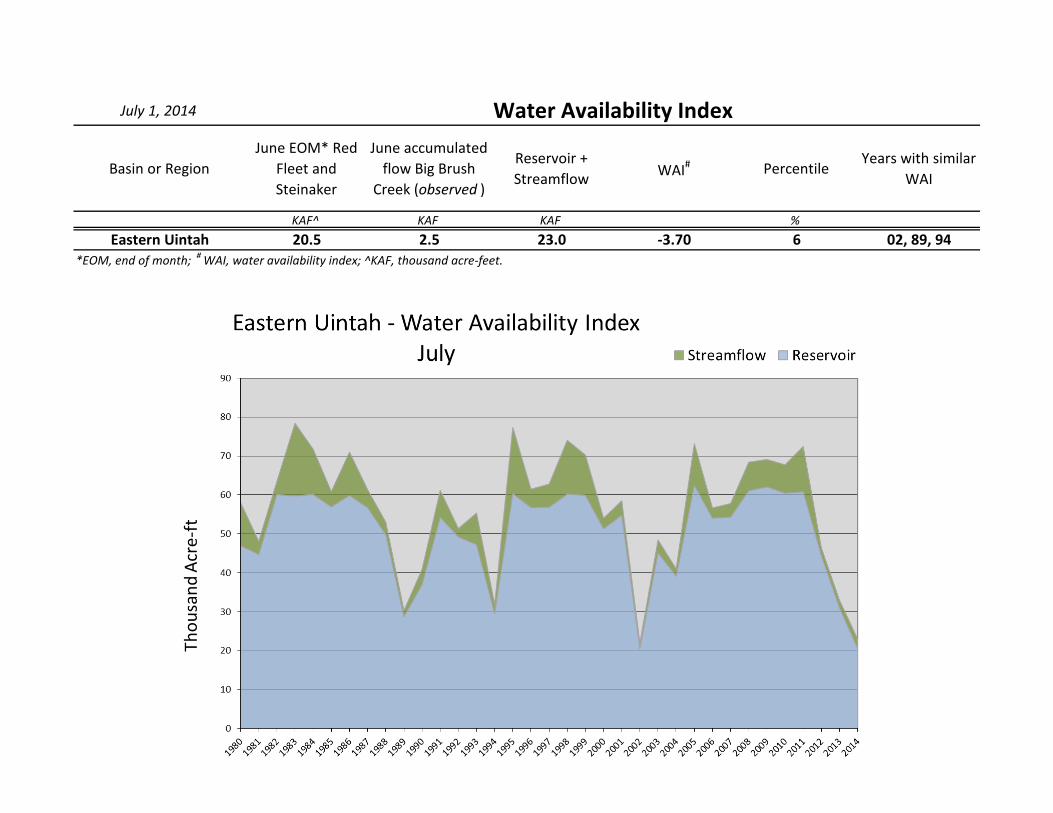
July 1, 2014
Basin or RegionJune EOM* Red
Fleet and Steinaker
June accumulated flow Big Brush
Creek (observed )
Reservoir + Streamflow WAI# Percentile
Years with similar WAI
KAF^ KAF KAF %Eastern Uintah 20.5 2.5 23.0 -3.70 6 02, 89, 94
Water Availability Index
*EOM, end of month; # WAI, water availability index; ^KAF, thousand acre-feet.
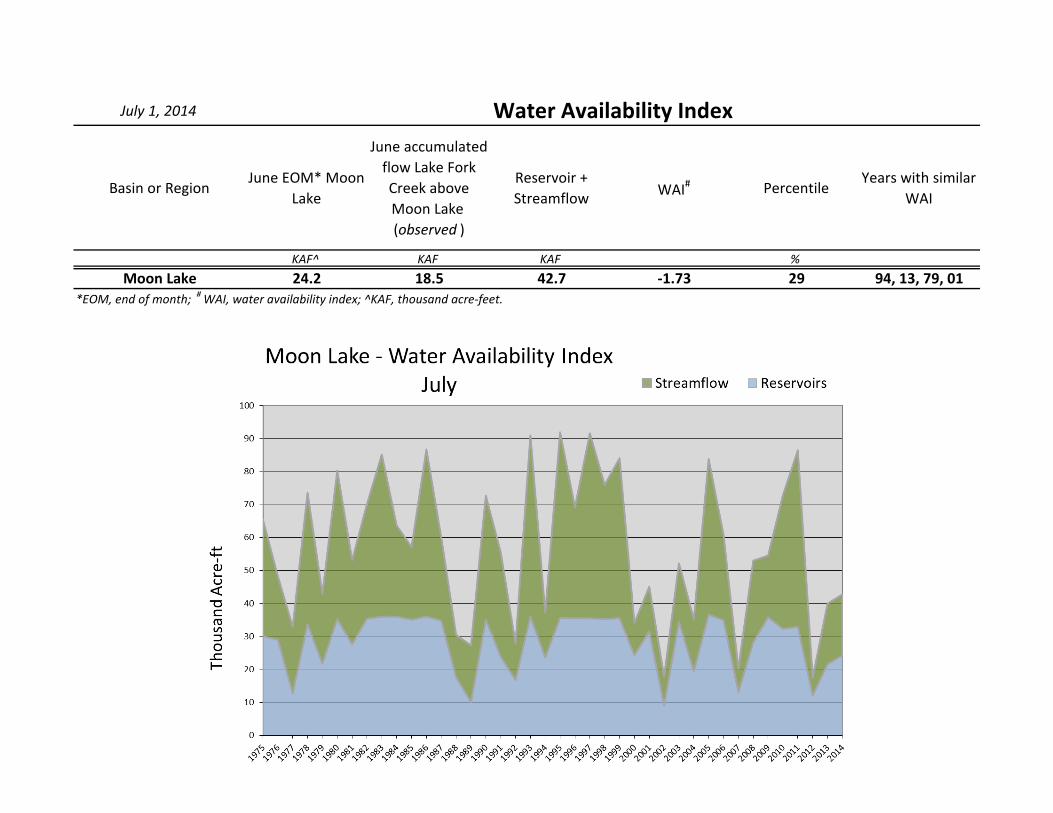
July 1, 2014
Basin or RegionJune EOM* Moon
Lake
June accumulated flow Lake Fork Creek above Moon Lake (observed )
Reservoir + Streamflow WAI# Percentile
Years with similar WAI
KAF^ KAF KAF %Moon Lake 24.2 18.5 42.7 -1.73 29 94, 13, 79, 01
Water Availability Index
*EOM, end of month; # WAI, water availability index; ^KAF, thousand acre-feet.
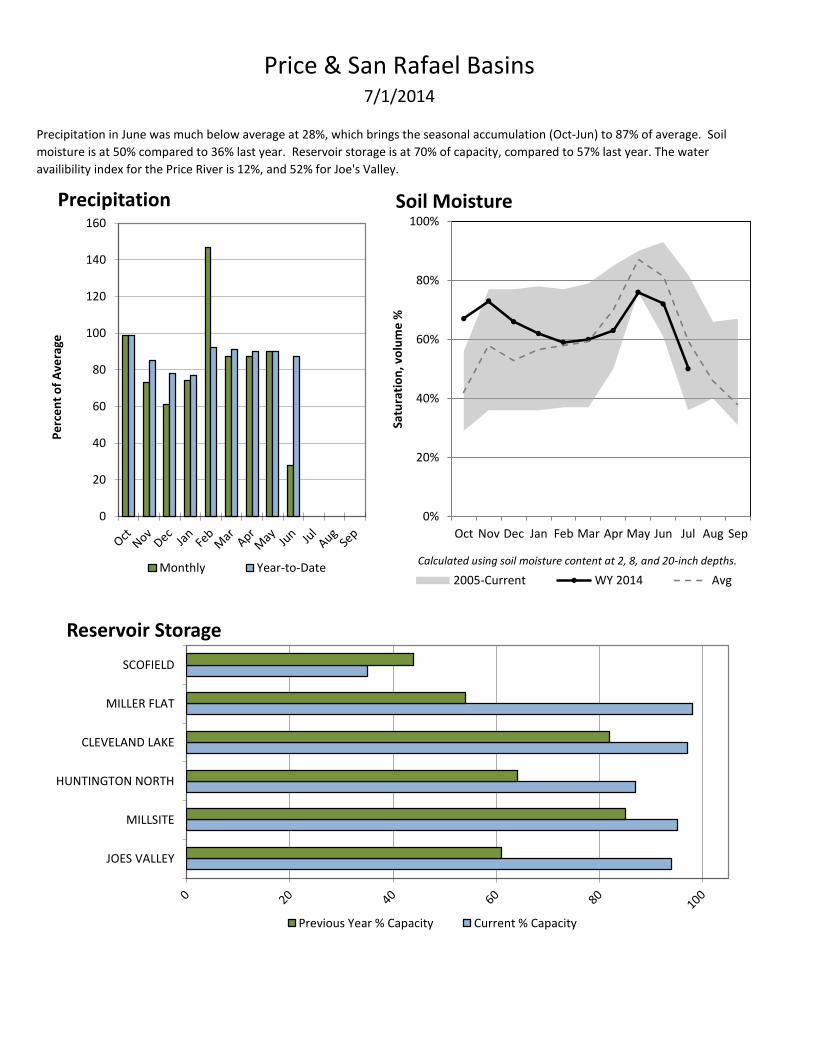
Price & San Rafael Basins
Reservoir ID
09323900
09UTMILL
09UTHUNT09UTCLEV
09UTMILF
09311000
PREC
Oct
Nov
7/1/2014
Precipitation in June was much below average at 28%, which brings the seasonal accumulation (Oct-Jun) to 87% of average. Soil
moisture is at 50% compared to 36% last year. Reservoir storage is at 70% of capacity, compared to 57% last year. The water
availibility index for the Price River is 12%, and 52% for Joe's Valley.
JOES VALLEY
MILLSITE
HUNTINGTON NORTH
CLEVELAND LAKE
MILLER FLAT
SCOFIELD
Reservoir Storage
Previous Year % Capacity Current % Capacity
0%
20%
40%
60%
80%
100%
Oct Nov Dec Jan Feb Mar Apr May Jun Jul Aug Sep
Satu
rati
on
, vo
lum
e %
Soil Moisture
2005-Current WY 2014 Avg
Calculated using soil moisture content at 2, 8, and 20-inch depths.
0
20
40
60
80
100
120
140
160
Pe
rce
nt
of
Ave
rage
Precipitation
Monthly Year-to-Date
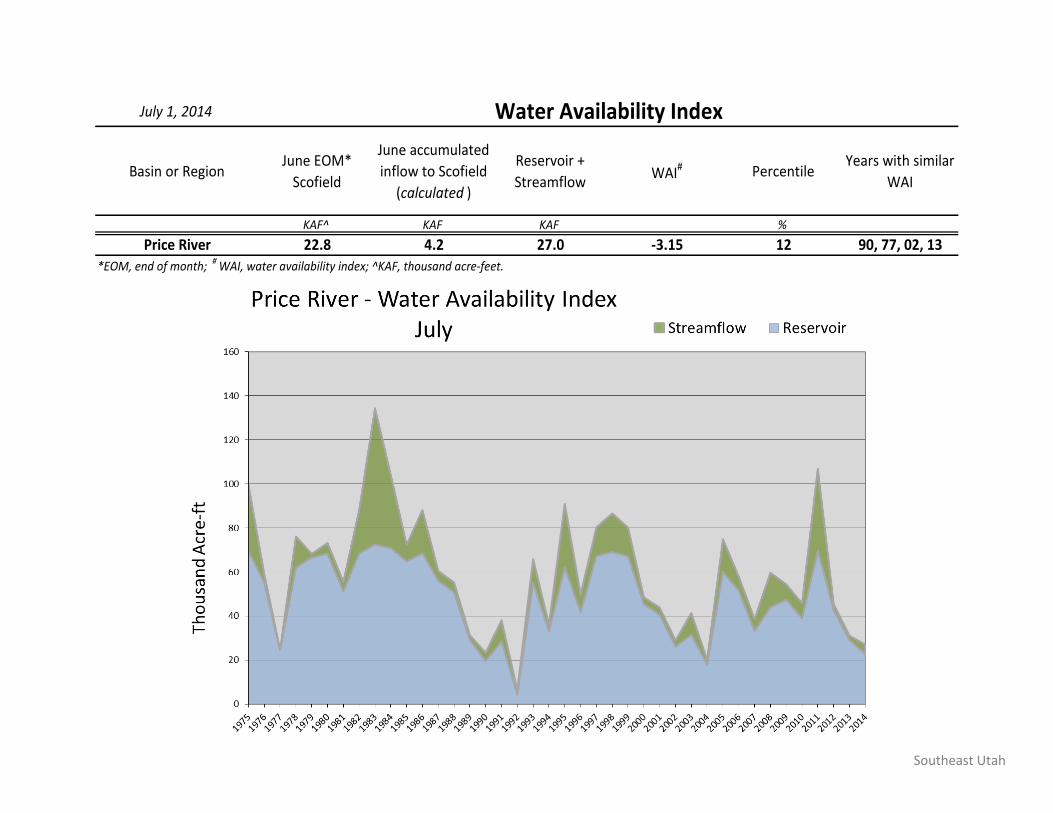
Southeast Utah
July 1, 2014
Basin or RegionJune EOM*
Scofield
June accumulated
inflow to Scofield
(calculated )
Reservoir +
StreamflowWAI# Percentile
Years with similar
WAI
KAF^ KAF KAF %
Price River 22.8 4.2 27.0 -3.15 12 90, 77, 02, 13
Water Availability Index
*EOM, end of month; # WAI, water availability index; ^KAF, thousand acre-feet.
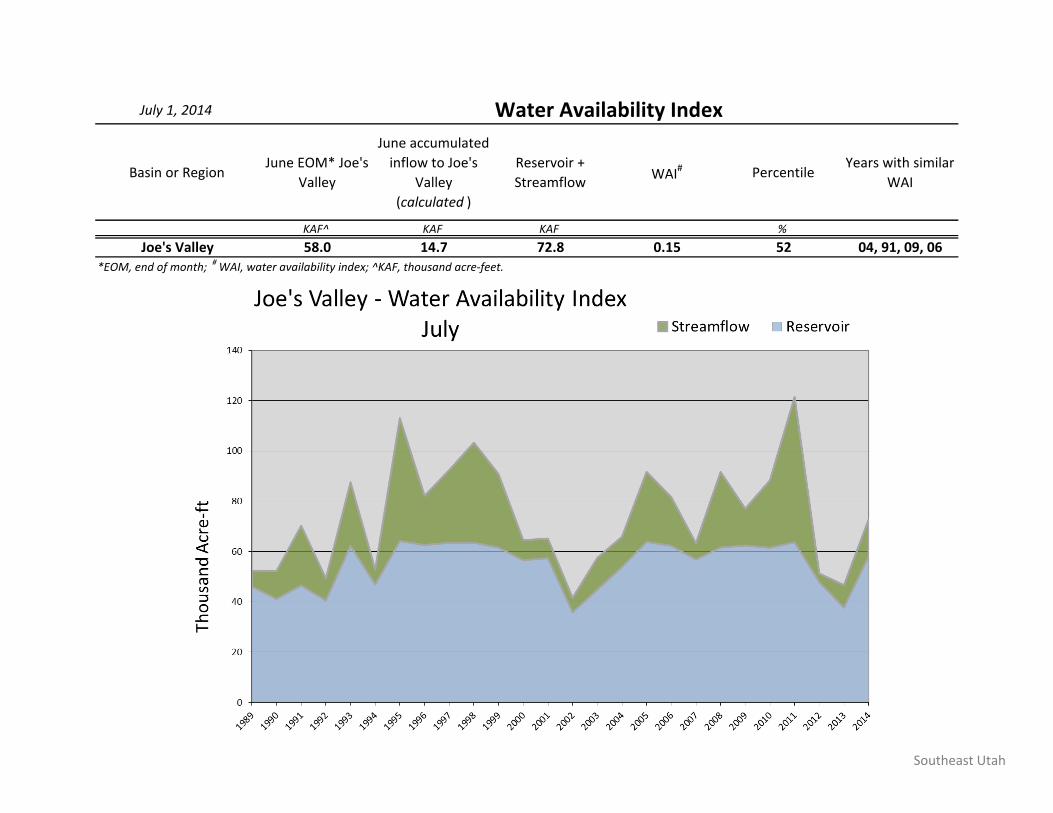
Southeast Utah
July 1, 2014
Basin or RegionJune EOM* Joe's
Valley
June accumulated
inflow to Joe's
Valley
(calculated )
Reservoir +
StreamflowWAI# Percentile
Years with similar
WAI
KAF^ KAF KAF %
Joe's Valley 58.0 14.7 72.8 0.15 52 04, 91, 09, 06
Water Availability Index
*EOM, end of month; # WAI, water availability index; ^KAF, thousand acre-feet.
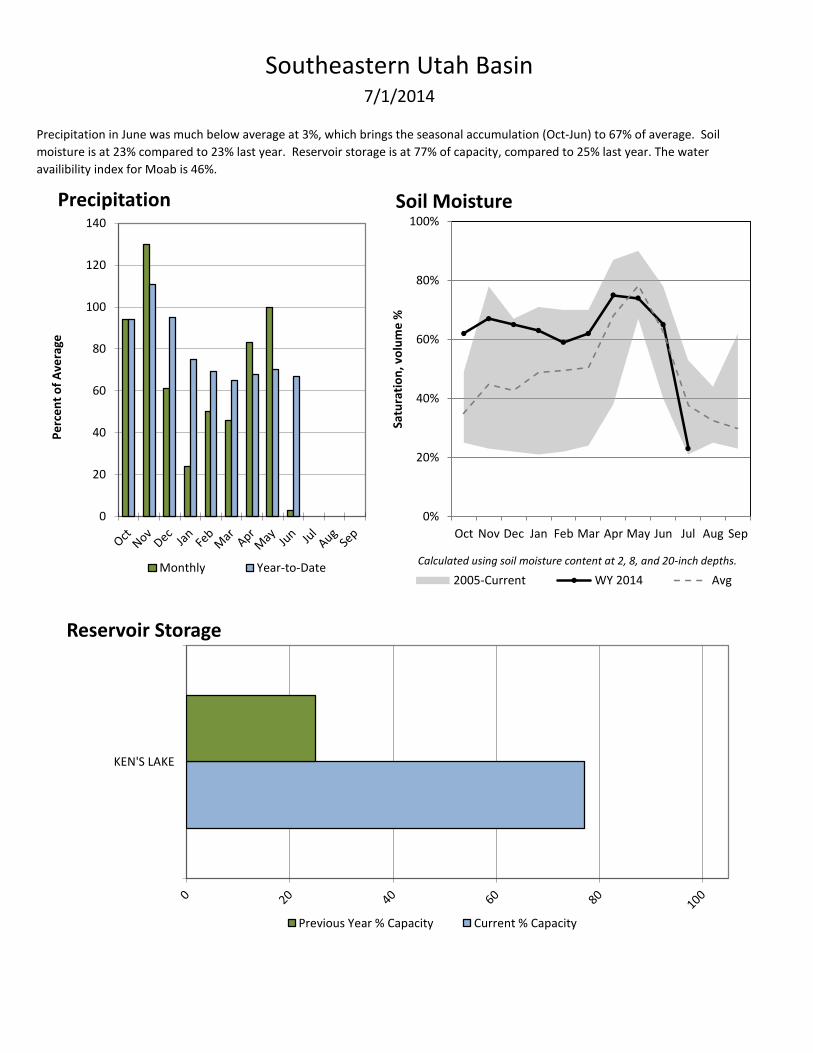
Southeastern Utah Basin
Reservoir ID
09UTKENS
PREC
Oct
Nov
7/1/2014
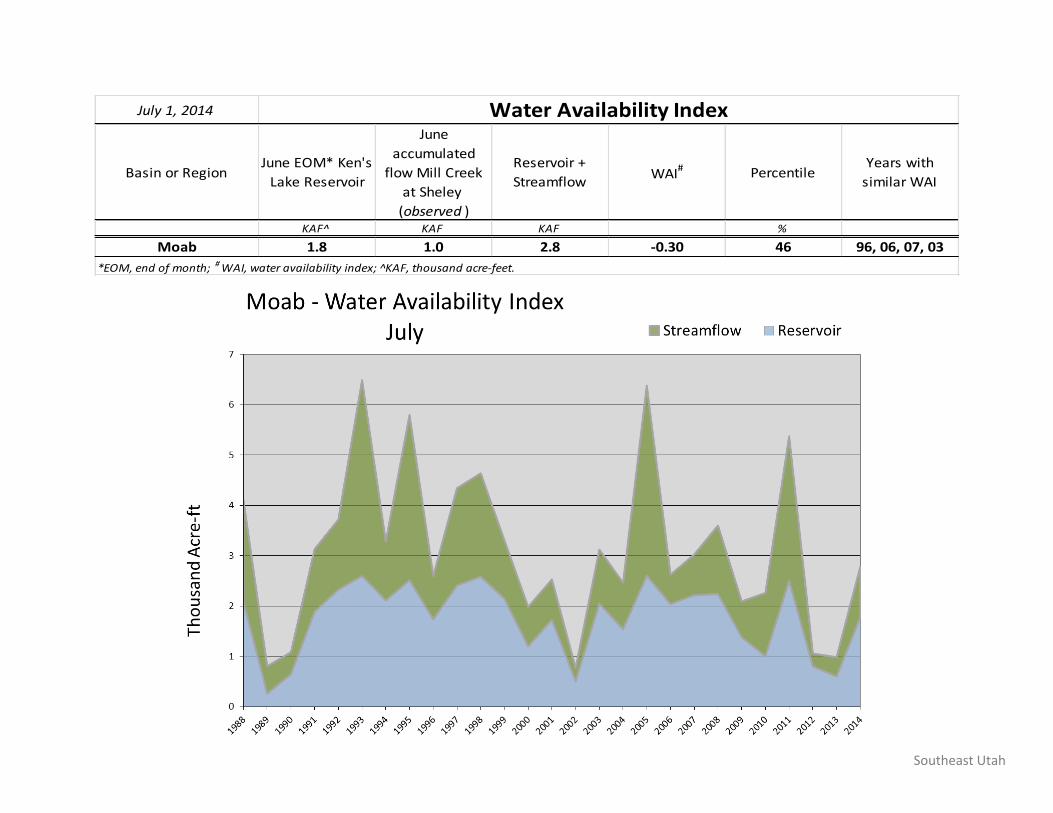
Precipitation in June was much below average at 3%, which brings the seasonal accumulation (Oct-Jun) to 67% of average. Soil
moisture is at 23% compared to 23% last year. Reservoir storage is at 77% of capacity, compared to 25% last year. The water
availibility index for Moab is 46%.
KEN'S LAKE
Reservoir Storage
Previous Year % Capacity Current % Capacity
0%
20%
40%
60%
80%
100%
Oct Nov Dec Jan Feb Mar Apr May Jun Jul Aug Sep
Satu
rati
on
, vo
lum
e %
Soil Moisture
2005-Current WY 2014 Avg
Calculated using soil moisture content at 2, 8, and 20-inch depths.
0
20
40
60
80
100
120
140
Pe
rce
nt
of
Ave
rage
Precipitation
Monthly Year-to-Date
Southeast Utah
July 1, 2014
Basin or RegionJune EOM* Ken's
Lake Reservoir
June
accumulated
flow Mill Creek
at Sheley
(observed )
Reservoir +
StreamflowWAI# Percentile
Years with
similar WAI
KAF^ KAF KAF %
Moab 1.8 1.0 2.8 -0.30 46 96, 06, 07, 03
Water Availability Index
*EOM, end of month; # WAI, water availability index; ^KAF, thousand acre-feet.
Dirty Devil Basin
Reservoir ID
PREC
Oct
Nov
7/1/2014
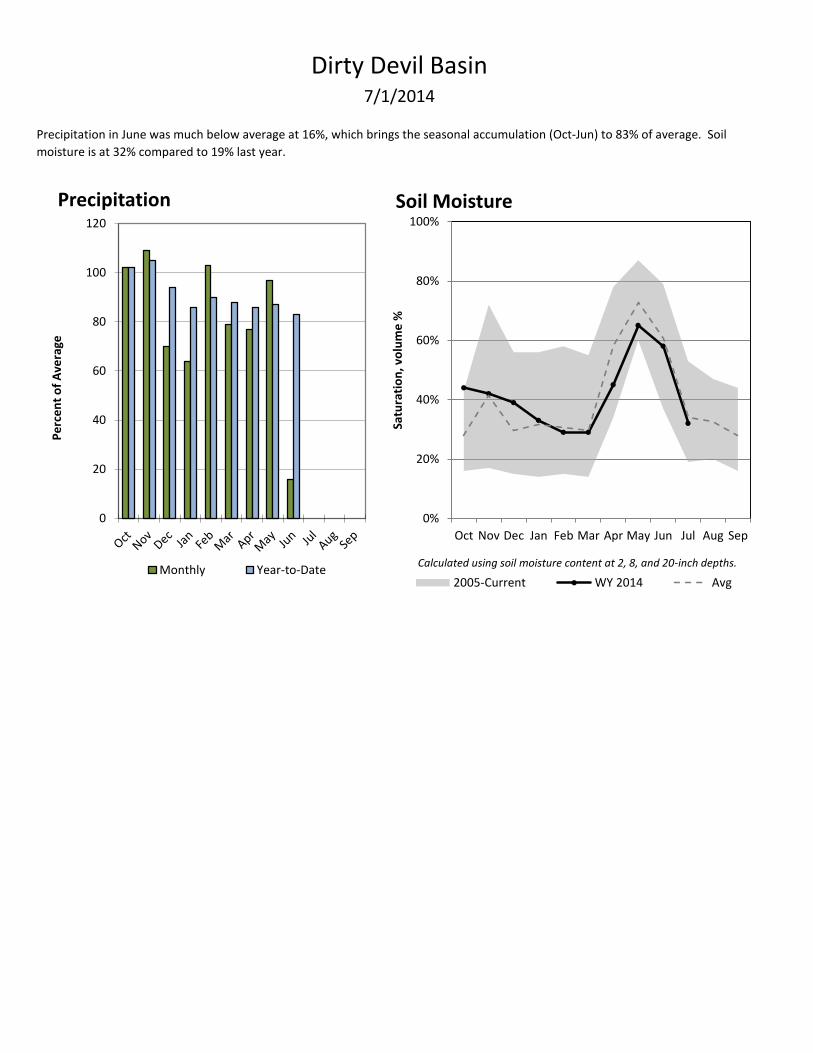
Precipitation in June was much below average at 16%, which brings the seasonal accumulation (Oct-Jun) to 83% of average. Soil
moisture is at 32% compared to 19% last year.
0%
20%
40%
60%
80%
100%
Oct Nov Dec Jan Feb Mar Apr May Jun Jul Aug Sep
Satu
rati
on
, vo
lum
e %
Soil Moisture
2005-Current WY 2014 Avg
Calculated using soil moisture content at 2, 8, and 20-inch depths.
0
20
40
60
80
100
120
Pe
rce
nt
of
Ave
rage
Precipitation
Monthly Year-to-Date
Escalante River Basin
Reservoir ID
PREC
Oct
Nov
7/1/2014
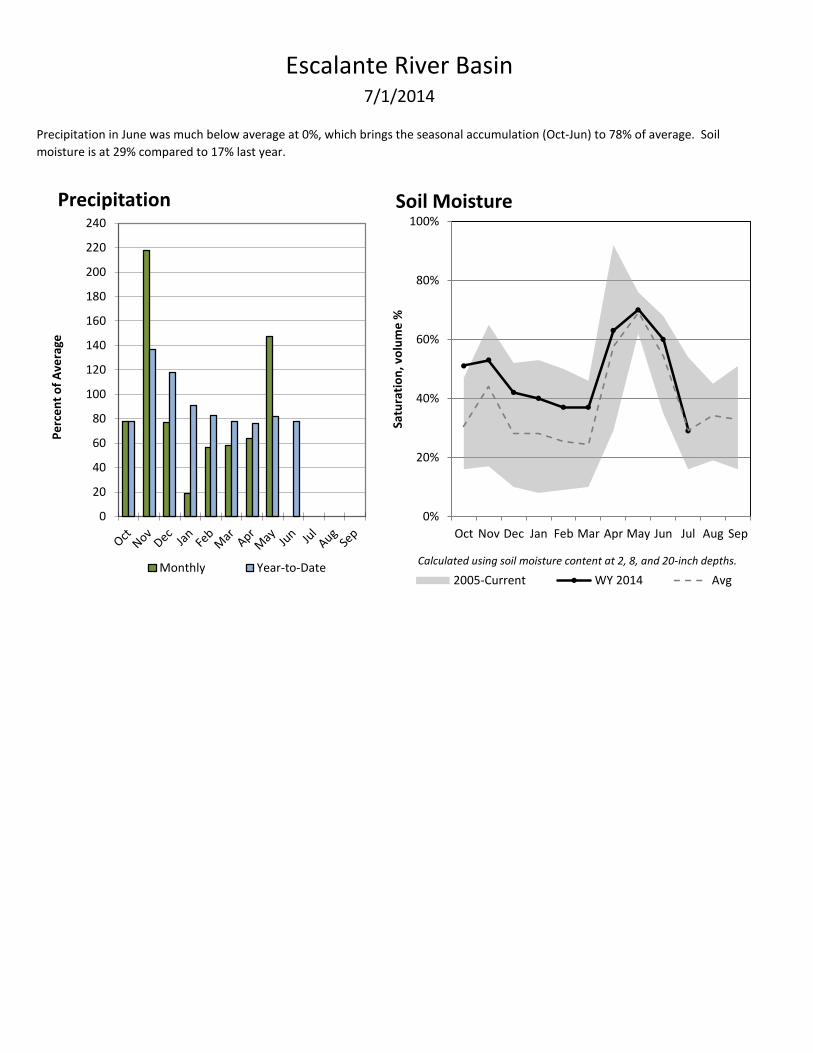
Precipitation in June was much below average at 0%, which brings the seasonal accumulation (Oct-Jun) to 78% of average. Soil
moisture is at 29% compared to 17% last year.
0%
20%
40%
60%
80%
100%
Oct Nov Dec Jan Feb Mar Apr May Jun Jul Aug Sep
Satu
rati
on
, vo
lum
e %
Soil Moisture
2005-Current WY 2014 Avg
Calculated using soil moisture content at 2, 8, and 20-inch depths.
0
20
40
60
80
100
120
140
160
180
200
220
240
Pe
rce
nt
of
Ave
rage
Precipitation
Monthly Year-to-Date
Upper Sevier River Basin
Reservoir ID
10191000
10188000
10UTPANG
PREC
Oct
Nov
7/1/2014
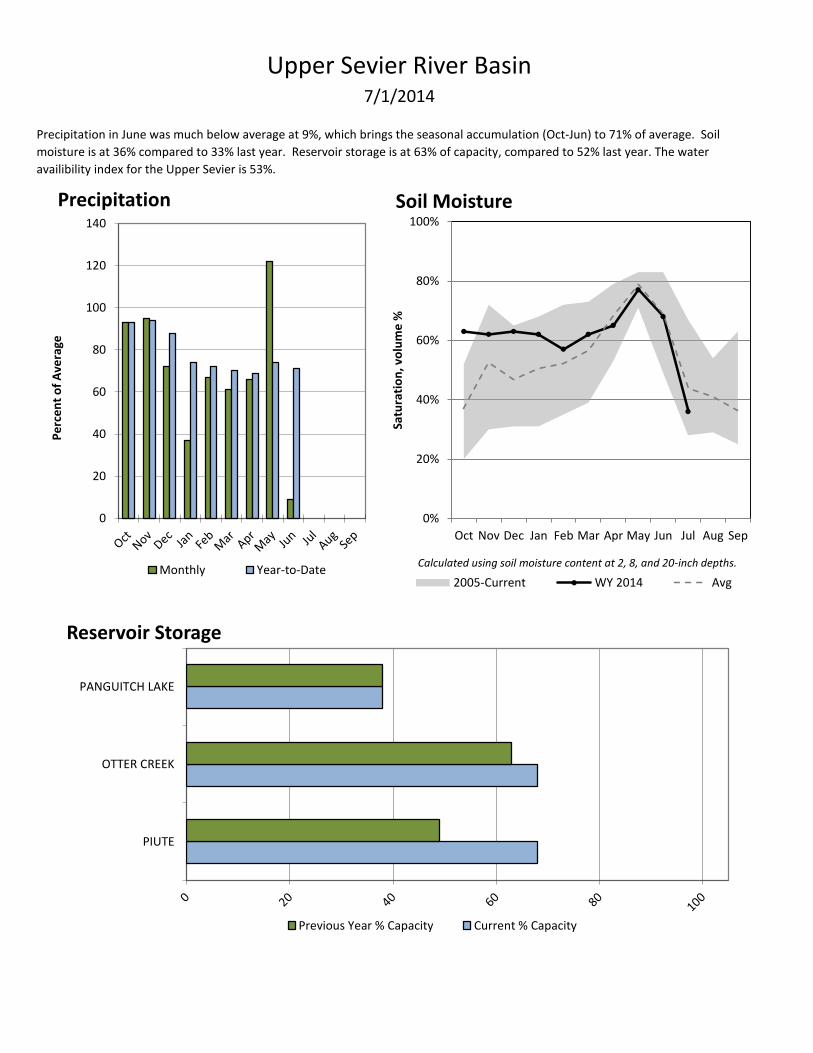
Precipitation in June was much below average at 9%, which brings the seasonal accumulation (Oct-Jun) to 71% of average. Soil
moisture is at 36% compared to 33% last year. Reservoir storage is at 63% of capacity, compared to 52% last year. The water
availibility index for the Upper Sevier is 53%.
PIUTE
OTTER CREEK
PANGUITCH LAKE
Reservoir Storage
Previous Year % Capacity Current % Capacity
0%
20%
40%
60%
80%
100%
Oct Nov Dec Jan Feb Mar Apr May Jun Jul Aug Sep
Satu
rati
on
, vo
lum
e %
Soil Moisture
2005-Current WY 2014 Avg
Calculated using soil moisture content at 2, 8, and 20-inch depths.
0
20
40
60
80
100
120
140
Pe
rce
nt
of
Ave
rage
Precipitation
Monthly Year-to-Date
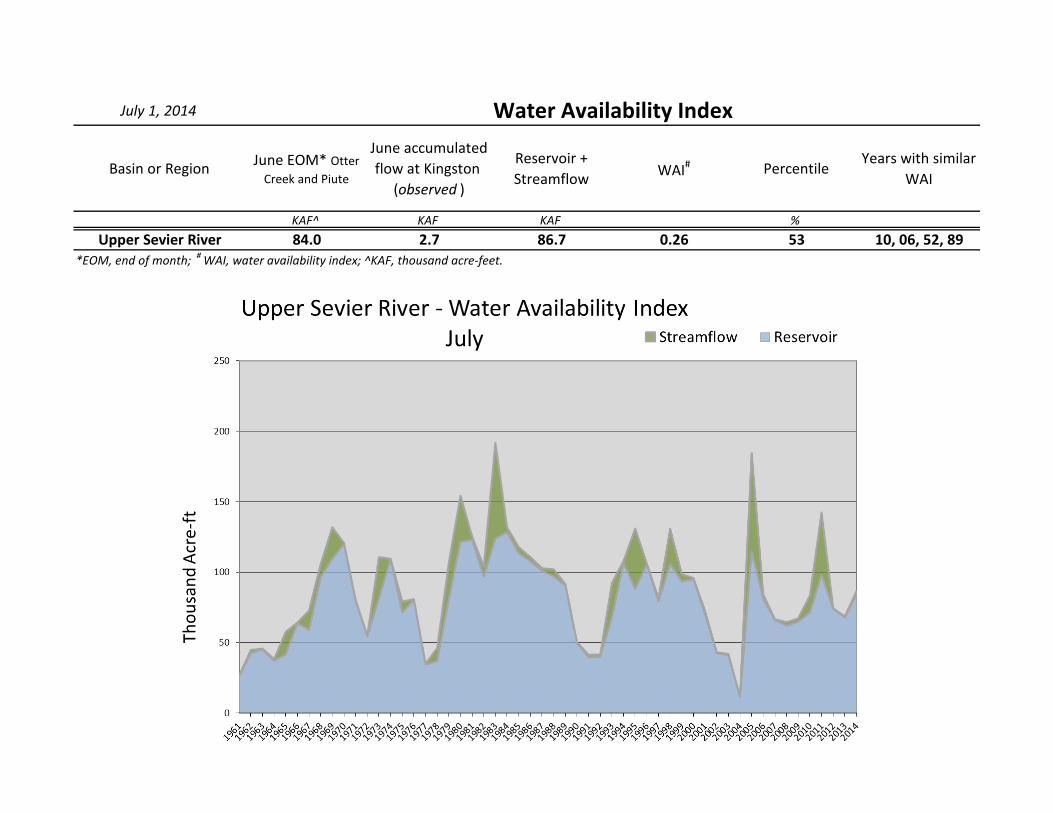
July 1, 2014
Basin or Region June EOM* Otter Creek and Piute
June accumulated flow at Kingston
(observed )
Reservoir + Streamflow WAI# Percentile
Years with similar WAI
KAF^ KAF KAF %Upper Sevier River 84.0 2.7 86.7 0.26 53 10, 06, 52, 89
Water Availability Index
*EOM, end of month; # WAI, water availability index; ^KAF, thousand acre-feet.
San Pitch River Basin
Reservoir ID
10216200
PREC
Oct
Nov
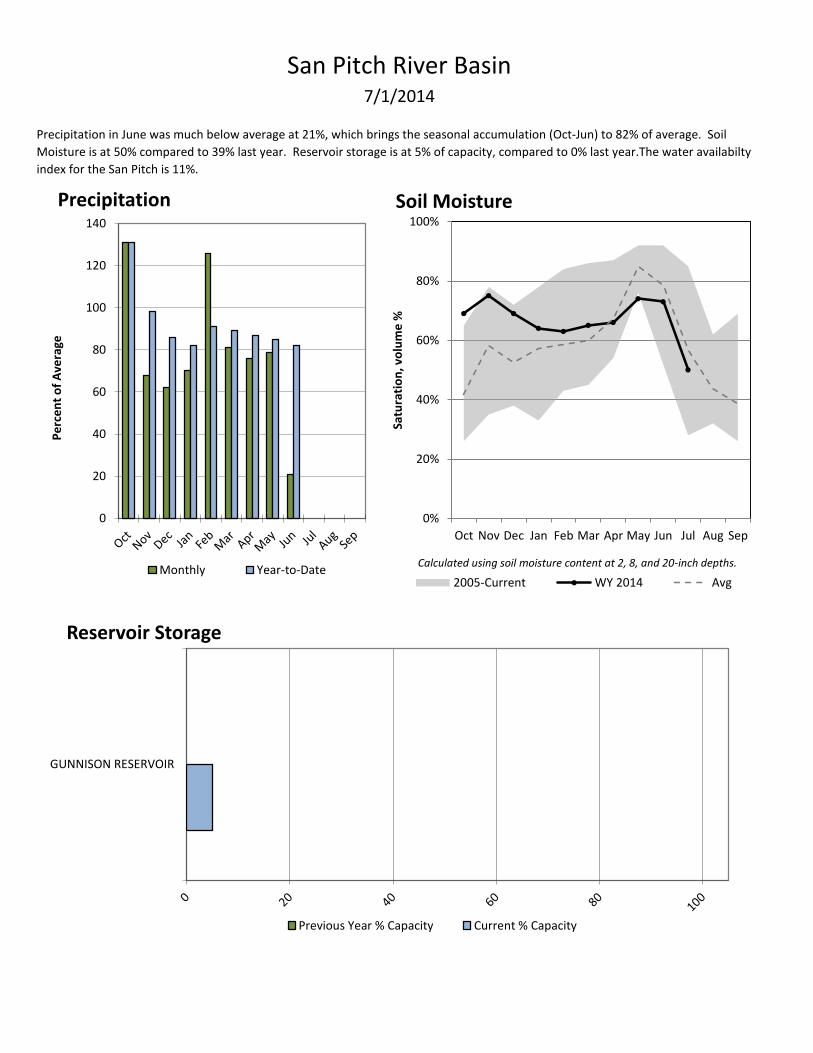
7/1/2014
Precipitation in June was much below average at 21%, which brings the seasonal accumulation (Oct-Jun) to 82% of average. Soil
Moisture is at 50% compared to 39% last year. Reservoir storage is at 5% of capacity, compared to 0% last year.The water availabilty
index for the San Pitch is 11%.
GUNNISON RESERVOIR
Reservoir Storage
Previous Year % Capacity Current % Capacity
0%
20%
40%
60%
80%
100%
Oct Nov Dec Jan Feb Mar Apr May Jun Jul Aug Sep
Satu
rati
on
, vo
lum
e %
Soil Moisture
2005-Current WY 2014 Avg
Calculated using soil moisture content at 2, 8, and 20-inch depths.
0
20
40
60
80
100
120
140
Pe
rce
nt
of
Ave
rage
Precipitation
Monthly Year-to-Date
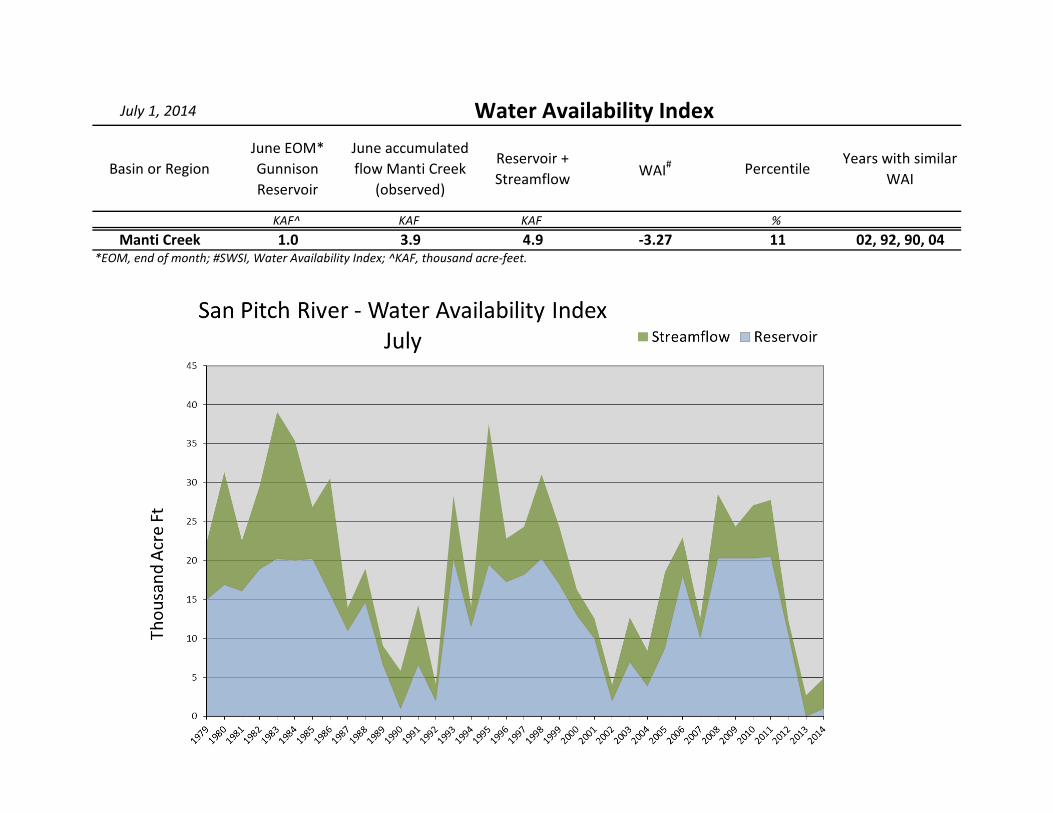
July 1, 2014
Basin or RegionJune EOM* Gunnison Reservoir
June accumulated flow Manti Creek
(observed)
Reservoir + Streamflow WAI# Percentile
Years with similar WAI
KAF^ KAF KAF %Manti Creek 1.0 3.9 4.9 -3.27 11 02, 92, 90, 04
*EOM, end of month; #SWSI, Water Availability Index; ^KAF, thousand acre-feet.
Water Availability Index
Lower Sevier River Basin
Reservoir ID
10218500
PREC
Oct
Nov
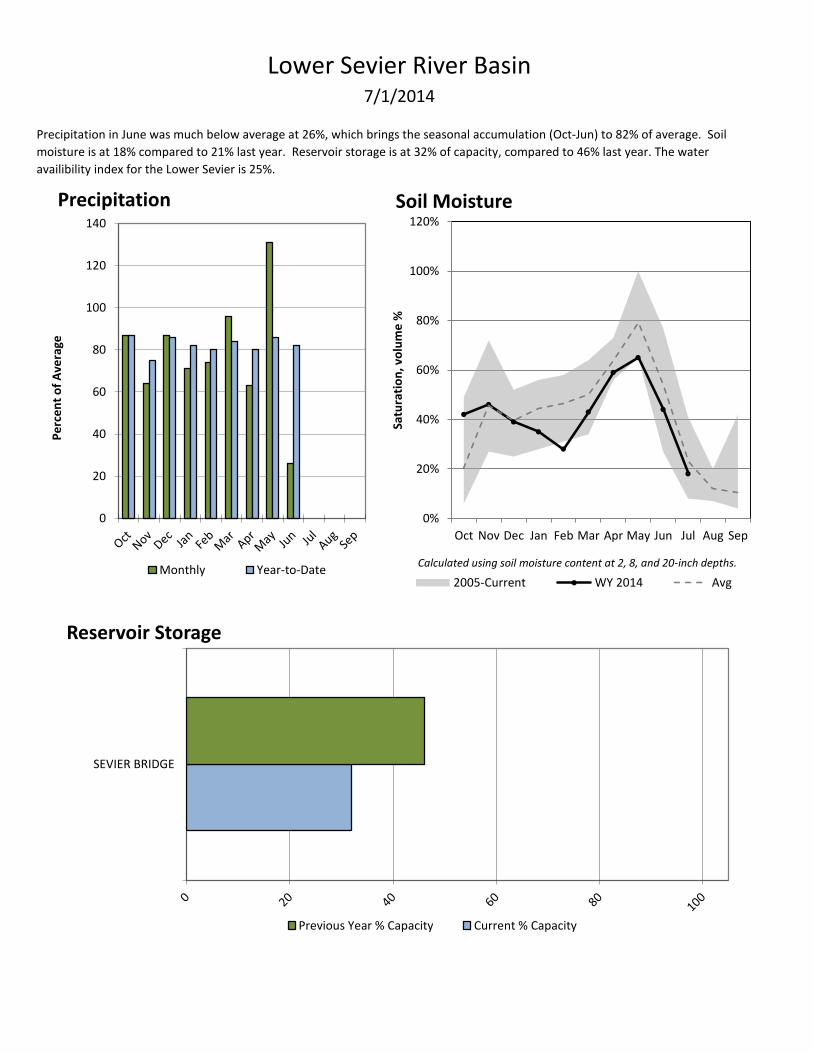
7/1/2014
Precipitation in June was much below average at 26%, which brings the seasonal accumulation (Oct-Jun) to 82% of average. Soil
moisture is at 18% compared to 21% last year. Reservoir storage is at 32% of capacity, compared to 46% last year. The water
availibility index for the Lower Sevier is 25%.
SEVIER BRIDGE
Reservoir Storage
Previous Year % Capacity Current % Capacity
0%
20%
40%
60%
80%
100%
120%
Oct Nov Dec Jan Feb Mar Apr May Jun Jul Aug Sep
Satu
rati
on
, vo
lum
e %
Soil Moisture
2005-Current WY 2014 Avg
Calculated using soil moisture content at 2, 8, and 20-inch depths.
0
20
40
60
80
100
120
140
Pe
rce
nt
of
Ave
rage
Precipitation
Monthly Year-to-Date
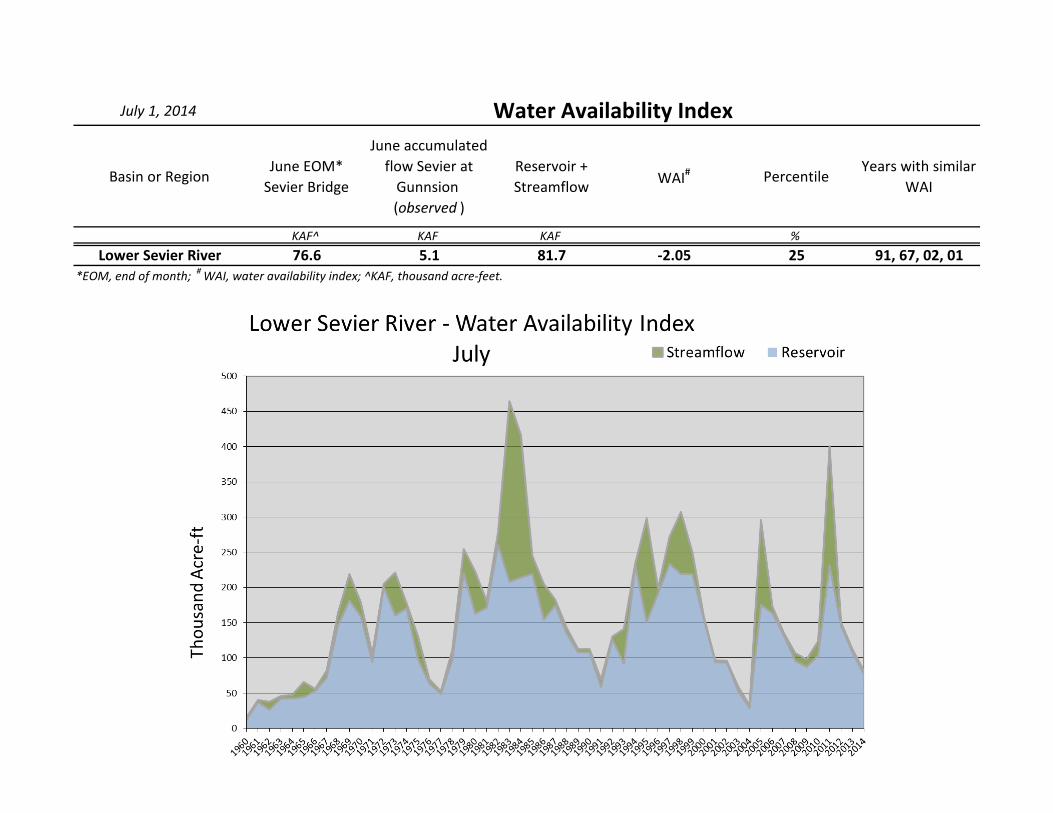
July 1, 2014
Basin or RegionJune EOM*
Sevier Bridge
June accumulated flow Sevier at
Gunnsion (observed )
Reservoir + Streamflow WAI# Percentile
Years with similar WAI
KAF^ KAF KAF %Lower Sevier River 76.6 5.1 81.7 -2.05 25 91, 67, 02, 01
Water Availability Index
*EOM, end of month; # WAI, water availability index; ^KAF, thousand acre-feet.
Beaver River Basin
Reservoir ID
10238500
PREC
Oct
Nov
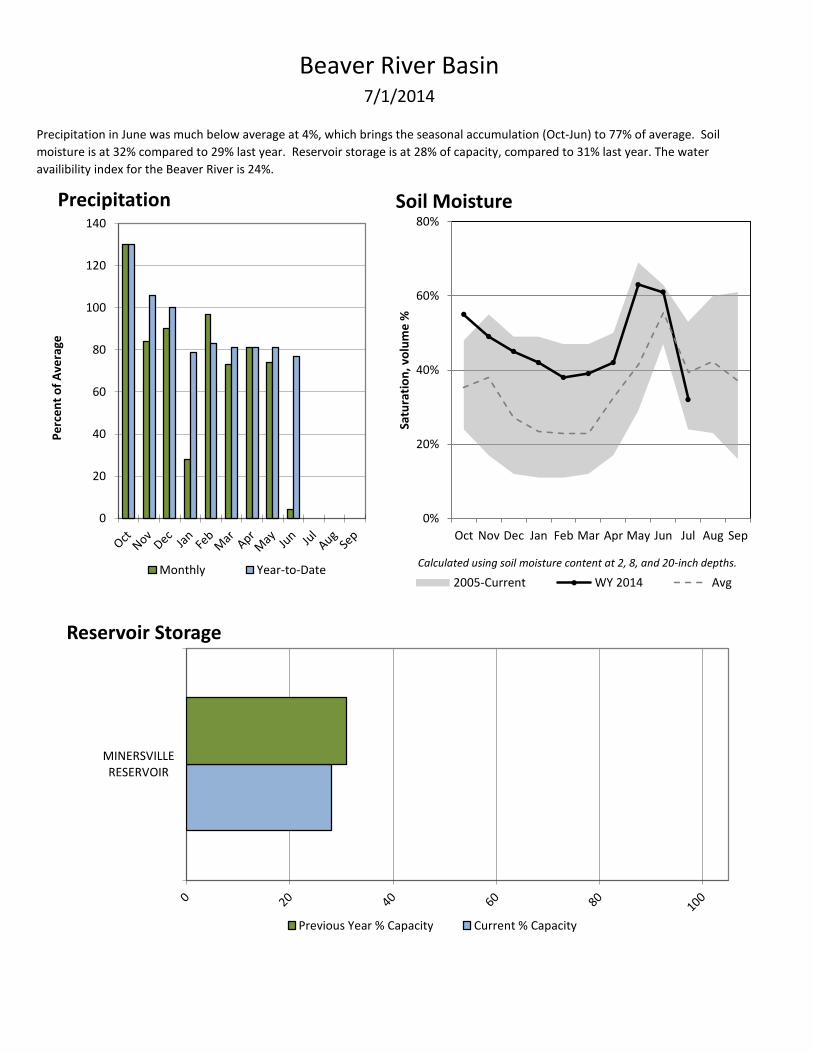
7/1/2014
Precipitation in June was much below average at 4%, which brings the seasonal accumulation (Oct-Jun) to 77% of average. Soil
moisture is at 32% compared to 29% last year. Reservoir storage is at 28% of capacity, compared to 31% last year. The water
availibility index for the Beaver River is 24%.
MINERSVILLERESERVOIR
Reservoir Storage
Previous Year % Capacity Current % Capacity
0%
20%
40%
60%
80%
Oct Nov Dec Jan Feb Mar Apr May Jun Jul Aug Sep
Satu
rati
on
, vo
lum
e %
Soil Moisture
2005-Current WY 2014 Avg
Calculated using soil moisture content at 2, 8, and 20-inch depths.
0
20
40
60
80
100
120
140
Pe
rce
nt
of
Ave
rage
Precipitation
Monthly Year-to-Date
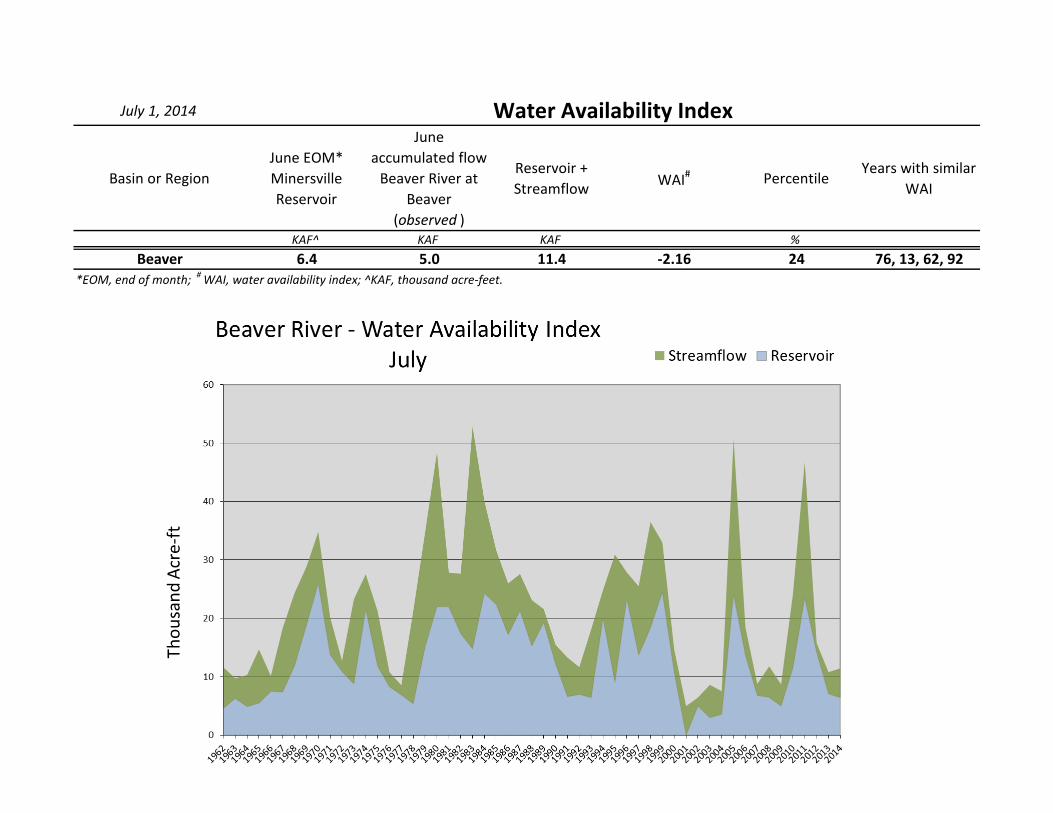
July 1, 2014
Basin or RegionJune EOM* Minersville Reservoir
June accumulated flow
Beaver River at Beaver
(observed )
Reservoir + Streamflow WAI# Percentile
Years with similar WAI
KAF^ KAF KAF %Beaver 6.4 5.0 11.4 -2.16 24 76, 13, 62, 92
Water Availability Index
*EOM, end of month; # WAI, water availability index; ^KAF, thousand acre-feet.
Southwestern Utah Basin
Reservoir ID
09379900
10UTENTL
10UTENTU
09UTKOLB
09UTGUNL
09UTSAND
09UTQUAI
PREC
Oct
Nov
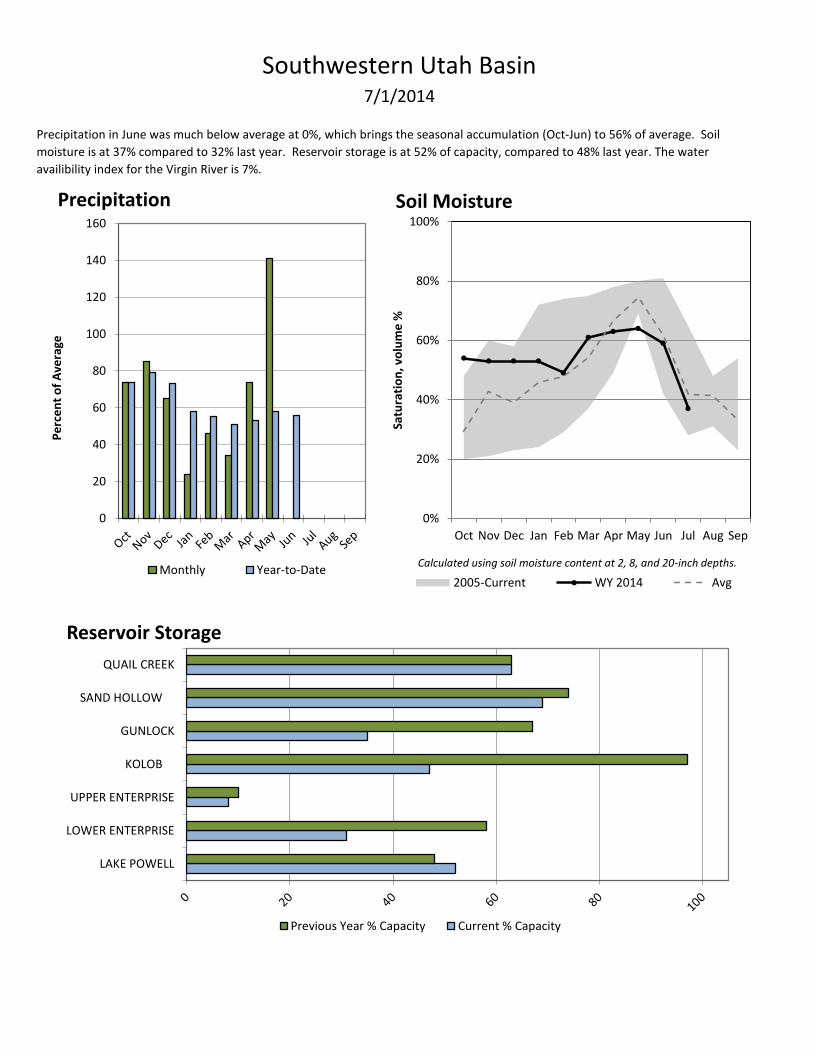
7/1/2014
Precipitation in June was much below average at 0%, which brings the seasonal accumulation (Oct-Jun) to 56% of average. Soil
moisture is at 37% compared to 32% last year. Reservoir storage is at 52% of capacity, compared to 48% last year. The water
availibility index for the Virgin River is 7%.
LAKE POWELL
LOWER ENTERPRISE
UPPER ENTERPRISE
KOLOB
GUNLOCK
SAND HOLLOW
QUAIL CREEK
Reservoir Storage
Previous Year % Capacity Current % Capacity
0%
20%
40%
60%
80%
100%
Oct Nov Dec Jan Feb Mar Apr May Jun Jul Aug Sep
Satu
rati
on
, vo
lum
e %
Soil Moisture
2005-Current WY 2014 Avg
Calculated using soil moisture content at 2, 8, and 20-inch depths.
0
20
40
60
80
100
120
140
160
Pe
rce
nt
of
Ave
rage
Precipitation
Monthly Year-to-Date
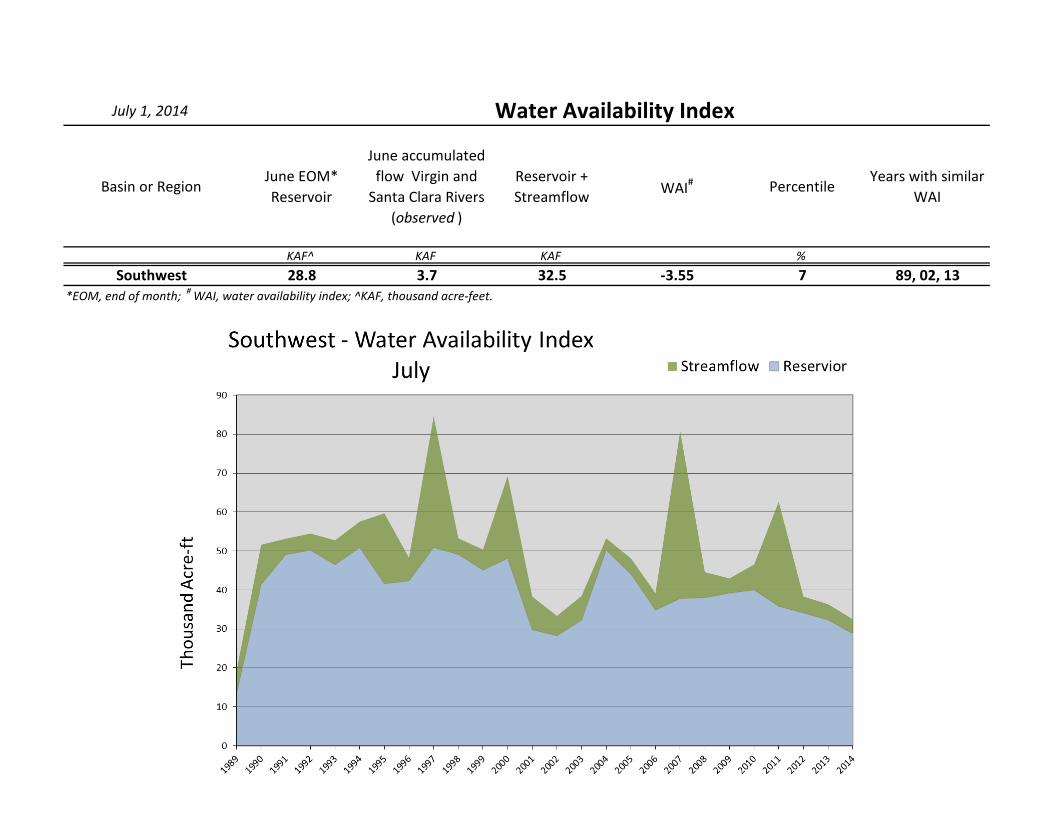
July 1, 2014
Basin or RegionJune EOM* Reservoir
June accumulated flow Virgin and
Santa Clara Rivers (observed )
Reservoir + Streamflow WAI# Percentile
Years with similar WAI
KAF^ KAF KAF %Southwest 28.8 3.7 32.5 -3.55 7 89, 02, 13
Water Availability Index
*EOM, end of month; # WAI, water availability index; ^KAF, thousand acre-feet.
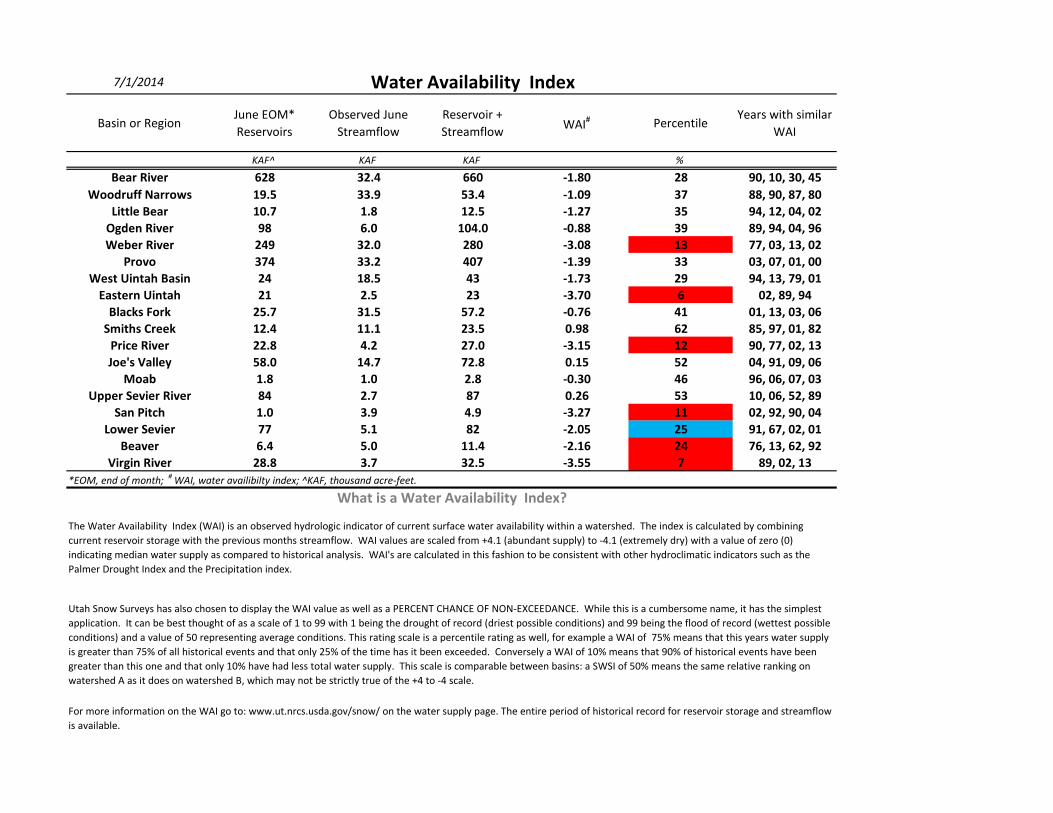
7/1/2014 Water Availability Index
Basin or RegionJune EOM* Reservoirs
Observed June Streamflow
Reservoir + Streamflow WAI# Percentile
Years with similar WAI
KAF^ KAF KAF %
Bear River 628 32.4 660 -1.80 28 90, 10, 30, 45Woodruff Narrows 19.5 33.9 53.4 -1.09 37 88, 90, 87, 80
Little Bear 10.7 1.8 12.5 -1.27 35 94, 12, 04, 02Ogden River 98 6.0 104.0 -0.88 39 89, 94, 04, 96Weber River 249 32.0 280 -3.08 13 77, 03, 13, 02
Provo 374 33.2 407 -1.39 33 03, 07, 01, 00West Uintah Basin 24 18.5 43 -1.73 29 94, 13, 79, 01
Eastern Uintah 21 2.5 23 -3.70 6 02, 89, 94Blacks Fork 25.7 31.5 57.2 -0.76 41 01, 13, 03, 06
Smiths Creek 12.4 11.1 23.5 0.98 62 85, 97, 01, 82Price River 22.8 4.2 27.0 -3.15 12 90, 77, 02, 13Joe's Valley 58.0 14.7 72.8 0.15 52 04, 91, 09, 06
Moab 1.8 1.0 2.8 -0.30 46 96, 06, 07, 03Upper Sevier River 84 2.7 87 0.26 53 10, 06, 52, 89
San Pitch 1.0 3.9 4.9 -3.27 11 02, 92, 90, 04Lower Sevier 77 5.1 82 -2.05 25 91, 67, 02, 01
Beaver 6.4 5.0 11.4 -2.16 24 76, 13, 62, 92Virgin River 28.8 3.7 32.5 -3.55 7 89, 02, 13
*EOM, end of month; # WAI, water availibilty index; ^KAF, thousand acre-feet.
What is a Water Availability Index?
The Water Availability Index (WAI) is an observed hydrologic indicator of current surface water availability within a watershed. The index is calculated by combining current reservoir storage with the previous months streamflow. WAI values are scaled from +4.1 (abundant supply) to -4.1 (extremely dry) with a value of zero (0) indicating median water supply as compared to historical analysis. WAI's are calculated in this fashion to be consistent with other hydroclimatic indicators such as the Palmer Drought Index and the Precipitation index.
Utah Snow Surveys has also chosen to display the WAI value as well as a PERCENT CHANCE OF NON-EXCEEDANCE. While this is a cumbersome name, it has the simplest application. It can be best thought of as a scale of 1 to 99 with 1 being the drought of record (driest possible conditions) and 99 being the flood of record (wettest possible conditions) and a value of 50 representing average conditions. This rating scale is a percentile rating as well, for example a WAI of 75% means that this years water supply is greater than 75% of all historical events and that only 25% of the time has it been exceeded. Conversely a WAI of 10% means that 90% of historical events have been greater than this one and that only 10% have had less total water supply. This scale is comparable between basins: a SWSI of 50% means the same relative ranking on watershed A as it does on watershed B, which may not be strictly true of the +4 to -4 scale.
For more information on the WAI go to: www.ut.nrcs.usda.gov/snow/ on the water supply page. The entire period of historical record for reservoir storage and streamflow is available.
Issued by Released by Jason Weller David Brown Chief State Conservationist Natural Resources Conservation Service Natural Resources Conservation Service U.S. Department of Agriculture Salt Lake City, Utah Prepared by Snow Survey Staff Randall Julander, Supervisor Troy Brosten, Assistant Supervisor Beau Uriona, Hydrologist Jordan Clayton, Hydrologist Jeffrey O’Connell, Hydrologist Bob Nault, Electronics Technician Kent Sutcliffe, Soil Scientist YOU MAY OBTAIN THIS PRODUCT AS WELL AS CURENT SNOW, PRECIPITATION, TEMPERATURE AND SOIL MOISTURE, RESERVOIR, SURFACE WATER SUPPLY INDEX, AND OTHER DATA BY VISITING OUR WEB SITE @: http://www.ut.nrcs.usda.gov/snow/ Snow Survey, NRCS, USDA 245 North Jimmy Doolittle Road Salt Lake City, UT 84116 (801) 524-5213
Utah Climate and Water Report
Natural Resources Conservation Service Salt Lake City, UT