Embed Size (px)
Citation preview

Climate and Global Change Notes
14-1
Greenhouse Effect
Greenhouse Effect
• U.S. tops in 2004 greenhouse gas emissions
By Reuters; story last modified Fri Jun 02 17:28:42 PDT 2006 Many rich nations' emissions of greenhouse gases rose in 2004, led by a U.S. rebound to record highs after a dip since President George W. Bush took office in 2001, according to data released on Friday.
The figures, submitted by 33 governments to the U.N. Climate Secretariat in Bonn, Germany, showed that emissions of heat-trapping carbon dioxide, widely blamed for global warming, rose to 15.1 billion tons in 2004 from 14.5 billion in 1990.
Several nations, especially Russia, where smokestack emissions have plunged since the collapse of the Soviet Union, have yet to submit figures for 2004 so a full overview of industrial nations' emissions is not yet possible.
Still, the data indicate that many nations will struggle to meet goals set by the United Nations' Kyoto Protocol to cut emissions of heat-trapping gases--mainly from power plants, factories and cars--by 5.2 percent below 1990 levels by 2008-12.
Emissions by the United States, the world's main source of greenhouse gases but which did not agree to the Kyoto Protocol, rose by 1.7 percent in 2004 from 2003 to 7.07 billion tons and eclipsed a previous peak of 6.98 billion in 2000.
http://news.com.com/U.S.+tops+in+2004+greenhouse+gas+
emissions/2100-11395_3-6079611.html
Climate and Global Change Notes
14-2
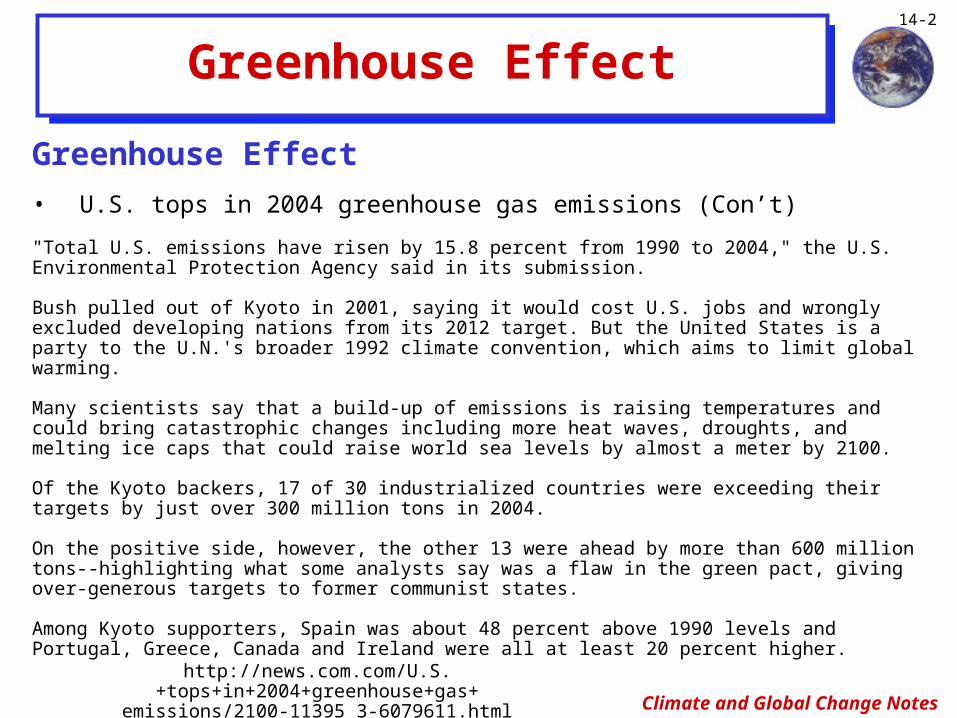
Greenhouse Effect
Greenhouse Effect
• U.S. tops in 2004 greenhouse gas emissions (Con’t)
"Total U.S. emissions have risen by 15.8 percent from 1990 to 2004," the U.S. Environmental Protection Agency said in its submission.
Bush pulled out of Kyoto in 2001, saying it would cost U.S. jobs and wrongly excluded developing nations from its 2012 target. But the United States is a party to the U.N.'s broader 1992 climate convention, which aims to limit global warming.
Many scientists say that a build-up of emissions is raising temperatures and could bring catastrophic changes including more heat waves, droughts, and melting ice caps that could raise world sea levels by almost a meter by 2100.
Of the Kyoto backers, 17 of 30 industrialized countries were exceeding their targets by just over 300 million tons in 2004.
On the positive side, however, the other 13 were ahead by more than 600 million tons--highlighting what some analysts say was a flaw in the green pact, giving over-generous targets to former communist states.
Among Kyoto supporters, Spain was about 48 percent above 1990 levels and Portugal, Greece, Canada and Ireland were all at least 20 percent higher.
http://news.com.com/U.S.+tops+in+2004+greenhouse+gas+
emissions/2100-11395_3-6079611.html
Climate and Global Change Notes
14-3
Greenhouse Effect
Greenhouse Effect
• U.S. tops in 2004 greenhouse gas emissions (Con’t)
Overall emissions in the 15 longest-standing members of the European Union edged up 0.2 percent in 2004 overall from 2003 to 4.24 billion tons. Overall, they were 1.1 percent below 1990 levels.
At U.N. climate talks in Montreal last year, U.S. climate negotiator Harlan Watson had pointed to Washington's success in cracking down under Bush."Look at the data--the United States has done better in the first three years of the Bush administration in addressing greenhouse gas emissions than the EU...the U.K., France, Germany," he said.
Canada's new conservative government said last month that its Kyoto goal was "unachievable" since the country was 35 percent above target and 27 percent above 1990 levels.Japan was 7 percent above its 1990 emissions levels in 2004, a difference of 83 million tons compared to its Kyoto target of a 6 percent fall.
http://news.com.com/U.S.+tops+in+2004+greenhouse+gas+
emissions/2100-11395_3-6079611.html
Climate and Global Change Notes
14-4
Greenhouse Gases & Climate
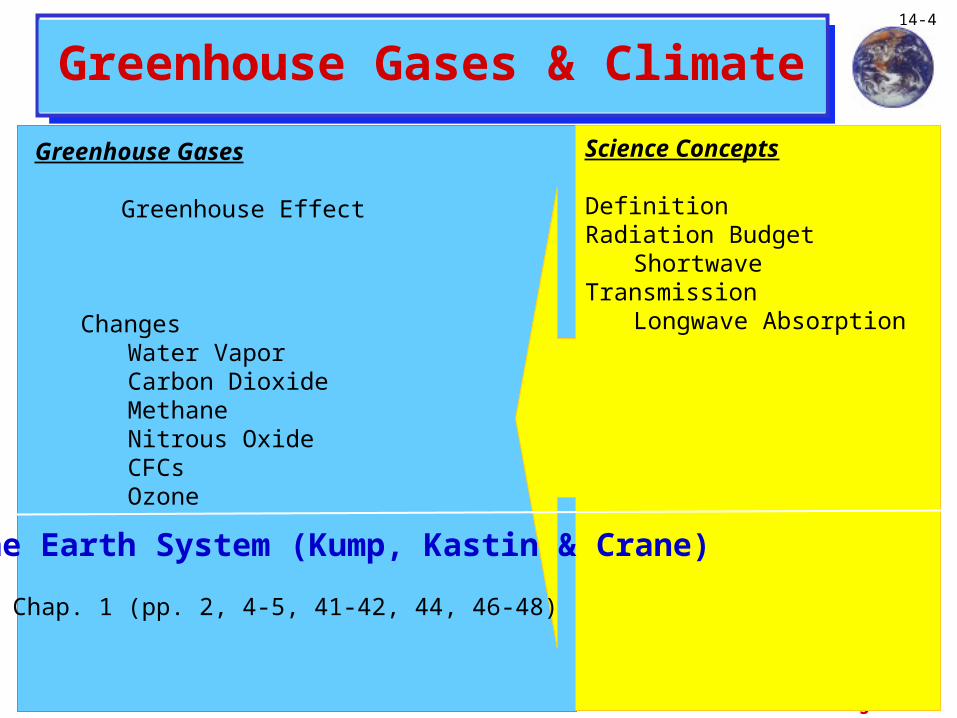
Greenhouse Gases
Greenhouse Effect
ChangesWater VaporCarbon DioxideMethaneNitrous OxideCFCsOzone
Science Concepts
DefinitionRadiation Budget
Shortwave Transmission
Longwave Absorption
The Earth System (Kump, Kastin & Crane)
• Chap. 1 (pp. 2, 4-5, 41-42, 44, 46-48)
Climate and Global Change Notes
14-5
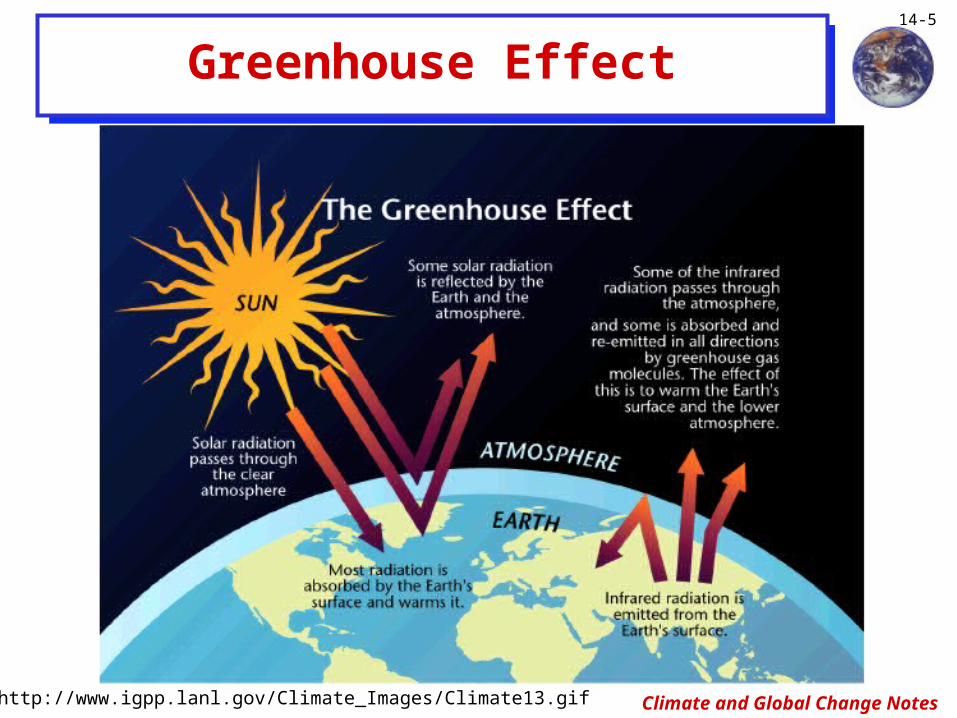
Greenhouse Effect
http://www.igpp.lanl.gov/Climate_Images/Climate13.gif
Climate and Global Change Notes
14-6
Greenhouse Effect
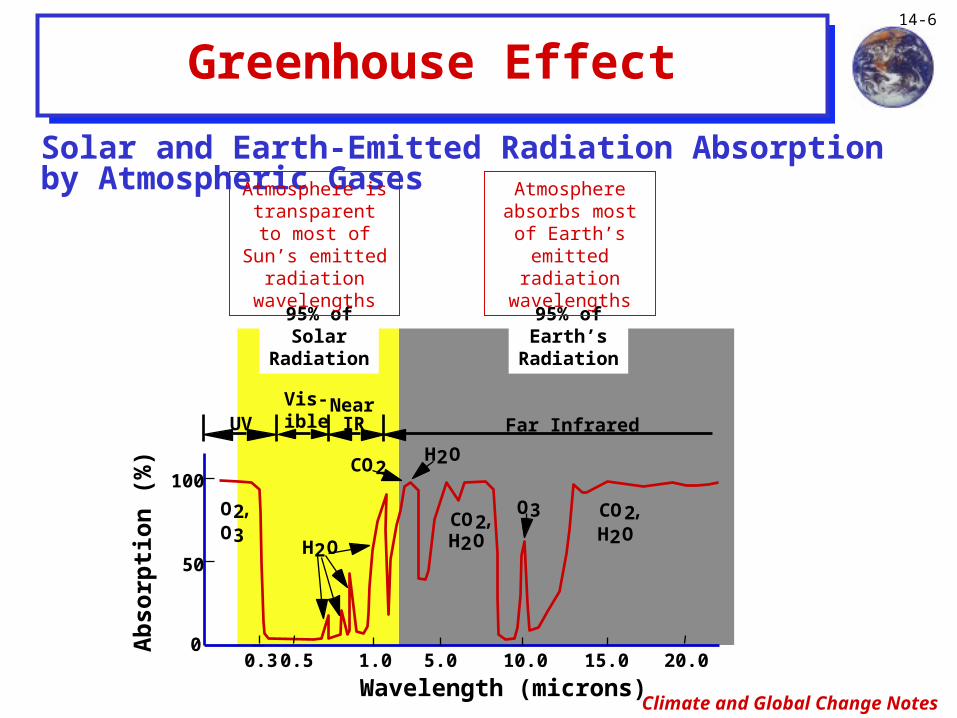
Solar and Earth-Emitted Radiation Absorption by Atmospheric Gases
100
50
0.30.5 1.0 5.0 10.0 20.015.00
Wavelength (microns)
O2, CO2,H2OO3
O3
CO2
H2O
H2O
CO2,H2O
Far InfraredNear IRUV
Vis-ible
Absorption (%)
95% ofEarth’sRadiation
95% ofSolar
Radiation
Atmosphere is transparent to most of
Sun’s emitted radiation wavelengths
Atmosphere absorbs most of Earth’s emitted radiation wavelengths
Climate and Global Change Notes
14-7
Greenhouse Effect
Greenhouse Effect
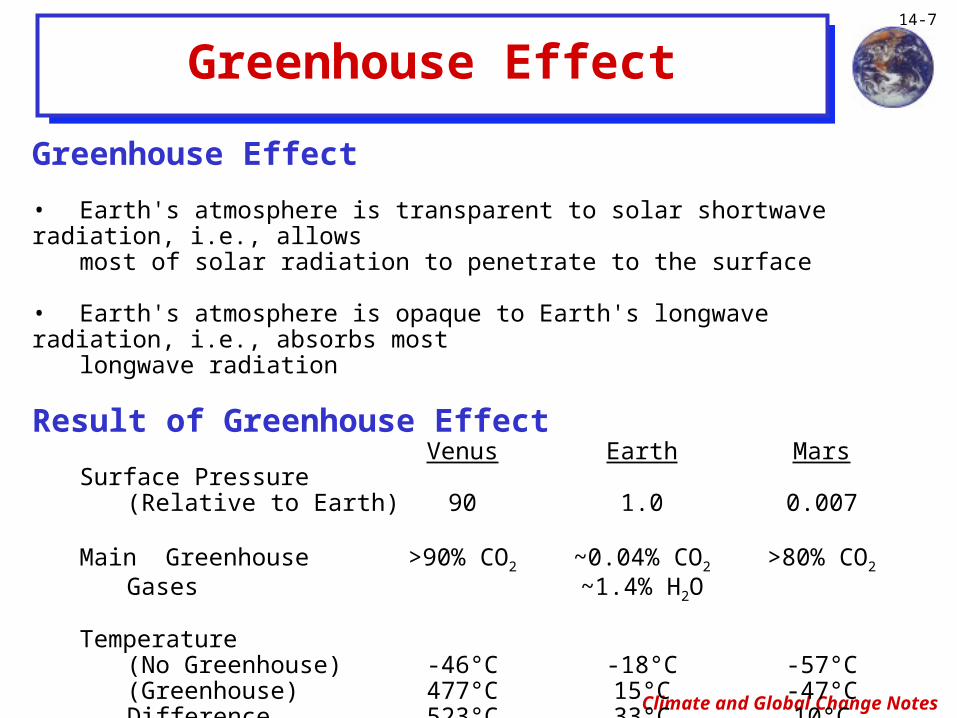
• Earth's atmosphere is transparent to solar shortwave radiation, i.e., allows
most of solar radiation to penetrate to the surface
• Earth's atmosphere is opaque to Earth's longwave radiation, i.e., absorbs most
longwave radiation
Result of Greenhouse EffectVenus Earth Mars
Surface Pressure(Relative to Earth) 90 1.0 0.007
Main Greenhouse >90% CO2 ~0.04% CO2 >80% CO2
Gases ~1.4% H2O
Temperature (No Greenhouse) -46°C -18°C -57°C(Greenhouse) 477°C 15°C -47°CDifference 523°C 33°C 10°C
Climate and Global Change Notes
14-8
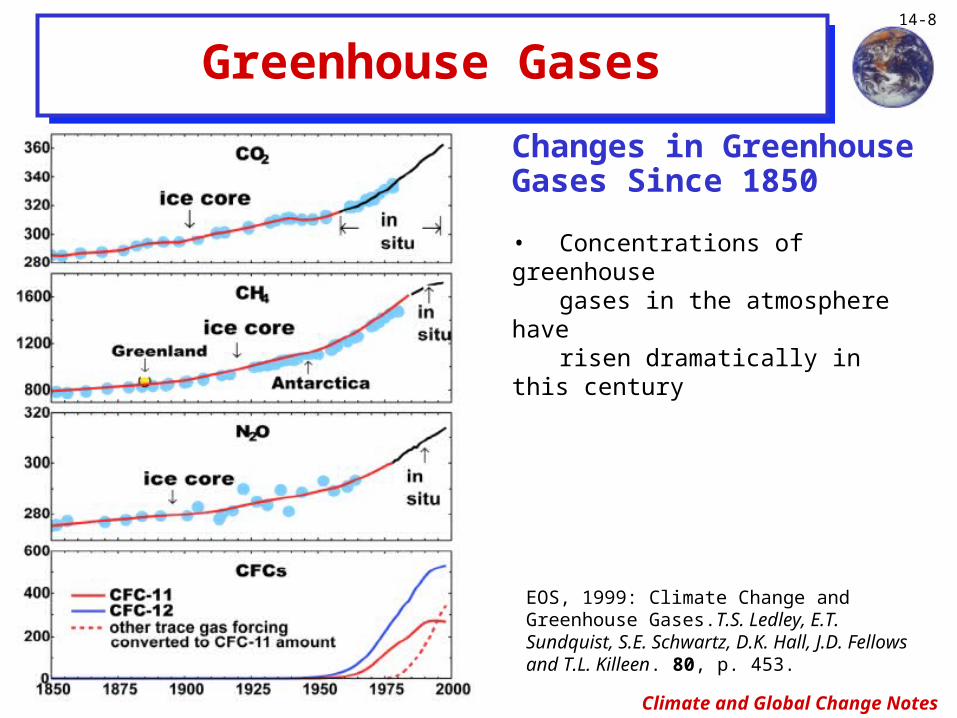
Changes in Greenhouse Gases Since 1850
• Concentrations of greenhouse
gases in the atmosphere have
risen dramatically in this century
Greenhouse Gases
EOS, 1999: Climate Change and Greenhouse Gases.T.S. Ledley, E.T. Sundquist, S.E. Schwartz, D.K. Hall, J.D. Fellows and T.L. Killeen. 80, p. 453.
Climate and Global Change Notes
14-9
Greenhouse Gases
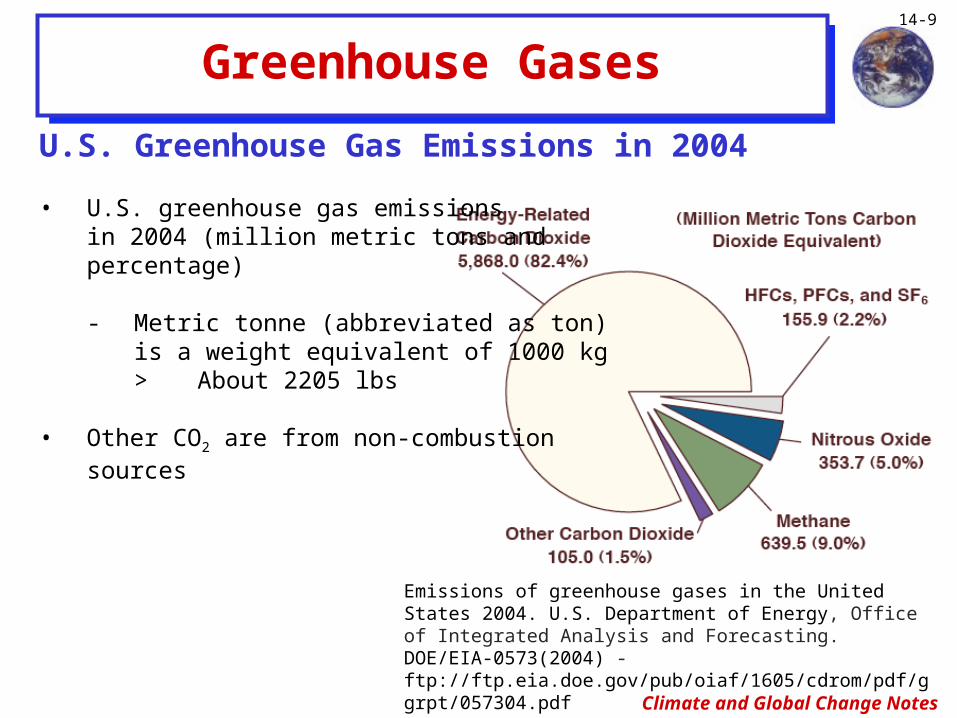
Emissions of greenhouse gases in the United States 2004. U.S. Department of Energy, Office of Integrated Analysis and Forecasting. DOE/EIA-0573(2004) - ftp://ftp.eia.doe.gov/pub/oiaf/1605/cdrom/pdf/ggrpt/057304.pdf
U.S. Greenhouse Gas Emissions in 2004
• U.S. greenhouse gas emissions in 2004 (million metric tons andpercentage)
- Metric tonne (abbreviated as ton) is a weight equivalent of 1000 kg> About 2205 lbs
• Other CO2 are from non-combustion sources
Climate and Global Change Notes
14-10
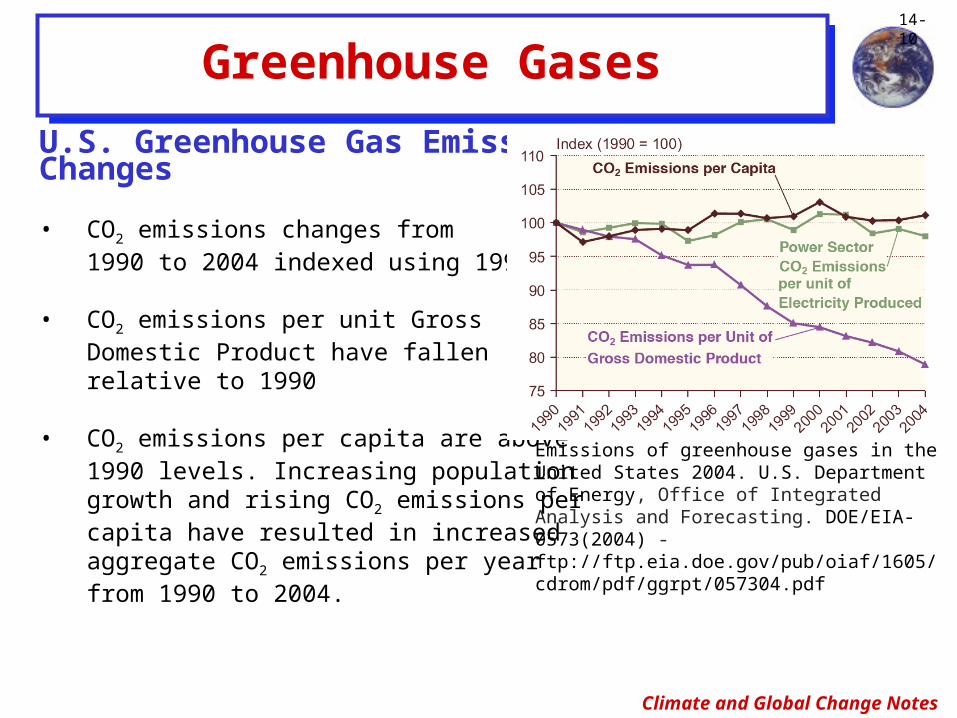
U.S. Greenhouse Gas Emissions Changes
• CO2 emissions changes from 1990 to 2004 indexed using 1990
• CO2 emissions per unit Gross Domestic Product have fallen relative to 1990
• CO2 emissions per capita are above 1990 levels. Increasing population growth and rising CO2 emissions per capita have resulted in increased aggregate CO2 emissions per year from 1990 to 2004.
Greenhouse Gases
Emissions of greenhouse gases in the United States 2004. U.S. Department of Energy, Office of Integrated Analysis and Forecasting. DOE/EIA-0573(2004) - ftp://ftp.eia.doe.gov/pub/oiaf/1605/cdrom/pdf/ggrpt/057304.pdf
Climate and Global Change Notes
14-11
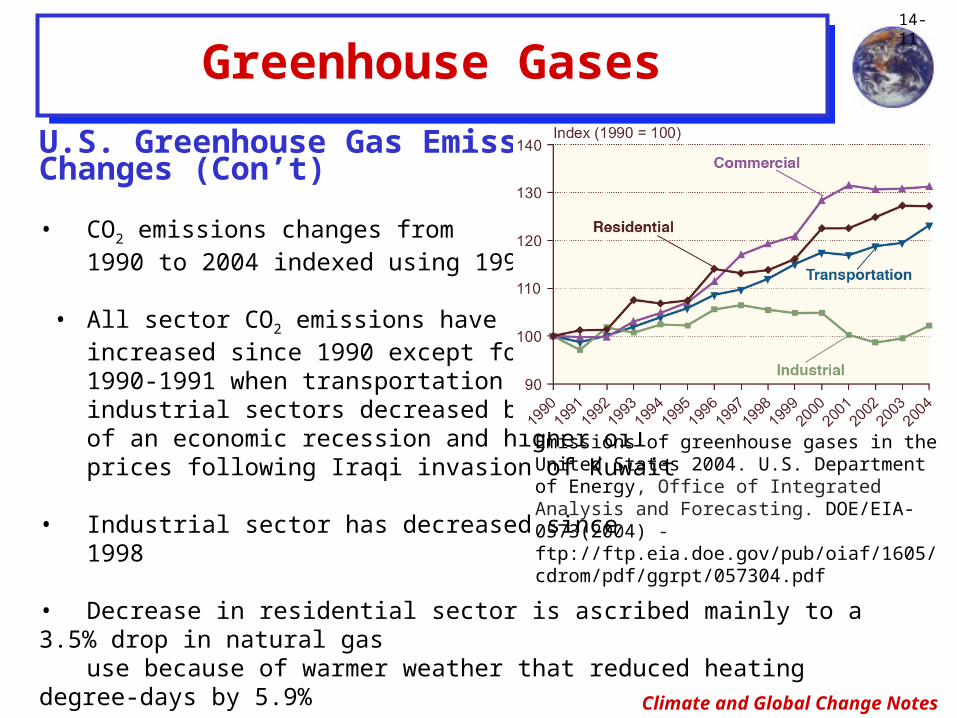
U.S. Greenhouse Gas Emissions Changes (Con’t)
• CO2 emissions changes from1990 to 2004 indexed using 1990
• All sector CO2 emissions have increased since 1990 except for 1990-1991 when transportation and industrial sectors decreased because of an economic recession and higher oil prices following Iraqi invasion of Kuwait
• Industrial sector has decreased since 1998
• Decrease in residential sector is ascribed mainly to a 3.5% drop in natural gas
use because of warmer weather that reduced heating degree-days by 5.9%
Greenhouse Gases
Emissions of greenhouse gases in the United States 2004. U.S. Department of Energy, Office of Integrated Analysis and Forecasting. DOE/EIA-0573(2004) - ftp://ftp.eia.doe.gov/pub/oiaf/1605/cdrom/pdf/ggrpt/057304.pdf
Climate and Global Change Notes
14-12
Greenhouse Gases
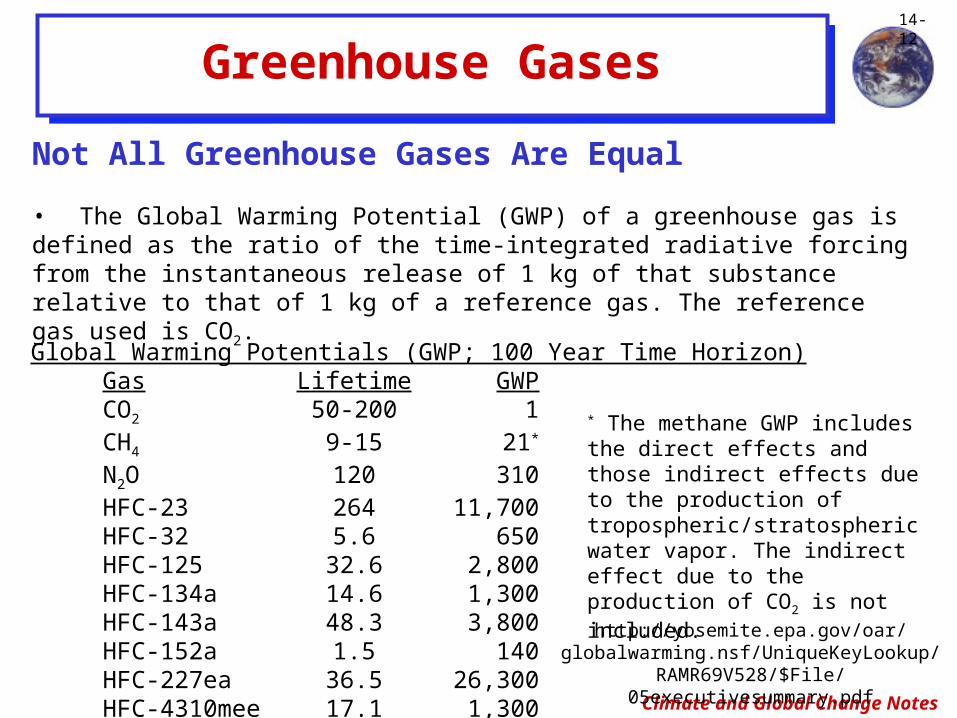
Global Warming Potentials (GWP; 100 Year Time Horizon)Gas Lifetime GWPCO2 50-200 1CH4 9-15 21*
N2O 120 310HFC-23 264 11,700HFC-32 5.6 650HFC-125 32.6 2,800HFC-134a 14.6 1,300HFC-143a 48.3 3,800HFC-152a 1.5 140HFC-227ea 36.5 26,300HFC-4310mee 17.1 1,300
http://yosemite.epa.gov/oar/globalwarming.nsf/UniqueKeyLookup/
RAMR69V528/$File/05executivesummary.pdf
* The methane GWP includes the direct effects and those indirect effects due to the production of tropospheric/stratospheric water vapor. The indirect effect due to the production of CO2 is not included.
Not All Greenhouse Gases Are Equal
• The Global Warming Potential (GWP) of a greenhouse gas is defined as the ratio of the time-integrated radiative forcing from the instantaneous release of 1 kg of that substance relative to that of 1 kg of a reference gas. The reference gas used is CO2.
Climate and Global Change Notes
14-13
Greenhouse Gases
Water Vapor (H2O)
• Primary greenhouse gas
Carbon Dioxide (CO2)
• Increased 10% since 1958; 25% since early 19th century
• Sources
- 80% of emissions from fossil fuel
- 20% from burning and decay in deforestation process
Climate and Global Change Notes
14-14
Greenhouse Gases
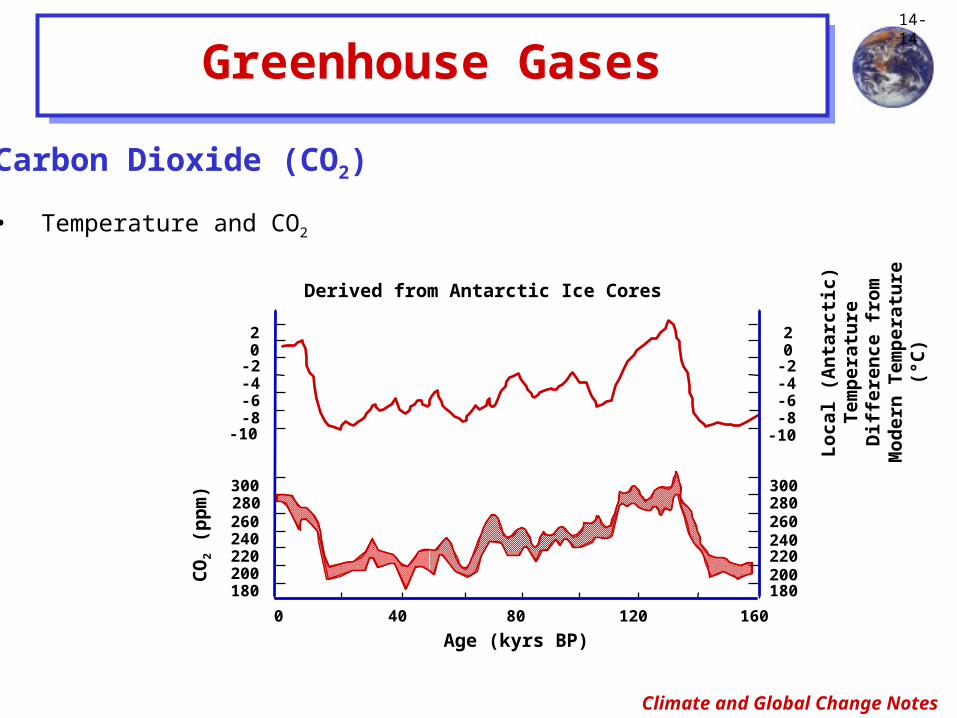
Carbon Dioxide (CO2)
• Temperature and CO2
300280260240220200180
2
-2-4-6-8
-10
0
0 40 80 120 160
Age (kyrs BP)
300280260240220200180
2
-2-4-6-8-10
0
Derived from Antarctic Ice Cores
CO2 (ppm)
Local (Antarctic)
Temperature
Difference from
Modern Temperature
(°C)
Climate and Global Change Notes
14-15
Greenhouse Gases
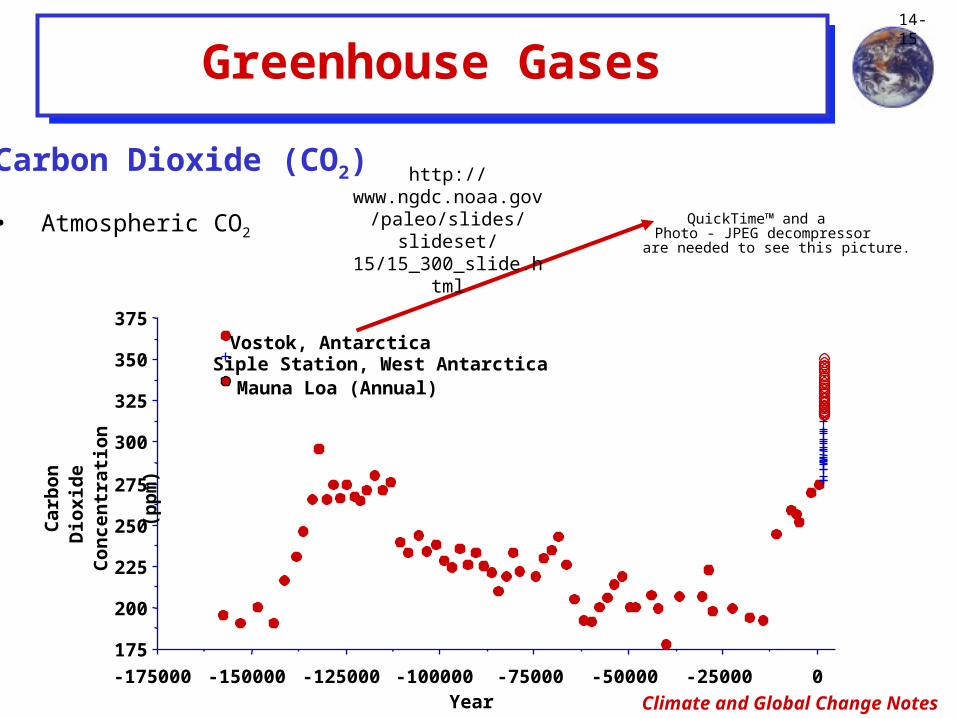
Carbon Dioxide (CO2)
• Atmospheric CO2QuickTime™ and a
Photo - JPEG decompressorare needed to see this picture.
0-25000-50000-75000-100000-125000-150000-175000175
200
225
250
275
300
325
350
375Vostok, Antarctica
Siple Station, West AntarcticaMauna Loa (Annual)
Year
Carbon
Dioxide
Concentration
(ppm)
http://www.ngdc.noaa.gov/paleo/slides/
slideset/15/15_300_slide.h
tml
Climate and Global Change Notes
14-16
Greenhouse Gases
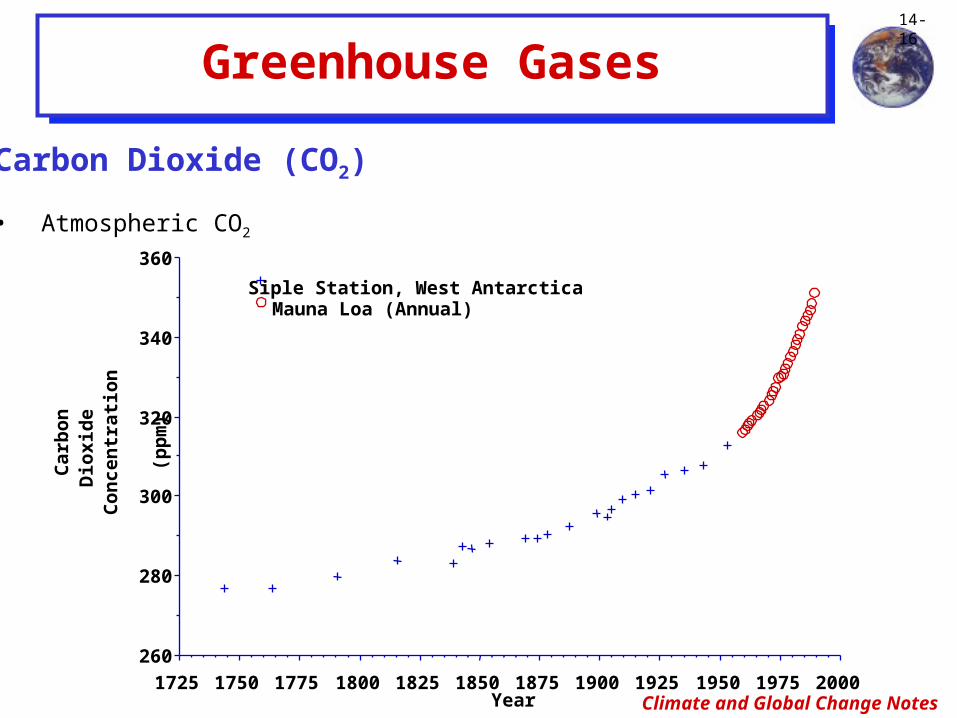
Carbon Dioxide (CO2)
• Atmospheric CO2
200019751950192519001875185018251800177517501725260
280
300
320
340
360
Siple Station, West AntarcticaMauna Loa (Annual)
Year
Carbon
Dioxide
Concentration
(ppm)
Climate and Global Change Notes
14-17
Greenhouse Gases
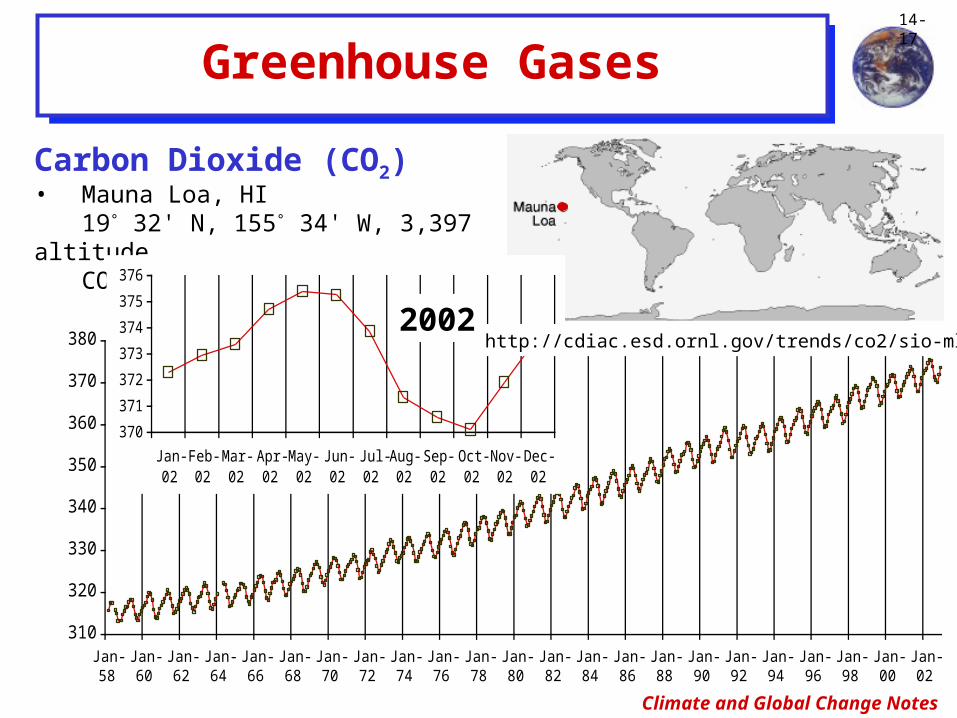
Carbon Dioxide (CO2)• Mauna Loa, HI
19° 32' N, 155° 34' W, 3,397 altitude
CO2 Concentration (ppmv)
310
320
330
340
350
360
370
380
Jan-58
Jan-60
Jan-62
Jan-64
Jan-66
Jan-68
Jan-70
Jan-72
Jan-74
Jan-76
Jan-78
Jan-80
Jan-82
Jan-84
Jan-86
Jan-88
Jan-90
Jan-92
Jan-94
Jan-96
Jan-98
Jan-00
Jan-02
370
371
372
373
374
375
376
Jan-02
Feb-02
Mar-02
Apr-02
May-02
Jun-02
Jul-02
Aug-02
Sep-02
Oct-02
Nov-02
Dec-02
2002http://cdiac.esd.ornl.gov/trends/co2/sio-mlo.htm
Climate and Global Change Notes
14-18
Greenhouse Gases
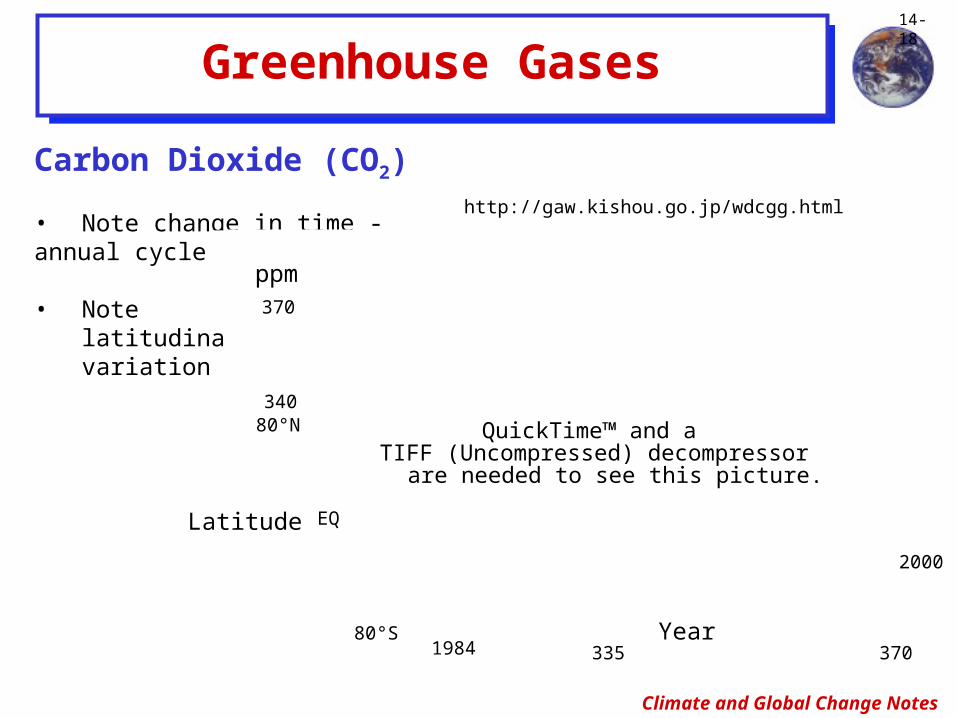
Carbon Dioxide (CO2)
• Note change in time - annual cycle
• Notelatitudinalvariation
QuickTime™ and aTIFF (Uncompressed) decompressor
are needed to see this picture.
Latitude
Year
ppm370
1984
2000
80°S
80°N340
http://gaw.kishou.go.jp/wdcgg.html
EQ
370335
Climate and Global Change Notes
14-19
Greenhouse Gases
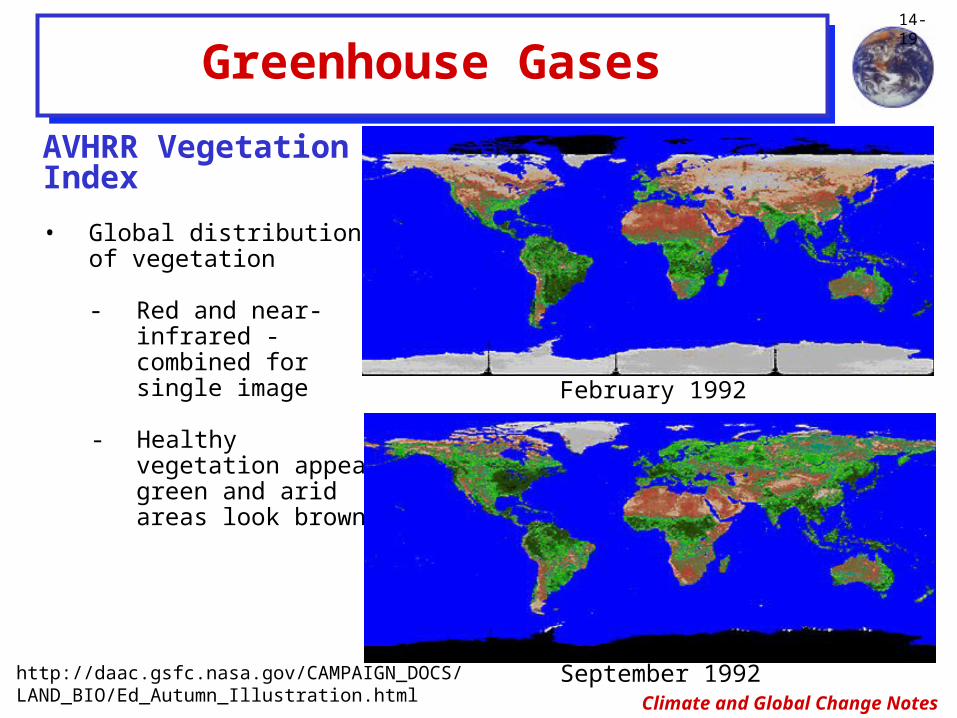
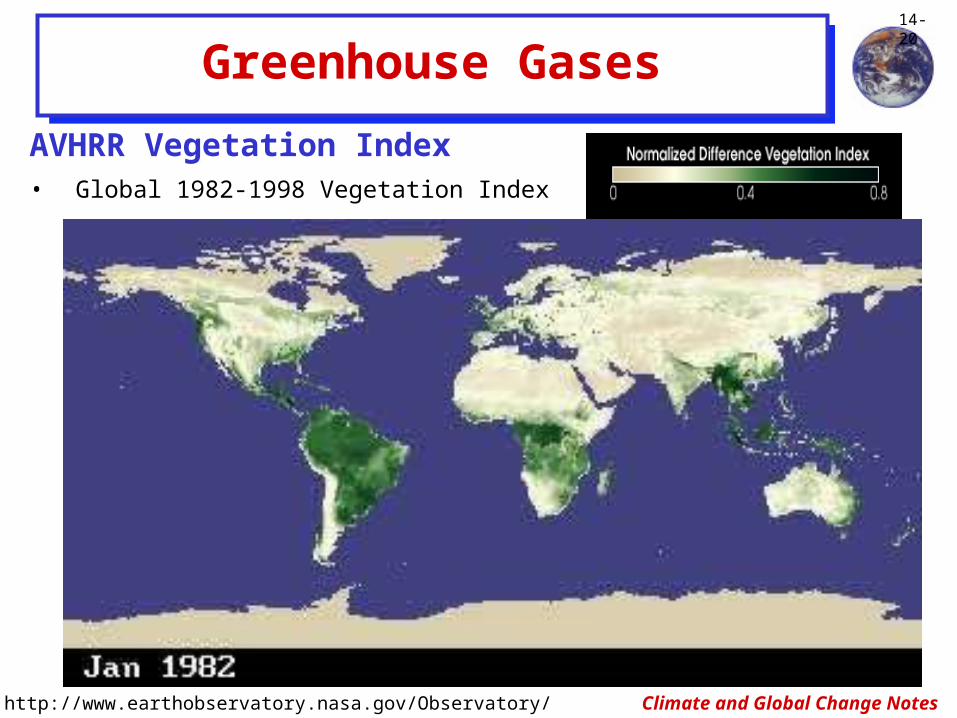
AVHRR Vegetation Index
• Global distribution of vegetation
- Red and near-infrared -combined for single image
- Healthy vegetation appears green and arid areas look brown.
February 1992
September 1992http://daac.gsfc.nasa.gov/CAMPAIGN_DOCS/LAND_BIO/Ed_Autumn_Illustration.html
Climate and Global Change Notes
14-20
Greenhouse Gases
AVHRR Vegetation Index• Global 1982-1998 Vegetation Index
http://www.earthobservatory.nasa.gov/Observatory/

Climate and Global Change Notes
14-21
Greenhouse Gases
Phytoplankton Bloom• Chlorophyll - Red most; Blue least
http://oceancolor.gsfc.nasa.gov/cgi/level3.pl?DAY=20Oct2004&PER=&TYP=machl&RRW=16
Jan 2004 Apr 2004
Jul 2004 Oct 2004

Climate and Global Change Notes
14-22
Greenhouse Gases
http://www.epa.gov/reg3artd/images/warm.jpg
QuickTime™ and aTIFF (LZW) decompressor
are needed to see this picture.
CO2 National/Region Emissions
• 1995 versus projected 2035
• Note change in distribution
• Note almost doubling of total release
U.S. CO2 Emissions and Source
QuickTime™ and aTIFF (Uncompressed) decompressor
are needed to see this picture.
Climate and Global Change Notes
14-23
Greenhouse Gases
QuickTime™ and aTIFF (LZW) decompressor
are needed to see this picture.
QuickTime™ and aTIFF (LZW) decompressor
are needed to see this picture.
http://eetd.lbl.gov/newsletter/cbs_nl/nl15/ghg.html
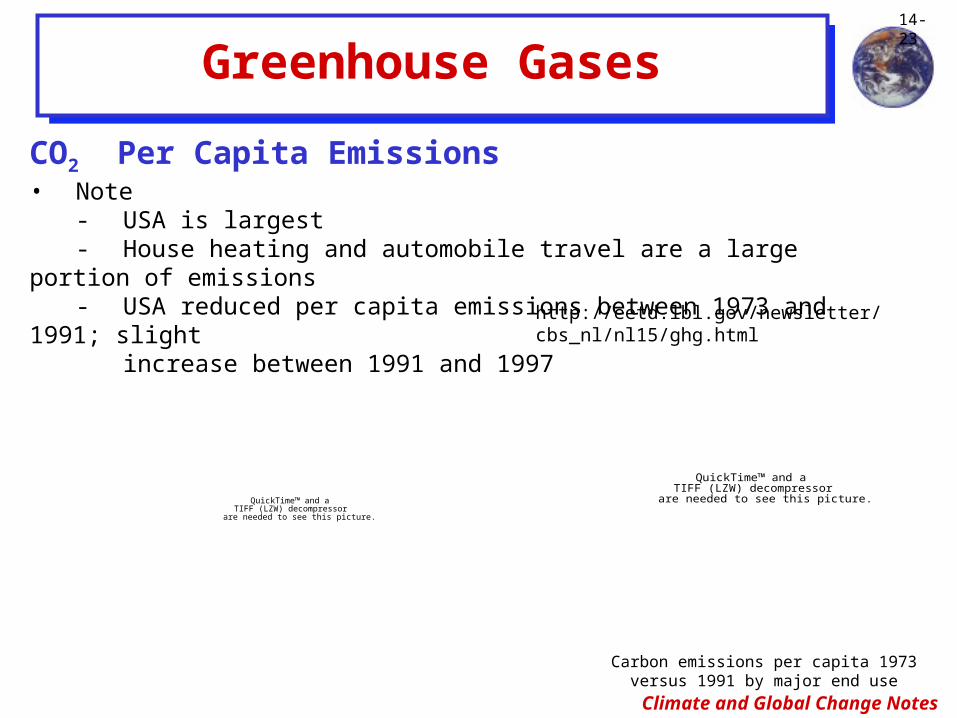
CO2 Per Capita Emissions• Note
- USA is largest- House heating and automobile travel are a large
portion of emissions- USA reduced per capita emissions between 1973 and
1991; slight increase between 1991 and 1997
Carbon emissions per capita 1973 versus 1991 by major end use
Climate and Global Change Notes
14-24
Greenhouse Gases
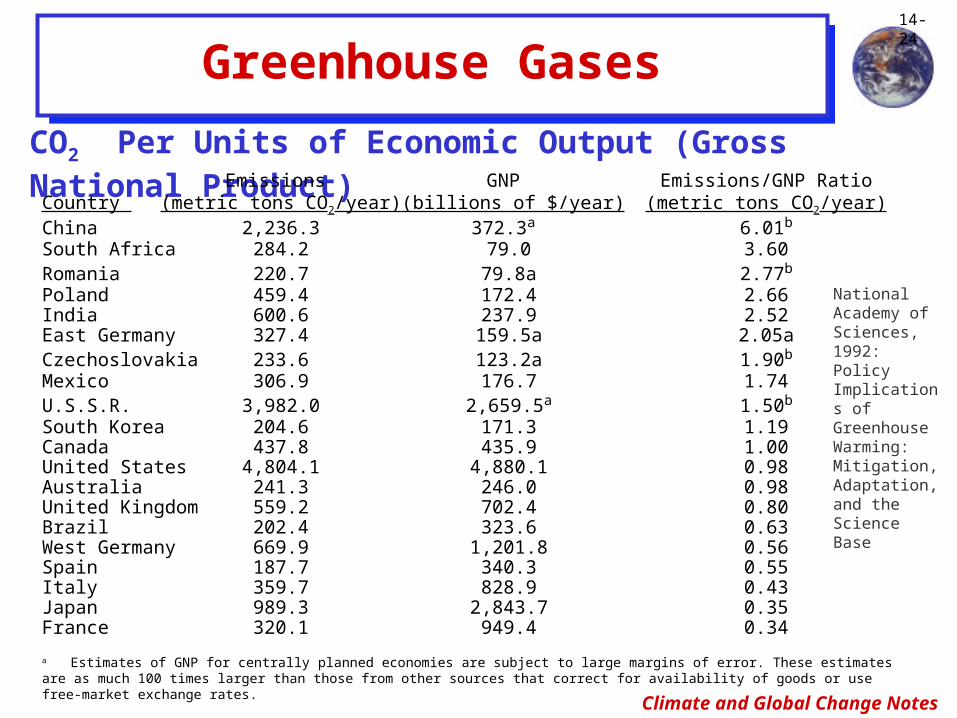
CO2 Per Units of Economic Output (Gross National Product)Emissions GNP Emissions/GNP RatioCountry (metric tons CO2/year)(billions of $/year) (metric tons CO2/year)China 2,236.3 372.3a 6.01b
South Africa 284.2 79.0 3.60Romania 220.7 79.8a 2.77b
Poland 459.4 172.4 2.66India 600.6 237.9 2.52East Germany 327.4 159.5a 2.05aCzechoslovakia 233.6 123.2a 1.90b
Mexico 306.9 176.7 1.74U.S.S.R. 3,982.0 2,659.5a 1.50b
South Korea 204.6 171.3 1.19Canada 437.8 435.9 1.00United States 4,804.1 4,880.1 0.98Australia 241.3 246.0 0.98United Kingdom 559.2 702.4 0.80Brazil 202.4 323.6 0.63West Germany 669.9 1,201.8 0.56Spain 187.7 340.3 0.55Italy 359.7 828.9 0.43Japan 989.3 2,843.7 0.35France 320.1 949.4 0.34
a Estimates of GNP for centrally planned economies are subject to large margins of error. These estimates are as much 100 times larger than those from other sources that correct for availability of goods or use free-market exchange rates.
b The emissions/GNP is also likely to be underestimated for centrally planned economies. Source: National Academy of Sciences, Policy Implications of Global Warming (Washington, D.C.: 1991).
National Academy of Sciences, 1992:Policy Implications of Greenhouse Warming: Mitigation, Adaptation, and the Science Base
Climate and Global Change Notes
14-25
Greenhouse Gases
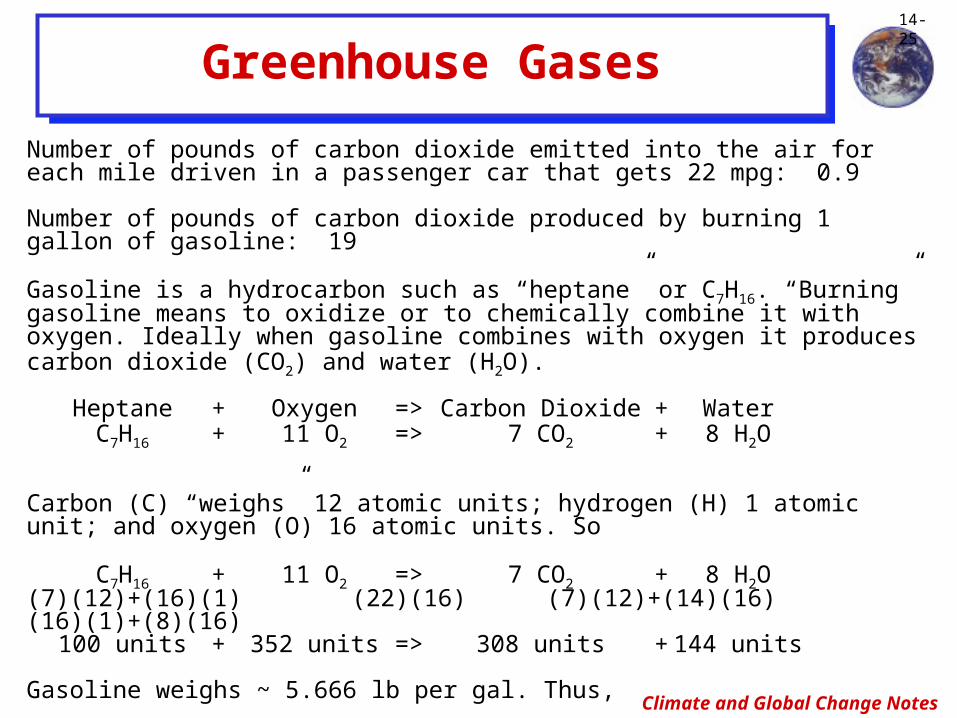
Number of pounds of carbon dioxide emitted into the air for each mile driven in a passenger car that gets 22 mpg: 0.9
Number of pounds of carbon dioxide produced by burning 1 gallon of gasoline: 19
Gasoline is a hydrocarbon such as “heptane” or C7H16. “Burning” gasoline means to oxidize or to chemically combine it with oxygen. Ideally when gasoline combines with oxygen it produces carbon dioxide (CO2) and water (H2O).
Heptane + Oxygen => Carbon Dioxide + WaterC7H16 + 11 O2 => 7 CO2 + 8 H2O
Carbon (C) “weighs” 12 atomic units; hydrogen (H) 1 atomic unit; and oxygen (O) 16 atomic units. So
C7H16 + 11 O2 => 7 CO2 + 8 H2O(7)(12)+(16)(1) (22)(16) (7)(12)+(14)(16)(16)(1)+(8)(16)
100 units + 352 units => 308 units + 144 units
Gasoline weighs ~ 5.666 lb per gal. Thus,
C7H16 + 11 O2 => 7 CO2 + 8 H2O 5.666 lb + 19.94 lb => 17.45 lb + 8.15 lb
Climate and Global Change Notes
14-26
Greenhouse Gases
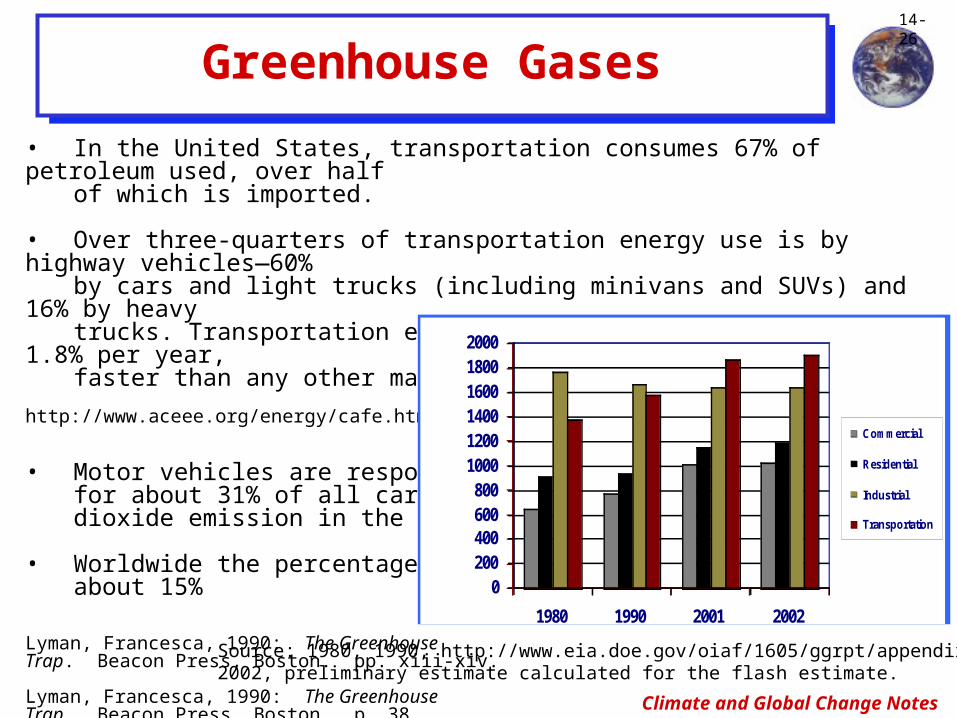
• In the United States, transportation consumes 67% of petroleum used, over half
of which is imported.
• Over three-quarters of transportation energy use is by highway vehicles—60%
by cars and light trucks (including minivans and SUVs) and 16% by heavy
trucks. Transportation energy consumption is increasing by 1.8% per year,
faster than any other major category of energy use.
http://www.aceee.org/energy/cafe.htm
• Motor vehicles are responsible for about 31% of all carbon dioxide emission in the U.S.
• Worldwide the percentage is about 15%
Lyman, Francesca, 1990: The Greenhouse Trap. Beacon Press, Boston. pp. xiii-xiv.
Lyman, Francesca, 1990: The Greenhouse Trap. Beacon Press, Boston. p. 38.
0200400600800
100012001400160018002000
1980 1990 2001 2002
MMTCO
2 Commercial
Residential
Industrial
Transportation
Source: 1980, 1990, http://www.eia.doe.gov/oiaf/1605/ggrpt/appendixe.html2002, preliminary estimate calculated for the flash estimate.
Climate and Global Change Notes
14-27
Greenhouse Gases
10
12
14
16
18
20
22
24
26
1975 1980 1985 1990 1995 2000 2005
Miles Per Gallon
CarsLight Trucks & SUVsCombined
15
20
25
30
35
40
45
50
55
1975 1980 1985 1990 1995 2000 2005
Year
Percentage
Light Truck & SUV Percentage
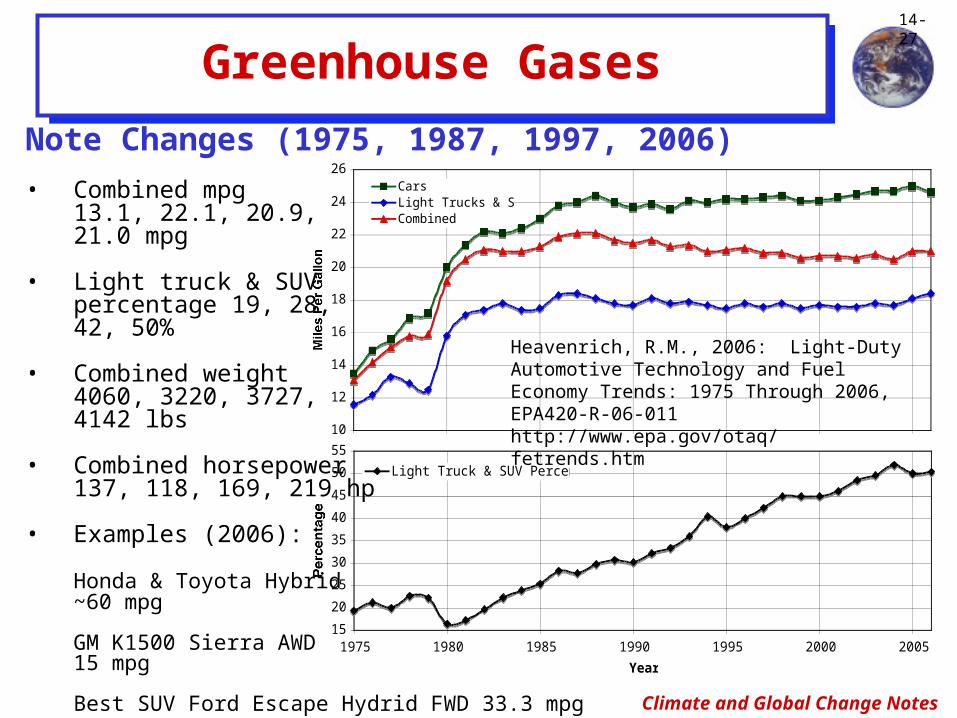
Note Changes (1975, 1987, 1997, 2006)
• Combined mpg13.1, 22.1, 20.9, 21.0 mpg
• Light truck & SUV percentage 19, 28, 42, 50%
• Combined weight4060, 3220, 3727, 4142 lbs
• Combined horsepower137, 118, 169, 219 hp
• Examples (2006):
Honda & Toyota Hybrid ~60 mpg
GM K1500 Sierra AWD 15 mpg
Best SUV Ford Escape Hydrid FWD 33.3 mpg
Heavenrich, R.M., 2006: Light-Duty Automotive Technology and Fuel Economy Trends: 1975 Through 2006, EPA420-R-06-011http://www.epa.gov/otaq/fetrends.htm
Climate and Global Change Notes
14-28
Greenhouse Gases
NBC’s Today Show
• May 13, 2005 - Will this summer's travel plans become a pain in the pump? As
part of an NBC News series looking at increasing gas prices, "Today" sent
three families driving from L.A. to N.Y. in six days, using three different
vehicles, for its "Today's Great American Gas Challenge." "Today" touches
base with the families as they report back live about their experiences from that
day's destination.
- "Today's Great American Gas Challenge" contestants were:
Riley family (Redding ,CA)Vehicle: Lincoln Navigator (SUV; 15 mpg)
Fowler family (Long Beach, CA)Vehicle: Ford 500 (Midsize; 25 mpg)
Pletcher family (Thousand Oaks, CA)Vehicle: Honda Civic Hybrid (40 mpg)
- Most expensive gas for trip - Ludlow, CA - $2.96/gallon
Cheapest gas for trip - Howe, IN - $1.91/gallon
- Gas Mileage and Total Amount Spent on Gas
Riley Family (SUV): 17 mpg - $459.27Fowler Family (Midsize): 26 mpg - $277.98Pletcher Family (Hybrid): 42 mpg - $172.67
Climate and Global Change Notes
14-29
Greenhouse Gases
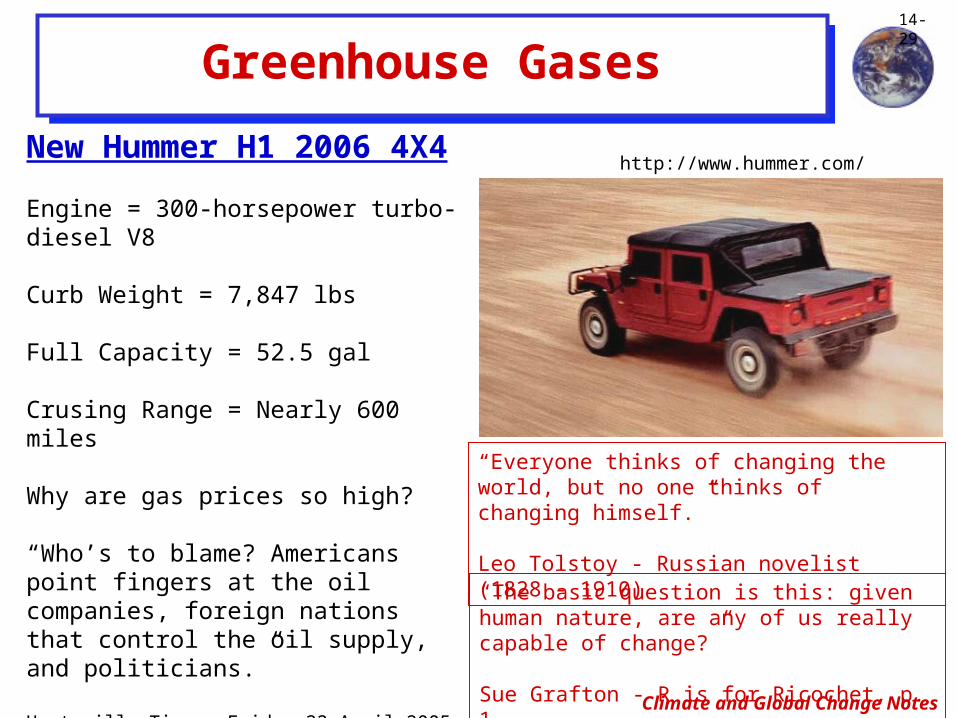
New Hummer H1 2006 4X4
Engine = 300-horsepower turbo-diesel V8
Curb Weight = 7,847 lbs
Full Capacity = 52.5 gal
Crusing Range = Nearly 600 miles
Why are gas prices so high?
“Who’s to blame? Americans point fingers at the oil companies, foreign nations that control the oil supply, and politicians.”
Huntsville Times, Friday 22 April 2005, Front page
http://www.hummer.com/
“Everyone thinks of changing the world, but no one thinks of changing himself.”
Leo Tolstoy - Russian novelist (1828 - 1910)“The basic question is this: given human nature, are any of us really capable of change?”
Sue Grafton - R is for Ricochet, p. 1
Climate and Global Change Notes
14-30
Greenhouse Gases
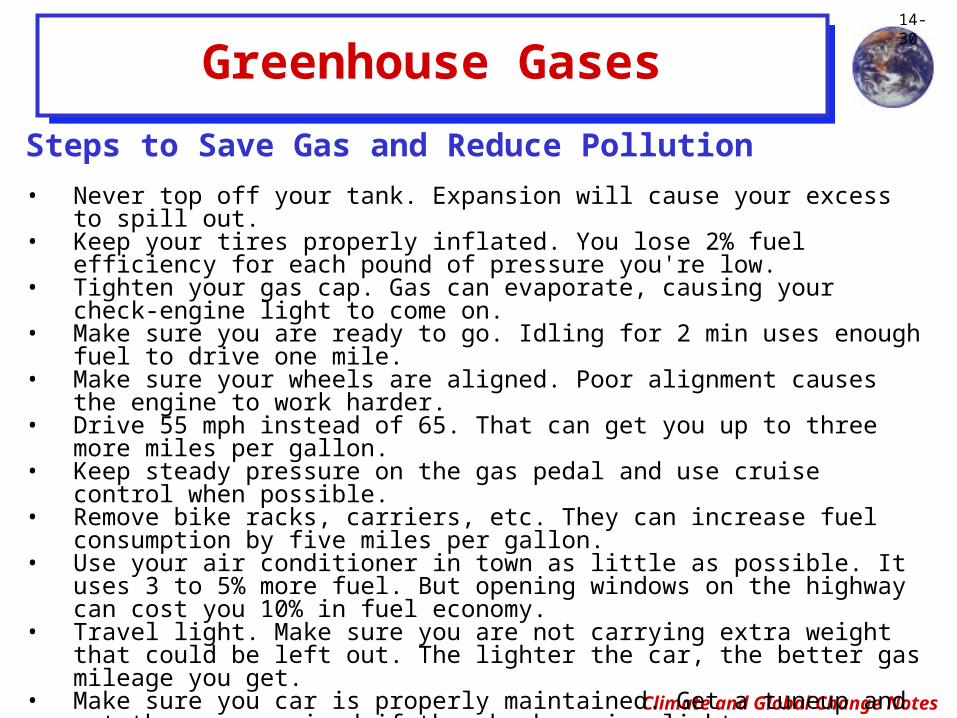
Steps to Save Gas and Reduce Pollution
• Never top off your tank. Expansion will cause your excess to spill out.
• Keep your tires properly inflated. You lose 2% fuel efficiency for each pound of pressure you're low.
• Tighten your gas cap. Gas can evaporate, causing your check-engine light to come on.
• Make sure you are ready to go. Idling for 2 min uses enough fuel to drive one mile.
• Make sure your wheels are aligned. Poor alignment causes the engine to work harder.
• Drive 55 mph instead of 65. That can get you up to three more miles per gallon.
• Keep steady pressure on the gas pedal and use cruise control when possible.
• Remove bike racks, carriers, etc. They can increase fuel consumption by five miles per gallon.
• Use your air conditioner in town as little as possible. It uses 3 to 5% more fuel. But opening windows on the highway can cost you 10% in fuel economy.
• Travel light. Make sure you are not carrying extra weight that could be left out. The lighter the car, the better gas mileage you get.
• Make sure you car is properly maintained. Get a tuneup and get the car serviced if the check-engine light comes on.
• Plan trips so that you take the shortest, most direct routes and make trips in one outing.
Huntsville Times (Sunday March 13, 2005) Source: AAA Alabama
Climate and Global Change Notes
14-31
Greenhouse Gases
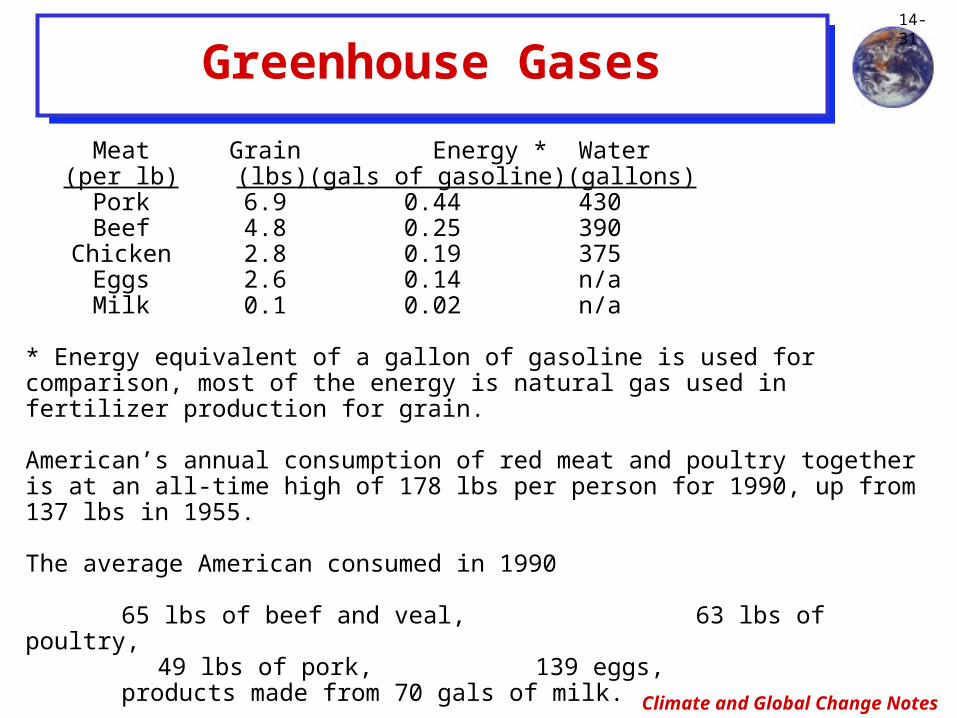
Meat Grain Energy * Water(per lb) (lbs)(gals of gasoline)(gallons)Pork 6.9 0.44 430Beef 4.8 0.25 390
Chicken 2.8 0.19 375Eggs 2.6 0.14 n/aMilk 0.1 0.02 n/a
* Energy equivalent of a gallon of gasoline is used for comparison, most of the energy is natural gas used in fertilizer production for grain.
American’s annual consumption of red meat and poultry together is at an all-time high of 178 lbs per person for 1990, up from 137 lbs in 1955.
The average American consumed in 1990
65 lbs of beef and veal, 63 lbs of poultry,
49 lbs of pork, 139 eggs,products made from 70 gals of milk.
Durning, Alan B., 1991: Fat of the land. World-Watch. 4:3, pp. 11-17.
Climate and Global Change Notes
14-32
Greenhouse Gases
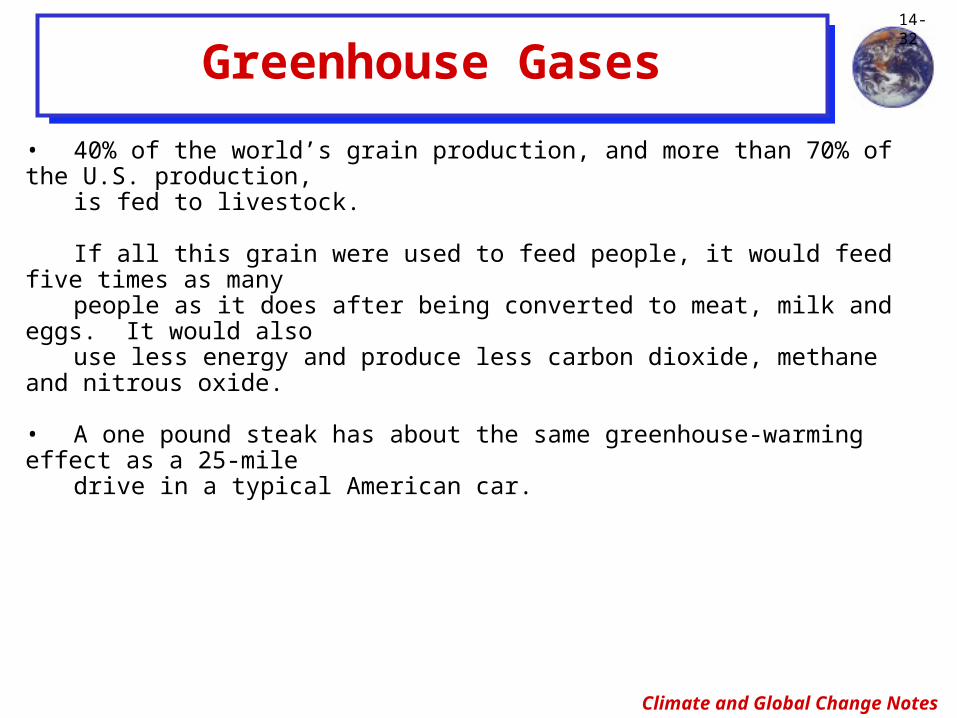
• 40% of the world’s grain production, and more than 70% of the U.S. production,
is fed to livestock.
If all this grain were used to feed people, it would feed five times as many
people as it does after being converted to meat, milk and eggs. It would also
use less energy and produce less carbon dioxide, methane and nitrous oxide.
• A one pound steak has about the same greenhouse-warming effect as a 25-mile
drive in a typical American car.
Durning, Alan B., 1991: Fat of the land. World-Watch. 4:3, pp. 11-17.
Climate and Global Change Notes
14-33
QuickTime™ and aTIFF (LZW) decompressor
are needed to see this picture.
El Niño Years
Greenhouse Gases
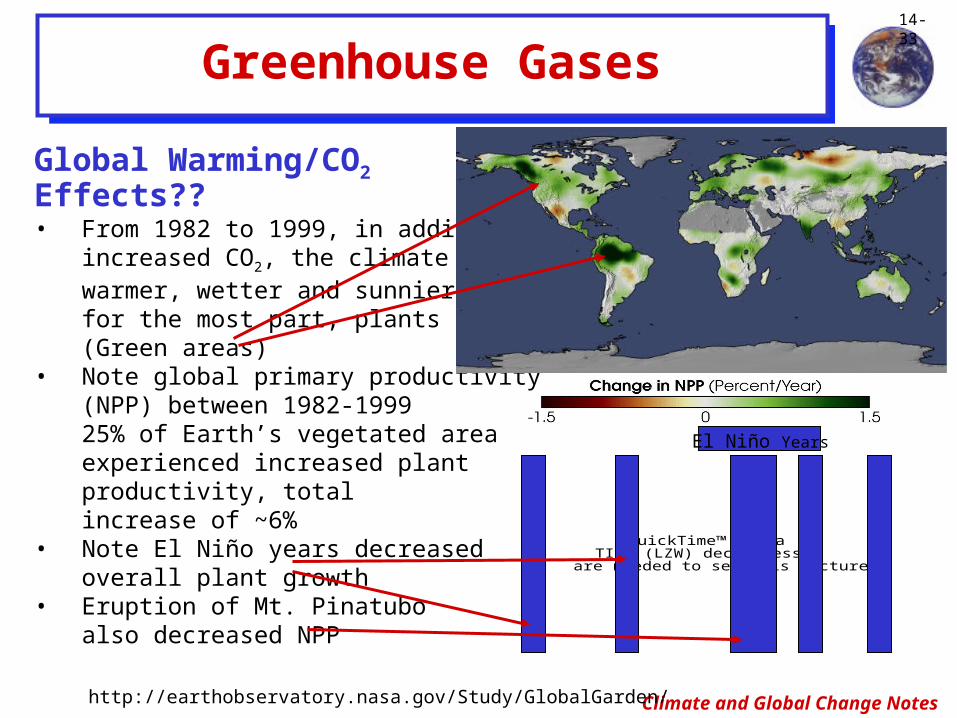
Global Warming/CO2 Effects??• From 1982 to 1999, in addition to
increased CO2, the climate grewwarmer, wetter and sunnier, andfor the most part, plants flourished(Green areas)
• Note global primary productivity (NPP) between 1982-1999 25% of Earth’s vegetated area experienced increased plant productivity, total increase of ~6%
• Note El Niño years decreased overall plant growth
• Eruption of Mt. Pinatubo also decreased NPP
http://earthobservatory.nasa.gov/Study/GlobalGarden/
Climate and Global Change Notes
14-34
Greenhouse Gases
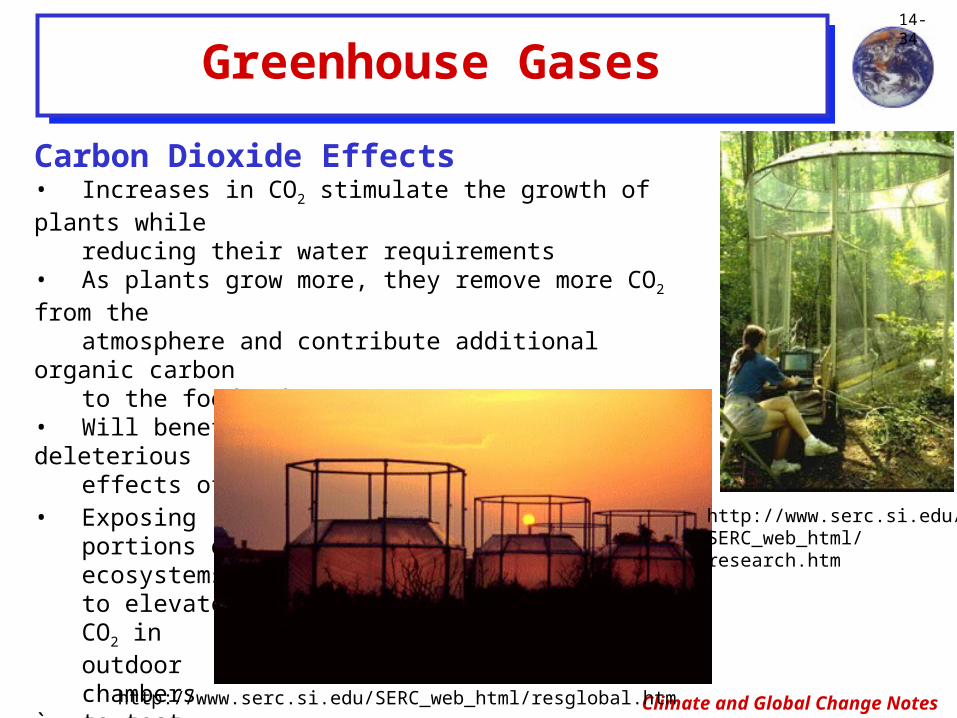
Carbon Dioxide Effects• Increases in CO2 stimulate the growth of plants while
reducing their water requirements • As plants grow more, they remove more CO2 from the
atmosphere and contribute additional organic carbon
to the food web• Will benefits to plants help offset the deleterious
effects of rising CO2 concentrations? • Exposing
portions of ecosystems to elevated CO2 in outdoor chambers
` to testhttp://www.serc.si.edu/SERC_web_html/resglobal.htm
http://www.serc.si.edu/SERC_web_html/research.htm
Climate and Global Change Notes
14-35
Methane (CH4)
• 3.5 billion years ago, there was 1,000 times more CH4. Earliest CH4 formed by
volcanoes and ancient bacteria that converted H2 and CO2 into CH4 and H2O • Makes up 96% of natural gas
• 50 million more tons per year into atmosphere
• Sources
- Rotting of organic matter in peat bogs- Wetlands, rice patties, landfills- Bacteria living in digestive tracks of farm
animals such as cattle- Termites
Greenhouse Gases
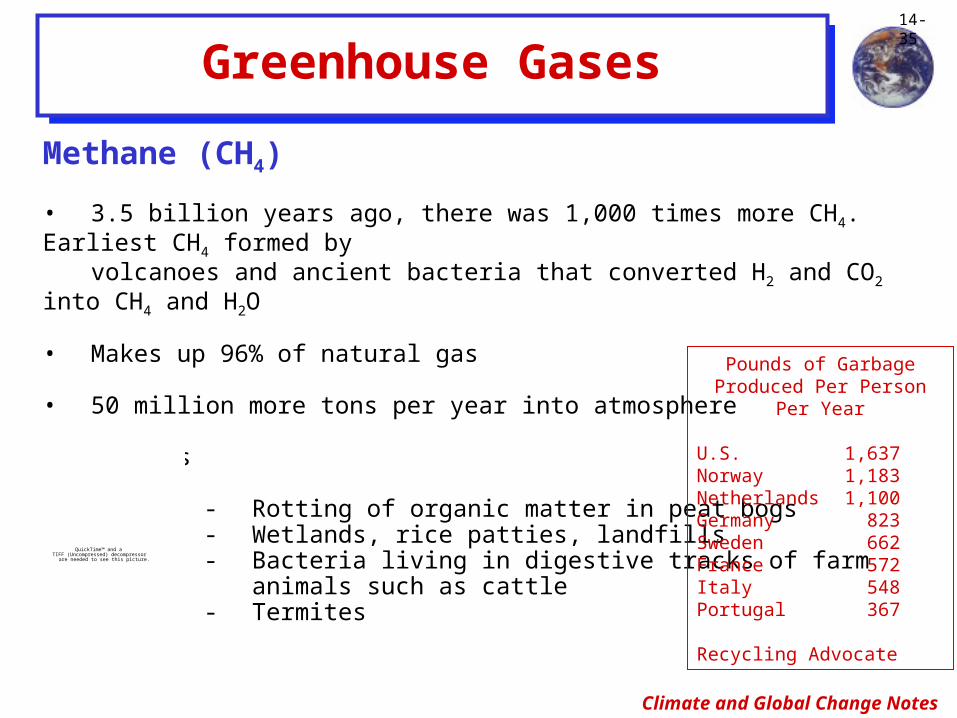
Pounds of Garbage Produced Per Person
Per Year
U.S. 1,637Norway 1,183Netherlands 1,100Germany 823Sweden 662France 572Italy 548Portugal 367
Recycling Advocate
QuickTime™ and aTIFF (Uncompressed) decompressor
are needed to see this picture.
Climate and Global Change Notes
14-36
Greenhouse Gases
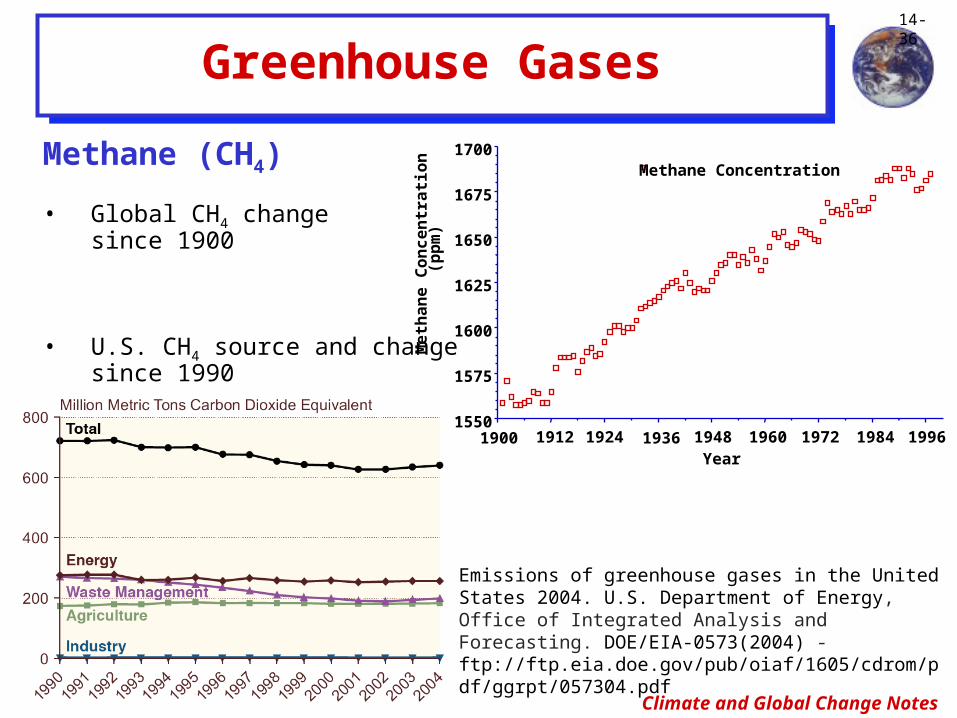
Methane (CH4)
• Global CH4 change since 1900
• U.S. CH4 source and change since 1990
1996198419721960194819361924191219001550
1575
1600
1625
1650
1675
1700Methane Concentration
Year
Methane Concentration
(ppm)
Emissions of greenhouse gases in the United States 2004. U.S. Department of Energy, Office of Integrated Analysis and Forecasting. DOE/EIA-0573(2004) - ftp://ftp.eia.doe.gov/pub/oiaf/1605/cdrom/pdf/ggrpt/057304.pdf
Climate and Global Change Notes
14-37
Greenhouse Gases
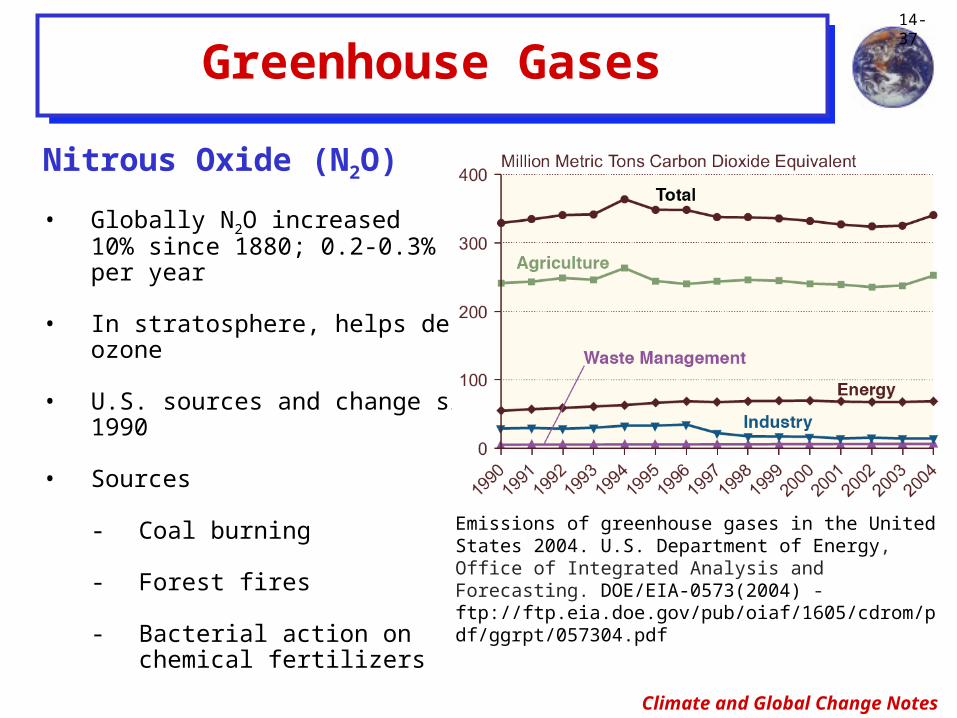
Nitrous Oxide (N2O)
• Globally N2O increased 10% since 1880; 0.2-0.3% per year
• In stratosphere, helps destroy ozone
• U.S. sources and change since 1990
• Sources
- Coal burning
- Forest fires
- Bacterial action on chemical fertilizers
Emissions of greenhouse gases in the United States 2004. U.S. Department of Energy, Office of Integrated Analysis and Forecasting. DOE/EIA-0573(2004) - ftp://ftp.eia.doe.gov/pub/oiaf/1605/cdrom/pdf/ggrpt/057304.pdf
Climate and Global Change Notes
14-38
Greenhouse Gases
Chlorofluorocarbons (CFCs)
• Sources
- Refrigeration and air conditioning
- Aerosols
- Blowing agent in plastic foams
- Solvent for cleaning electronic parts
- Some fire extinguishers
Climate and Global Change Notes
14-39
Greenhouse Gases
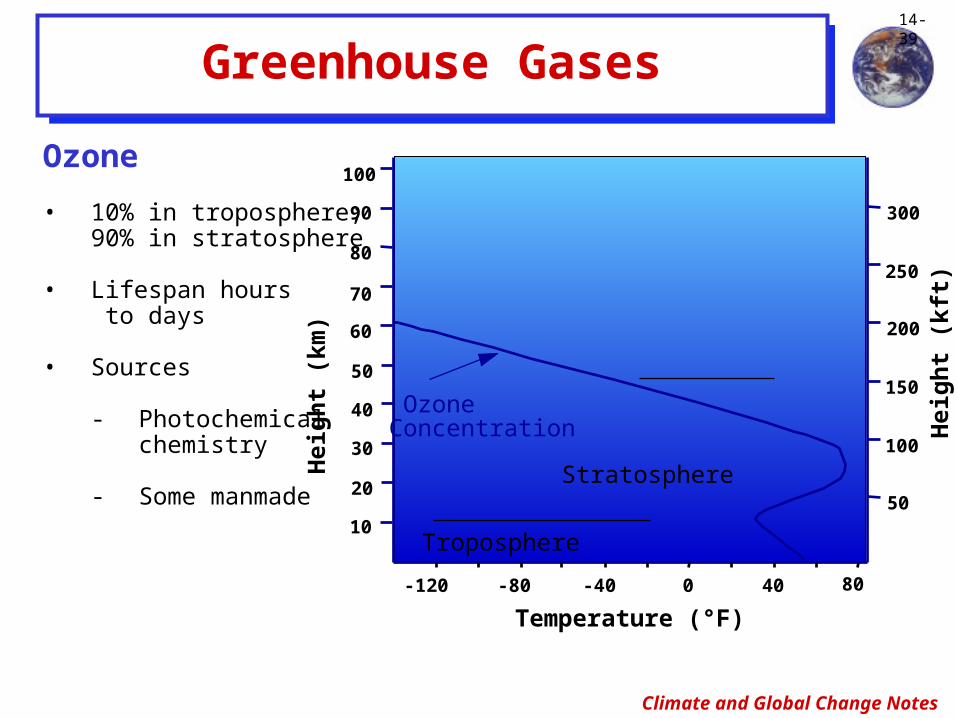
Ozone
• 10% in troposphere; 90% in stratosphere
• Lifespan hours to days
• Sources
- Photochemicalchemistry
- Some manmadeStratosphere
Troposphere10
20
30
40
50
60
70
80
90
100
Temperature (°F)-120 -80 -40 0 40 80
50
100
150
200
250
300
Ozone Concentration
Height (km)
Height (kft)
Climate and Global Change Notes
14-40
Greenhouse Gases
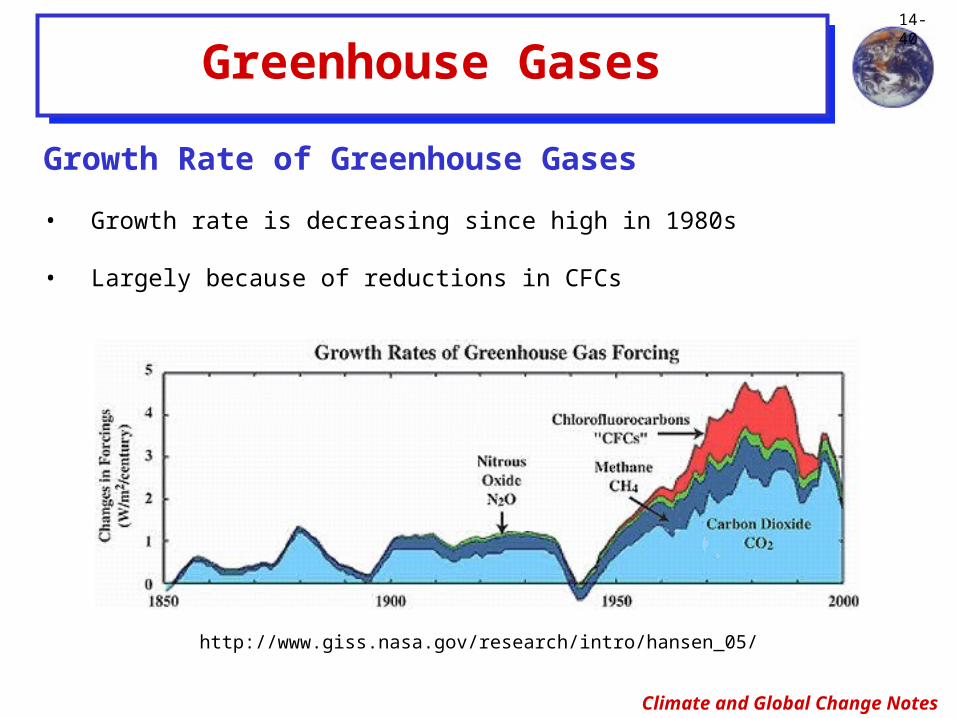
Growth Rate of Greenhouse Gases
• Growth rate is decreasing since high in 1980s
• Largely because of reductions in CFCs
http://www.giss.nasa.gov/research/intro/hansen_05/