Embed Size (px)
Citation preview
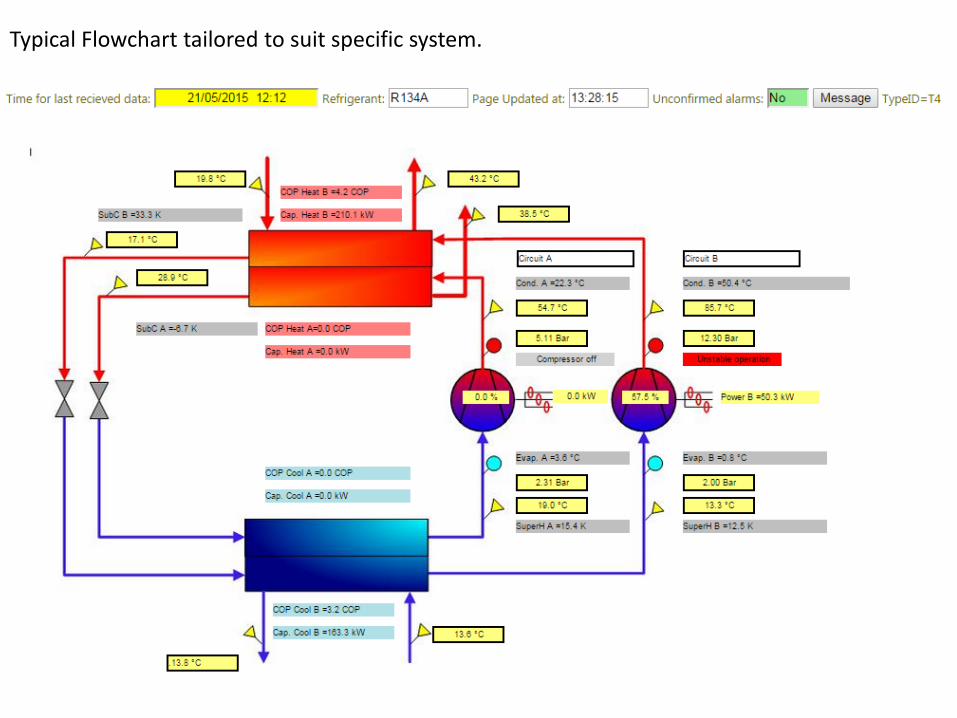
Typical Flowchart tailored to suit specific system.
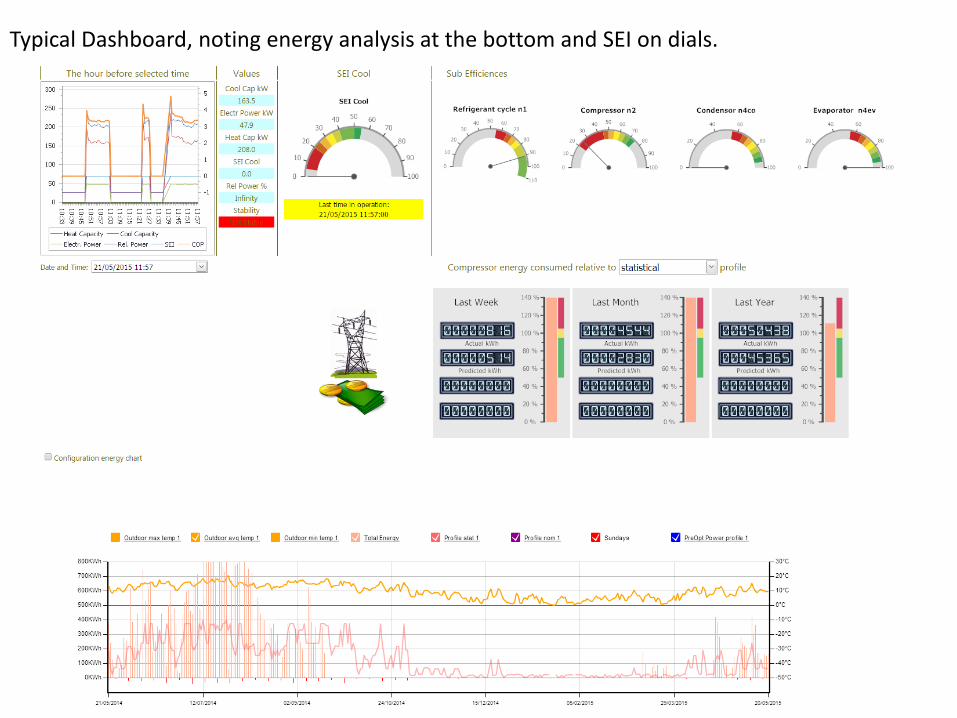
Typical Dashboard, noting energy analysis at the bottom and SEI on dials.
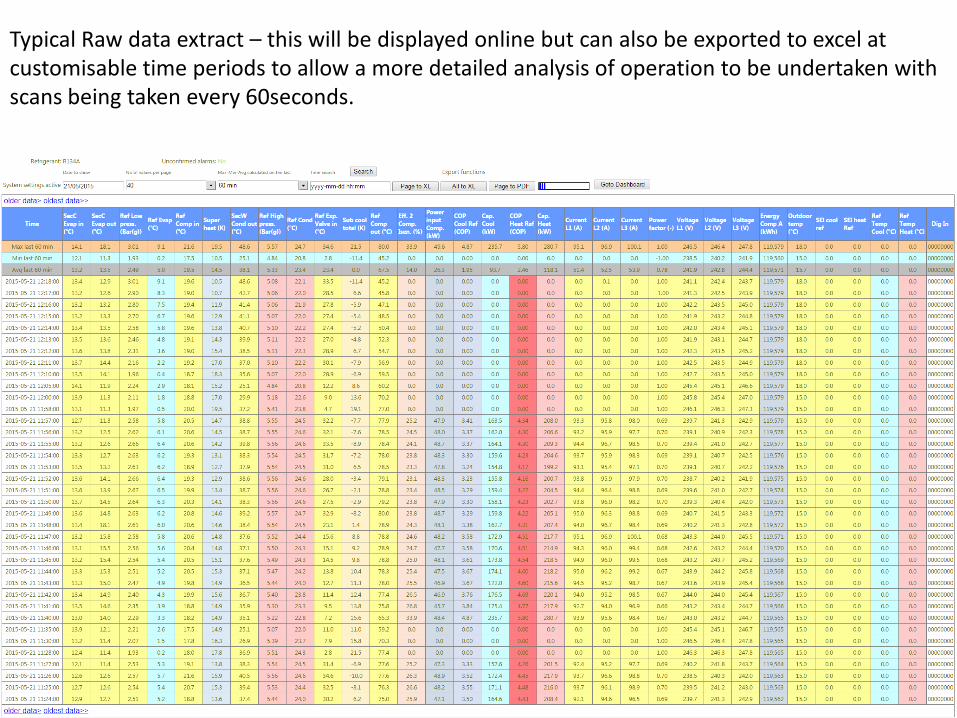
Typical Raw data extract – this will be displayed online but can also be exported to excel at customisable time periods to allow a more detailed analysis of operation to be undertaken with scans being taken every 60seconds.
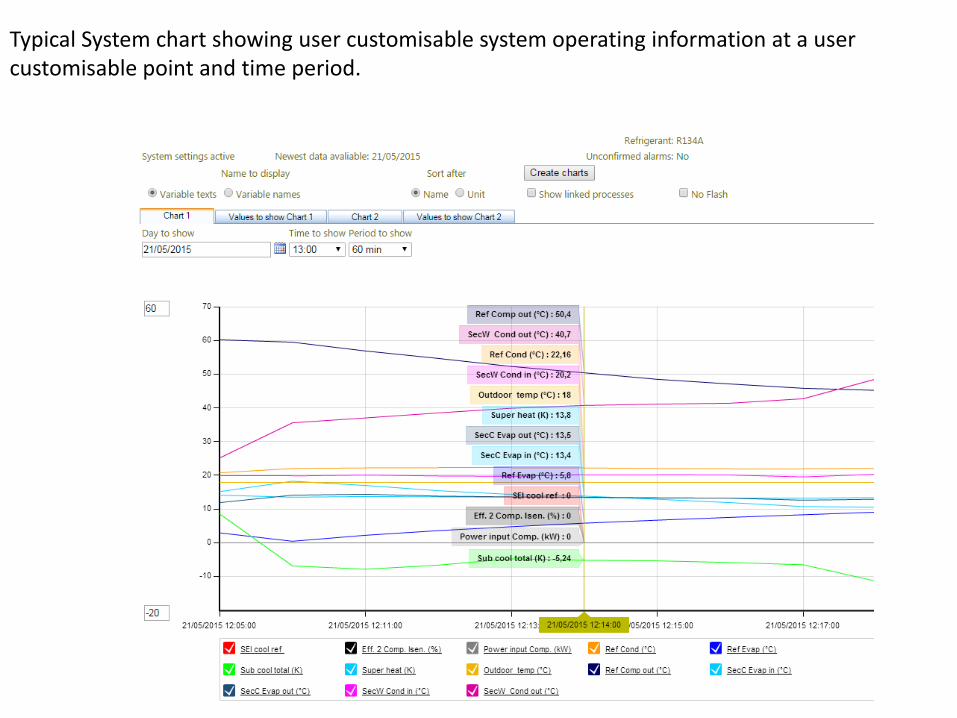
Typical System chart showing user customisable system operating information at a user customisable point and time period.
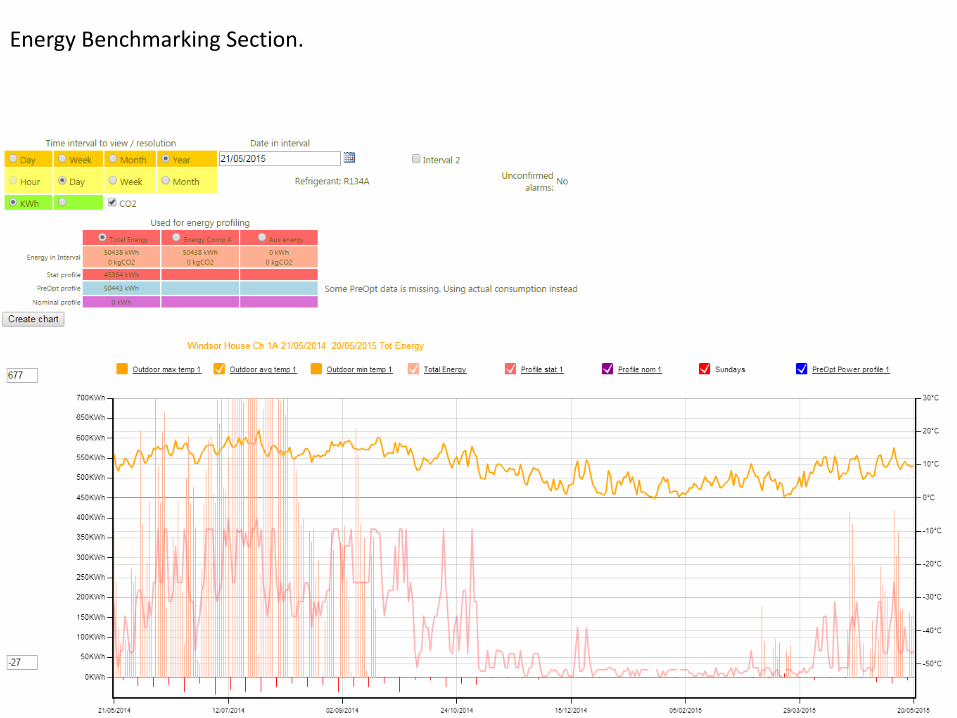
Energy Benchmarking Section.
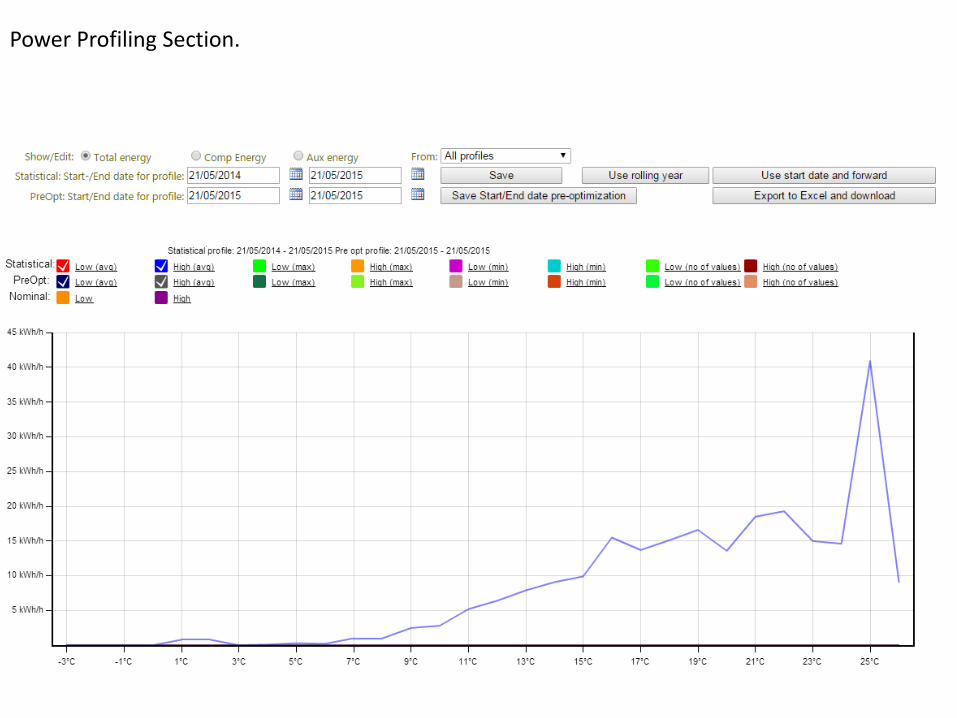
Power Profiling Section.

Alarm Display Section – please note that alarms parameters are use programmable and offer the possibility to link a number f running parameters together to provide complex alarms.


![[ COPY ] Memory and Learning - Psychology slides](https://img.pdfslide.us/doc/110x75/587c3d9a1a28ab5a1d8b58b3/-copy-memory-and-learning-psychology-slides.jpg)