Embed Size (px)
Citation preview

doi.org/10.26434/chemrxiv.10083383.v1
Clickable Galactose Analogs for Imaging Glycans in DevelopingZebrafishJessica Daughtry, Wendy Cao, Johnny Ye, Jeremy Baskin
Submitted date: 30/10/2019 • Posted date: 31/10/2019Licence: CC BY-NC-ND 4.0Citation information: Daughtry, Jessica; Cao, Wendy; Ye, Johnny; Baskin, Jeremy (2019): ClickableGalactose Analogs for Imaging Glycans in Developing Zebrafish. ChemRxiv. Preprint.
Galactose is one of only nine monosaccharide precursors used to build complex glycans in vertebrates.Defects in galactose metabolism cause galactosemia and lysosomal storage diseases, and the ability tovisualize metabolic flux through these pathways would help to understand mechanisms underlying diseasepathogenesis. Bioorthogonal metabolic reporters are widely used tools to image glycan biosynthesis, but todate, no galactose analogs have capitalized on this strategy. We demonstrate that the galactose salvagepathway is remarkably intolerant of unnatural galactose and galactose-1-phosphate analogs. Subtlemodifications to uridine diphosphate galactose (UDP-Gal), the universal donor for galactosyltransferases,however, yielded effective metabolic probes for labeling glycans in vivo. We applied 6-alkynyl UDP-Gal,followed by click chemistry tagging, to visualize glycosylation during zebrafish development, revealing astriking accumulation into glycan-rich ridges within the organism’s enveloping layer. UDP-Gal analogsrepresent a new class of glycan metabolic probes for revealing physiological and pathological changes inglycosylation in vivo.
File list (2)
download fileview on ChemRxivDaughtry manuscript final.pdf (3.75 MiB)
download fileview on ChemRxivDaughtry manuscript SI final.pdf (1.62 MiB)

1
Clickable Galactose Analogs for Imaging Glycans in Developing Zebrafish
Jessica L. Daughtry1, Wendy Cao1, Johnny Ye1, and Jeremy M. Baskin1*
1 Department of Chemistry and Chemical Biology and Weill Institute for Cell and
Molecular Biology, Cornell University, 461 Weill Hall, Ithaca, New York, USA 14853
* Correspondence to Jeremy Baskin: [email protected]
ABSTRACT
Galactose is one of only nine monosaccharide precursors used to build complex
glycans in vertebrates. Defects in galactose metabolism cause galactosemia and lysosomal
storage diseases, and the ability to visualize metabolic flux through these pathways would
help to understand mechanisms underlying disease pathogenesis. Bioorthogonal metabolic
reporters are widely used tools to image glycan biosynthesis, but to date, no galactose
analogs have capitalized on this strategy. We demonstrate that the galactose salvage
pathway is remarkably intolerant of unnatural galactose and galactose-1-phosphate
analogs. Subtle modifications to uridine diphosphate galactose (UDP-Gal), the universal
donor for galactosyltransferases, however, yielded effective metabolic probes for labeling
glycans in vivo. We applied 6-alkynyl UDP-Gal, followed by click chemistry tagging, to
visualize glycosylation during zebrafish development, revealing a striking accumulation
into glycan-rich ridges within the organism’s enveloping layer. UDP-Gal analogs represent
a new class of glycan metabolic probes for revealing physiological and pathological
changes in glycosylation in vivo.

2
INTRODUCTION
Glycans are the most structurally complex of all the natural biopolymers, and the
chemical diversity of protein glycosylation dwarfs that of other posttranslational
modifications. Yet, in the cells of higher eukaryotes, glycans are built from a small set of
only nine monosaccharide precursors. Among these privileged building blocks, galactose
(Gal) plays myriad important roles in the cell. The historical importance of Gal in
glycobiology and human health is underpinned by its discovery1 and structural
determination2 by Pasteur and Fischer, respectively, and its later elucidation as a key
constituent of the ABO blood group antigens3–5. Gal is now appreciated to be a ubiquitous
component of nearly all major forms of glycans, including N- and O-linked glycoproteins
and several types of glycolipids6.
Unsurprisingly, defects in Gal metabolism can cause severe diseases. Heritable
loss-of-function mutations in genes encoding enzymes that assimilate and catabolize
dietary Gal via the Leloir pathway result in galactosemia, which features a buildup of toxic
Gal-derived metabolites7. Severe galactosemia causes infant mortality, and milder forms
can permit life, though with serious developmental, physical, and cognitive disabilities
even under a highly lactose-restricted dietary regime8–10. Defects in the breakdown of Gal-
containing glycans cause several lysosomal storage diseases that also have severe health
consequences11. For example, Krabbe disease results from loss of a single galactosidase
responsible for hydrolysis of galactosylceramide lipids, leading to demyelination,
neurodegeneration, and infant mortality12,13.
Though the genetic and biochemical defects underlying these disorders of galactose
metabolism are established, the diseases are currently incurable. This clinical challenge

3
arises in part because glycosylation is not directly encoded in the genome. Instead, it is the
product of a complex web of metabolic and membrane trafficking reactions, where
alterations to a single player (i.e., a metabolic enzyme or a transporter) can have complex
and unpredictable effects on overall changes in pathway flux and the identities and
abundances of the resultant glycan structures and metabolic intermediates. A key set of
tools that has emerged over the past two decades to unravel the complexity of glycan
biosynthesis are metabolic reporters that enable the direct visualization of flux through
these pathways.
Metabolic oligosaccharide engineering involves the delivery to cells of synthetic
monosaccharide precursors that hijack glycan biosynthetic pathways and are incorporated
into glycan structures14–16. Following the metabolic labeling step, these reporters can be
subsequently tagged via a bioorthogonal click chemistry reaction17, which enables their
visualization by fluorescence microscopy or enrichment by affinity chromatography for
glycomic or glycoproteomic analysis. Sialic acids were the first glycan constituents to be
labeled in this manner, using analogs of a biosynthetic precursor, N-acetylmannosamine18–
23. Subsequently, several of the other monosaccharide constituents of vertebrate glycans
were targeted by this strategy, including N-acetylgalactosamine24, N-acetylglucosamine25,
fucose26,27, xylose28, and, most recently, glucose29. Importantly, metabolic labeling
followed by bioorthogonal tagging is a viable strategy for imaging changes in glycosylation
in vivo in animal models30–35, where changes in glycosylation can report on changes in
development and disease progression.
Gal represents one of the few remaining monosaccharides used for vertebrate
glycan biosynthesis that has not yet been targeted for imaging using metabolic reporters.
4
Critically, tools for monitoring changes in Gal incorporation into glycans could aid in
understanding changes in flux in glycan biosynthesis, trafficking, and degradation in
diseases of Gal metabolism. Here, we describe the design, synthesis, and validation of
unnatural Gal analogs as glycan metabolic reporters and their application to visualize
glycosylation occurring during zebrafish embryonic and larval development. Our studies
identify certain privileged Gal analogs as a new class of metabolic probes for glycosylation
and suggest future applications to image changes in glycan biosynthesis that accompany
both physiological and pathological changes in animal models of disease.
RESULTS AND DISCUSSION
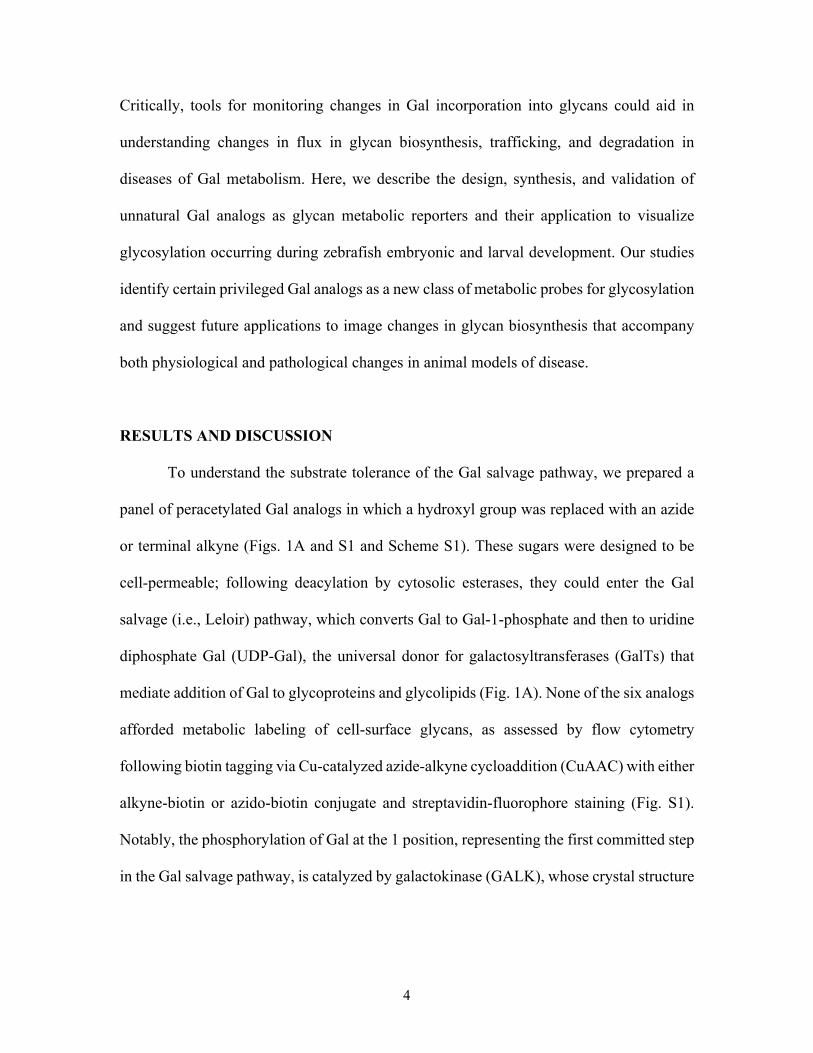
To understand the substrate tolerance of the Gal salvage pathway, we prepared a
panel of peracetylated Gal analogs in which a hydroxyl group was replaced with an azide
or terminal alkyne (Figs. 1A and S1 and Scheme S1). These sugars were designed to be
cell-permeable; following deacylation by cytosolic esterases, they could enter the Gal
salvage (i.e., Leloir) pathway, which converts Gal to Gal-1-phosphate and then to uridine
diphosphate Gal (UDP-Gal), the universal donor for galactosyltransferases (GalTs) that
mediate addition of Gal to glycoproteins and glycolipids (Fig. 1A). None of the six analogs
afforded metabolic labeling of cell-surface glycans, as assessed by flow cytometry
following biotin tagging via Cu-catalyzed azide-alkyne cycloaddition (CuAAC) with either
alkyne-biotin or azido-biotin conjugate and streptavidin-fluorophore staining (Fig. S1).
Notably, the phosphorylation of Gal at the 1 position, representing the first committed step
in the Gal salvage pathway, is catalyzed by galactokinase (GALK), whose crystal structure

5
reveals several key hydrogen bonds to the hydroxyl groups of Gal that may explain the
very limited tolerance of GALK to unnatural substrates36–38.
To probe the tolerance of later Gal salvage pathway steps to unnatural substrates,
we bypassed the restrictive GALK-catalyzed step by preparing a 6-deoxyazido analog of
Gal-1-phosphate, the product of the GALK reaction. We designed this analog to be cell
permeable by peracetylation of hydroxyl groups and protection of the phosphate with
hydrophobic and esterase-sensitive S-acetyl thioethyl (SATE) groups (Fig. S2 and Scheme
S2)39,40. We confirmed the use of the SATE strategy for enabling cell permeability by using
it to cage a known azide-modified metabolic reporter analog of N-acetylglucosamine-1-
phosphate41 as a positive control (Fig. S2). Interestingly, the SATE-protected 6-azido-Gal-
1-phosphate analog exhibited no detectable metabolic labeling of cell-surface glycans (Fig.
S2).
One possible conclusion from these studies is that even very small modifications to
Gal that would permit its tagging using bioorthogonal chemistry do not enable metabolic
labeling via the salvage pathway, in contrast to the majority of other reported
monosaccharides. The other possibility was that these precursors were being successfully
converted to the corresponding UDP-Gal analog but that these nucleotide sugars were
either not recognized by transporters for import into the Golgi apparatus or were not
substrates of GalTs.
To distinguish between these possibilities, we synthesized a 6-deoxyazido analog
of UDP-Gal (UDP-6AzGal, Fig. 1A) and evaluated whether it could be accepted as a GalT
substrate. For these studies, we used ceramide galactosyltransferase (CGT), which couples
UDP-Gal and ceramides to form a b-galactosylceramide (GalCer) products that can be

6
detected by liquid chromatography–mass spectrometry (LC–MS). We performed an in
vitro glycosylation reaction by treating lysates from HEK 293TN cells overexpressing
CGT with a non-natural, 17-carbon ceramide donor and UDP-6AzGal (Fig. 2A). To
enhance MS detection, we carried out a subsequent CuAAC tagging reaction with an
alkynyl quaternary ammonium reagent (Alk-QA)42,43. Gratifyingly, we observed formation
of the expected QA-modified GalCer product, confirming that UDP-6AzGal could indeed
act as a GalT substrate (Fig. 2B).
We next strove to apply UDP-6AzGal as a metabolic substrate for visualizing
glycosylation in live cells. Because of their negative charges, nucleotide sugars are not cell-
permeable, and thus we turned to zebrafish embryos, which can be easily microinjected
and serve as a powerful vertebrate system for imaging the biosynthesis of several types of
glycans during embryonic and larval development using the bioorthogonal metabolic
reporter strategy28,30,44–46.
In these studies, we microinjected either UDP-6AzGal or an analogous alkynyl
analog, UDP-6AlGal (Scheme S3), whose acetylene tag represents a slightly smaller
perturbation than the azido group, into the yolk of zebrafish embryos at the one-cell stage,
allowing for permeation of the unnatural sugar into the cell. Following 24 hours of
development, we observed minimal toxicity and developmental defects at the injected
doses with UDP-6AlGal and moderate toxicity with UDP-6AzGal. We thus proceeded with
UDP-6AlGal for all future studies in zebrafish.
First, we generated lysates at the 24 hour-post fertilization (hpf) timepoint, and the
metabolically labeled glycoproteins were tagged with azido-biotin via CuAAC, followed
by Western blot with streptavidin-HRP. We observed substantial labeling of glycoproteins

7
(Fig. 3A and B). To determine the types of glycans being labeled, we took advantage of
chemical differences between O- and N-linked glycans, which can be selectively removed
either chemically or enzymatically, respectively.
To assess the extent of UDP-6AlGal labeling within O-glycans, the post-CuAAC
lysate was transferred to a PVDF membrane following SDS-PAGE, and O-glycans were
removed by b-elimination with sodium hydroxide. Under these conditions, we observed
no loss of UDP-6AlGal-derived signal (Fig. 3A, C). As important controls, lysates from
HeLa cells metabolically labeled with peracetylated N-(4-pentynoyl)mannosamine
(Ac4ManNAl) or N-(4-pentynoyl)galactosamine (Ac4GalNAl), both of which result in a
substantial level of incorporation into O-linked glycans21,22,47, led to a b-elimination-
dependent loss of signal using this assay (Fig. S3). Thus, we conclude that only a negligible
fraction of UDP-6AlGal signal derives from all forms of O-linked glycoproteins.
To assess the extent of UDP-6AlGal incorporation into N-linked glycans, we
performed glycosidase digestion of metabolically labeled lysates with peptide N-
glycosidase F (PNGase F), which cleaves N-glycans from the protein backbone. Following
digestion, we performed CuAAC tagging with azido-biotin and Western blot analysis as
above and observed a substantial (~50%) decrease in overall signal in the PNGase F-
digested samples (Fig. 3B, C). Again, we used lysates from HeLa cells metabolically
labeled with Ac4ManNAl or Ac4GalNAl as important controls for this assay, observing the
expected decrease in the samples labeled with Ac4ManNAl (due to its incorporation into
sialic acids, which appear in both N- and O-linked glycans21,22) but not Ac4GalNAl (due to
its incorporation into O-linked glycans47) (Fig. S3).

8
Having characterized the nature of glycoprotein labeling by UDP-6AlGal in vivo,
we applied this probe to image changes in glycosylation in vivo during zebrafish
development. Zebrafish embryos were microinjected with UDP-6AlGal and a tracer,
rhodamine-dextran, and click chemistry tagging and imaging of glycans on their
enveloping layer was performed at different timepoints within the first five days of
development, i.e., up to 120 hpf. For the click chemistry-mediated tagging, to ensure the
highest signal-to-background, we used a two-step procedure involving a live embryo-
compatible CuAAC reaction48 with an azido-biotin reagent followed by streptavidin-Alexa
Fluor 488 labeling.
Excitingly, we detected UDP-6AlGal-derived fluorescence as early as 12 hpf,
corresponding to early segmentation (Fig. 4A). The labeling was observed throughout the
enveloping layer, and the extent of labeling increased up to 24 hpf and persisted through
120 hpf (Fig. 4A). Importantly, minimal fluorescence was observed in negative control
embryos injected with rhodamine-dextran only and similarly labeled via CuAAC (Fig. 4B).
The use of a UDP-Gal analog was required to observe labeling, as microinjection of an
unprotected alkynyl Gal-1-phosphate analog (8, Scheme S3) also resulted in no detectable
labeling, further supporting the lack of tolerance of the Leloir pathway to unnatural
modifications.
A close examination of the enveloping layer in UDP-6AlGal-labeled animals
revealed strong fluorescence from ridged structures whose morphology changes over the
course of embryonic and early larval development (Fig. 4C). Interestingly, this type of
glycan labeling pattern of the epithelium30,45 is reminiscent of “ridge-mazes” previously
observed on the skin of a variety of fish species49–51. These ornate ridged structures, which

9
are species-specific, dramatically increase the surface area of the skin and are thought to
provide protection against pathogens, osmotic shocks, and shear force49,52. Critically, they
are rich in mucous substances, including membrane-associated and secreted glycans49,51,52.
The appearance of strong UDP-6AlGal-derived labeling in these epidermal structures in
zebrafish larvae suggests that they are particularly metabolically active areas for de novo
glycoprotein synthesis at these developmental stages, which coincide with the beginning
of swimming behavior53.
CONCLUSION
We have performed a detailed investigation of the ability of unnatural Gal analogs
to serve as metabolic reporters for visualizing glycosylation in vivo. Using in vitro
biochemical and cellular assays, we reveal that the Gal salvage pathway is notably
intolerant of modified Gal or Gal-1-phosphate analogs, in contrast to several other
monosaccharide salvage pathways. By contrast, a bioorthogonal analog of UDP-Gal, the
universal donor for galactosylation, was an effective galactosyltransferase substrate and
metabolic label for tagging glycans following its microinjection into zebrafish embryos.
Intriguingly, the bulk of metabolic labeling afforded by UDP-6AlGal was found to be in
N-linked glycoproteins, and detailed examinations of the glycoproteins and glycan
structures labeled by this sugar, as well as the glycosyltransferases that utilize it as a
substrate, represent interesting future directions. Our in vivo imaging studies of UDP-
6AlGal to visualize glycosylation patterns in developing zebrafish suggest the utility of
this metabolic probe to examine changes in glycosylation accompanying perturbations that
model congenital human diseases of glycosylation in this organism.

10
ACKNOWLEDGMENTS
J.M.B. acknowledges support from the Arnold and Mabel Beckman Foundation
(Beckman Young Investigator Award) and the Alfred P. Sloan Foundation (Sloan Research
Fellowship). This work made use of the Cornell University NMR Facility, which is
supported in part by the NSF (CHE-1531632). We thank Joe Fetcho and Brian Miller for
assistance with zebrafish experiments, Robyn Meech for generously providing a CGT
plasmid, Kelley Moremen and Jeong Yeh Yang for assistance with in vitro galactosylation
reactions, the Emr and Fromme labs for reagents and equipment, and members of the
Baskin laboratory for helpful discussions.
REFERENCES
(1) Pasteur, L. Note Sur Le Sucre de Lait. In Comptes rendus de l’Académie des
Sciences, Volume 42; Académie des sciences (France): Paris, 1856; pp 347–351.
(2) Fischer, E.; Morrell, R. S. Ueber Die Configuration Der Rhamnose Und Galactose.
Berichte der Dtsch. Chem. Gesellschaft 1894, 27 (1), 382–394.
https://doi.org/10.1002/cber.18940270177.
(3) Landsteiner, K. Zur Kenntnis Der Antifermativen, Lytischen Und
Agglutinierenden Wirkungendes Blutserums Und Der Lymphe. Zentbl. Bakt.
Parasitkde (Abt.) 1900, 27, 357–363.
(4) Watkins, W. Biochemistry and Genetics of the ABO, Lewis, and P Blood Group
Systems. Adv. Hum. Genet. 1980, 10, 1-136,379-385.
(5) Watkins, W. M. The ABO Blood Group System: Historical Background. Transfus.

11
Med. 2001, 11 (4), 243–265. https://doi.org/10.1046/j.1365-3148.2001.00321.x.
(6) Essentials of Glycobiology, 3rd editio.; Varki, A., Cummings, R. D., Esko, J. D.,
Eds.; Cold Spring Harbor Laboratory Press: Cold Spring Harbor (NY), 2017.
(7) Holden, H. M.; Rayment, I.; Thoden, J. B. Structure and Function of Enzymes of
the Leloir Pathway for Galactose Metabolism. J. Biol. Chem. 2003, 278 (45),
43885–43888. https://doi.org/10.1074/jbc.R300025200.
(8) Demirbas, D.; Coelho, A. I.; Rubio-Gozalbo, M. E.; Berry, G. T. Hereditary
Galactosemia. Metabolism. 2018, 83, 188–196.
https://doi.org/10.1016/j.metabol.2018.01.025.
(9) Timson, D. J. The Molecular Basis of Galactosemia — Past, Present and Future.
Gene 2016, 589 (2), 133–141. https://doi.org/10.1016/j.gene.2015.06.077.
(10) Coelho, A. I.; Rubio-Gozalbo, M. E.; Vicente, J. B.; Rivera, I. Sweet and Sour: An
Update on Classic Galactosemia. J. Inherit. Metab. Dis. 2017, 40 (3), 325–342.
https://doi.org/10.1007/s10545-017-0029-3.
(11) Parenti, G.; Andria, G.; Ballabio, A. Lysosomal Storage Diseases: From
Pathophysiology to Therapy. Annu. Rev. Med. 2015, 66 (1), 471–486.
https://doi.org/10.1146/annurev-med-122313-085916.
(12) Wenger, D. A.; Rafi, M. A.; Luzi, P. Krabbe Disease: One Hundred Years from
the Bedside to the Bench to the Bedside. J. Neurosci. Res. 2016, 94 (11), 982–989.
https://doi.org/10.1002/jnr.23743.
(13) Graziano, A. C. E.; Cardile, V. History, Genetic, and Recent Advances on Krabbe
Disease. Gene 2015, 555 (1), 2–13. https://doi.org/10.1016/j.gene.2014.09.046.
(14) Dube, D. H.; Bertozzi, C. R. Metabolic Oligosaccharide Engineering as a Tool for

12
Glycobiology. Curr. Opin. Chem. Biol. 2003, 7 (5), 616–625.
https://doi.org/10.1016/j.cbpa.2003.08.006.
(15) Campbell, C. T.; Sampathkumar, S. G.; Yarema, K. J. Metabolic Oligosaccharide
Engineering: Perspectives, Applications, and Future Directions. Mol. Biosyst.
2007, 3 (3), 187–194. https://doi.org/10.1039/b614939c.
(16) Sminia, T. J.; Zuilhof, H.; Wennekes, T. Getting a Grip on Glycans: A Current
Overview of the Metabolic Oligosaccharide Engineering Toolbox. Carbohydr.
Res. 2016, 435, 121–141. https://doi.org/10.1016/j.carres.2016.09.007.
(17) Patterson, D. M.; Nazarova, L. A.; Prescher, J. A. Finding the Right
(Bioorthogonal) Chemistry. ACS Chem. Biol. 2014, 9 (3), 592–605.
https://doi.org/10.1021/cb400828a.
(18) Kayser, H.; Zeitler, R.; Kannicht, C.; Grunow, D.; Nuck, R.; Reutter, W.
Biosynthesis of a Nonphysiological Sialic Acid in Different Rat Organs, Using N-
Propanoyl-D-Hexosamines as Precursors. J. Biol. Chem. 1992, 267 (24), 16934–
16938.
(19) Mahal, L. K.; Yarema, K. J.; Bertozzi, C. R. Engineering Chemical Reactivity on
Cell Surfaces through Oligosaccharide Biosynthesis. Science 1997, 276 (5315),
1125–1128. https://doi.org/10.1126/science.276.5315.1125.
(20) Saxon, E.; Bertozzi, C. R. Cell Surface Engineering by a Modified Staudinger
Reaction. Science 2000, 287 (5460), 2007–2010.
https://doi.org/10.1126/science.287.5460.2007.
(21) Chang, P. V; Chen, X.; Smyrniotis, C.; Xenakis, A.; Hu, T.; Bertozzi, C. R.; Wu,
P. Metabolic Labeling of Sialic Acids in Living Animals with Alkynyl Sugars.

13
Angew. Chemie Int. Ed. 2009, 48 (22), 4030–4033.
https://doi.org/10.1002/anie.200806319.
(22) Hsu, T.-L.; Hanson, S. R.; Kishikawa, K.; Wang, S.-K.; Sawa, M.; Wong, C.-H.
Alkynyl Sugar Analogs for the Labeling and Visualization of Glycoconjugates in
Cells. Proc. Natl. Acad. Sci. U. S. A. 2007, 104 (8), 2614–2619.
https://doi.org/10.1073/pnas.0611307104.
(23) Horstkorte, R.; Reutter, W. Metabolic Glycoengineering with N-Acyl Side Chain
Modified Mannosamines. Angew. Chemie 2016, 128 (33), 9632–9665.
https://doi.org/10.1002/ange.201601123.
(24) Hang, H. C.; Yu, C.; Kato, D. L.; Bertozzi, C. R. A Metabolic Labeling Approach
toward Proteomic Analysis of Mucin-Type O-Linked Glycosylation. Proc. Natl.
Acad. Sci. U.S.A 2003, 100 (25), 14846–14851.
https://doi.org/10.1073/pnas.2335201100.
(25) Vocadlo, D. J.; Hang, H. C.; Kim, E.-J.; Hanover, J. A.; Bertozzi, C. R. A
Chemical Approach for Identifying O-GlcNAc-Modified Proteins in Cells. Proc.
Natl. Acad. Sci. U. S. A. 2003, 100 (16), 9116–9121.
https://doi.org/10.1073/pnas.1632821100.
(26) Sawa, M.; Hsu, T.-L.; Itoh, T.; Sugiyama, M.; Hanson, S. R.; Vogt, P. K.; Wong,
C.-H. Glycoproteomic Probes for Fluorescent Imaging of Fucosylated Glycans in
Vivo. Proc. Natl. Acad. Sci. U. S. A. 2006, 103 (33), 12371–12376.
https://doi.org/10.1073/pnas.0605418103.
(27) Rabuka, D.; Hubbard, S. C.; Laughlin, S. T.; Argade, S. P.; Bertozzi, C. R. A
Chemical Reporter Strategy to Probe Glycoprotein Fucosylation. J. Am. Chem.

14
Soc. 2006, 128 (37), 12078–12079. https://doi.org/10.1021/ja064619y.
(28) Beahm, B. J.; Dehnert, K. W.; Derr, N. L.; Kuhn, J.; Eberhart, J. K.; Spillmann,
D.; Amacher, S. L.; Bertozzi, C. R. A Visualizable Chain-Terminating Inhibitor of
Glycosaminoglycan Biosynthesis in Developing Zebrafish. Angew. Chem. Int. Ed.
Engl. 2014, 53 (13), 3347–3352. https://doi.org/10.1002/anie.201310569.
(29) Darabedian, N.; Gao, J.; Chuh, K. N.; Woo, C. M.; Pratt, M. R. The Metabolic
Chemical Reporter 6-Azido-6-Deoxy-Glucose Further Reveals the Substrate
Promiscuity of O-GlcNAc Transferase and Catalyzes the Discovery of
Intracellular Protein Modification by O-Glucose. J. Am. Chem. Soc. 2018, 140
(23), 7092–7100. https://doi.org/10.1021/jacs.7b13488.
(30) Laughlin, S. T.; Baskin, J. M.; Amacher, S. L.; Bertozzi, C. R. In Vivo Imaging of
Membrane-Associated Glycans in Developing Zebrafish. Science 2008, 320
(5876), 664–667. https://doi.org/10.1126/science.1155106.
(31) Chang, P. V; Prescher, J. A.; Sletten, E. M.; Baskin, J. M.; Miller, I. A.; Agard, N.
J.; Lo, A.; Bertozzi, C. R. Copper-Free Click Chemistry in Living Animals. Proc.
Natl. Acad. Sci. U.S.A 2010, 107 (5), 1821–1826.
https://doi.org/10.1073/pnas.0911116107.
(32) Xie, R.; Dong, L.; Du, Y.; Zhu, Y.; Hua, R.; Zhang, C.; Chen, X. In Vivo
Metabolic Labeling of Sialoglycans in the Mouse Brain by Using a Liposome-
Assisted Bioorthogonal Reporter Strategy. Proc. Natl. Acad. Sci. 2016, 113 (19),
5173–5178. https://doi.org/10.1073/pnas.1516524113.
(33) Laughlin, S. T.; Bertozzi, C. R. In Vivo Imaging of Caenorhabditis Elegans
Glycans. ACS Chem. Biol. 2009, 4 (12), 1068–1072.

15
https://doi.org/10.1021/cb900254y.
(34) Rong, J.; Han, J.; Dong, L.; Tan, Y.; Yang, H.; Feng, L.; Wang, Q. W.; Meng, R.;
Zhao, J.; Wang, S. Q.; et al. Glycan Imaging in Intact Rat Hearts and
Glycoproteomic Analysis Reveal the Upregulation of Sialylation during Cardiac
Hypertrophy. J. Am. Chem. Soc. 2014, 136 (50), 17468–17476.
https://doi.org/10.1021/ja508484c.
(35) Prescher, J. A.; Dube, D. H.; Bertozzi, C. R. Chemical Remodelling of Cell
Surfaces in Living Animals. Nature 2004, 430 (7002), 873–877.
https://doi.org/10.1038/nature02791.
(36) McAuley, M.; Kristiansson, H.; Huang, M.; Pey, A. L.; Timson, D. J.
Galactokinase Promiscuity: A Question of Flexibility? Biochem. Soc. Trans. 2016,
44 (1), 116–122. https://doi.org/10.1042/bst20150188.
(37) Timson, D. J.; Reece, R. J. Sugar Recognition by Human Galactokinase. BMC
Biochem. 2003, 4, 1–8. https://doi.org/10.1186/1471-2091-4-16.
(38) Thoden, J. B.; Timson, D. J.; Reece, R. J.; Holden, H. M. Molecular Structure of
Human Galactokinase: Implications for Type II Galactosemia. J. Biol. Chem.
2005, 280 (10), 9662–9670. https://doi.org/10.1074/jbc.M412916200.
(39) Yu, S.-H.; Boyce, M.; Wands, A. M.; Bond, M. R.; Bertozzi, C. R.; Kohler, J. J.
Metabolic Labeling Enables Selective Photocrosslinking of O-GlcNAc-Modified
Proteins to Their Binding Partners. Proc. Natl. Acad. Sci. 2012, 109 (13), 4834–
4839. https://doi.org/10.1073/pnas.1114356109.
(40) Lefebvre, I.; Perigaud, C.; Pompon, A.; Aubertin, A.-M.; Girardet, J.-L.; Kirn, A.;
Gosselin, G.; Imbach, J.-L. Mononucleoside Phosphotriester Derivatives with S-
16
Acyl-2-Thioethyl Bioreversible Phosphate-Protecting Groups: Intracellular
Delivery of 3’-Azido-2’,3’-Dideoxythymidine 5’-Monophosphate. J. Med. Chem.
1995, 38 (20), 3941–3950. https://doi.org/10.1021/jm00020a007.
(41) Tan, H. Y.; Eskandari, R.; Shen, D.; Zhu, Y.; Liu, T. W.; Willems, L. I.; Alteen,
M. G.; Madden, Z.; Vocadlo, D. J. Direct One-Step Fluorescent Labeling of O-
GlcNAc-Modified Proteins in Live Cells Using Metabolic Intermediates. J. Am.
Chem. Soc. 2018, 140 (45), 15300–15308. https://doi.org/10.1021/jacs.8b08260.
(42) Bumpus, T. W.; Baskin, J. M. Clickable Substrate Mimics Enable Imaging of
Phospholipase D Activity. ACS Cent. Sci. 2017, 3 (10), 1070–1077.
https://doi.org/10.1021/acscentsci.7b00222.
(43) Santa, T.; Al-Dirbashi, O. Y.; Fukushima, T. Derivatization Reagents in Liquid
Chromatography/Electrospray Ionization Tandem Mass Spectrometry for
Biomedical Analysis. Drug Discov. Ther. 2007, 1 (2), 108–118.
(44) Baskin, J. M.; Dehnert, K. W.; Laughlin, S. T.; Amacher, S. L.; Bertozzi, C. R.
Visualizing Enveloping Layer Glycans during Zebrafish Early Embryogenesis.
Proc. Natl. Acad. Sci. U.S.A 2010, 107 (23), 10360–10365.
https://doi.org/10.1073/pnas.0912081107.
(45) Dehnert, K. W.; Baskin, J. M.; Laughlin, S. T.; Beahm, B. J.; Naidu, N. N.;
Amacher, S. L.; Bertozzi, C. R. Imaging the Sialome during Zebrafish
Development with Copper-Free Click Chemistry. Chembiochem 2012, 13 (3),
353–357. https://doi.org/10.1002/cbic.201100649.
(46) Dehnert, K. W.; Beahm, B. J.; Huynh, T. T.; Baskin, J. M.; Laughlin, S. T.; Wang,
W.; Wu, P.; Amacher, S. L.; Bertozzi, C. R. Metabolic Labeling of Fucosylated

17
Glycans in Developing Zebrafish. ACS Chem. Biol. 2011, 6 (6), 547–552.
https://doi.org/10.1021/cb100284d.
(47) Batt, A. R.; Zaro, B. W.; Navarro, M. X.; Pratt, M. R. Metabolic Chemical
Reporters of Glycans Exhibit Cell-Type-Selective Metabolism and Glycoprotein
Labeling. ChemBioChem 2017, 18 (13), 1177–1182.
https://doi.org/10.1002/cbic.201700020.
(48) Soriano Del Amo, D.; Wang, W.; Jiang, H.; Besanceney, C.; Yan, A. C.; Levy, M.;
Liu, Y.; Marlow, F. L.; Wu, P. Biocompatible Copper(I) Catalysts for in Vivo
Imaging of Glycans. J. Am. Chem. Soc. 2010, 132 (47), 16893–16899.
https://doi.org/10.1021/ja106553e.
(49) Fishelson, L. A Comparative Study of Ridge-Mazes on Surface Epithelial Cell-
Membranes of Fish Scales (Pisces, Teleostei). Zoomorphology 1984, 104 (4), 231–
238. https://doi.org/10.1007/BF00312036.
(50) Whitear, M. The Skin Surface of Bony Fishes. J Zool L. 1970, 160, 437–454.
(51) Hawkes, J. W. The Structure of Fish Skin - I. General Organization. Cell Tissue
Res. 1974, 149 (2), 147–158. https://doi.org/10.1007/BF00222270.
(52) Le Guellec, D.; Morvan-Dubois, G.; Sire, J. Y. Skin Development in Bony Fish
with Particular Emphasis on Collagen Deposition in the Dermis of the Zebrafish
(Danio Rerio). Int. J. Dev. Biol. 2004, 48 (2–3), 217–231.
https://doi.org/10.1387/ijdb.15272388.
(53) Saint-Amant, L.; Drapeau, P. Time Course of the Development of Motor
Behaviors in the Zebrafish Embryo. J. Neurobiol. 1998, 37 (4), 622–632.
https://doi.org/10.1002/(SICI)1097-4695(199812)37:4<622::AID-

18
NEU10>3.0.CO;2-S.

19
FIGURES
Figure 1. Strategy for using synthetic galactose analogs for metabolic labeling and
imaging of cell-surface glycans. Galactose analogs were synthesized to intercept various
steps of the galactose salvage pathway (Leloir pathway). Shown are analogs of galactose
(A), galactose-1-phosphate (Gal-1-P) (B), and uridine diphosphate galactose (UDP-Gal)
(C). Ac, acetyl; SATE, S-acetyl thioethyl; UDP, uridine diphosphate. Red ball indicates
bioorthogonal tag (azide or acetylene), and crescent–star refers to bioorthogonal reaction
partner to introduce epitope tag to enable visualization. See also Fig. S1 for structures of
all analogs.

20
Figure 2. An azido analog of UDP-Gal is accepted by a galactosyltransferase in vitro.
UDP-6AzGal was incubated overnight at 37 ºC with C17-ceramide and lysates from HEK
293TN cells expressing CGT to generate the 6-azido analog of galactosylceramide
(6AzGalCer). Following lipid extraction and CuAAC tagging with an alkynyl quaternary
ammonium reagent (Alk-QA) to generate the quaternary ammonium lipid derivative (QA-
GalCer), analysis was performed by LC–MS (electrospray ionization–time of flight (ESI–

21
TOF)). (A) Schematic of experimental design. (B) Mass spectrum showing identification
of QA-GalCer, with observed and expected m/z values indicated.

22
Figure 3. UDP-6AlGal labels N-linked glycans in developing zebrafish. Zebrafish
embryos were microinjected with UDP-6AlGal or no sugar at the 1-cell stage and allowed
to develop at 28 ºC for 24 h, followed by generation of protein lysates. (A) Lysates were
reacted with azido-biotin by CuAAC and analyzed by SDS-PAGE and transfer to a PVDF
membrane. At this point, membranes were incubated with or without NaOH (55 mM, 40
°C for 22 h) to remove O-glycans, followed by Western blot with streptavidin-HRP or
silver stain. (B) Lysates were incubated with PNGase F to remove N-glycans, followed by
CuAAC tagging with azido-biotin and Western blot analysis with streptavidin-HRP or
silver stain. (C) Quantification of Western blot data from (A) and (B), showing the

23
retention of UDP-6AlGal-derived signal in the presence of NaOH (left) or PNGase F (right)
treatment. Each experiment was performed three times (biological replicates) with three
technical replicates for each experiment.

24

25
Figure 4. Imaging of glycosylation in developing zebrafish embryos and larvae using
UDP-6AlGal and CuAAC. (A) Zebrafish embryos were microinjected with the red
fluorescent tracer rhodamine-dextran and either UDP-6AlGal (A) or no sugar (B) at the 1-
cell stage and allowed to develop at 28 ºC for the indicated amount of time up to 120 hpf
(hours post-fertilization). Live zebrafish were then tagged with azido-biotin via CuAAC,
followed by labeling with streptavidin-Alexa Fluor 488, mounting in low-melt agarose,
and imaging by confocal microscopy. Images in (C) show zoomed-in regions of enveloping
layer cells on the surface of the embryo, above the yolk sac, highlighting intense UDP-
6AlGal-derived fluorescence in ridged structures; insets at bottom right show area in
dashed line.

download fileview on ChemRxivDaughtry manuscript final.pdf (3.75 MiB)
1
Supporting Information for
Clickable Galactose Analogs for Imaging Glycans in Developing Zebrafish
Jessica L. Daughtry1, Wendy Cao1, Johnny Ye1, and Jeremy M. Baskin1*
1 Department of Chemistry and Chemical Biology and Weill Institute for Cell and Molecular Biology, Cornell University, Ithaca, New York, USA 14853
Table of Contents
Figure S1. Unnatural Gal analogs do not metabolically label glycans in cell culture. ....... 2Figure S2. Unnatural Gal-1-phosphate analogs do not metabolically label glycans in cell culture. ................................................................................................................................ 3Figure S3. Control experiments for chemical and enzymatic deglycosylation studies. ..... 4Scheme S1. Synthesis of Ac46AlGal. ................................................................................. 4Scheme S2. Synthesis of Ac36AzGal-1-P(SATE). ............................................................. 5Scheme S3. Synthesis of UDP-6AlGal. .............................................................................. 5Materials and Methods ........................................................................................................ 5Synthetic Methods ............................................................................................................ 10Supporting Information References .................................................................................. 141H, 13C, and 31P NMR Spectra .......................................................................................... 16

2
Figure S1. Unnatural Gal analogs do not metabolically label glycans in cell culture. (A) Structures of peracetylated Gal analogs containing azido (top row) or alkynyl (bottom row) groups. Indicated at the right of each group is the positive control used for labeling of cells with azides (top row) or alkynes (bottom row). (B–C) Flow cytometry analysis of cells treated with the indicated compound (100 µM for 2 d for Ac44AzGal, Ac46AzGal, Ac46AzEtGal, Ac46AlGal; 50 µM for 2 d for Ac4GlcNAz, Ac42AzGal; 250 µM for 2 d

3
for Ac45AlGal; 100 µM for 30 min for NHS-Al) followed by CuAAC tagging with alkyne-biotin (B) or azido-biotin (C) and staining with streptavidin-Alexa Fluor 488.
Figure S2. Unnatural Gal-1-phosphate analogs do not metabolically label glycans in cell culture. (A) Structures of peracetylated and SATE-protected analogs of Gal or N-azidoacetylglucosamine (GlcNAz). (B) Flow cytometry analysis of cells treated with the indicated compound (200 µM for 3 d for Ac3GlcNAz-1-P(SATE); 50 µM for 3 d for Ac36AzGal-1-P(SATE)) followed by SPAAC tagging with Cy3-DBCO.

4
Figure S3. Control experiments for chemical and enzymatic deglycosylation studies. HeLa cells were metabolically labeled with peracetylated N-(4-pentynoyl)mannosamine (Ac4ManNAl) or N-(4-pentynoyl)galactosamine (Ac4GalNAl) (25 µM for 3 d), and lysates were generated. (A) Lysates were reacted with azido-biotin by CuAAC and analyzed by SDS-PAGE and transfer to a PVDF membrane. At this point, membranes were incubated with or without NaOH (55 mM, 40 °C for 22 h) to remove O-glycans, followed by Western blot with streptavidin-HRP or silver stain. (B) Lysates were incubated with PNGase F to remove N-glycans, followed by CuAAC tagging with azido-biotin and Western blot analysis with streptavidin-HRP or silver stain. (C) Quantification of Western blot data from (A) and (B). Each experiment was performed three times (biological replicates) with three technical replicates for each experiment.
Scheme S1. Synthesis of Ac46AlGal.
O
OOO
O OTf
O
OOO
O
TIPS
O
OOO
O
O
OAcAcOAcO
AcOTIPS acetylene,nBuLi, HMPA
18% 37% 18%1 2 3 Ac46AlGal
THF-78 °C to rt, o/n
THF-78 °C to rt, o/n
1.TFA/H2O 60/40 50 °C, 1h
2. Ac2O, pyrrt, o/n
TBAF

5
Scheme S2. Synthesis of Ac36AzGal-1-P(SATE).
Scheme S3. Synthesis of UDP-6AlGal.
Materials and Methods General materials and methods All reagents used were analytical grade and obtained from commercial suppliers without further purification. When indicated, solvents were degassed by sparging with argon for 10 min. N-(4-pentynoyl)-galactosamine tetracceylated (Ac4GalNAl), N-(4-pentynoyl)-mannosamine tetraacylated (Ac4ManNAl), tris-hydroxypropyltriazolylmethlamine (THPTA), Biotin-PEG3-Azide (azido-biotin), Biotin-PEG4-Alkyne (alkyne-biotin), and Cy3-DBCO were purchased from Click Chemistry Tools. Rhodamine B isothiocyanate-Dextran (rhodamine-dextran) and cOmplete EDTA-free protease inhibitor cocktail tablets were purchased from Sigma-Aldrich; Streptavidin-HRP was purchased from GeneTex; Clarity enhanced chemiluminescence reagent was purchased from Bio-Rad; PNGase F was purchased from NEB; N-heptadecanoyl-D-
O
OAcO
AcO
AcO N3
PO
OO
SO
S
OO
AcOAcO
AcO N3
OH
1. 5-(ethylthio)-1H-tetrazoleTHF, rt, 1.5 h
5Ac36AzGal-1-P(SATE)
61%
2. mCPBA, DCM-40 °C to rt, o/n
O
OAcAcOAcO
AcOO
OHAcOAcO
AcO
O
OAcOAcO
AcO
PO
OOH
O
OHOHO
HO
PO
OO O N
NH
HO OH
O
O
OPO
O NHEt3
O
OAcOAcO
AcO
PO
OH
NHEt3
NHEt3 NHEt3
48% 64%
33%
t-BuOOH,Iodine (cat.)THF, rt, o/n
41%
Ac46AlGal 6 7
8
UDP-6AlGal
Ethylenediamine,Acetic acid
THF0 °C, o/n
TEATHF, dioxane
0 °C, 1.5 h
OPO
O
Cl
1. 5-(ethylthio)-1H-tetrazolepyr, rt, 3 d
2. 0.1M NH4CO3, TEA, MeOH, 0 °C, o/n
HOO N
NH
HO OH
O
O
OPO
N
O

6
erythro-sphingosine (C17 ceramide, d18:1/17:0) was purchased from Avanti Polar Lipids; bathocuproindisulfonic disodium salt hydrate (BCS) was purchased from Beantown Chemical; Agarose was purchased from IBI Scientific; Pronase E and bovine servum albumin (BSA) was purchased from VWR. Dulbecco’s modified Eagle medium (DMEM), fetal bovine serum (FBS), pencillin/streptomycin (P/S), sodium pyruvate, phosphate-buffered saline (PBS), and 0.05% trypsin-EDTA (trypsin) were purchased from Corning. Lipofectamine 2000, streptavidin-Alexa Fluor 488, and BCA assay were purchased from Thermo Fisher. HPLC purification was performed on a Shimadzu LC-20AR HPLC equipped with an SPD-20AV UV/Vis detector and a ES Industries Epic Polar C18 reverse phase column (25 cm x 10 mm, 5 µm). Flow cytometry was performed on a BD Accuri C6 flow cytometer and analyzed using the BD Accuri C6 analysis software. LCMS analysis was performed on an Agilent 6230 electrospray ionization–time-of-flight (ESI–TOF) MS coupled to an Agilent 1260 HPLC equipped with a Zorbax Rx-Sil normal phase silica column (2.1 x 50 mm, 1.8 µm). NMR spectra were recorded on a Bruker 500 MHz spectrometer with a BBO H&F cryoprobe at ambient temperature. DART MS was performed on an Exactive Plus Orbitrap Mass Spectrometer with a DART SVP ion source from Ion Sense. Confocal imaging was performed on a Zeiss LSM 800 confocal laser scanning microscope equipped with C-Apochromat 10X 0.45 NA water immersion and Plan Apochromat 40X 1.4 NA oil immersion objectives, 405, 488, 561, and 640 nm solid-state lasers, and two GaAsP PMT detectors. Images were acquired using Zeiss Zen Blue 2.3 and analyzed using FIJI. Cell culture CHO, HeLa, and HEK 293TN cells were cultured in a 5% CO2, water-saturated atmosphere at 37 °C in DMEM supplemented with 10% FBS, 1% penicillin and streptomycin. HEK 293TN cells were additionally supplemented with 1% sodium pyruvate. Cells were maintained between 105 and 1.6x10⁶ cells/mL. Zebrafish husbandry Casper zebrafish embryos 0–5 d post-fertilization were kept in embryo medium (13.7 mM NaCl, 0.54 mM KCl, 0.025 mM Na2HPO4, 0.044 mM KH2PO4, 1.3 mM CaCl2, 1.0 mM MgSO4, 4.2 mM NaHCO3, pH 7.2) at 28.5 °C. Microinjection of zebrafish embryos
Casper zebrafish embryos at the one-cell stage were microinjected with 5 nL of 10 mM UDP-galactose analog or no sugar with 5% w/v rhodamine-dextran in 0.5X PBS pH 7.4. Embryos were allowed to develop by incubation at 28.5 °C. Embryos were either used for imaging or de-yolked using shear force through a trimmed P200 tip and then flash-frozen using liquid nitrogen. Frozen embryos were stored at –80 °C. Metabolic labeling of cultured cells with peracetylated sugars
HEK 293TN cells (1.6 x 10⁶) were seeded on 10-cm dishes and transfected using Lipofectamine 2000 with a plasmid containing CGT (pIRES-UGT8, a gift from Robyn Meech, Flinders University). Eight h post-transfection, the media was exchanged for fresh media with sugar (100 µM for Ac44AzGal, Ac46AzGal, Ac46AzEtGal, Ac46AlGal; 50 µM for Ac4GlcNAz, Ac42AzGal; 250 µM for Ac45AlGal) or no sugar. Cells were

7
incubated at 37 °C for 2 d. Cells were lifted using trypsin for 5 min, pelleted, resuspended in FACS buffer (1X PBS pH 7.4 + 0.5% FBS), and counted, and 200,000 cells were added to each well of a 96-well plate, in triplicate. Cells were pelleted at 500 x g at 4 °C for 3 min, resuspended in 43.3 µL of FACS buffer and 1.75 µL of master mix (50 µM CuSO4, 300 µM THPTA, 100 µM of either azido-biotin or alkyne-biotin) was added followed by 5 µL of 25 mM sodium ascorbate. Cells were mixed and incubated at room temperature for 3 min. Cells were pelleted at 500 x g at 4 °C for 3 min and rinsed three times with 150 µL of FACS buffer. 50 µL of 1 µg/mL streptavidin-Alexa Fluor 488 (1 mg/mL stock) in cold FACS buffer was added to each well and reacted for 30 min at 4 °C in the dark. Cells were pelleted and rinsed three times with FACS buffer. Cell was resuspended in 170 µL of FACS buffer and analyzed by flow cytometry. Metabolic labeling of cultured cells with protected thioester sugars
CGT-CHO cells (200,000), a CHO cell line stably expressing CGT (a gift from Tsung-Ping Su, NIH), were seeded on 10-cm dishes in media containing one of the following: 200 µM Ac3GlcNAz-1-P(SATE), 50 µM Ac36AzGal-1-P(SATE) or no sugar. Cells were incubated at 37 °C for 3 d. Cells were lifted using trypsin for 5 min, pelleted, resuspended in FACS buffer (1X PBS pH 7.4 + 0.5% FBS), and counted. 200,000 cells, in 150 µL of FACS buffer, were added to 96-well plates (in triplicate). Cells were pelleted at 500 x g at 4 °C for 3 min. Cells were resuspended in 50 µL of 5 µM Cy3-DBCO in FACS buffer and incubated at 37 °C for 2 h. Cells were pelleted at 500 x g at 4 °C for 3 min and rinsed three times with 150 µL of FACS buffer. Cell was resuspended in 120 µL of FACS buffer and analyzed by flow cytometry. In vitro reaction with UDP-6AzGal
HEK 293TN cells (5 x 10⁶) were seeded in 10-cm dishes and allowed to grow overnight. The cells were transfected with pIRES-hUGT8 using Lipofectamine 2000 as per the manufacturer’s instructions. After 24 h, cells were lysed in lysis buffer (10 mM Tris pH 7.5 and 1 mM EDTA supplemented with a protease inhibitor tablet) and sonicated for 2 pulses at 20% power. Samples were normalized to 300 μg/46 μL with lysis buffer. 12.5 μL of 4 mM C17:0 ceramide in chloroform was added to 1.5 mL Eppendorf tube. The chloroform was removed using a stream of nitrogen gas. Ceramide was then dissolved in 25 μL of sodium phosphate buffer (pH 6.8) and 4 μL of 100 mM MgCl2. 25 μL of 4 mM UDP-6AzGal was added followed by 46 μL of lysate (300 μg). Solution was pipet mixed and incubated overnight at 37 °C. Reactions were then diluted with 125 μL of 20 mM acetic acid, 250 μL of methanol, and 250 μL chloroform then vortexed for 1 min and centrifuged for 1 min at 16,000 x g. The organic layer was removed and saved. 250 μL of chloroform was added and samples were vortexed and centrifuged as before. Organic layers were combined and dried under nitrogen. Samples to be analyzed by LCMS were subjected to CuAAC labeling by a modified version of the method previously described by Thiele et al1. 37 μL of a reaction master mix (using degassed solvents) was added to the dried lipids. The reaction mixture consisted of 24 μL of ethanol with 0.2 mg of alkyne quaternary ammonium (Alk-QA), 7 μL of chloroform, and 6 μL of 20 mM [acetonitrile]4CuBF4 in acetonitrile. Tubes were flushed with argon and incubated in a 42 °C water bath (only submerged halfway) overnight. Reactions were diluted with 113 μL of chloroform:methanol (95:5) mixture
8
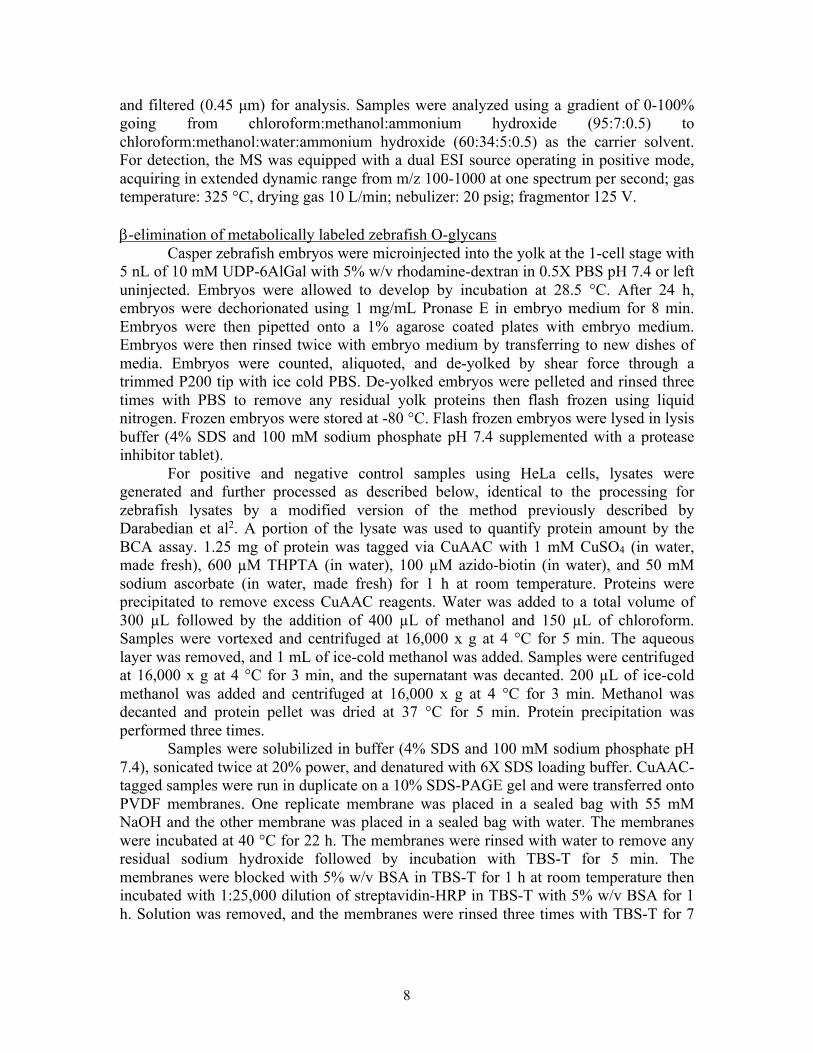
and filtered (0.45 μm) for analysis. Samples were analyzed using a gradient of 0-100% going from chloroform:methanol:ammonium hydroxide (95:7:0.5) to chloroform:methanol:water:ammonium hydroxide (60:34:5:0.5) as the carrier solvent. For detection, the MS was equipped with a dual ESI source operating in positive mode, acquiring in extended dynamic range from m/z 100-1000 at one spectrum per second; gas temperature: 325 °C, drying gas 10 L/min; nebulizer: 20 psig; fragmentor 125 V. b-elimination of metabolically labeled zebrafish O-glycans Casper zebrafish embryos were microinjected into the yolk at the 1-cell stage with 5 nL of 10 mM UDP-6AlGal with 5% w/v rhodamine-dextran in 0.5X PBS pH 7.4 or left uninjected. Embryos were allowed to develop by incubation at 28.5 °C. After 24 h, embryos were dechorionated using 1 mg/mL Pronase E in embryo medium for 8 min. Embryos were then pipetted onto a 1% agarose coated plates with embryo medium. Embryos were then rinsed twice with embryo medium by transferring to new dishes of media. Embryos were counted, aliquoted, and de-yolked by shear force through a trimmed P200 tip with ice cold PBS. De-yolked embryos were pelleted and rinsed three times with PBS to remove any residual yolk proteins then flash frozen using liquid nitrogen. Frozen embryos were stored at -80 °C. Flash frozen embryos were lysed in lysis buffer (4% SDS and 100 mM sodium phosphate pH 7.4 supplemented with a protease inhibitor tablet).
For positive and negative control samples using HeLa cells, lysates were generated and further processed as described below, identical to the processing for zebrafish lysates by a modified version of the method previously described by Darabedian et al2. A portion of the lysate was used to quantify protein amount by the BCA assay. 1.25 mg of protein was tagged via CuAAC with 1 mM CuSO4 (in water, made fresh), 600 µM THPTA (in water), 100 µM azido-biotin (in water), and 50 mM sodium ascorbate (in water, made fresh) for 1 h at room temperature. Proteins were precipitated to remove excess CuAAC reagents. Water was added to a total volume of 300 µL followed by the addition of 400 µL of methanol and 150 µL of chloroform. Samples were vortexed and centrifuged at 16,000 x g at 4 °C for 5 min. The aqueous layer was removed, and 1 mL of ice-cold methanol was added. Samples were centrifuged at 16,000 x g at 4 °C for 3 min, and the supernatant was decanted. 200 µL of ice-cold methanol was added and centrifuged at 16,000 x g at 4 °C for 3 min. Methanol was decanted and protein pellet was dried at 37 °C for 5 min. Protein precipitation was performed three times.
Samples were solubilized in buffer (4% SDS and 100 mM sodium phosphate pH 7.4), sonicated twice at 20% power, and denatured with 6X SDS loading buffer. CuAAC-tagged samples were run in duplicate on a 10% SDS-PAGE gel and were transferred onto PVDF membranes. One replicate membrane was placed in a sealed bag with 55 mM NaOH and the other membrane was placed in a sealed bag with water. The membranes were incubated at 40 °C for 22 h. The membranes were rinsed with water to remove any residual sodium hydroxide followed by incubation with TBS-T for 5 min. The membranes were blocked with 5% w/v BSA in TBS-T for 1 h at room temperature then incubated with 1:25,000 dilution of streptavidin-HRP in TBS-T with 5% w/v BSA for 1 h. Solution was removed, and the membranes were rinsed three times with TBS-T for 7

9
min followed by one rinse with TBS for 5 min. The membranes were incubated with Clarity ECL solution for 5 min, and then the chemiluminescence was imaged. Deglycosylation of N-glycans with PNGase F Casper zebrafish embryos were microinjected into the yolk at the 1-cell stage with 5 nL of 10 mM UDP-6AlGal with 5% w/v rhodamine-dextran in 0.5X PBS pH 7.4 or left uninjected. Embryos were allowed to develop by incubation at 28.5 °C. After 24 h, embryos were decorionated using 1 mg/mL Pronase E in embryo medium for 8 min. Embryos were then pipetted onto a 1% agarose coated plates with embryo medium. Embryos were then rinsed twice with embryo medium by transferring to new dishes of media. Embryos were counted, aliquoted, and de-yolked by shear force through a trimmed P200 tip with ice cold PBS. De-yolked embryos were pelleted and rinsed 3 times with PBS to remove any residual yolk proteins then flash frozen using liquid nitrogen. Frozen embryos were stored at –80 °C. Flash frozen embryos were lysed in lysis buffer (1% NP-40, 50 mM sodium phosphate buffer pH 7.5, supplemented with a protease inhibitor tablet), sonicated three times with 20% power, protein quantified by BCA assay, and normalized to 2 mg/mL with lysis buffer.
For positive and negative control samples using HeLa cells, lysates were generated and further processed as described below, identical to the processing for zebrafish lysates by a modified version of the method previously described by Darabedian et al2. Samples were aliquoted into 100 µg amounts. 3 µL of PNGase F or 3 µL of water was added to each sample and incubated for 6 h at 37 °C. Enzyme was then removed by protein precipitation. 250 µL of water was followed by the addition of 400 µL of methanol and 150 µL of chloroform. Samples were vortexed and centrifuged at 16,000 x g at 4 °C for 5 min. The aqueous layer was removed, and 1 mL of ice-cold methanol was added. Samples were centrifuged at 16,000 x g at 4 °C for 3 min and supernatant was decanted. 200 µL of ice-cold methanol was added and centrifuged at 16,000 x g at 4 °C for 3 min. Methanol was decanted and protein pellet was dried at 37 °C for 5 min.
Samples were solubilized in 25 µL of buffer (4% SDS, 100 µM sodium phosphate buffer pH 7.4, supplemented with a protease inhibitor tablet) and reacted by CuAAC in a total volume of 5 µL with 1 mM CuSO4 (in water, made fresh), 600 µM THPTA (in water), 100 µM azido-biotin (in water), and 50 mM sodium ascorbate (in water, made fresh) for 1 h at room temperature. Samples were then precipitated as before and solubilized in 1.2% SDS in 1X PBS pH 7.4 and 6X SDS loading buffer. Samples were analyzed by SDS-PAGE and Western blot with streptavidin-HRP and detection with Clarity ECL solution as described above. Imaging of cell-surface glycans on developing zebrafish Casper zebrafish embryos were microinjected into the yolk at the 1-cell stage with 5 nL of 10 mM UDP-6AlGal or no sugar with 5% w/v rhodamine-dextran in 0.5X PBS pH 7.4. Embryos were allowed to develop by incubation at 28.5 °C. Injected zebrafish embryos were manually dechorionated using forceps and transferred to an agarose-coated 96-well plate (5 embryos or fewer per well) in embryo medium. Embryos were tagged via CuAAC with 45 µM CuSO4, 270 µM THPTA, 50 µM azido-biotin, and 2.5 mM sodium ascorbate for 5 min (total volume 100 µL). The CuAAC reaction were stopped

10
with the addition of 100 µM bathocuproinedisulfonic acid (BCS) followed by 100 µL of embryo medium. Embryos were rinsed twice in embryo medium. CuAAC-tagged embryos were then incubated with 1 µg/mL streptavidin-Alexa Fluor 488 (1 mg/mL stock) for 30 min in the dark. Embryos were rinsed three times with embryo medium. Embryos were first anesthetized with 0.2% tricaine in embryo medium, mounted in 0.6% low-melt agarose, and imaged by confocal microscopy. Synthetic Methods Ac46AzGal3, monodeprotected sugar 53, UDP-6AzGal3, Ac44AzGal4, Ac46AzEtGal5, Ac4GlcNAz6, Ac45AlGal7, Ac3GlcNAz-1-P(SATE)8, Alk-QA9, triflate sugar 110, and bis(S-acetyl-2-thioethyl) N,N-diisopropylphosphoramidite11 were prepared according to literature procedures. TIPS alkyne 2. Triisopropylsilylacetylene (700 µL, 3.12 mmol, 3.50 eq to triflate,) was added to HMPA (160 µL, 0.892 mmol, 0.26 eq to nBuLi,) and THF (3 mL). Reagents were cooled to –78 °C and nBuLi (1.4 M in hexanes, 2.47 mL, 3.43 mmol, 1.10 eq to acetylene,) was added dropwise and stirred for 30 min. Triflate sugar 1 (350 mg, 0.892 mmol, 1.00 eq) in 900 µL of THF was added dropwise to the reaction. The reaction was warmed and stirred overnight. The reaction was quenched with 20 mL of saturated ammonium chloride and extracted twice with EtOAc, washed with water and brine, dried with sodium sulfate, and filtered. The reaction was concentrated and purified by flash column chromatography (12:1, hexanes/EtOAc, v/v) to yield an oil with a small amount of residual triisopropylsilylacetylene (69.0 mg, 18%). 1H NMR (500 MHz, CDCl3) δ 5.50 (d, J = 5.0 Hz, 1H), 4.60 (dd, J = 8.0, 2.3 Hz, 1H), 4.34 (dd, J = 8.0, 1.8 Hz, 1H), 4.28 (dd, J = 5.0, 2.3 Hz, 1H), 3.91 (ddd, J = 8.3, 6.1, 1.8 Hz, 1H), 2.64 (dd, J = 16.5, 8.7 Hz, 1H), 2.53 (dd, J = 16.5, 6.1 Hz, 1H), 1.52 (s, 6H), 1.44 (s, 3H), 1.32 (s, 6H), 1.05 (d, J = 4.6 Hz, 18H). 13C NMR (125 MHz, CDCl3) δ 113.0, 109.2, 108.6, 104.6, 96.7, 82.3, 71.4, 70.9, 70.8, 67.2, 65.6, 31.7, 26.2, 26.1, 25.1, 24.3, 22.0, 18.7, 18.7, 11.4, 11.2. HRMS (DART) m/z: [M+H]+ calcd. for C23H41O5Si+ 425.27178; found 425.27330. Bisacetonide alkyne 3. TIPS alkyne 2 (100 mg, 0.235 mmol, 1.00 eq) was dissolved in THF (1.2 mL) and cooled to 0 °C. TBAF (1 M in hexanes, 710 µL, 0.706 mmol, 3.00 eq) was added slowly, warmed to room temperature, and reacted overnight. The reaction was diluted with EtOAc then washed twice with water and once with brine. The crude mixture was dried with sodium sulfate, filtered, and concentrated. The brown oil was purified by flash column chromatography (15:1 hexanes/EtOAc, v/v) to yield the bisacetonide protected alkyne 3 (23.4 mg, 37%). 1H NMR (500 MHz, CDCl3) δ 5.51 (d, J = 5.0 Hz, 1H), 4.63 (dd, J = 7.8, 2.4 Hz, 1H), 4.45 – 4.25 (m, 2H), 3.92 (ddd, J = 8.5, 6.4, 1.9 Hz, 1H), 2.58 (ddd, J = 16.5, 8.4, 2.7 Hz, 1H), 2.51 (ddd, J = 16.5, 6.5, 2.7 Hz, 1H), 2.01 (t, J = 2.7 Hz, 1H), 1.55 (s, 3H), 1.45 (s, 3H), 1.36 (s, 3H), 1.33 (s, 3H). 13C NMR (125 MHz, CDCl3) δ 109.5, 108.8, 96.7, 80.4, 71.5, 70.9, 70.6, 70.0, 66.7, 26.2, 26.1, 25.0, 24.6, 20.5. HRMS (DART) m/z: [M+NH4]+ calcd. for C14H24NO5+ 286.16490; found 286.16599.

11
Ac46AlGal. Water (21 mL) and TFA (32 mL) was added to alkyne sugar 3 (1.44 g, 5.37 mmol, 1.00 eq) at 0 °C. The reaction was warmed to room temperature then heated to 50 °C for 1 h. The reaction was then concentrated and co-evaporated with toluene three times. Trace amounts of toluene were removed under reduced pressure, and the sugar residue was dissolved in pyridine (6.5 mL) and acetic anhydride (4 mL) and stirred overnight at room temperature. The reaction was quenched with 20 mL of cold water and extracted three times with EtOAc and washed three times with 1 M HCl and once with brine. Crude mixture was dried with sodium sulfate, filtered, and concentrated. The reaction was purified by flash column chromatography (4:1 hexanes/EtOAc, v/v) to give the desired compound as a complex mixture of isomers (338 mg, 18%). 1H NMR (500 MHz, CDCl3) δ 6.29 (d, J = 3.5 Hz, 1H, α), 5.65 (d, J = 8.3 Hz, 1H, β), 5.57 (d, J = 3.0 Hz, 1H, α), 5.51 (d, J = 3.3 Hz, 1H, β), 5.32 (dd, J = 11.0, 3.2 Hz, 1H, α), 5.26 (td, J = 8.0, 3.9 Hz, 2H, α & β), 5.07 (dd, J = 10.5, 3.4 Hz, 1H, β), 4.27 – 4.19 (m, 1H, α), 3.94 (dd, J = 9.0, 5.9 Hz, 1H, β), 2.60-2.34 (m, 4H, α & β), 2.16-1.94 (m, 13H, CH3-COO & CºCH). 13C NMR (125 MHz, CDCl3) δ 170.2, 170.1, 170.0, 170.0, 169.9, 169.4, 169.0, 92.2, 92.1, 89.8, 89.8, 77.9, 77.7, 72.5, 71.7, 71.5, 71.0, 71.0, 69.7, 68.3, 67.8, 67.7, 67.6, 66.4, 20.9, 20.8, 20.7, 20.7, 20.7, 20.6, 20.3. HRMS (ESI) m/z: [M+NH4]+ calcd. for C16H24NO9+ 374.14456; found 374.14419. Ac36AzGal-1-P(SATE). Monodeprotected sugar 5 (45.0 mg, 0.136 mmol, 1.00 eq), THF (270 µL), and bis(S-acetyl-2-thioethyl) N,N-diisopropylphosphoramidite (60.0 mg, 0.163 mmol, 1.20 eq) were added to a flask. 5-(ethylthio)-1H-tetrazole (53 mg, 0.408 mmol, 3.00 eq) was then added and the reaction was stirred for 1.5 h. The reaction was cooled to –40 °C and mCPBA (52% v/w, 59.0 mg, 0.177 mmol, 1.30 eq) dissolved in 340 µL of DCM was added. After addition, the reaction was then allowed to warm to room temperature and stirred overnight. The reaction was quenched with 3 mL of 10% sodium thiosulfate, extracted with DCM (3 x 3 mL), and washed with 2 mL of saturated NaHCO3 followed by water (3 x 2 mL). The combined organic layer was dried with sodium sulfate, filtered, and concentrated. The crude was purified by flash column chromatography (2:1 hexanes/EtOAc, v/v) to yield an oil (51.0 mg, 61%). 1H NMR (500 MHz, CDCl3) δ 5.91 (dd, J = 6.7, 3.3 Hz, 1H), 5.50 – 5.44 (m, 1H), 5.32 (dd, J = 10.9, 3.0 Hz, 1H), 5.28 – 5.20 (m, 1H), 4.33 (td, J = 6.0, 5.2, 3.1 Hz, 1H), 4.16 (ddtd, J = 10.6, 8.1, 6.5, 2.9 Hz, 4H), 3.47 (dd, J = 12.8, 7.7 Hz, 1H), 3.19 (ddt, J = 17.5, 10.3, 4.5 Hz, 6H), 2.34 (d, J = 2.5 Hz, 6H), 2.15 (s, 3H), 2.08 (s, 3H), 1.98 (s, 3H). 13C NMR (125 MHz, CDCl3) δ 194.8, 194.78, 170.1, 170.1, 169.9, 94.7 (d, J = 5.2 Hz), 70.1, 68.2, 67.0, 66.9, 66.5 (d, J = 5.7 Hz), 66.4 (d, J = 5.6 Hz), 50.5, 30.6, 29.1 (d, J = 7.3 Hz), 29.1 (d, J = 7.6 Hz), 20.8, 20.7. 31P NMR (200 MHz, CDCl3) δ -3.37. HRMS (DART) m/z: [M+NH4]+ calcd. for C20H34NO13PS2+ 633.12959; found 633.13128. Monodeprotected 6. 95 µL of ethylenediamine (1.42 mmol, 1.10 eq) was added to 8 mL of THF at 0 °C then 96 µL of acetic acid (1.68 mmol, 1.30 eq) was added slowly at 0 °C and stirred for 10 min. Ac46AlGal (460 mg, 1.29 mmol, 1.00 eq) in 8 mL of THF was added slowly and stirred overnight at 0 °C. The reaction was concentrated, dissolved in 30 mL of DCM, and washed twice with 20 mL of 1 M HCl, once with 30 mL of saturated sodium bicarbonate, and once with 40 mL of brine. Crude mixture was dried with sodium sulfate, filtered, and concentrated. The reaction was purified by flash column

12
chromatography (6:1 hexanes/EtOAc, v/v) to yield 6 as a complex mixture of isomers (101 mg, 48% yield). 1H NMR (500 MHz, CDCl3) δ 5.53 (d, J = 3.3 Hz, 1H, α), 5.50 (d, J = 2.9 Hz, 1H, β), 5.48 (d, J = 3.1 Hz, 2H, α & β), 5.41 (dd, J = 10.9, 3.4 Hz, 1H, α), 5.12 (dd, J = 10.9, 3.6 Hz, 1H, α), 5.09 – 5.00 (m, 2H, β), 4.68 (t, J = 7.8 Hz, 1H, β), 4.40 (t, J = 7.4 Hz, 1H, α), 3.86 (dd, J = 8.7, 6.3 Hz, 1H, β), 3.49 (d, J = 3.4 Hz, 1H, α), 2.59 (ddd, J = 14.6, 6.7, 2.6 Hz, 1H, β), 2.54 (dd, J = 6.2, 2.7 Hz, 1H, β), 2.43 (qtd, J = 16.7, 9.2, 7.8, 2.7 Hz, 2H, α), 2.16 (s, 1H), 2.15 (s, 3H), 2.09 (s, 3H), 1.98 (s, 3H). 13C NMR (125 MHz, CDCl3) δ 170.6, 170.4, 170.3, 170.3, 170.2, 96.0, 90.8, 78.9, 78.3, 71.9, 71.5, 71.1, 71.1, 70.7, 69.3, 68.4, 68.2, 67.6, 67.2, 21.0, 20.8, 20.8, 20.8, 20.7, 20.6. HRMS (ESI) m/z: [M+NH4]+ calcd. for C14H22NO8+ 332.13399; found 332.13367. Phosphite 7. Monodeprotected sugar 6 (167 mg, 0.531 mmol, 1.00 eq) was dissolved in 700 µL of THF and 1.4 mL of dioxane and cooled to 0 °C. TEA (150 µL, 1.063 mmol) was then added and stirred for 30 min. 2-Chloro-1,3,2-benzodioxaphosphorin-4-onewas dissolved in 700 µL of THF and added to reaction at 0 °C and stirred for 1.5 h. The reaction was stopped with the addition of 2 mL of water and concentrated, followed by co-evaporation three times with 5 mL of THF. The crude product was dissolved in 3 mL of THF, filtered, and purified by flash column chromatography (7:1 to 3:1 chloroform/methanol + 1% acetic acid, v/v) to yield 7 as a sub-stoichiometric TEA salt (162.0 mg, 64%). 1H NMR (500 MHz, MeOD) δ 6.88 (d, JP-H = 641.9 Hz, 1H), 5.75 (dd, J = 8.3, 3.4 Hz, 1H), 5.57 (d, J = 3.1 Hz, 1H), 5.37 (dd, J = 10.8, 3.2 Hz, 1H), 5.20 – 5.07 (m, 1H), 4.41 (t, J = 7.4 Hz, 1H), 3.21 (q, J = 7.2 Hz, 4H, NCH2CH3), 2.46 (td, J = 11.7, 10.9, 6.3 Hz, 2H), 2.34 (q, J = 3.5, 2.5 Hz, 1H), 2.15 (s, 3H), 2.07 (s, 3H), 1.96 (s, 3H), 1.32 (t, J = 7.2 Hz, 6H, NCH2CH3). 13C NMR (125 MHz, MeOD) δ 171.9, 171.8, 171.6, 93.3, 79.5, 72.2, 70.2, 69.8, 69.2, 68.9, 68.8, 47.8, 20.9, 20.7, 20.6, 20.5, 9.2. 31P NMR (200 MHz, MeOD) δ -0.12. HRMS (ESI) m/z: [M]- calcd. for C14H18O10P- 377.06431; found 377.06326. Phosphate 8. Phosphite sugar 7 (138 mg, 0.366 mmol, 1.00 eq) was dissolved in 6 mL of THF and then Dowex 50W H+ resin was added to the flask. The resin was removed by filtration, and the solution was concentrated. The residue was then dissolved in 5.5 mL of THF and 133 µL of t-BuOOH (0.732 mmol, 2.00 eq) was added, followed by 11 mg of iodine (0.11 mmol, 0.30 eq) in 500 µL of THF. The reaction was stirred overnight at room temperature. TEA (100 µL, 2.00 eq) was added and concentrated. The crude was purified by flash column chromatography (8:1 to 3:2 chloroform/methanol, v/v) to yield 8 as a sub-stoichiometric TEA salt (74.0 mg, 41%). 1H NMR (500 MHz, MeOD) δ 5.70 (dd, J = 7.6, 3.4 Hz, 1H), 5.67 – 5.59 (m, 1H), 5.41 (td, J = 10.5, 3.4 Hz, 1H), 5.15 – 5.04 (m, 1H), 4.50 (ddd, J = 27.7, 10.3, 5.2 Hz, 1H), 3.15 (q, J = 7.3 Hz, 4H), 2.69 – 2.40 (m, 2H), 2.31 (t, J = 2.7 Hz, 1H), 2.15 (s, 3H), 2.07 (s, 3H), 1.96 (s, 3H), 1.30 (t, J = 7.2 Hz, 6H). 13C NMR (125 MHz, MeOD) δ 172.2, 172.0, 171.6, 93.5, 93.4, 79.5, 79.4, 72.2, 70.1, 69.4, 69.0, 47.6, 20.6, 20.5, 20.5, 9.3. 31P NMR (200 MHz, MeOD) δ -1.03. HRMS (ESI) m/z: [M]- calcd. for C14H18O11P- 393.05812; found 393.05786. UDP-6AlGal. Phosphate sugar 8 (63.0 mg, 0.128 mmol, 1.00 eq) was dissolved in 7:3 chloroform:methanol, and ion exchange was performed as above using Dowex 50W H+.

13
The solution was concentrated and co-evaporated with pyridine (3 x 5 mL) on a rotary evaporator that had been previously dried by evaporation of toluene from a separate flask. Uridine 5′-monophosphomorpholidate 4-morpholine-N,N′-dicyclohexylcarboxamidine salt (175 mg, 0.255 mmol, 2.00 eq) and 5-(ethylthio)-1H-tetrazole (33.0 mg, 0.255 mmol, 2.00 eq) were added to the flask and co-evaporated with pyridine (3 x 5 mL). The reagents were then dried under reduced pressure to remove any moisture. 13 mL of pyridine was added to the reaction and stirred for 3 d under nitrogen and in the dark. The reaction was concentrated, co-evaporated 3 times with toluene, and dissolved in 10 mL of methanol. 13 mL of 0.1 M NH4CO3 was added at 0 °C followed by TEA (508 µL, 3.64 mmol, 28.6 eq) and stirred overnight. The pH was adjusted to 7–7.5 using Dowex 50WX8, followed by filtration to remove the resin. The crude mixture was concentrated and dissolved at 20 mg/mL in 10% acetonitrile in water. The product was isolated by semi-preparative C18 HPLC purification using a 0–20% gradient of 0.1 M TEAA (triethylammonium acetate) buffer in water (solvent A) to acetonitrile (solvent B) (33.0 mg, 33%). Excess TEAA salt was present after purification. 1H NMR (500 MHz, D2O) δ 7.95 (d, J = 8.1 Hz, 1H), 5.94 (d, J = 8.1 Hz, 1H), 5.92 (d, J = 4.1 Hz, 1H), 5.54 (dd, J = 7.1, 3.6 Hz, 1H), 4.35 – 4.29 (m, 2H), 4.26 – 4.19 (m, 2H), 4.19 – 4.12 (m, 1H), 4.06 (d, J = 3.2 Hz, 1H), 3.87 (dd, J = 10.3, 3.3 Hz, 1H), 3.73 (dt, J = 10.4, 3.1 Hz, 1H), 3.05 – 2.95 (m, 1H), 2.50 (dd, J = 7.6, 2.7 Hz, 2H), 2.36 (t, J = 2.7 Hz, 1H). 13C NMR (125 MHz, D2O) δ 179.1, 166.1, 151.7, 141.7, 102.6, 95.9, 95.8, 88.6, 83.2, 83.1, 80.3, 73.8, 71.3, 70.0, 69.5, 69.4, 69.2, 68.3, 68.3, 64.8, 64.8, 46.6, 22.2, 19.7, 8.2. 31P NMR (200 MHz, D2O) δ -11.18, -12.85. HRMS (ESI–TOF) m/z: [M]- calcd. for C17H23N2O16P2- 573.0528; found 573.0541.

14
Supporting Information References (1) Thiele, C.; Papan, C.; Hoelper, D.; Kusserow, K.; Gaebler, A.; Schoene, M.;
Piotrowitz, K.; Lohmann, D.; Spandl, J.; Stevanovic, A.; et al. Tracing Fatty Acid Metabolism by Click Chemistry. ACS Chem. Biol. 2012, 7 (12), 2004–2011. https://doi.org/10.1021/cb300414v.
(2) Darabedian, N.; Gao, J.; Chuh, K. N.; Woo, C. M.; Pratt, M. R. The Metabolic Chemical Reporter 6-Azido-6-Deoxy-Glucose Further Reveals the Substrate Promiscuity of O -GlcNAc Transferase and Catalyzes the Discovery of Intracellular Protein Modification by O -Glucose. J. Am. Chem. Soc. 2018, 140 (23), 7092–7100. https://doi.org/10.1021/jacs.7b13488.
(3) Bosco, M.; Gall, S. Le; Rihouey, C.; Couve-Bonnaire, S.; Bardor, M.; Lerouge, P.; Pannecoucke, X. 6-Azido d-Galactose Transfer to N-Acetyl-d-Glucosamine Derivative Using Commercially Available β-1,4-Galactosyltransferase. Tetrahedron Lett. 2008, 49 (14), 2294–2297. https://doi.org/10.1016/j.tetlet.2008.02.018.
(4) Elchert, B.; Li, J.; Wang, J.; Hui, Y.; Rai, R.; Ptak, R.; Ward, P.; Takemoto, J. Y.; Bensaci, M.; Chang, C.-W. T. Application of the Synthetic Aminosugars for Glycodiversification: Synthesis and Antimicrobial Studies of Pyranmycin. J. Org. Chem. 2004, 69 (5), 1513–1523. https://doi.org/10.1021/jo035290r.
(5) Günther, K.; Ziegler, T. Synthesis of 1,2,3-Triazole-Linked Glycoconjugates of N-(2-Aminoethyl)Glycine: Building Blocks for the Construction of Combinatorial Glycopeptide Libraries. Synthesis (Stuttg). 2014, 46 (17), 2362–2370. https://doi.org/10.1055/s-0033-1339137.
(6) Kizuka, Y.; Funayama, S.; Shogomori, H.; Nakano, M.; Nakajima, K.; Oka, R.; Kitazume, S.; Yamaguchi, Y.; Sano, M.; Korekane, H.; et al. High-Sensitivity and Low-Toxicity Fucose Probe for Glycan Imaging and Biomarker Discovery. Cell Chem. Biol. 2016, 23 (7), 782–792. https://doi.org/10.1016/j.chembiol.2016.06.010.
(7) Lee, H. H.; Hodgson, P. G.; Bernacki, R. J.; Korytnyk, W.; Sharma, M. Analogs of Cell Surface Carbohydrates. Synthesis of d-Galactose Derivatives Having an Ethynyl, Vinyl or Epoxy Residue at C-5. Carbohydr. Res. 1988, 176 (1), 59–72. https://doi.org/10.1016/0008-6215(88)84057-6.
(8) Tan, H. Y.; Eskandari, R.; Shen, D.; Zhu, Y.; Liu, T.-W.; Willems, L. I.; Alteen, M. G.; Madden, Z.; Vocadlo, D. J. Direct One-Step Fluorescent Labeling of O -GlcNAc-Modified Proteins in Live Cells Using Metabolic Intermediates. J. Am. Chem. Soc. 2018, 140 (45), 15300–15308. https://doi.org/10.1021/jacs.8b08260.
(9) and, E.-H. R.; Zhao*, Y. Efficient Synthesis of Water-Soluble Calixarenes Using Click Chemistry. 2005. https://doi.org/10.1021/OL047468H.
(10) Xie, W.; Tanabe, G.; Akaki, J.; Morikawa, T.; Ninomiya, K.; Minematsu, T.; Yoshikawa, M.; Wu, X.; Muraoka, O. Isolation, Structure Identification and SAR Studies on Thiosugar Sulfonium Salts, Neosalaprinol and Neoponkoranol, as Potent α-Glucosidase Inhibitors. Bioorg. Med. Chem. 2011, 19 (6), 2015–2022. https://doi.org/10.1016/j.bmc.2011.01.052.
(11) Lefebvre, I.; Perigaud, C.; Pompon, A.; Aubertin, A.-M.; Girardet, J.-L.; Kirn, A.; Gosselin, G.; Imbach, J.-L. Mononucleoside Phosphotriester Derivatives with S-

15
Acyl-2-Thioethyl Bioreversible Phosphate-Protecting Groups: Intracellular Delivery of 3’-Azido-2’,3’-Dideoxythymidine 5’-Monophosphate. J. Med. Chem. 1995, 38 (20), 3941–3950. https://doi.org/10.1021/jm00020a007.

16
1H, 13C, and 31P NMR Spectra
1H NMR of compound 2 (500 MHz, CDCl3)
13C NMR of compound 2 (125 MHz, CDCl3)
O
OOO
O
TIPS
2
0.00.51.01.52.02.53.03.54.04.55.05.56.06.57.07.58.08.59.09.510.0f1 (ppm)
31
.72
6.3
63
.32
5.2
6
1.1
21
.13
1.0
8
1.0
51
.14
1.1
0
1.0
0
1.0
41
.05
1.0
61
.32
1.4
41
.52
2.5
12
.52
2.5
42
.55
2.6
22
.63
2.6
52
.67
3.9
03
.90
3.9
13
.91
3.9
23
.93
3.9
34
.28
4.2
84
.29
4.2
94
.33
4.3
44
.35
4.3
54
.59
4.5
94
.61
4.6
15
.49
5.5
0
O
OOO
O
TIPS
2
05101520253035404550556065707580859095100105110115120125130135140f1 (ppm)
11
.25
11
.39
18
.71
18
.74
22
.05
24
.26
25
.11
26
.07
26
.17
31
.71
65
.59
67
.18
70
.77
70
.89
71
.38
82
.27
96
.67
10
4.6
31
08
.63
10
9.2
111
2.9
8

17
1H NMR of compound 3 (500 MHz, CDCl3)
13C NMR of compound 3 (125 MHz, CDCl3)
O
OOO
O
3
0.00.51.01.52.02.53.03.54.04.55.05.56.06.57.07.58.08.59.09.510.0f1 (ppm)
3.1
62
.84
3.1
03
.05
0.8
8
1.1
11
.12
1.1
0
2.2
3
1.0
8
1.0
0
1.3
31
.36
1.4
51
.55
2.0
02
.01
2.0
12
.48
2.5
02
.51
2.5
22
.53
2.5
32
.55
2.5
62
.57
2.5
72
.59
2.6
02
.61
3.9
03
.90
3.9
13
.92
3.9
23
.93
3.9
3
4.3
04
.31
4.3
14
.32
4.3
24
.33
4.3
44
.34
4.6
24
.62
4.6
34
.64
5.5
15
.52
O
OOO
O
3
05101520253035404550556065707580859095100105110115120125130135140f1 (ppm)
20
.47
24
.65
25
.05
26
.11
26
.19
66
.74
69
.99
70
.61
70
.93
71
.47
80
.41
96
.69
10
8.8
01
09
.49

18
1H NMR of Ac46AlGal (500 MHz, CDCl3)
13C NMR of Ac46AlGal (125 MHz, CDCl3)
O
OAcAcOAcO
AcO
Ac46AlGal
0.00.51.01.52.02.53.03.54.04.55.05.56.06.57.07.58.08.59.09.510.0f1 (ppm)
18
.84
1.6
71
.04
1.0
0
0.7
2
1.0
81
.55
0.7
21
.03
0.7
91
.00
0.6
9
1.9
51
.96
1.9
72
.00
2.0
02
.06
2.0
72
.07
2.0
82
.12
2.1
32
.14
2.1
42
.39
2.3
92
.41
2.4
12
.42
2.4
22
.43
2.4
32
.44
2.4
52
.45
2.4
62
.46
2.4
72
.50
2.5
02
.51
2.5
12
.53
2.5
42
.54
3.9
23
.94
3.9
43
.95
4.2
14
.22
4.2
24
.23
5.0
55
.06
5.0
75
.08
5.2
45
.25
5.2
65
.26
5.2
75
.28
5.2
95
.30
5.3
15
.33
5.3
35
.51
5.5
15
.57
5.5
85
.64
5.6
66
.29
6.3
06
.30
O
OAcAcOAcO
AcO
Ac46AlGal
-100102030405060708090100110120130140150160170180190200210f1 (ppm)
20
.31
20
.59
20
.65
20
.67
20
.69
20
.84
20
.93
66
.40
67
.64
67
.67
67
.79
68
.30
69
.74
71
.02
71
.04
71
.46
71
.67
72
.51
77
.67
77
.94
89
.79
89
.81
92
.14
92
.16
16
9.0
31
69
.44
16
9.9
41
69
.98
17
0.0
41
70
.07
17
0.1
5
19
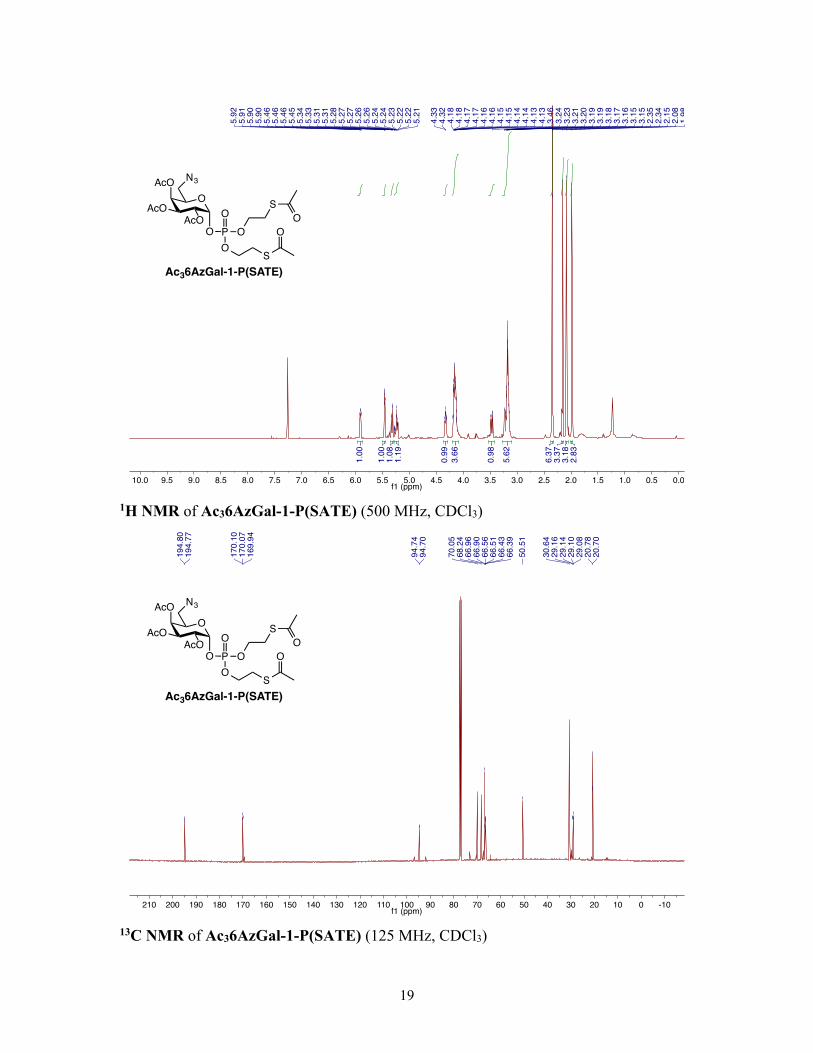
1H NMR of Ac36AzGal-1-P(SATE) (500 MHz, CDCl3)
13C NMR of Ac36AzGal-1-P(SATE) (125 MHz, CDCl3)
O
OAcO
AcO
AcO N3
PO
OO
SO
S
O
Ac36AzGal-1-P(SATE)
0.00.51.01.52.02.53.03.54.04.55.05.56.06.57.07.58.08.59.09.510.0f1 (ppm)
2.8
33
.18
3.3
76
.37
5.6
2
0.9
8
3.6
6
0.9
9
1.1
91
.08
1.0
0
1.0
0
1.9
82
.08
2.1
52
.34
2.3
53
.15
3.1
53
.16
3.1
73
.18
3.1
93
.19
3.2
03
.21
3.2
33
.24
3.4
64
.13
4.1
34
.14
4.1
44
.15
4.1
54
.16
4.1
64
.17
4.1
74
.18
4.1
84
.32
4.3
3
5.2
15
.22
5.2
25
.23
5.2
45
.24
5.2
65
.26
5.2
75
.27
5.2
85
.31
5.3
15
.33
5.3
45
.45
5.4
65
.46
5.4
65
.90
5.9
05
.91
5.9
2
O
OAcO
AcO
AcO N3
PO
OO
SO
S
O
Ac36AzGal-1-P(SATE)
-100102030405060708090100110120130140150160170180190200210f1 (ppm)
20
.70
20
.78
29
.08
29
.10
29
.14
29
.16
30
.64
50
.51
66
.39
66
.43
66
.51
66
.56
66
.90
66
.96
68
.24
70
.05
94
.70
94
.74
16
9.9
41
70
.07
17
0.1
0
19
4.7
71
94
.80

20
31P NMR of Ac36AzGal-1-P(SATE) (200 MHz, CDCl3)
O
OAcO
AcO
AcO N3
PO
OO
SO
S
O
Ac36AzGal-1-P(SATE)
-250-230-210-190-170-150-130-110-90-70-50-30-101030507090110130150f1 (ppm)
-3.3
7

21
1H NMR of compound 6 (500 MHz, CDCl3)
13C NMR of compound 6 (125 MHz, CDCl3)
O
OHAcOAcO
AcO
6
0.00.51.01.52.02.53.03.54.04.55.05.56.06.57.07.58.08.59.09.510.0f1 (ppm)
3.5
63
.56
2.9
00
.93
2.5
20
.21
0.2
5
1.0
0
0.5
5
0.9
6
0.2
9
0.6
71
.00
1.0
61
.16
0.2
51
.00
1.9
81
.99
2.0
82
.09
2.1
52
.16
2.3
62
.37
2.3
82
.38
2.3
92
.40
2.4
12
.41
2.4
22
.43
2.4
42
.44
2.4
62
.46
2.4
72
.47
2.4
82
.49
2.5
02
.53
2.5
42
.55
2.5
52
.58
2.5
92
.60
3.4
83
.49
3.8
43
.85
3.8
63
.86
3.8
84
.38
4.4
04
.41
4.6
74
.68
4.7
05
.02
5.0
45
.05
5.0
65
.07
5.0
95
.11
5.1
15
.13
5.1
45
.40
5.4
15
.42
5.4
35
.47
5.4
75
.48
5.5
05
.50
5.5
25
.53
O
OHAcOAcO
AcO
6
-100102030405060708090100110120130140150160170180190200210f1 (ppm)
20
.58
20
.71
20
.77
20
.79
20
.81
20
.97
67
.16
67
.62
68
.15
68
.39
69
.32
70
.65
71
.09
71
.12
71
.52
71
.95
78
.27
78
.91
90
.77
95
.97
17
0.2
51
70
.28
17
0.2
91
70
.40
17
0.6
2

22
1H NMR of compound 7 (500 MHz, MeOD)
13C NMR of compound 7 (125 MHz, MeOD)
O
OAcOAcO
AcO
PO
OH
NHEt3
7
0.00.51.01.52.02.53.03.54.04.55.05.56.06.57.07.58.08.59.09.510.0f1 (ppm)
6.1
0
3.0
02
.84
3.2
61
.20
1.6
9
3.9
5
0.9
5
1.2
50
.97
0.9
50
.96
0.9
9
1.3
01
.32
1.3
31
.96
2.0
72
.15
2.3
22
.33
2.3
32
.34
2.3
52
.35
2.4
42
.44
2.4
62
.47
2.4
82
.49
2.5
03
.19
3.2
03
.21
3.2
3
4.3
94
.41
4.4
25
.10
5.1
15
.12
5.1
35
.13
5.1
45
.36
5.3
65
.38
5.3
95
.57
5.5
85
.74
5.7
45
.75
5.7
66
.24
7.5
2
O
OAcOAcO
AcO
PO
OH
NHEt3
7
-100102030405060708090100110120130140150160170180190200210f1 (ppm)
9.2
1
20
.48
20
.59
20
.66
20
.89
47
.84
68
.84
68
.89
69
.22
69
.76
70
.16
72
.15
79
.49
93
.27
17
1.5
71
71
.83
17
1.9
0

23
31P NMR of compound 7 (200 MHz, MeOD)
O
OAcOAcO
AcO
PO
OH
NHEt3
7
-250-230-210-190-170-150-130-110-90-70-50-30-101030507090110130150f1 (ppm)
-0.1
2
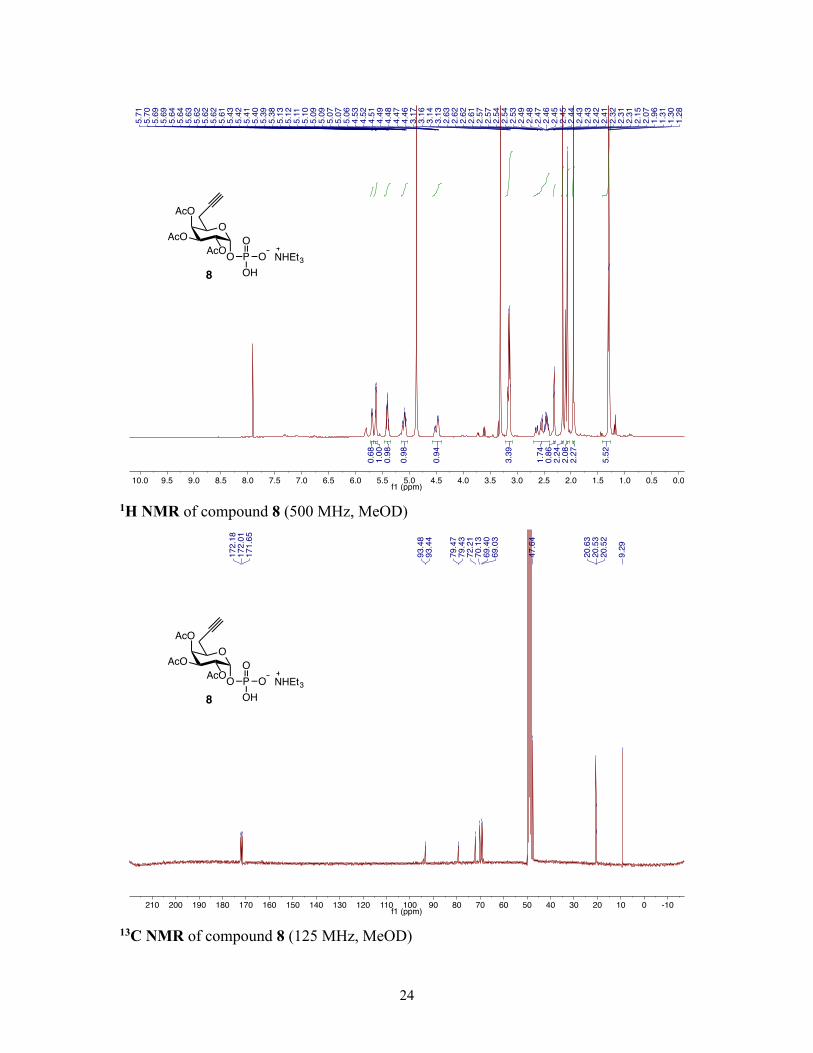
24
1H NMR of compound 8 (500 MHz, MeOD)
13C NMR of compound 8 (125 MHz, MeOD)
O
OAcOAcO
AcO
PO
OOH
NHEt38
0.00.51.01.52.02.53.03.54.04.55.05.56.06.57.07.58.08.59.09.510.0f1 (ppm)
5.5
2
2.2
72
.08
2.2
40
.86
1.7
4
3.3
9
0.9
4
0.9
8
0.9
81
.00
0.6
8
1.2
81
.30
1.3
11
.96
2.0
72
.15
2.3
12
.31
2.3
22
.41
2.4
22
.43
2.4
32
.44
2.4
52
.45
2.4
62
.47
2.4
82
.49
2.5
32
.54
2.5
42
.57
2.5
72
.61
2.6
22
.62
2.6
33
.13
3.1
43
.16
3.1
74
.46
4.4
74
.48
4.4
94
.51
4.5
24
.53
5.0
65
.07
5.0
75
.09
5.0
95
.10
5.1
15
.12
5.1
35
.38
5.3
95
.40
5.4
15
.42
5.4
35
.61
5.6
25
.62
5.6
25
.63
5.6
45
.64
5.6
95
.69
5.7
05
.71
O
OAcOAcO
AcO
PO
OOH
NHEt38
-100102030405060708090100110120130140150160170180190200210f1 (ppm)
9.2
9
20
.52
20
.53
20
.63
47
.64
69
.03
69
.40
70
.13
72
.21
79
.43
79
.47
93
.44
93
.48
17
1.6
51
72
.01
17
2.1
8

25
31P NMR of compound 8 (200 MHz, MeOD)
O
OAcOAcO
AcO
PO
OOH
NHEt38
-250-230-210-190-170-150-130-110-90-70-50-30-101030507090110130150f1 (ppm)
-1.0
3

26
1H NMR of UDP-6AlGal (500 MHz, D2O)
13C NMR of UDP-6AlGal (125 MHz, D2O)
O
OHOHO
HO
PO
OO O N
NH
HO OH
O
O
OPO
O
NHEt3 NHEt3
UDP-6AlGal
0.00.51.01.52.02.53.03.54.04.55.05.56.06.57.07.58.08.59.09.510.0f1 (ppm)
0.6
72
.04
1.2
3
1.0
70
.98
0.9
80
.59
1.9
81
.89
1.0
1
0.7
51
.07
1.0
0
1.2
21
.24
1.2
51
.95
2.3
52
.36
2.3
62
.49
2.4
92
.50
2.5
12
.99
3.0
03
.02
3.0
33
.13
3.1
53
.16
3.1
83
.71
3.7
23
.72
3.7
33
.74
3.7
43
.85
3.8
63
.87
3.8
84
.06
4.0
74
.14
4.1
54
.17
4.1
84
.20
4.2
04
.21
4.2
24
.23
4.2
44
.24
4.3
04
.32
4.3
24
.33
4.3
45
.53
5.5
45
.55
5.5
55
.92
5.9
35
.94
5.9
57
.94
7.9
6
-100102030405060708090100110120130140150160170180190200210f1 (ppm)
8.2
5
19
.65
22
.16
46
.62
64
.79
64
.84
68
.27
68
.33
69
.19
69
.40
69
.50
69
.98
71
.29
73
.84
80
.28
83
.11
83
.18
88
.56
95
.81
95
.86
10
2.5
8
14
1.6
9
15
1.6
8
16
6.1
2
17
9.1
5
O
OHOHO
HO
PO
OO O N
NH
HO OH
O
O
OPO
O
NHEt3 NHEt3
UDP-6AlGal

27
31P NMR of UDP-6AlGal (200 MHz, D2O)
-250-230-210-190-170-150-130-110-90-70-50-30-101030507090110130150f1 (ppm)
-12
.85
-11
.18
O
OHOHO
HO
PO
OO O N
NH
HO OH
O
O
OPO
O
NHEt3 NHEt3
UDP-6AlGal

download fileview on ChemRxivDaughtry manuscript SI final.pdf (1.62 MiB)