Embed Size (px)
Citation preview
l Click to edit Master subtitle style

l Click to edit Master subtitle style
Global delivery Argentina’s Outlook
Beatriz Nofal (PH.D.) President, Eco-Axis S.A. Profesor, ITBA
` Former Head, Argentina’s Investment Development Agency Member of Advisory Board ARGENCON
l Click to edit Master subtitle style
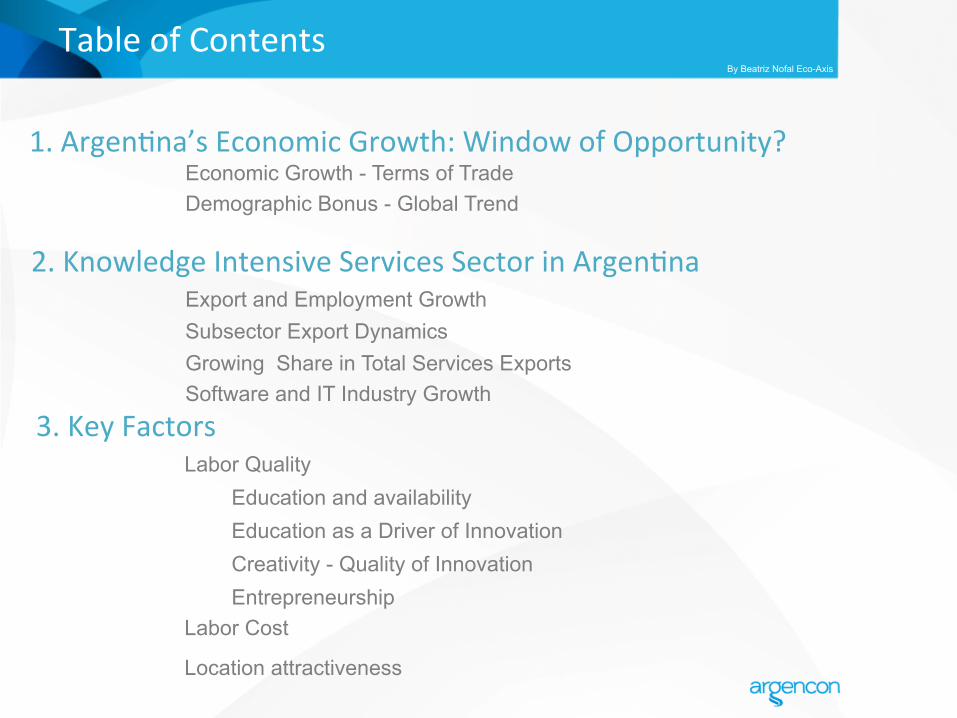
Economic Growth - Terms of Trade Demographic Bonus - Global Trend Export and Employment Growth Subsector Export Dynamics Growing Share in Total Services Exports Software and IT Industry Growth
Labor Quality Education and availability
Education as a Driver of Innovation Creativity - Quality of Innovation Entrepreneurship
Labor Cost
Location attractiveness
1. Argen)na’s Economic Growth: Window of Opportunity?
Table of Contents
2. Knowledge Intensive Services Sector in Argen)na
3. Key Factors
By Beatriz Nofal Eco-Axis
l Click to edit Master subtitle style
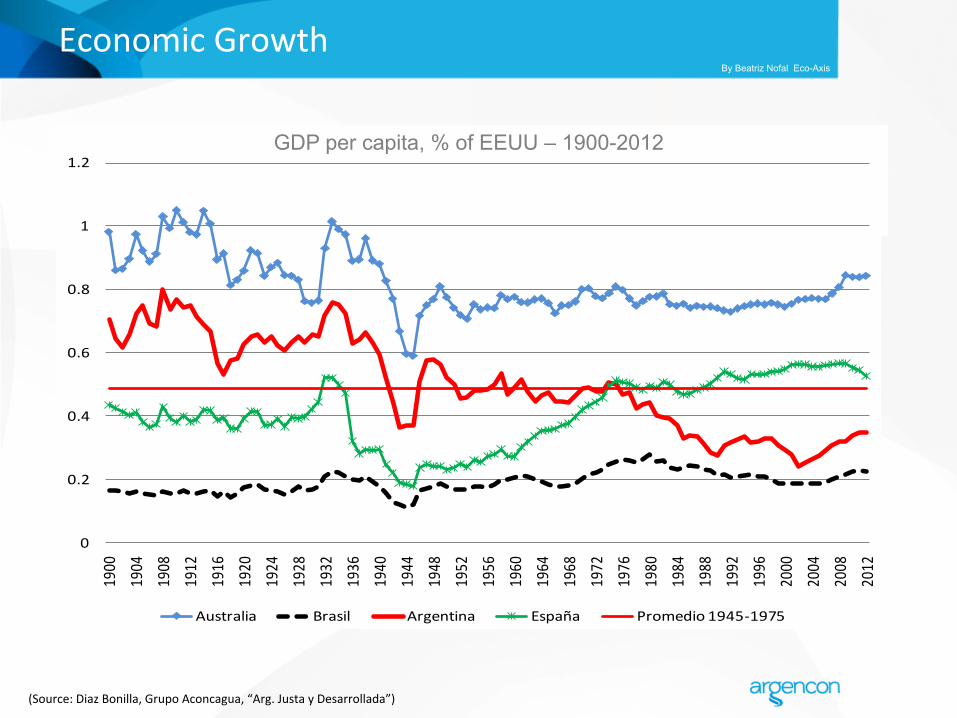
Economic Growth
GDP per capita, % of EEUU – 1900-2012
0
0.2
0.4
0.6
0.8
1
1.2
1900
1904
1908
1912
1916
1920
1924
1928
1932
1936
1940
1944
1948
1952
1956
1960
1964
1968
1972
1976
1980
1984
1988
1992
1996
2000
2004
2008
2012
PBI per capita como % de EEUU
Australia Brasil Argentina España Promedio 1945-‐1975
(Source: Diaz Bonilla, Grupo Aconcagua, “Arg. Justa y Desarrollada”)
By Beatriz Nofal Eco-Axis
l Click to edit Master subtitle style
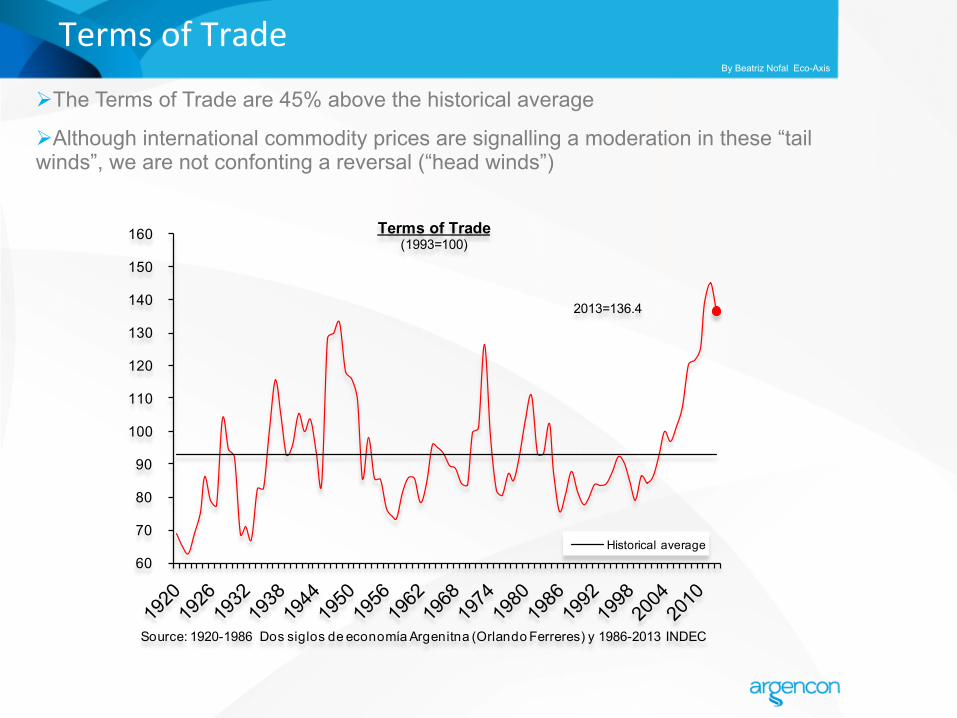
Terms of Trade
60
70
80
90
100
110
120
130
140
150
160 Terms of Trade(1993=100)
Historical average
Source: 1920-1986 Dos siglos de economía Argenitna (Orlando Ferreres) y 1986-2013 INDEC
2013=136.4
Ø The Terms of Trade are 45% above the historical average
Ø Although international commodity prices are signalling a moderation in these “tail winds”, we are not confonting a reversal (“head winds”)
By Beatriz Nofal Eco-Axis
l Click to edit Master subtitle style
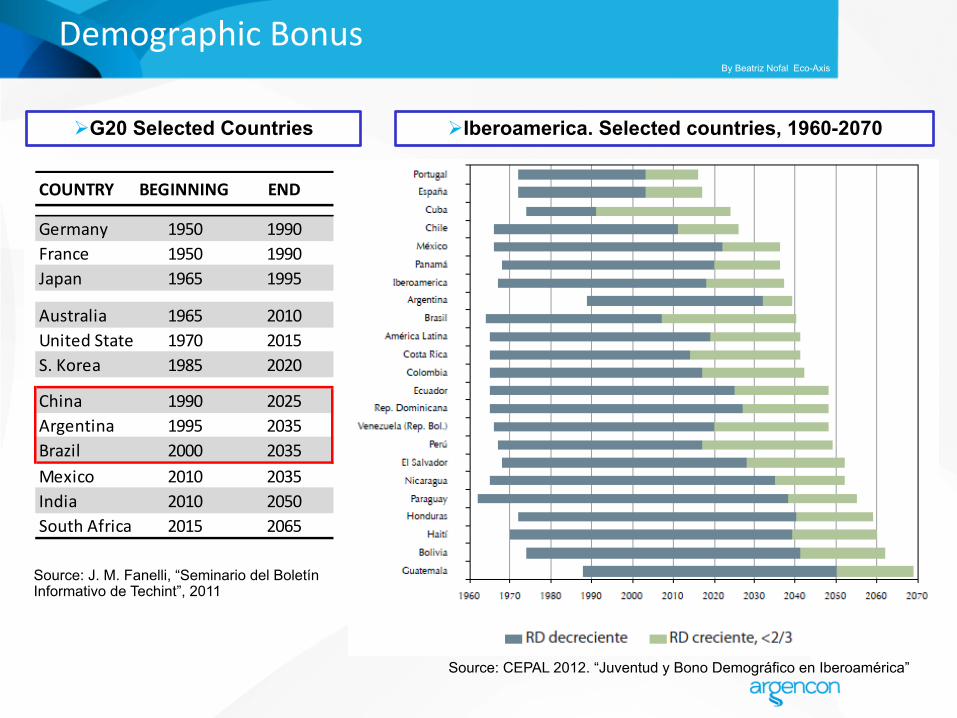
Demographic Bonus
Source: J. M. Fanelli, “Seminario del Boletín Informativo de Techint”, 2011
Ø G20 Selected Countries
Source: CEPAL 2012. “Juventud y Bono Demográfico en Iberoamérica”
Ø Iberoamerica. Selected countries, 1960-2070
COUNTRY BEGINNING END
Germany 1950 1990France 1950 1990Japan 1965 1995
Australia 1965 2010United States 1970 2015S. Korea 1985 2020
China 1990 2025Argentina 1995 2035Brazil 2000 2035Mexico 2010 2035India 2010 2050South Africa 2015 2065
By Beatriz Nofal Eco-Axis
l Click to edit Master subtitle style
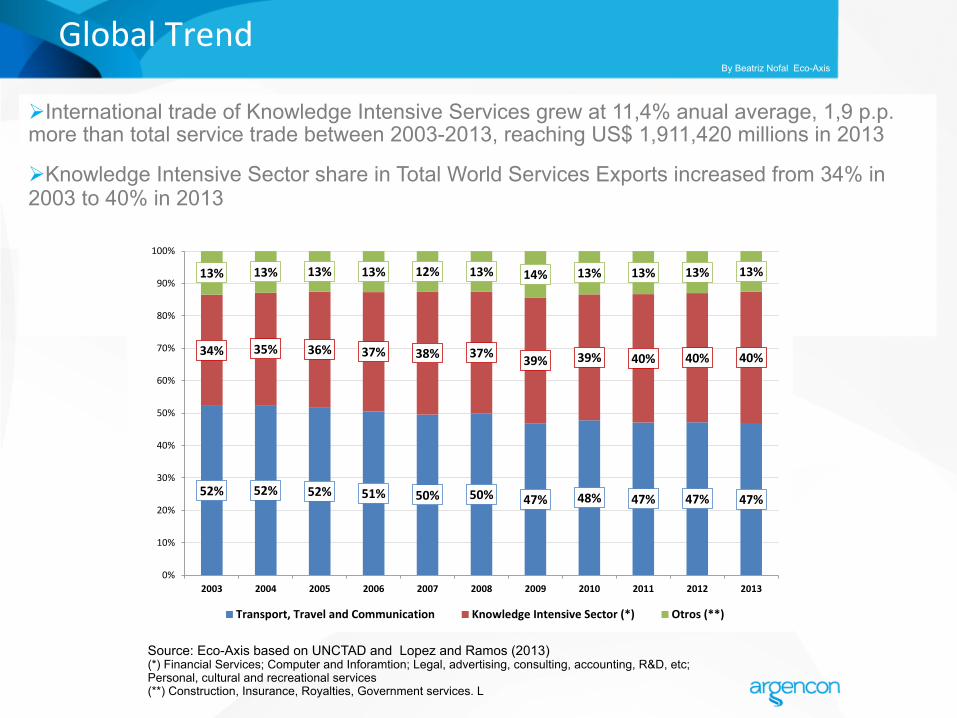
Global Trend
Source: Eco-Axis based on UNCTAD and Lopez and Ramos (2013) (*) Financial Services; Computer and Inforamtion; Legal, advertising, consulting, accounting, R&D, etc; Personal, cultural and recreational services (**) Construction, Insurance, Royalties, Government services. L
Ø International trade of Knowledge Intensive Services grew at 11,4% anual average, 1,9 p.p. more than total service trade between 2003-2013, reaching US$ 1,911,420 millions in 2013
Ø Knowledge Intensive Sector share in Total World Services Exports increased from 34% in 2003 to 40% in 2013
52% 52% 52% 51% 50% 50% 47% 48% 47% 47% 47%
34% 35% 36% 37% 38% 37% 39% 39% 40% 40% 40%
13% 13% 13% 13% 12% 13% 14% 13% 13% 13% 13%
0%
10%
20%
30%
40%
50%
60%
70%
80%
90%
100%
2003 2004 2005 2006 2007 2008 2009 2010 2011 2012 2013
Transport, Travel and Communication Knowledge Intensive Sector (*) Otros (**)
By Beatriz Nofal Eco-Axis
l Click to edit Master subtitle style
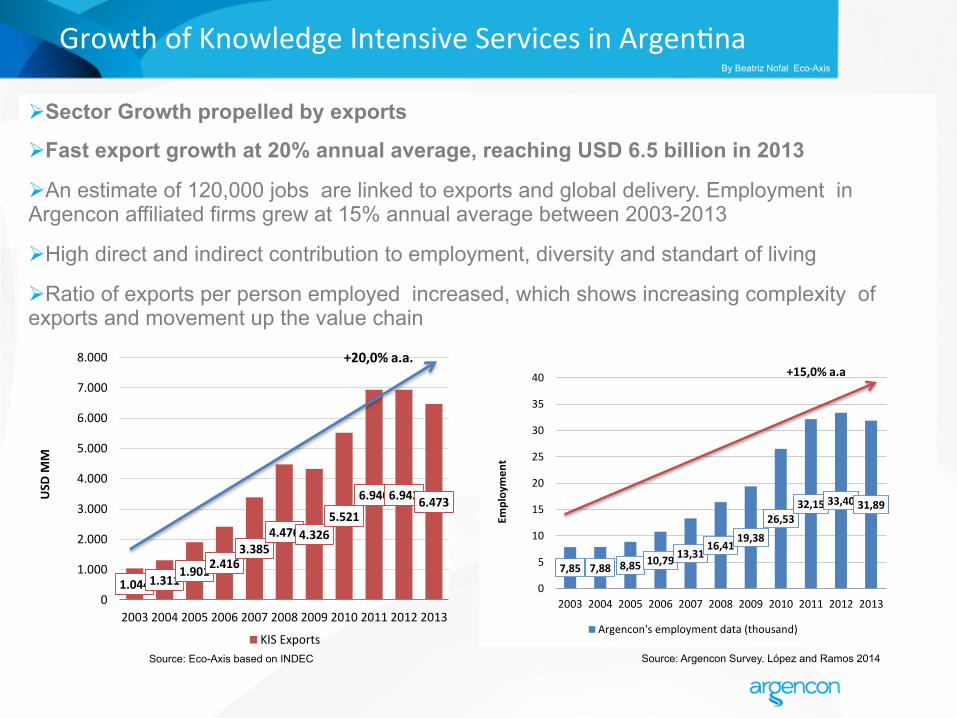
Growth of Knowledge Intensive Services in Argen)na
Ø Sector Growth propelled by exports
Ø Fast export growth at 20% annual average, reaching USD 6.5 billion in 2013
Ø An estimate of 120,000 jobs are linked to exports and global delivery. Employment in Argencon affiliated firms grew at 15% annual average between 2003-2013
Ø High direct and indirect contribution to employment, diversity and standart of living
Ø Ratio of exports per person employed increased, which shows increasing complexity of exports and movement up the value chain
7,85 7,88 8,85 10,79 13,3116,41
19,3826,53
32,15 33,40 31,89
0
5
10
15
20
25
30
35
40
2003 2004 2005 2006 2007 2008 2009 2010 2011 2012 2013
Employmen
t
Argencon's employment data (thousand)
+15,0% a.a
Source: Argencon Survey. López and Ramos 2014 Source: Eco-Axis based on INDEC
1.0441.3111.9012.416
3.3854.4764.326
5.521
6.9406.9426.473
0
1.000
2.000
3.000
4.000
5.000
6.000
7.000
8.000
2003 2004 2005 2006 2007 2008 2009 2010 2011 2012 2013
USD
MM
KIS Exports
+20,0% a.a.
By Beatriz Nofal Eco-Axis
l Click to edit Master subtitle style
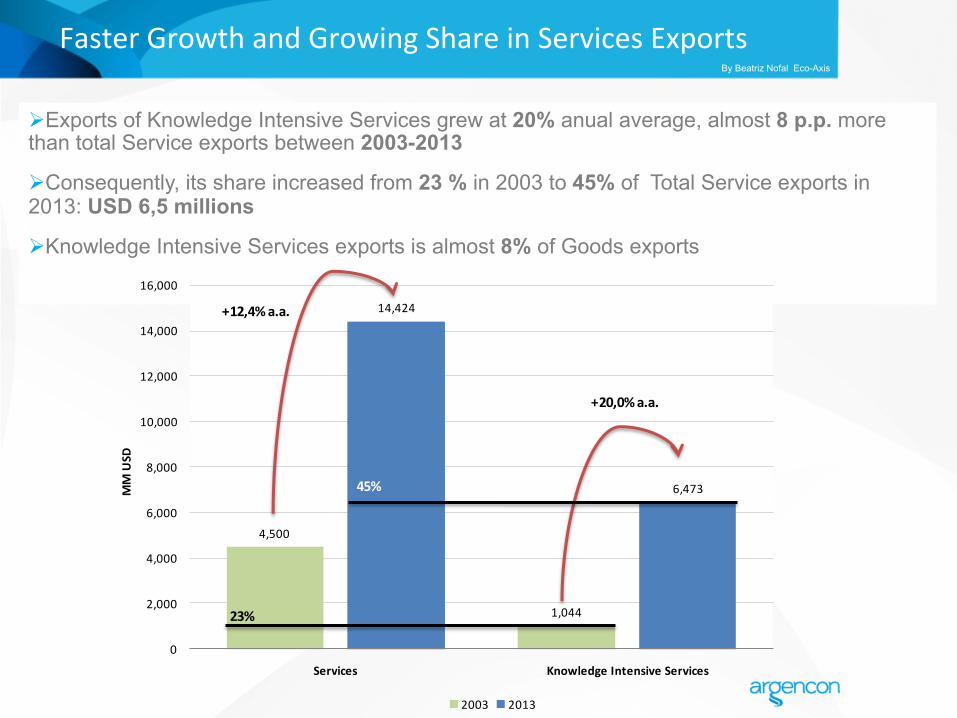
Faster Growth and Growing Share in Services Exports
Ø Exports of Knowledge Intensive Services grew at 20% anual average, almost 8 p.p. more than total Service exports between 2003-2013
Ø Consequently, its share increased from 23 % in 2003 to 45% of Total Service exports in 2013: USD 6,5 millions
Ø Knowledge Intensive Services exports is almost 8% of Goods exports
4,500
1,044
14,424
6,473
0
2,000
4,000
6,000
8,000
10,000
12,000
14,000
16,000
Services Knowledge Intensive Services
MM USD
2003 2013
+12,4%a.a.
+20,0%a.a.
23%
45%
By Beatriz Nofal Eco-Axis
l Click to edit Master subtitle style
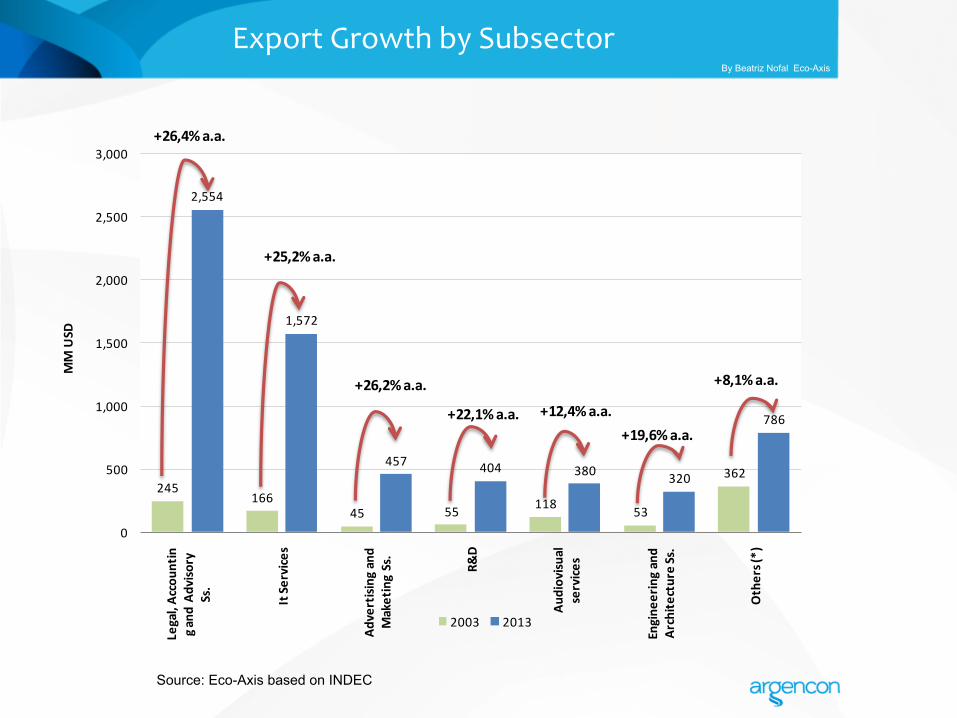
Export Growth by Subsector
245166
45 55 118 53
362
2,554
1,572
457 404 380 320
786
0
500
1,000
1,500
2,000
2,500
3,000Legal, Accoun
ting a
nd Adviso
ry
Ss.
It Se
rvice
s
Advertising and
Maketing Ss.
R&D
Audiovisu
al
service
s
Engine
ering and
Archite
cture Ss.
Others (*)
MM USD
2003 2013
+25,2%a.a.
+26,4%a.a.
+26,2%a.a.
+22,1%a.a. +12,4%a.a.+19,6%a.a.
+8,1%a.a.
Source: Eco-Axis based on INDEC
By Beatriz Nofal Eco-Axis
l Click to edit Master subtitle style
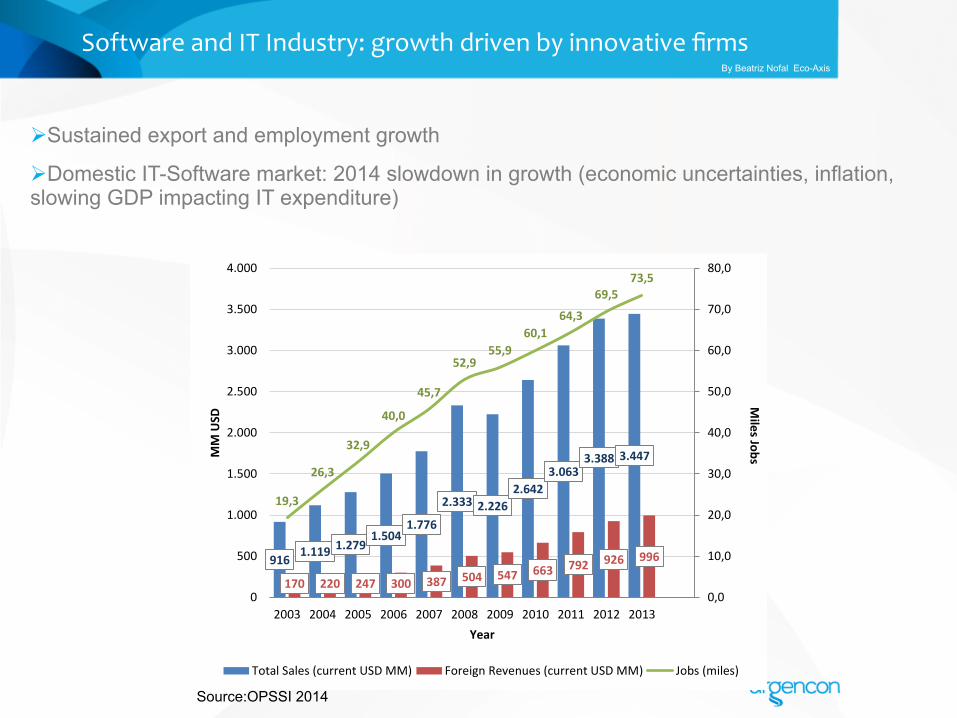
Software and IT Industry: growth driven by innovative firms
916 1.119 1.2791.504
1.776
2.333 2.2262.642
3.0633.388 3.447
170 220 247 300 387 504 547 663 792 926 996
19,3
26,3
32,9
40,0
45,7
52,955,9
60,164,3
69,573,5
0,0
10,0
20,0
30,0
40,0
50,0
60,0
70,0
80,0
0
500
1.000
1.500
2.000
2.500
3.000
3.500
4.000
2003 2004 2005 2006 2007 2008 2009 2010 2011 2012 2013
Miles JobsM
M USD
Year
Total Sales (current USD MM) Foreign Revenues (current USD MM) Jobs (miles)
Ø Sustained export and employment growth
Ø Domestic IT-Software market: 2014 slowdown in growth (economic uncertainties, inflation, slowing GDP impacting IT expenditure)
Source:OPSSI 2014
By Beatriz Nofal Eco-Axis
l Click to edit Master subtitle style
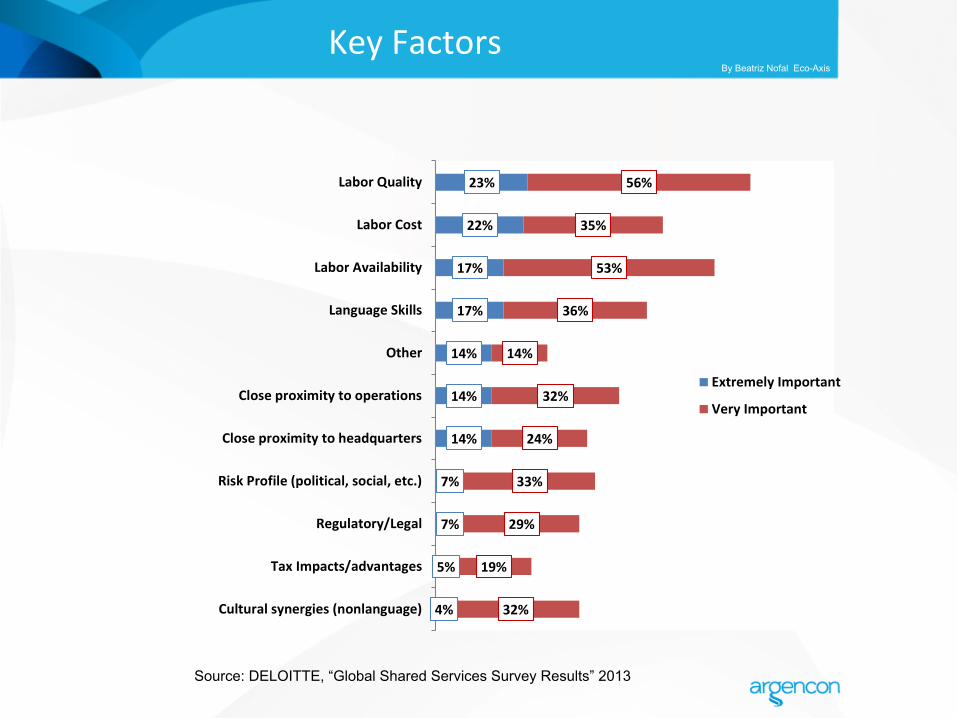
Key Factors
23%
22%
17%
17%
14%
14%
14%
7%
7%
5%
4%
56%
35%
53%
36%
14%
32%
24%
33%
29%
19%
32%
Labor Quality
Labor Cost
Labor Availability
Language Skills
Other
Close proximity to operations
Close proximity to headquarters
Risk Profile (political, social, etc.)
Regulatory/Legal
Tax Impacts/advantages
Cultural synergies (nonlanguage)
Extremely Important
Very Important
Source: DELOITTE, “Global Shared Services Survey Results” 2013
By Beatriz Nofal Eco-Axis
l Click to edit Master subtitle style
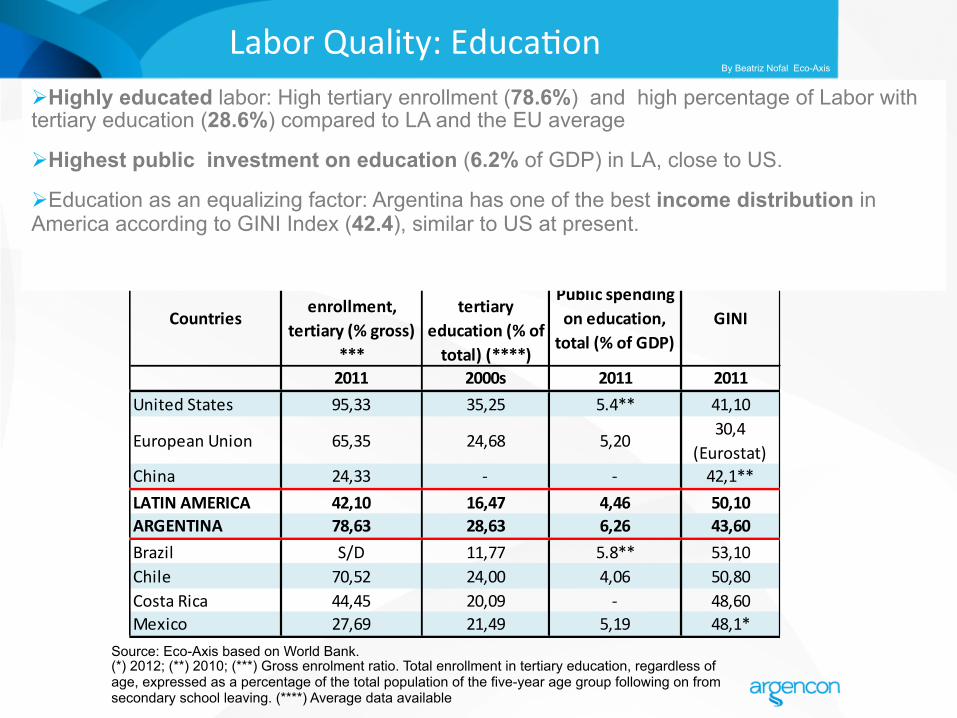
Labor Quality: Educa)on
Countries
School enrollment,
tertiary (% gross) ***
Labor force with tertiary
education (% of total) (****)
Public spending on education, total (% of GDP)
GINI
2011 2000s 2011 2011United States 95,33 35,25 5.4** 41,10
European Union 65,35 24,68 5,2030,4
(Eurostat)China 24,33 -‐ -‐ 42,1**LATIN AMERICA 42,10 16,47 4,46 50,10ARGENTINA 78,63 28,63 6,26 43,60Brazil S/D 11,77 5.8** 53,10Chile 70,52 24,00 4,06 50,80Costa Rica 44,45 20,09 -‐ 48,60Mexico 27,69 21,49 5,19 48,1*
Source: Eco-Axis based on World Bank. (*) 2012; (**) 2010; (***) Gross enrolment ratio. Total enrollment in tertiary education, regardless of age, expressed as a percentage of the total population of the five-year age group following on from secondary school leaving. (****) Average data available
Ø Highly educated labor: High tertiary enrollment (78.6%) and high percentage of Labor with tertiary education (28.6%) compared to LA and the EU average
Ø Highest public investment on education (6.2% of GDP) in LA, close to US.
Ø Education as an equalizing factor: Argentina has one of the best income distribution in America according to GINI Index (42.4), similar to US at present.
By Beatriz Nofal Eco-Axis
l Click to edit Master subtitle style
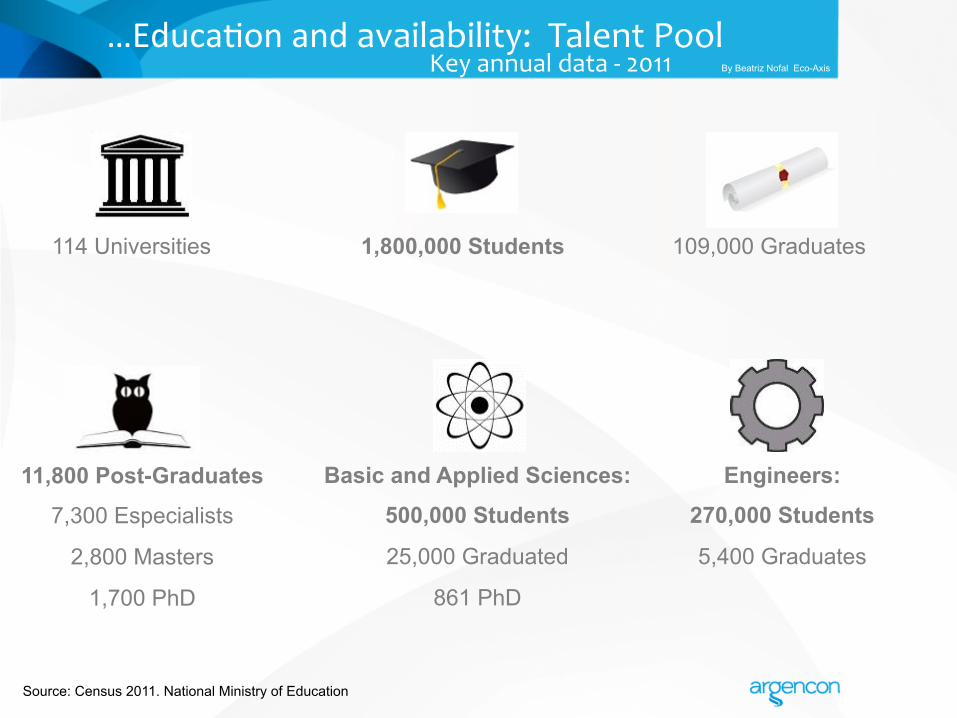
…Educa)on and availability: Talent Pool Key annual data -‐ 2011
Source: Census 2011. National Ministry of Education
114 Universities 1,800,000 Students
Engineers:
270,000 Students
5,400 Graduates
Basic and Applied Sciences:
500,000 Students
25,000 Graduated
861 PhD
109,000 Graduates
11,800 Post-Graduates
7,300 Especialists
2,800 Masters
1,700 PhD
By Beatriz Nofal Eco-Axis
l Click to edit Master subtitle style
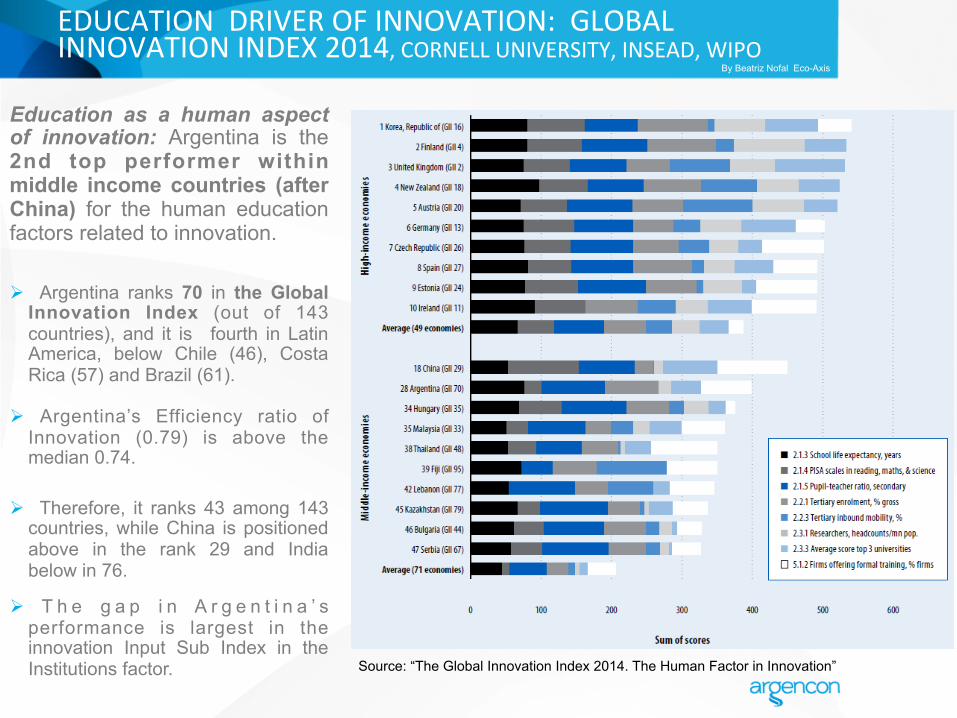
Ø Argentina ranks 70 in the Global Innovation Index (out of 143 countries), and it is fourth in Latin America, below Chile (46), Costa Rica (57) and Brazil (61).
Ø Argentina’s Efficiency ratio of Innovation (0.79) is above the median 0.74.
Ø Therefore, it ranks 43 among 143
countries, while China is positioned above in the rank 29 and India below in 76.
Ø T h e g a p i n A r g e n t i n a ’ s performance is largest in the innovation Input Sub Index in the Institutions factor.
Education as a human aspect of innovation: Argentina is the 2nd top performer within middle income countries (after China) for the human education factors related to innovation.
Source: “The Global Innovation Index 2014. The Human Factor in Innovation”
By Beatriz Nofal Eco-Axis
EDUCATION DRIVER OF INNOVATION: GLOBAL INNOVATION INDEX 2014, CORNELL UNIVERSITY, INSEAD, WIPO
l Click to edit Master subtitle style
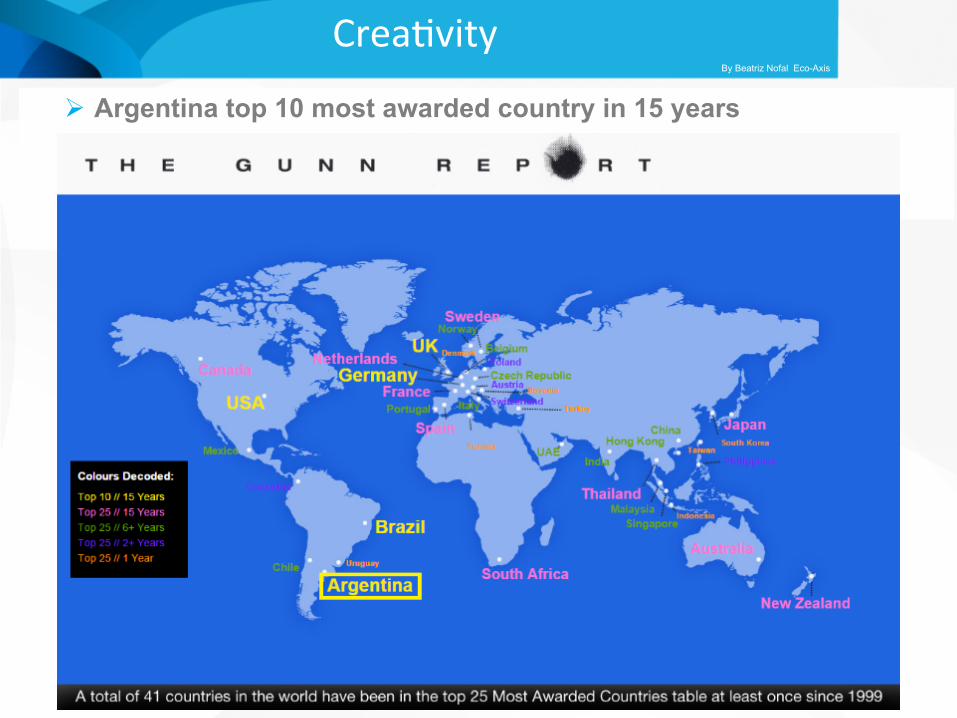
Crea)vity
Ø Argentina top 10 most awarded country in 15 years By Beatriz Nofal Eco-Axis
l Click to edit Master subtitle style
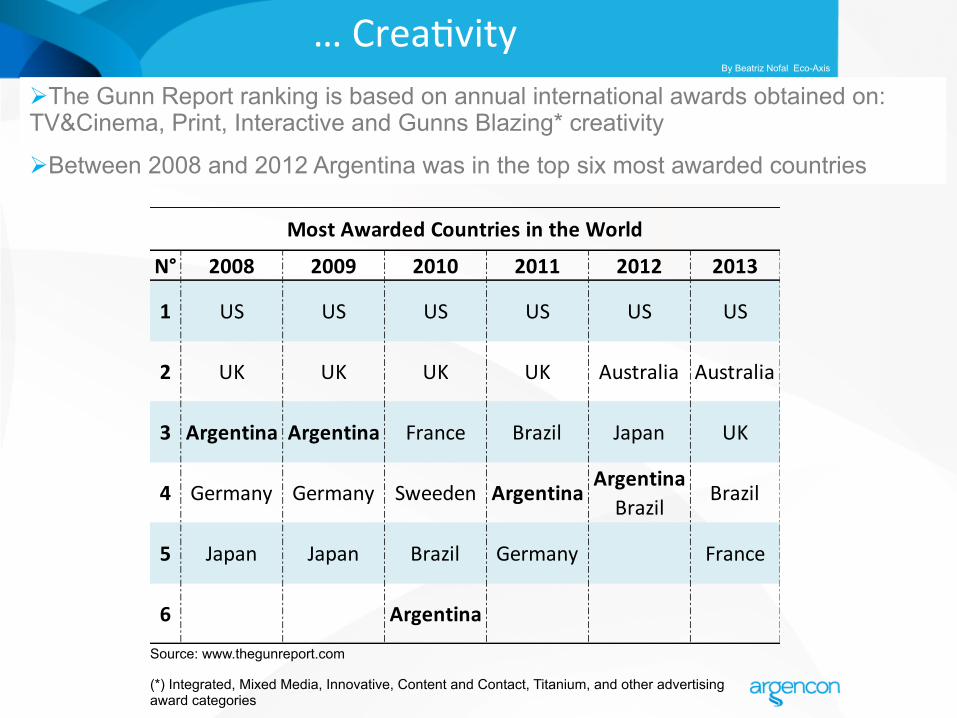
… Crea)vity
Source: www.thegunreport.com (*) Integrated, Mixed Media, Innovative, Content and Contact, Titanium, and other advertising award categories
N° 2008 2009 2010 2011 2012 2013
1 US US US US US US
2 UK UK UK UK Australia Australia
3 Argentina Argentina France Brazil Japan UK
4 Germany Germany Sweeden ArgentinaArgentina Brazil
Brazil
5 Japan Japan Brazil Germany France
6 Argentina
Most Awarded Countries in the World
Ø The Gunn Report ranking is based on annual international awards obtained on: TV&Cinema, Print, Interactive and Gunns Blazing* creativity
Ø Between 2008 and 2012 Argentina was in the top six most awarded countries
By Beatriz Nofal Eco-Axis
l Click to edit Master subtitle style
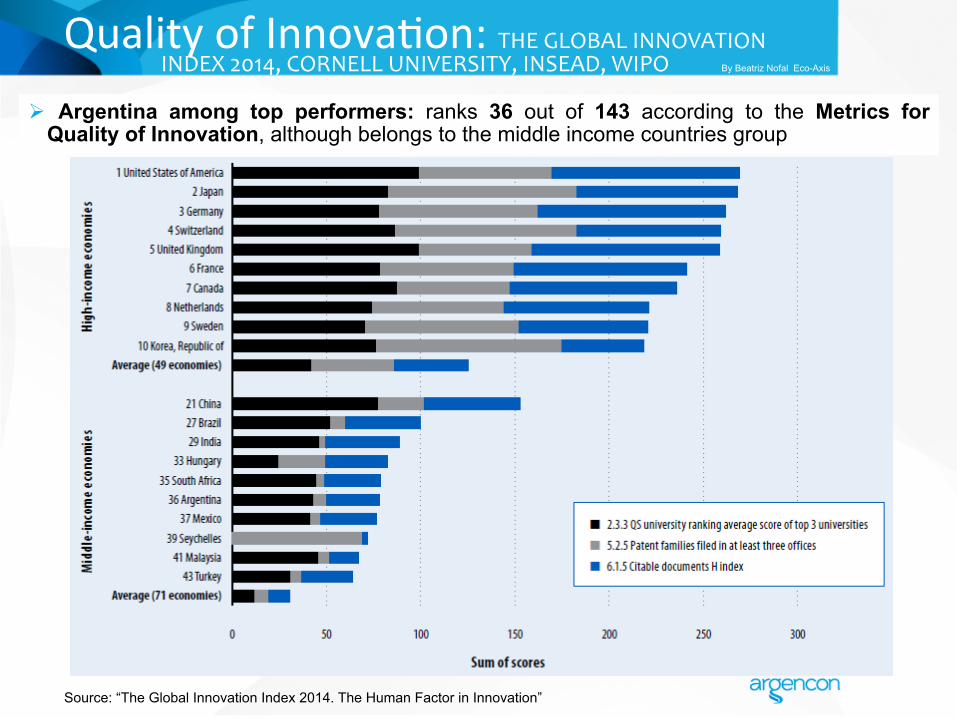
Quality of Innova)on: THE GLOBAL INNOVATION
INDEX 2014, CORNELL UNIVERSITY, INSEAD, WIPO
Source: “The Global Innovation Index 2014. The Human Factor in Innovation”
Ø Argentina among top performers: ranks 36 out of 143 according to the Metrics for Quality of Innovation, although belongs to the middle income countries group
By Beatriz Nofal Eco-Axis
l Click to edit Master subtitle style
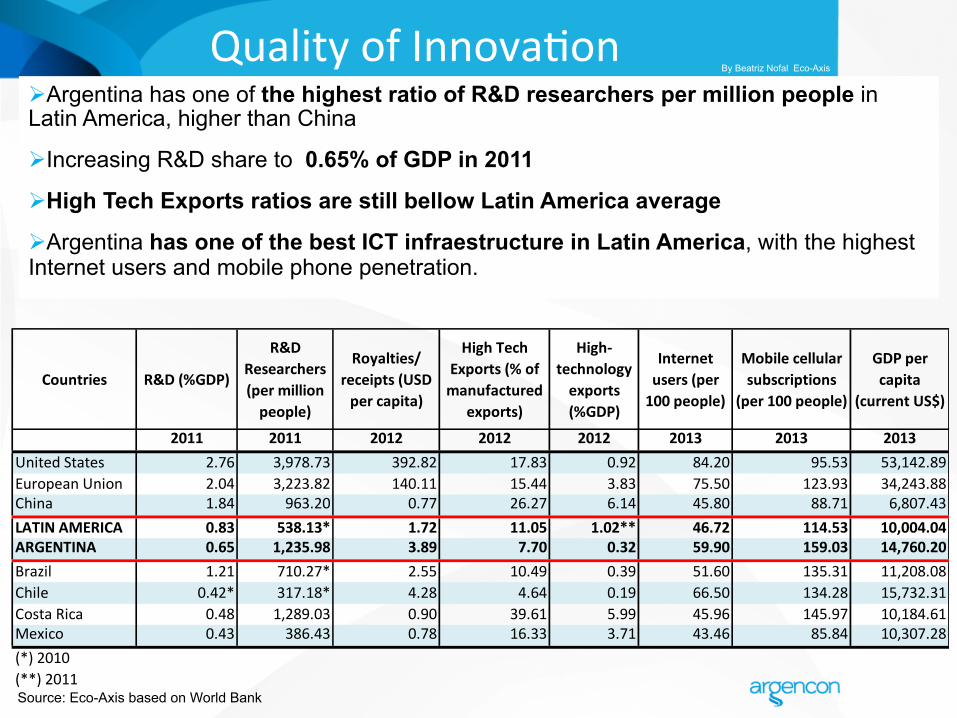
Quality of Innova)on
Source: Eco-Axis based on World Bank
Countries R&D (%GDP)
R&D Researchers (per million people)
Royalties/ receipts (USD per capita)
High Tech Exports (% of manufactured
exports)
High-‐technology exports (%GDP)
Internet users (per 100 people)
Mobile cellular subscriptions
(per 100 people)
GDP per capita
(current US$)
2011 2011 2012 2012 2012 2013 2013 2013United States 2.76 3,978.73 392.82 17.83 0.92 84.20 95.53 53,142.89European Union 2.04 3,223.82 140.11 15.44 3.83 75.50 123.93 34,243.88China 1.84 963.20 0.77 26.27 6.14 45.80 88.71 6,807.43LATIN AMERICA 0.83 538.13* 1.72 11.05 1.02** 46.72 114.53 10,004.04ARGENTINA 0.65 1,235.98 3.89 7.70 0.32 59.90 159.03 14,760.20Brazil 1.21 710.27* 2.55 10.49 0.39 51.60 135.31 11,208.08Chile 0.42* 317.18* 4.28 4.64 0.19 66.50 134.28 15,732.31Costa Rica 0.48 1,289.03 0.90 39.61 5.99 45.96 145.97 10,184.61Mexico 0.43 386.43 0.78 16.33 3.71 43.46 85.84 10,307.28(*) 2010(**) 2011
Ø Argentina has one of the highest ratio of R&D researchers per million people in Latin America, higher than China
Ø Increasing R&D share to 0.65% of GDP in 2011
Ø High Tech Exports ratios are still bellow Latin America average
Ø Argentina has one of the best ICT infraestructure in Latin America, with the highest Internet users and mobile phone penetration.
By Beatriz Nofal Eco-Axis
l Click to edit Master subtitle style
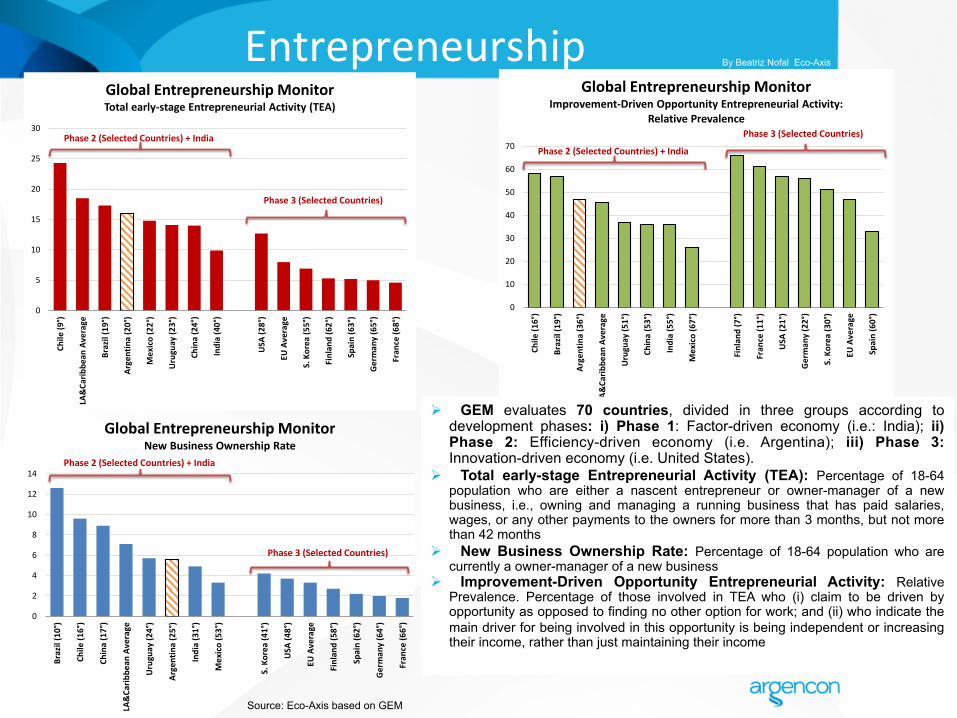
Entrepreneurship
Source: Eco-Axis based on GEM
0
2
4
6
8
10
12
14
Brazil (10°)
Chile (1
6°)
China (17°)
LA&Ca
ribbe
an Average
Uruguay (2
4°)
Argentina (25°)
India (31°)
Mexico (53°)
S. Korea (4
1°)
USA
(48°)
EU Average
Finlan
d (58°)
Spain (62°)
Germ
any (64°)
Fran
ce (6
6°)
Global Entrepreneurship MonitorNew Business Ownership Rate
Phase 2 (Selected Countries) + India
Phase 3 (Selected Countries)
0
5
10
15
20
25
30
Chile (9
°)
LA&Ca
ribbe
an Average
Brazil (19°)
Argentina (20°)
Mexico (22°)
Uruguay (2
3°)
China (24°)
India (40°)
USA
(28°)
EU Average
S. Korea (5
5°)
Finlan
d (62°)
Spain (63°)
Germ
any (65°)
Fran
ce (6
8°)
Global Entrepreneurship MonitorTotal early-‐stage Entrepreneurial Activity (TEA)
Phase 2 (Selected Countries) + India
Phase 3 (Selected Countries)
0
10
20
30
40
50
60
70
Chile (1
6°)
Brazil (19°)
Argentina (36°)
LA&Ca
ribbe
an Average
Uruguay (5
1°)
China (53°)
India (55°)
Mexico (67°)
Finlan
d (7°)
Fran
ce (1
1°)
USA
(21°)
Germ
any (22°)
S. Korea (3
0°)
EU Average
Spain (60°)
Global Entrepreneurship MonitorImprovement-‐Driven Opportunity Entrepreneurial Activity:
Relative PrevalencePhase 3 (Selected Countries)
Phase 2 (Selected Countries) + India
Ø GEM evaluates 70 countries, divided in three groups according to development phases: i) Phase 1: Factor-driven economy (i.e.: India); ii) Phase 2: Efficiency-driven economy (i.e. Argentina); iii) Phase 3: Innovation-driven economy (i.e. United States).
Ø Total early-stage Entrepreneurial Activity (TEA): Percentage of 18-64 population who are either a nascent entrepreneur or owner-manager of a new business, i.e., owning and managing a running business that has paid salaries, wages, or any other payments to the owners for more than 3 months, but not more than 42 months
Ø New Business Ownership Rate: Percentage of 18-64 population who are currently a owner-manager of a new business
Ø Improvement-Driven Opportunity Entrepreneurial Activity: Relative Prevalence. Percentage of those involved in TEA who (i) claim to be driven by opportunity as opposed to finding no other option for work; and (ii) who indicate the main driver for being involved in this opportunity is being independent or increasing their income, rather than just maintaining their income
By Beatriz Nofal Eco-Axis
l Click to edit Master subtitle style
By Beatriz Nofal Eco-Axis
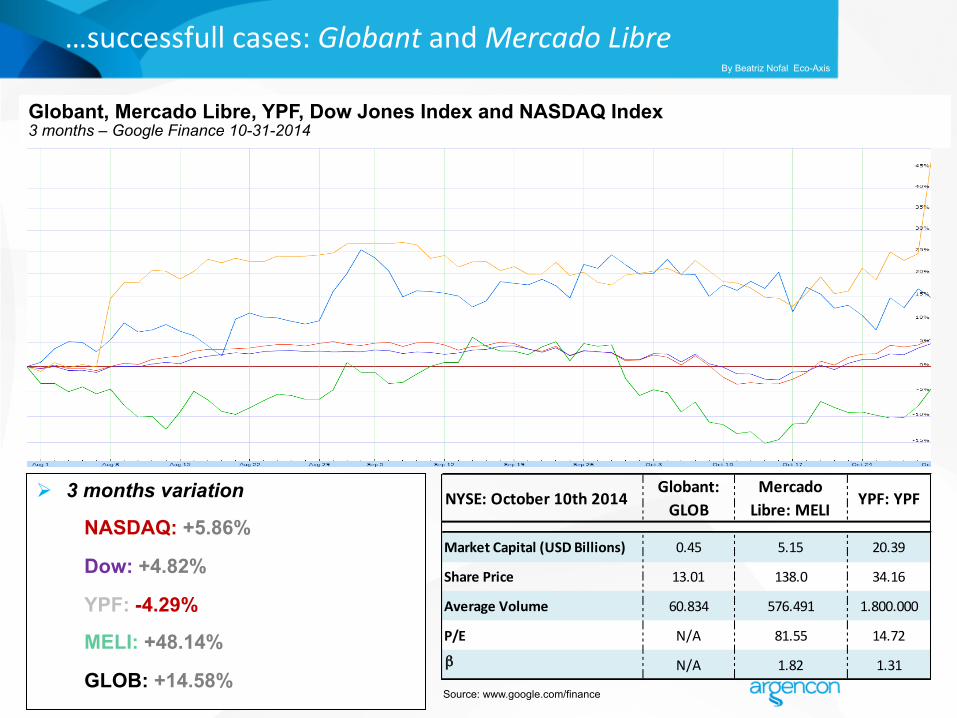
Ø 3 months variation
NASDAQ: +5.86%
Dow: +4.82%
YPF: -4.29%
MELI: +48.14%
GLOB: +14.58% Source: www.google.com/finance
Globant, Mercado Libre, YPF, Dow Jones Index and NASDAQ Index 3 months – Google Finance 10-31-2014
NYSE: October 10th 2014Globant: GLOB
Mercado Libre: MELI
YPF: YPF
Market Capital (USD Billions) 0.45 5.15 20.39
Share Price 13.01 138.0 34.16
Average Volume 60.834 576.491 1.800.000
P/E N/A 81.55 14.72
β N/A 1.82 1.31
…successfull cases: Globant and Mercado Libre
l Click to edit Master subtitle style
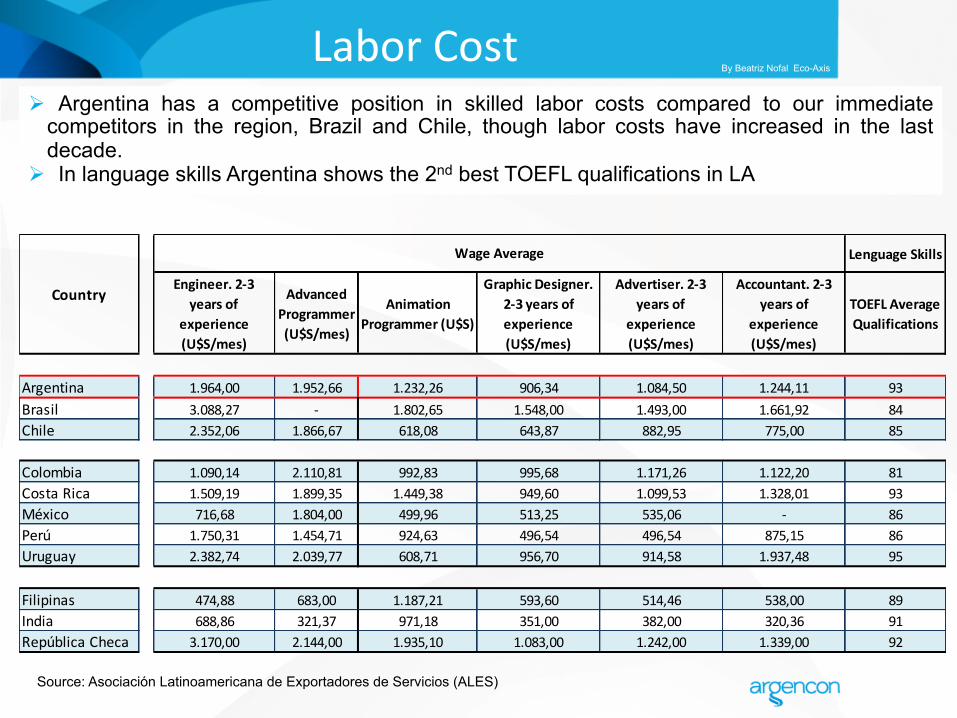
Labor Cost
Ø Argentina has a competitive position in skilled labor costs compared to our immediate competitors in the region, Brazil and Chile, though labor costs have increased in the last decade.
Ø In language skills Argentina shows the 2nd best TOEFL qualifications in LA
Source: Asociación Latinoamericana de Exportadores de Servicios (ALES)
Lenguage Skills
Engineer. 2-‐3 years of
experience (U$S/mes)
Advanced Programmer (U$S/mes)
Animation Programmer (U$S)
Graphic Designer. 2-‐3 years of experience (U$S/mes)
Advertiser. 2-‐3 years of
experience (U$S/mes)
Accountant. 2-‐3 years of
experience (U$S/mes)
TOEFL Average Qualifications
Argentina 1.964,00 1.952,66 1.232,26 906,34 1.084,50 1.244,11 93Brasil 3.088,27 -‐ 1.802,65 1.548,00 1.493,00 1.661,92 84Chile 2.352,06 1.866,67 618,08 643,87 882,95 775,00 85
Colombia 1.090,14 2.110,81 992,83 995,68 1.171,26 1.122,20 81Costa Rica 1.509,19 1.899,35 1.449,38 949,60 1.099,53 1.328,01 93México 716,68 1.804,00 499,96 513,25 535,06 -‐ 86Perú 1.750,31 1.454,71 924,63 496,54 496,54 875,15 86Uruguay 2.382,74 2.039,77 608,71 956,70 914,58 1.937,48 95
Filipinas 474,88 683,00 1.187,21 593,60 514,46 538,00 89India 688,86 321,37 971,18 351,00 382,00 320,36 91República Checa 3.170,00 2.144,00 1.935,10 1.083,00 1.242,00 1.339,00 92
Wage Average
Country
By Beatriz Nofal Eco-Axis
l Click to edit Master subtitle style
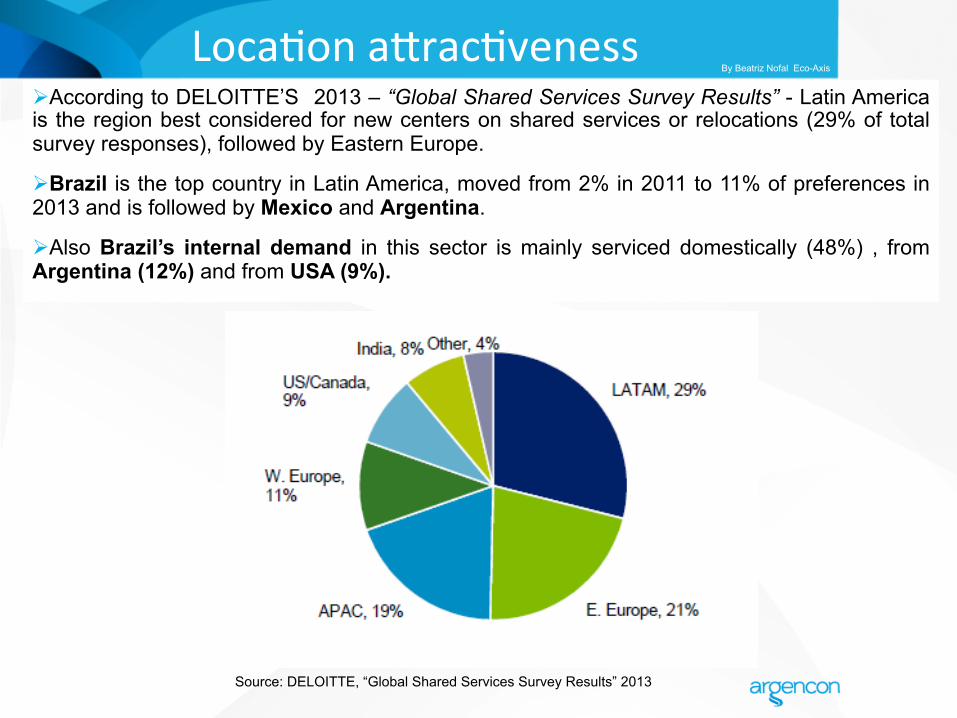
Loca)on a`rac)veness
Ø According to DELOITTE’S 2013 – “Global Shared Services Survey Results” - Latin America is the region best considered for new centers on shared services or relocations (29% of total survey responses), followed by Eastern Europe.
Ø Brazil is the top country in Latin America, moved from 2% in 2011 to 11% of preferences in 2013 and is followed by Mexico and Argentina.
Ø Also Brazil’s internal demand in this sector is mainly serviced domestically (48%) , from Argentina (12%) and from USA (9%).
Source: DELOITTE, “Global Shared Services Survey Results” 2013
By Beatriz Nofal Eco-Axis
l Click to edit Master subtitle style
Looking Forward
Ø Revival of demand in US and Europe is driving global KIS export growth
Ø Argentina can be established as a regional/global hub and innovation
Ø The sector is helping transform Argentina into a diversified knowledge based economy and is putting the country in the global map.
Ø Argencon’s projections show that exports can grow 100 % to 125% in the next 5/10 years, and increase 10,000 million dollars of additional exports .
Ø This would add and estimate of 150,000 new direct jobs in the sector.
Ø Projections are based on the asssumptions of: sustained world demand, the existing talent pool, and an estimated growth rate of one third of the last ten years average,
Ø Higher rates of export growth can be obtained by increases in productivity (US$/per employee) focusing on value creation and innovation
Ø The main challenge in the short to medium term is aligning the strategies, policies and actions of the main stakeholders (the private sector, the national and local governments) with this vision
Ø The main challenge in the long term is the sustainability of talent.
By Beatriz Nofal Eco-Axis
l Click to edit Master subtitle style
Looking Forward
In what follows we will learn from successful cases: from corporate innovation, to innovative
entrepreneurs and talent stories .
They speak about successful and inspiring trajectories beyond the borders
They also showcase an optimistic outlook of Argentina’s global service delivery capabilities
and prospects
Thank You!
By Beatriz Nofal Eco-Axis

l Click to edit Master subtitle style