Embed Size (px)
Citation preview
GT423 Lesedi
Contact details: Technical enquiries to the MFMA Helpline at: [email protected] Data submission enquiries: Elsabé Rossouw National Treasury Tel: (012) 315-5534 Electronic documents: [email protected] Queries on formats: [email protected]
Version 2.4
Click for Instructions!
2020
MTREF Range:
MTREF Linked:
MTREF:
Fin Year:
Name Votes & Sub-Votes
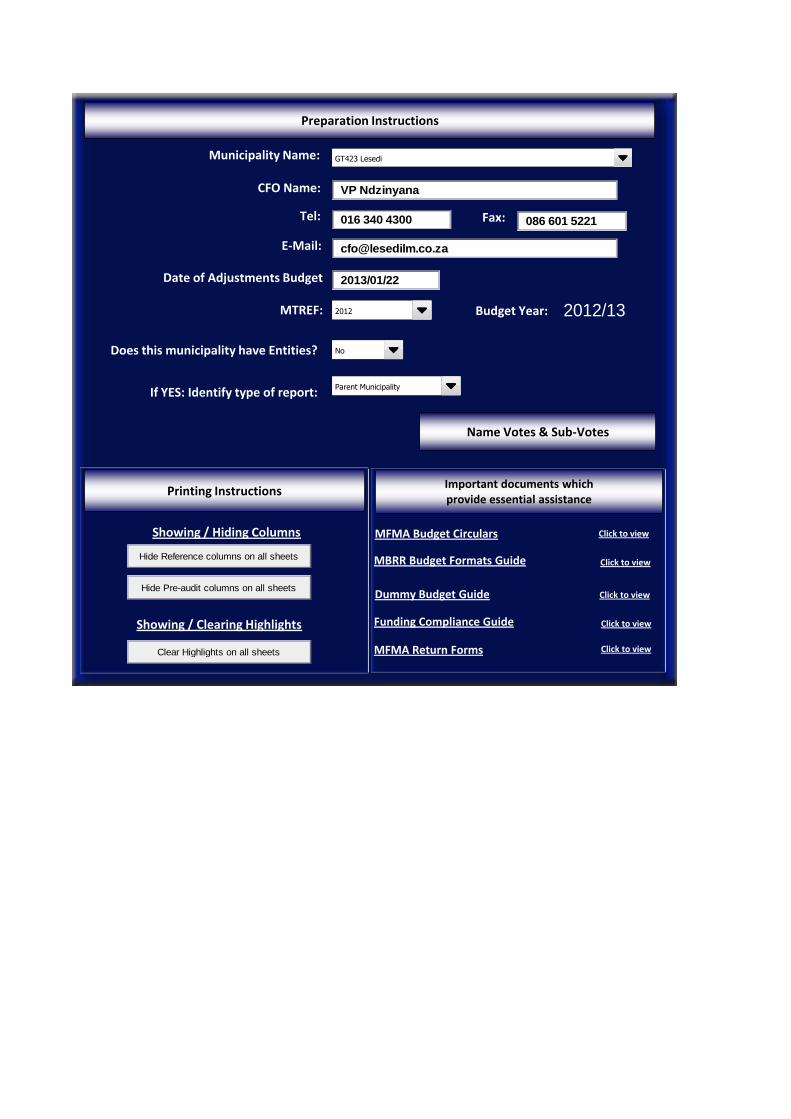
Preparation Instructions
Municipality Name:
MTREF: Budget Year:
Does this municipality have Entities?
If YES: Identify type of report:
CFO Name:
Tel:
E-Mail:
Fax:
Showing / Hiding Columns
Showing / Clearing Highlights
Date of Adjustments Budget
Printing Instructions Important documents which provide essential assistance
MFMA Budget Circulars
MBRR Budget Formats Guide
Dummy Budget Guide
Funding Compliance Guide
MFMA Return Forms
Click to view
Click to view
Click to view
Click to view
Click to view
No
Parent Municipality
2012 2012/13
VP Ndzinyana
016 340 4300
086 601 5221
Hide Reference columns on all sheets
Hide Pre-audit columns on all sheets
Clear Highlights on all sheets
2013/01/22
GT423 Lesedi

Organisational Structure Votes Organisational Structure Sub-Votes Display Sub-VotesVote 1 - Municipal Governance and Administration Vote 1 Municipal Governance and Administration MGAA
Vote 2 - Community and Public Safety 1.1 Executive and Council - Mayor and Council 1.1 - Executive and Council - Mayor and Council EAC-MA
Vote 3 - Economic and Enviromental Services 1.2 Executive and Council - Municipal Manager 1.2 - Executive and Council - Municipal Manager EAC-MM
Vote 4 - Trading Services 1.3 Budget and Treasury Offices 1.3 - Budget and Treasury Offices BATO
Vote 5 - Balance Sheet 1.4 Corportate Services - Human Resources 1.4 - Corportate Services - Human Resources CS-HR
Vote 6 - 1.5 Corporate Services - Information Technology 1.5 - Corporate Services - Information Technology CS-IT
Vote 7 - 1.6 Corporate Services - Property Services 1.6 - Corporate Services - Property Services CS-PS
Vote 8 - 1.7 Corporate Services - Other Services 1.7 - Corporate Services - Other Services CS-OS
Vote 9 -
Vote 10 -
Vote 11 -
Vote 12 - Vote 2 Community and Public Safety CAPS
Vote 13 - 2.1 Arts and Culture/Museums 2.1 - Arts and Culture/Museums AAC
Vote 14 - 2.2 Cemeteries 2.2 - Cemeteries CEMETE
Vote 15 - 2.3 Community and Social Services 2.3 - Community and Social Services CASS
2.4 Sports and Recreation 2.4 - Sports and Recreation SAR
2.5 Public Safety - Police 2.5 - Public Safety - Police PS-P
2.6 Public Safety - Fire 2.6 - Public Safety - Fire PS-F
2.7 Housing 2.7 - Housing HOUSIN
2.8 Health - Clinics (Consolidated) 2.8 - Health - Clinics (Consolidated) H-CC
2.9 Health - Other 2.9 - Health - Other H-o
Vote 3 Economic and Enviromental Services EAES
3.1 Planning and Development - IDP,Local Areas Plannin 3.1 - Planning and Development - IDP,Local Areas Plannin PAD-IA
3.2 Planning and Development - LED 3.2 - Planning and Development - LED PAD-L
3.3 Road Transport 3.3 - Road Transport RT
3.4 Enviromental Protection - Parks 3.4 - Enviromental Protection - Parks EP-P
3.5 Enviromental Protection - Cleansing 3.5 - Enviromental Protection - Cleansing EP-C
Vote 4 Trading Services TS
4.1 Electricity 4.1 - Electricity ELECTR
4.2 Water Distribution 4.2 - Water Distribution WD
4.3 Waste Water Management - Sewerage 4.3 - Waste Water Management - Sewerage WWM-S
4.4 Waste Water Management - Nightsoil 4.4 - Waste Water Management - Nightsoil WWM-N
4.5 Waste Management - Solid 4.5 - Waste Management - Solid WM-S
Vote 5 Balance Sheet BS
Complete Votes & Sub-Votes Organisational Structure Votes Select Org. Structure
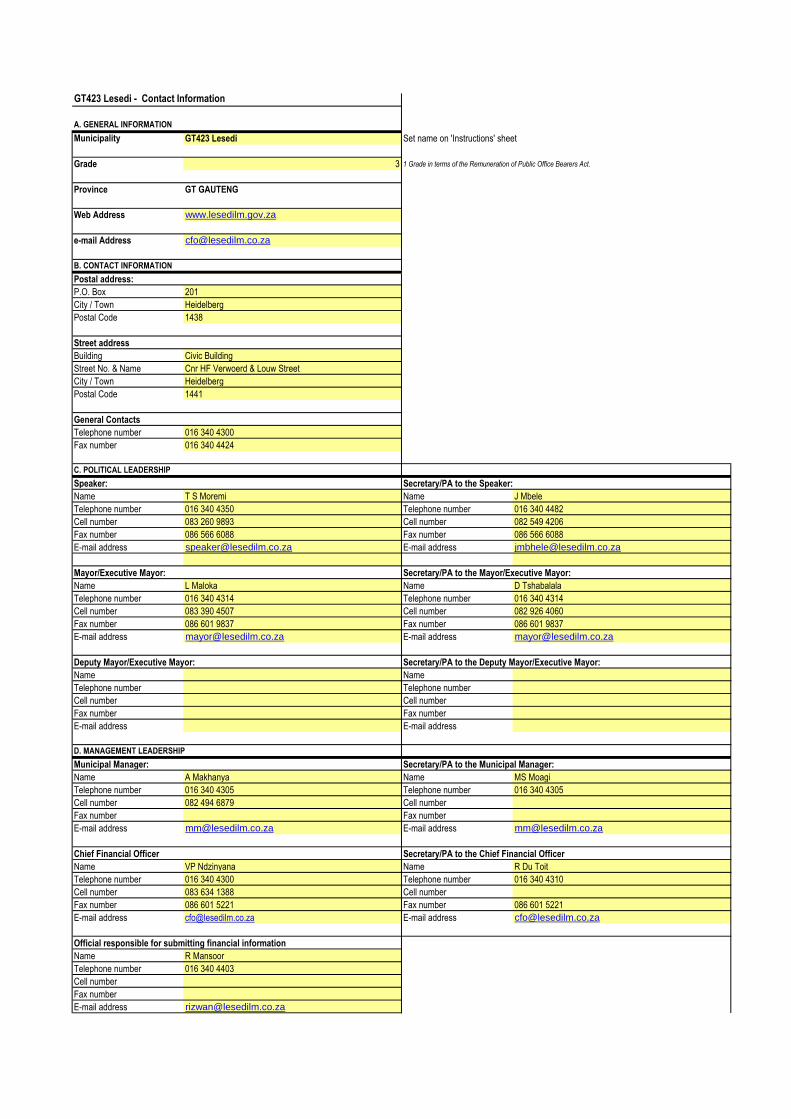
GT423 Lesedi - Contact Information
A. GENERAL INFORMATION
Municipality GT423 Lesedi Set name on 'Instructions' sheet
Grade 3 1 Grade in terms of the Remuneration of Public Office Bearers Act.
Province GT GAUTENG
Web Address www.lesedilm.gov.za
e-mail Address [email protected]
Postal address:
P.O. Box 201
City / Town Heidelberg
Postal Code 1438
Street address
Building Civic Building
Street No. & Name Cnr HF Verwoerd & Louw Street
City / Town Heidelberg
Postal Code 1441
General Contacts
Telephone number 016 340 4300
Fax number 016 340 4424
Speaker:
Name T S Moremi Name J Mbele
Telephone number 016 340 4350 Telephone number 016 340 4482
Cell number 083 260 9893 Cell number 082 549 4206
Fax number 086 566 6088 Fax number 086 566 6088
E-mail address [email protected] E-mail address [email protected]
Name L Maloka Name D Tshabalala
Telephone number 016 340 4314 Telephone number 016 340 4314
Cell number 083 390 4507 Cell number 082 926 4060
Fax number 086 601 9837 Fax number 086 601 9837
E-mail address [email protected] E-mail address [email protected]
Name Name
Telephone number Telephone number
Cell number Cell number
Fax number Fax number
E-mail address E-mail address
Municipal Manager:
Name A Makhanya Name MS Moagi
Telephone number 016 340 4305 Telephone number 016 340 4305
Cell number 082 494 6879 Cell number
Fax number Fax number
E-mail address [email protected] E-mail address [email protected]
Chief Financial Officer
Name VP Ndzinyana Name R Du Toit
Telephone number 016 340 4300 Telephone number 016 340 4310
Cell number 083 634 1388 Cell number
Fax number 086 601 5221 Fax number 086 601 5221
E-mail address [email protected] E-mail address [email protected]
Name R Mansoor
Telephone number 016 340 4403
Cell number
Fax number
E-mail address [email protected]
Secretary/PA to the Municipal Manager:
Secretary/PA to the Chief Financial Officer
Official responsible for submitting financial information
Secretary/PA to the Speaker:
Mayor/Executive Mayor: Secretary/PA to the Mayor/Executive Mayor:
Deputy Mayor/Executive Mayor: Secretary/PA to the Deputy Mayor/Executive Mayor:
D. MANAGEMENT LEADERSHIP
B. CONTACT INFORMATION
C. POLITICAL LEADERSHIP
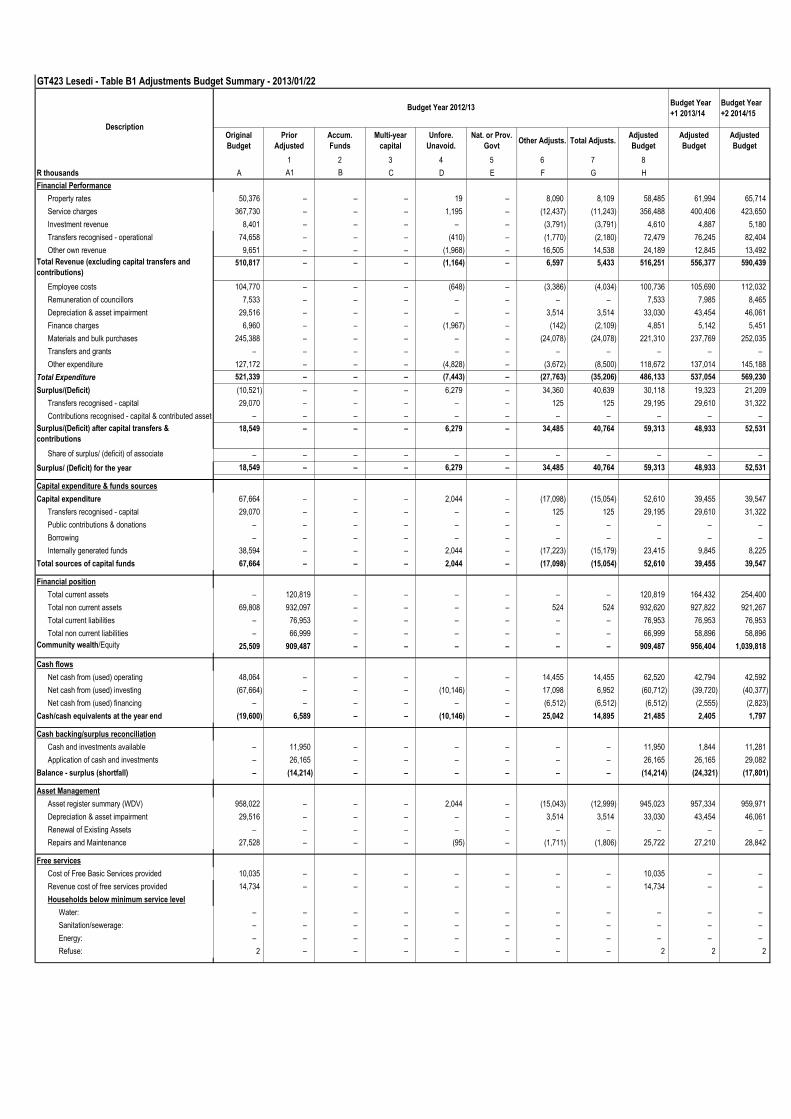
GT423 Lesedi - Table B1 Adjustments Budget Summary - 2013/01/22
Budget Year
+1 2013/14
Budget Year
+2 2014/15
Original
Budget
Prior
Adjusted
Accum.
Funds
Multi-year
capital
Unfore.
Unavoid.
Nat. or Prov.
GovtOther Adjusts. Total Adjusts.
Adjusted
Budget
Adjusted
Budget
Adjusted
Budget
1 2 3 4 5 6 7 8
R thousands A A1 B C D E F G H
Financial Performance
Property rates 50,376 – – – 19 – 8,090 8,109 58,485 61,994 65,714
Service charges 367,730 – – – 1,195 – (12,437) (11,243) 356,488 400,406 423,650
Investment revenue 8,401 – – – – – (3,791) (3,791) 4,610 4,887 5,180
Transfers recognised - operational 74,658 – – – (410) – (1,770) (2,180) 72,479 76,245 82,404
Other own revenue 9,651 – – – (1,968) – 16,505 14,538 24,189 12,845 13,492
Total Revenue (excluding capital transfers and
contributions)510,817 – – – (1,164) – 6,597 5,433 516,251 556,377 590,439
Employee costs 104,770 – – – (648) – (3,386) (4,034) 100,736 105,690 112,032
Remuneration of councillors 7,533 – – – – – – – 7,533 7,985 8,465
Depreciation & asset impairment 29,516 – – – – – 3,514 3,514 33,030 43,454 46,061
Finance charges 6,960 – – – (1,967) – (142) (2,109) 4,851 5,142 5,451
Materials and bulk purchases 245,388 – – – – – (24,078) (24,078) 221,310 237,769 252,035
Transfers and grants – – – – – – – – – – –
Other expenditure 127,172 – – – (4,828) – (3,672) (8,500) 118,672 137,014 145,188
Total Expenditure 521,339 – – – (7,443) – (27,763) (35,206) 486,133 537,054 569,230
Surplus/(Deficit) (10,521) – – – 6,279 – 34,360 40,639 30,118 19,323 21,209
Transfers recognised - capital 29,070 – – – – – 125 125 29,195 29,610 31,322
Contributions recognised - capital & contributed assets – – – – – – – – – – –
Surplus/(Deficit) after capital transfers &
contributions
18,549 – – – 6,279 – 34,485 40,764 59,313 48,933 52,531
Share of surplus/ (deficit) of associate – – – – – – – – – – –
Surplus/ (Deficit) for the year 18,549 – – – 6,279 – 34,485 40,764 59,313 48,933 52,531
Capital expenditure & funds sources
Capital expenditure 67,664 – – – 2,044 – (17,098) (15,054) 52,610 39,455 39,547
Transfers recognised - capital 29,070 – – – – – 125 125 29,195 29,610 31,322
Public contributions & donations – – – – – – – – – – –
Borrowing – – – – – – – – – – –
Internally generated funds 38,594 – – – 2,044 – (17,223) (15,179) 23,415 9,845 8,225
Total sources of capital funds 67,664 – – – 2,044 – (17,098) (15,054) 52,610 39,455 39,547
Financial position
Total current assets – 120,819 – – – – – – 120,819 164,432 254,400
Total non current assets 69,808 932,097 – – – – 524 524 932,620 927,822 921,267
Total current liabilities – 76,953 – – – – – – 76,953 76,953 76,953
Total non current liabilities – 66,999 – – – – – – 66,999 58,896 58,896
Community wealth/Equity 25,509 909,487 – – – – – – 909,487 956,404 1,039,818
Cash flows
Net cash from (used) operating 48,064 – – – – – 14,455 14,455 62,520 42,794 42,592
Net cash from (used) investing (67,664) – – – (10,146) – 17,098 6,952 (60,712) (39,720) (40,377)
Net cash from (used) financing – – – – – – (6,512) (6,512) (6,512) (2,555) (2,823)
Cash/cash equivalents at the year end (19,600) 6,589 – – (10,146) – 25,042 14,895 21,485 2,405 1,797
Cash backing/surplus reconciliation
Cash and investments available – 11,950 – – – – – – 11,950 1,844 11,281
Application of cash and investments – 26,165 – – – – – – 26,165 26,165 29,082
Balance - surplus (shortfall) – (14,214) – – – – – – (14,214) (24,321) (17,801)
Asset Management
Asset register summary (WDV) 958,022 – – – 2,044 – (15,043) (12,999) 945,023 957,334 959,971
Depreciation & asset impairment 29,516 – – – – – 3,514 3,514 33,030 43,454 46,061
Renewal of Existing Assets – – – – – – – – – – –
Repairs and Maintenance 27,528 – – – (95) – (1,711) (1,806) 25,722 27,210 28,842
Free services
Cost of Free Basic Services provided 10,035 – – – – – – – 10,035 – –
Revenue cost of free services provided 14,734 – – – – – – – 14,734 – –
Households below minimum service level
Water: – – – – – – – – – – –
Sanitation/sewerage: – – – – – – – – – – –
Energy: – – – – – – – – – – –
Refuse: 2 – – – – – – – 2 2 2
Budget Year 2012/13
Description
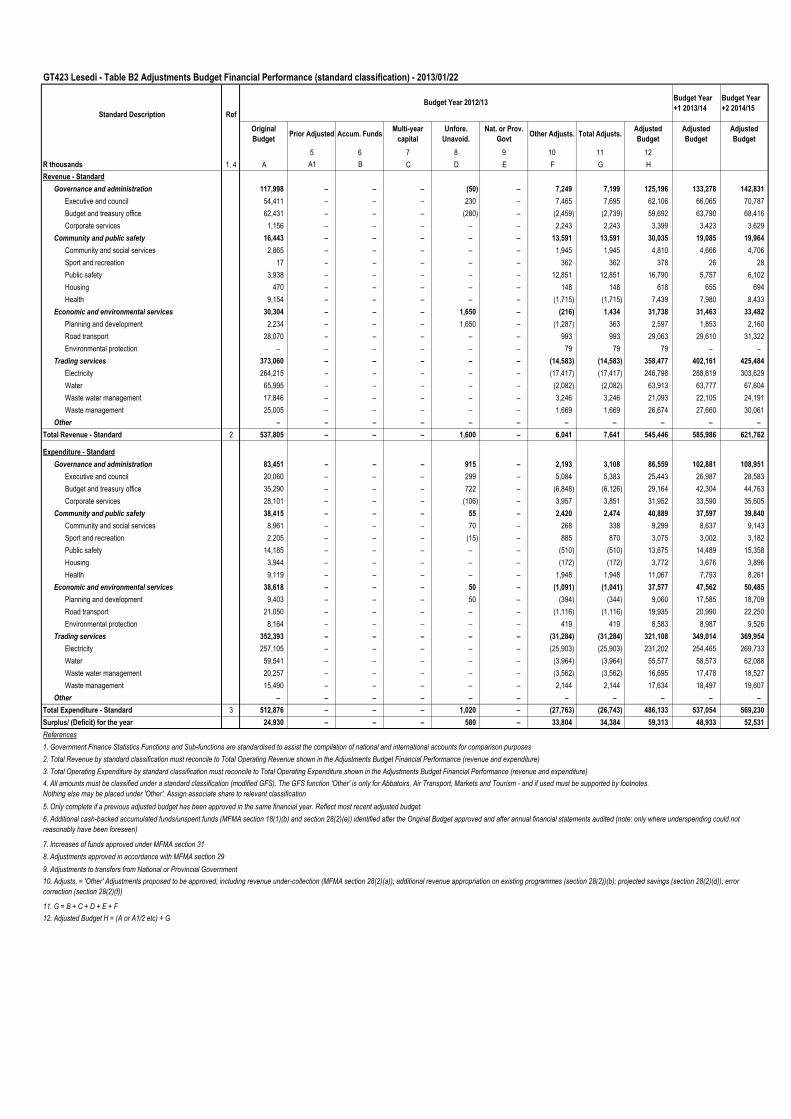
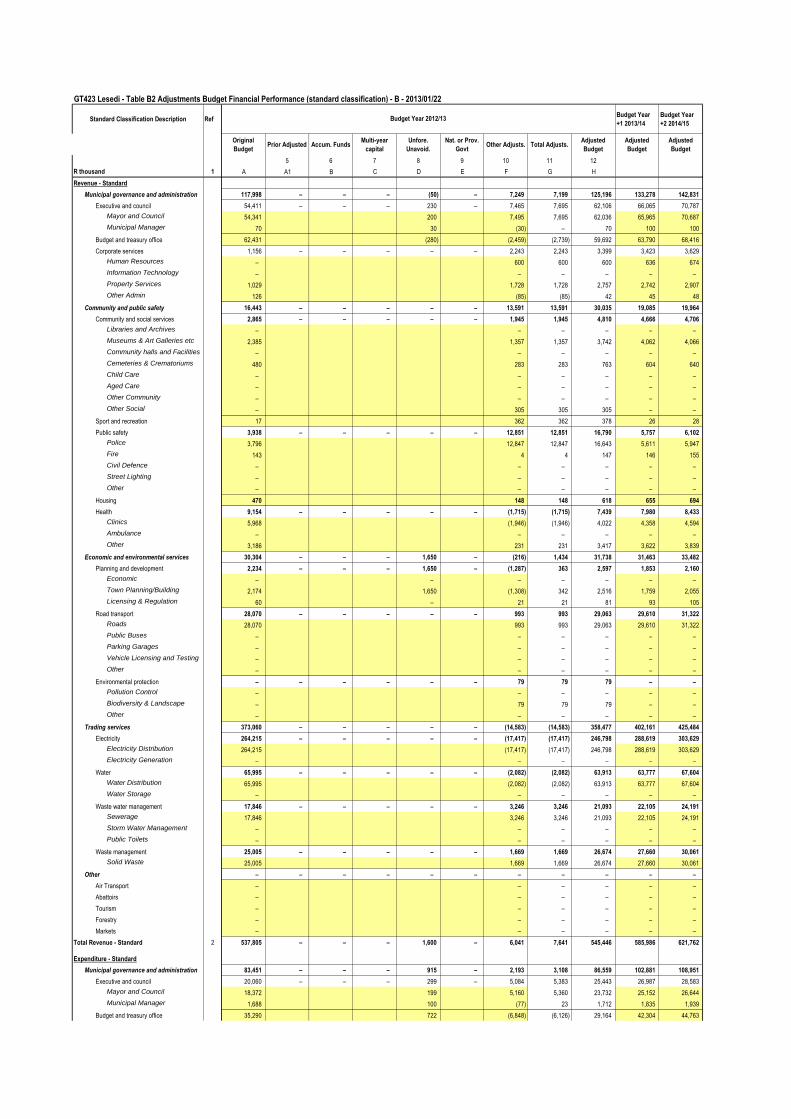
GT423 Lesedi - Table B2 Adjustments Budget Financial Performance (standard classification) - 2013/01/22
Budget Year
+1 2013/14
Budget Year
+2 2014/15
Original
BudgetPrior Adjusted Accum. Funds
Multi-year
capital
Unfore.
Unavoid.
Nat. or Prov.
GovtOther Adjusts. Total Adjusts.
Adjusted
Budget
Adjusted
Budget
Adjusted
Budget
5 6 7 8 9 10 11 12
R thousands 1, 4 A A1 B C D E F G H
Revenue - Standard
Governance and administration 117,998 – – – (50) – 7,249 7,199 125,196 133,278 142,831
Executive and council 54,411 – – – 230 – 7,465 7,695 62,106 66,065 70,787
Budget and treasury office 62,431 – – – (280) – (2,459) (2,739) 59,692 63,790 68,416
Corporate services 1,156 – – – – – 2,243 2,243 3,399 3,423 3,629
Community and public safety 16,443 – – – – – 13,591 13,591 30,035 19,085 19,964
Community and social services 2,865 – – – – – 1,945 1,945 4,810 4,666 4,706
Sport and recreation 17 – – – – – 362 362 378 26 28
Public safety 3,938 – – – – – 12,851 12,851 16,790 5,757 6,102
Housing 470 – – – – – 148 148 618 655 694
Health 9,154 – – – – – (1,715) (1,715) 7,439 7,980 8,433
Economic and environmental services 30,304 – – – 1,650 – (216) 1,434 31,738 31,463 33,482
Planning and development 2,234 – – – 1,650 – (1,287) 363 2,597 1,853 2,160
Road transport 28,070 – – – – – 993 993 29,063 29,610 31,322
Environmental protection – – – – – – 79 79 79 – –
Trading services 373,060 – – – – – (14,583) (14,583) 358,477 402,161 425,484
Electricity 264,215 – – – – – (17,417) (17,417) 246,798 288,619 303,629
Water 65,995 – – – – – (2,082) (2,082) 63,913 63,777 67,604
Waste water management 17,846 – – – – – 3,246 3,246 21,093 22,105 24,191
Waste management 25,005 – – – – – 1,669 1,669 26,674 27,660 30,061
Other – – – – – – – – – – –
Total Revenue - Standard 2 537,805 – – – 1,600 – 6,041 7,641 545,446 585,986 621,762
Expenditure - Standard
Governance and administration 83,451 – – – 915 – 2,193 3,108 86,559 102,881 108,951
Executive and council 20,060 – – – 299 – 5,084 5,383 25,443 26,987 28,583
Budget and treasury office 35,290 – – – 722 – (6,848) (6,126) 29,164 42,304 44,763
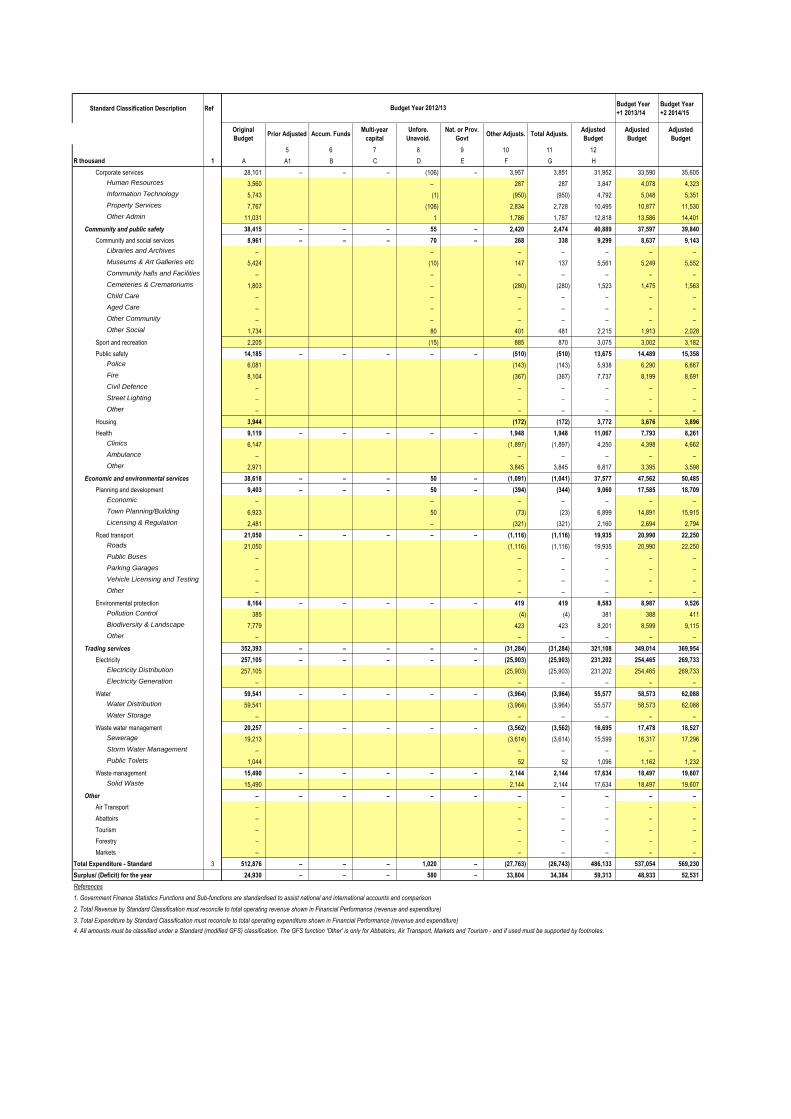
Corporate services 28,101 – – – (106) – 3,957 3,851 31,952 33,590 35,605
Community and public safety 38,415 – – – 55 – 2,420 2,474 40,889 37,597 39,840
Community and social services 8,961 – – – 70 – 268 338 9,299 8,637 9,143
Sport and recreation 2,205 – – – (15) – 885 870 3,075 3,002 3,182
Public safety 14,185 – – – – – (510) (510) 13,675 14,489 15,358
Housing 3,944 – – – – – (172) (172) 3,772 3,676 3,896
Health 9,119 – – – – – 1,948 1,948 11,067 7,793 8,261
Economic and environmental services 38,618 – – – 50 – (1,091) (1,041) 37,577 47,562 50,485
Planning and development 9,403 – – – 50 – (394) (344) 9,060 17,585 18,709
Road transport 21,050 – – – – – (1,116) (1,116) 19,935 20,990 22,250
Environmental protection 8,164 – – – – – 419 419 8,583 8,987 9,526
Trading services 352,393 – – – – – (31,284) (31,284) 321,108 349,014 369,954
Electricity 257,105 – – – – – (25,903) (25,903) 231,202 254,465 269,733
Water 59,541 – – – – – (3,964) (3,964) 55,577 58,573 62,088
Waste water management 20,257 – – – – – (3,562) (3,562) 16,695 17,478 18,527
Waste management 15,490 – – – – – 2,144 2,144 17,634 18,497 19,607
Other – – – – – – – – – – –
Total Expenditure - Standard 3 512,876 – – – 1,020 – (27,763) (26,743) 486,133 537,054 569,230
Surplus/ (Deficit) for the year 24,930 – – – 580 – 33,804 34,384 59,313 48,933 52,531
References
1. Government Finance Statistics Functions and Sub-functions are standardised to assist the compilation of national and international accounts for comparison purposes
2. Total Revenue by standard classification must reconcile to Total Operating Revenue shown in the Adjustments Budget Financial Performance (revenue and expenditure)
9. Adjustments to transfers from National or Provincial Government
11. G = B + C + D + E + F
5. Only complete if a previous adjusted budget has been approved in the same financial year. Reflect most recent adjusted budget.
6. Additional cash-backed accumulated funds/unspent funds (MFMA section 18(1)(b) and section 28(2)(e)) identified after the Original Budget approved and after annual financial statements audited (note: only where underspending could not
reasonably have been foreseen)
3. Total Operating Expenditure by standard classification must reconcile to Total Operating Expenditure shown in the Adjustments Budget Financial Performance (revenue and expenditure)
Budget Year 2012/13
4. All amounts must be classified under a standard classification (modified GFS). The GFS function 'Other' is only for Abbatoirs, Air Transport, Markets and Tourism - and if used must be supported by footnotes.
Nothing else may be placed under 'Other'. Assign associate share to relevant classification
12. Adjusted Budget H = (A or A1/2 etc) + G
7. Increases of funds approved under MFMA section 31
8. Adjustments approved in accordance with MFMA section 29
10. Adjusts. = 'Other' Adjustments proposed to be approved; including revenue under-collection (MFMA section 28(2)(a)); additional revenue appropriation on existing programmes (section 28(2))(b); projected savings (section 28(2)(d)); error
correction (section 28(2)(f))
Standard Description Ref
GT423 Lesedi - Table B2 Adjustments Budget Financial Performance (standard classification) - B - 2013/01/22
Standard Classification Description RefBudget Year
+1 2013/14
Budget Year
+2 2014/15
Original
BudgetPrior Adjusted Accum. Funds
Multi-year
capital
Unfore.
Unavoid.
Nat. or Prov.
GovtOther Adjusts. Total Adjusts.
Adjusted
Budget
Adjusted
Budget
Adjusted
Budget
5 6 7 8 9 10 11 12
R thousand 1 A A1 B C D E F G H
Revenue - Standard
Municipal governance and administration 117,998 – – – (50) – 7,249 7,199 125,196 133,278 142,831
Executive and council 54,411 – – – 230 – 7,465 7,695 62,106 66,065 70,787
Mayor and Council 54,341 200 7,495 7,695 62,036 65,965 70,687
Municipal Manager 70 30 (30) – 70 100 100
Budget and treasury office 62,431 (280) (2,459) (2,739) 59,692 63,790 68,416
Corporate services 1,156 – – – – – 2,243 2,243 3,399 3,423 3,629
Human Resources – 600 600 600 636 674
Information Technology – – – – – –
Property Services 1,029 1,728 1,728 2,757 2,742 2,907
Other Admin 126 (85) (85) 42 45 48
Community and public safety 16,443 – – – – – 13,591 13,591 30,035 19,085 19,964
Community and social services 2,865 – – – – – 1,945 1,945 4,810 4,666 4,706
Libraries and Archives – – – – – –
Museums & Art Galleries etc 2,385 1,357 1,357 3,742 4,062 4,066
Community halls and Facilities – – – – – –
Cemeteries & Crematoriums 480 283 283 763 604 640
Child Care – – – – – –
Aged Care – – – – – –
Other Community – – – – – –
Other Social – 305 305 305 – –
Sport and recreation 17 362 362 378 26 28
Public safety 3,938 – – – – – 12,851 12,851 16,790 5,757 6,102
Police 3,796 12,847 12,847 16,643 5,611 5,947
Fire 143 4 4 147 146 155
Civil Defence – – – – – –
Street Lighting – – – – – –
Other – – – – – –
Housing 470 148 148 618 655 694
Health 9,154 – – – – – (1,715) (1,715) 7,439 7,980 8,433
Clinics 5,968 (1,946) (1,946) 4,022 4,358 4,594
Ambulance – – – – – –
Other 3,186 231 231 3,417 3,622 3,839
Economic and environmental services 30,304 – – – 1,650 – (216) 1,434 31,738 31,463 33,482
Planning and development 2,234 – – – 1,650 – (1,287) 363 2,597 1,853 2,160
Economic
Development/Planning – – – – – – –
Town Planning/Building
enforcement 2,174 1,650 (1,308) 342 2,516 1,759 2,055
Licensing & Regulation 60 – 21 21 81 93 105
Road transport 28,070 – – – – – 993 993 29,063 29,610 31,322
Roads 28,070 993 993 29,063 29,610 31,322
Public Buses – – – – – –
Parking Garages – – – – – –
Vehicle Licensing and Testing – – – – – –
Other – – – – – –
Environmental protection – – – – – – 79 79 79 – –
Pollution Control – – – – – –
Biodiversity & Landscape – 79 79 79 – –
Other – – – – – –
Trading services 373,060 – – – – – (14,583) (14,583) 358,477 402,161 425,484
Electricity 264,215 – – – – – (17,417) (17,417) 246,798 288,619 303,629
Electricity Distribution 264,215 (17,417) (17,417) 246,798 288,619 303,629
Electricity Generation – – – – – –
Water 65,995 – – – – – (2,082) (2,082) 63,913 63,777 67,604
Water Distribution 65,995 (2,082) (2,082) 63,913 63,777 67,604
Water Storage – – – – – –
Waste water management 17,846 – – – – – 3,246 3,246 21,093 22,105 24,191
Sewerage 17,846 3,246 3,246 21,093 22,105 24,191
Storm Water Management – – – – – –
Public Toilets – – – – – –
Waste management 25,005 – – – – – 1,669 1,669 26,674 27,660 30,061
Solid Waste 25,005 1,669 1,669 26,674 27,660 30,061
Other – – – – – – – – – – –
Air Transport – – – – – –
Abattoirs – – – – – –
Tourism – – – – – –
Forestry – – – – – –
Markets – – – – – –
Total Revenue - Standard 2 537,805 – – – 1,600 – 6,041 7,641 545,446 585,986 621,762
Expenditure - Standard
Municipal governance and administration 83,451 – – – 915 – 2,193 3,108 86,559 102,881 108,951
Executive and council 20,060 – – – 299 – 5,084 5,383 25,443 26,987 28,583
Mayor and Council 18,372 199 5,160 5,360 23,732 25,152 26,644
Municipal Manager 1,688 100 (77) 23 1,712 1,835 1,939
Budget and treasury office 35,290 722 (6,848) (6,126) 29,164 42,304 44,763
Budget Year 2012/13
Standard Classification Description RefBudget Year
+1 2013/14
Budget Year
+2 2014/15
Original
BudgetPrior Adjusted Accum. Funds
Multi-year
capital
Unfore.
Unavoid.
Nat. or Prov.
GovtOther Adjusts. Total Adjusts.
Adjusted
Budget
Adjusted
Budget
Adjusted
Budget
5 6 7 8 9 10 11 12
R thousand 1 A A1 B C D E F G H
Budget Year 2012/13
Corporate services 28,101 – – – (106) – 3,957 3,851 31,952 33,590 35,605
Human Resources 3,560 – 287 287 3,847 4,078 4,323
Information Technology 5,743 (1) (950) (950) 4,792 5,048 5,351
Property Services 7,767 (106) 2,834 2,728 10,495 10,877 11,530
Other Admin 11,031 1 1,786 1,787 12,818 13,586 14,401
Community and public safety 38,415 – – – 55 – 2,420 2,474 40,889 37,597 39,840
Community and social services 8,961 – – – 70 – 268 338 9,299 8,637 9,143
Libraries and Archives – – – – – – –
Museums & Art Galleries etc 5,424 (10) 147 137 5,561 5,249 5,552
Community halls and Facilities – – – – – – –
Cemeteries & Crematoriums 1,803 – (280) (280) 1,523 1,475 1,563
Child Care – – – – – – –
Aged Care – – – – – – –
Other Community – – – – – – –
Other Social 1,734 80 401 481 2,215 1,913 2,028
Sport and recreation 2,205 (15) 885 870 3,075 3,002 3,182
Public safety 14,185 – – – – – (510) (510) 13,675 14,489 15,358
Police 6,081 (143) (143) 5,938 6,290 6,667
Fire 8,104 (367) (367) 7,737 8,199 8,691
Civil Defence – – – – – –
Street Lighting – – – – – –
Other – – – – – –
Housing 3,944 (172) (172) 3,772 3,676 3,896
Health 9,119 – – – – – 1,948 1,948 11,067 7,793 8,261
Clinics 6,147 (1,897) (1,897) 4,250 4,398 4,662
Ambulance – – – – – –
Other 2,971 3,845 3,845 6,817 3,395 3,598
Economic and environmental services 38,618 – – – 50 – (1,091) (1,041) 37,577 47,562 50,485
Planning and development 9,403 – – – 50 – (394) (344) 9,060 17,585 18,709
Economic
Development/Planning – – – – – – –
Town Planning/Building
enforcement 6,923 50 (73) (23) 6,899 14,891 15,915
Licensing & Regulation 2,481 – (321) (321) 2,160 2,694 2,794
Road transport 21,050 – – – – – (1,116) (1,116) 19,935 20,990 22,250
Roads 21,050 (1,116) (1,116) 19,935 20,990 22,250
Public Buses – – – – – –
Parking Garages – – – – – –
Vehicle Licensing and Testing – – – – – –
Other – – – – – –
Environmental protection 8,164 – – – – – 419 419 8,583 8,987 9,526
Pollution Control 385 (4) (4) 381 388 411
Biodiversity & Landscape 7,779 423 423 8,201 8,599 9,115
Other – – – – – –
Trading services 352,393 – – – – – (31,284) (31,284) 321,108 349,014 369,954
Electricity 257,105 – – – – – (25,903) (25,903) 231,202 254,465 269,733
Electricity Distribution 257,105 (25,903) (25,903) 231,202 254,465 269,733
Electricity Generation – – – – – –
Water 59,541 – – – – – (3,964) (3,964) 55,577 58,573 62,088
Water Distribution 59,541 (3,964) (3,964) 55,577 58,573 62,088
Water Storage – – – – – –
Waste water management 20,257 – – – – – (3,562) (3,562) 16,695 17,478 18,527
Sewerage 19,213 (3,614) (3,614) 15,599 16,317 17,296
Storm Water Management – – – – – –
Public Toilets 1,044 52 52 1,096 1,162 1,232
Waste management 15,490 – – – – – 2,144 2,144 17,634 18,497 19,607
Solid Waste 15,490 2,144 2,144 17,634 18,497 19,607
Other – – – – – – – – – – –
Air Transport – – – – – –
Abattoirs – – – – – –
Tourism – – – – – –
Forestry – – – – – –
Markets – – – – – –
Total Expenditure - Standard 3 512,876 – – – 1,020 – (27,763) (26,743) 486,133 537,054 569,230
Surplus/ (Deficit) for the year 24,930 – – – 580 – 33,804 34,384 59,313 48,933 52,531
References
1. Government Finance Statistics Functions and Sub-functions are standardised to assist national and international accounts and comparison
2. Total Revenue by Standard Classification must reconcile to total operating revenue shown in Financial Performance (revenue and expenditure)
3. Total Expenditure by Standard Classification must reconcile to total operating expenditure shown in Financial Performance (revenue and expenditure)
4. All amounts must be classified under a Standard (modified GFS) classification. The GFS function 'Other' is only for Abbatoirs, Air Transport, Markets and Tourism - and if used must be supported by footnotes.
Nothing else may be placed under 'Other'. Assign associate share to relevant classification
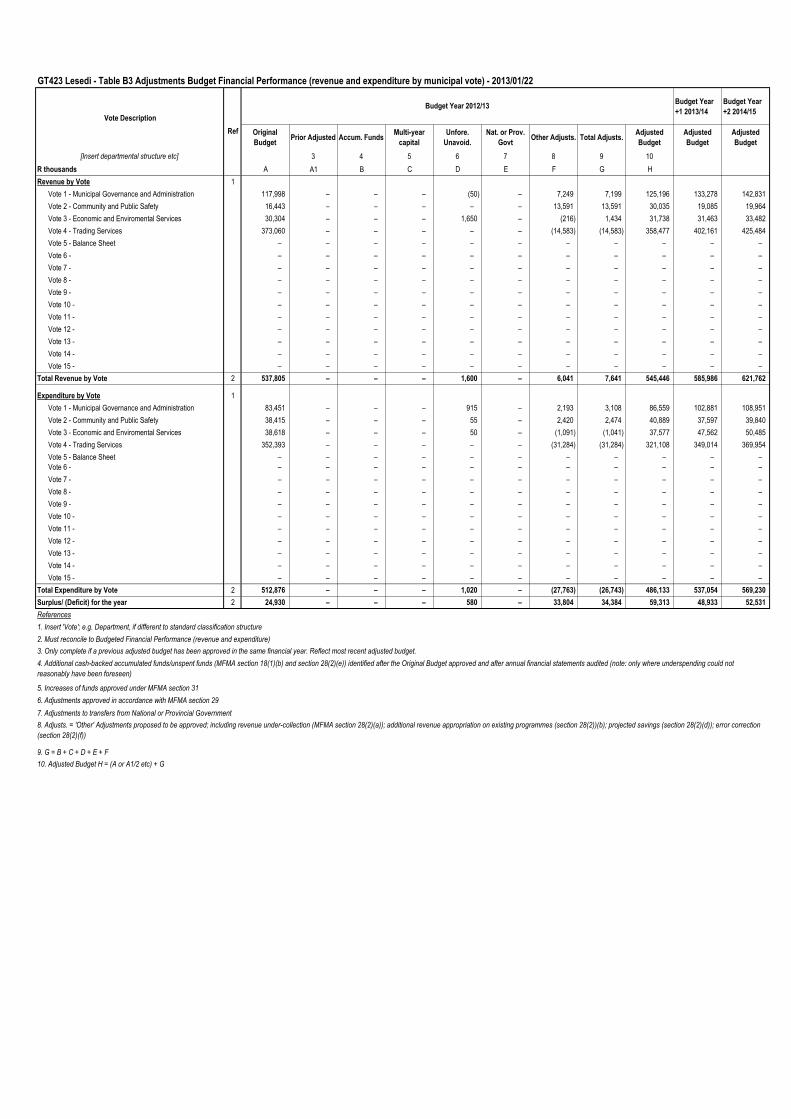
GT423 Lesedi - Table B3 Adjustments Budget Financial Performance (revenue and expenditure by municipal vote) - 2013/01/22
Budget Year
+1 2013/14
Budget Year
+2 2014/15
Original
BudgetPrior Adjusted Accum. Funds
Multi-year
capital
Unfore.
Unavoid.
Nat. or Prov.
GovtOther Adjusts. Total Adjusts.
Adjusted
Budget
Adjusted
Budget
Adjusted
Budget
[Insert departmental structure etc] 3 4 5 6 7 8 9 10
R thousands A A1 B C D E F G H
Revenue by Vote 1
Vote 1 - Municipal Governance and Administration 117,998 – – – (50) – 7,249 7,199 125,196 133,278 142,831
Vote 2 - Community and Public Safety 16,443 – – – – – 13,591 13,591 30,035 19,085 19,964
Vote 3 - Economic and Enviromental Services 30,304 – – – 1,650 – (216) 1,434 31,738 31,463 33,482
Vote 4 - Trading Services 373,060 – – – – – (14,583) (14,583) 358,477 402,161 425,484
Vote 5 - Balance Sheet – – – – – – – – – – –
Vote 6 - – – – – – – – – – – –
Vote 7 - – – – – – – – – – – –
Vote 8 - – – – – – – – – – – –
Vote 9 - – – – – – – – – – – –
Vote 10 - – – – – – – – – – – –
Vote 11 - – – – – – – – – – – –
Vote 12 - – – – – – – – – – – –
Vote 13 - – – – – – – – – – – –
Vote 14 - – – – – – – – – – – –
Vote 15 - – – – – – – – – – – –
Total Revenue by Vote 2 537,805 – – – 1,600 – 6,041 7,641 545,446 585,986 621,762
Expenditure by Vote 1
Vote 1 - Municipal Governance and Administration 83,451 – – – 915 – 2,193 3,108 86,559 102,881 108,951
Vote 2 - Community and Public Safety 38,415 – – – 55 – 2,420 2,474 40,889 37,597 39,840
Vote 3 - Economic and Enviromental Services 38,618 – – – 50 – (1,091) (1,041) 37,577 47,562 50,485
Vote 4 - Trading Services 352,393 – – – – – (31,284) (31,284) 321,108 349,014 369,954
Vote 5 - Balance Sheet – – – – – – – – – – –
Vote 6 - – – – – – – – – – – –
Vote 7 - – – – – – – – – – – –
Vote 8 - – – – – – – – – – – –
Vote 9 - – – – – – – – – – – –
Vote 10 - – – – – – – – – – – –
Vote 11 - – – – – – – – – – – –
Vote 12 - – – – – – – – – – – –
Vote 13 - – – – – – – – – – – –
Vote 14 - – – – – – – – – – – –
Vote 15 - – – – – – – – – – – –
Total Expenditure by Vote 2 512,876 – – – 1,020 – (27,763) (26,743) 486,133 537,054 569,230
Surplus/ (Deficit) for the year 2 24,930 – – – 580 – 33,804 34,384 59,313 48,933 52,531
References
1. Insert 'Vote'; e.g. Department, if different to standard classification structure
2. Must reconcile to Budgeted Financial Performance (revenue and expenditure)
7. Adjustments to transfers from National or Provincial Government
9. G = B + C + D + E + F
10. Adjusted Budget H = (A or A1/2 etc) + G
6. Adjustments approved in accordance with MFMA section 29
8. Adjusts. = 'Other' Adjustments proposed to be approved; including revenue under-collection (MFMA section 28(2)(a)); additional revenue appropriation on existing programmes (section 28(2))(b); projected savings (section 28(2)(d)); error correction
(section 28(2)(f))
Vote Description
Ref
Budget Year 2012/13
3. Only complete if a previous adjusted budget has been approved in the same financial year. Reflect most recent adjusted budget.
4. Additional cash-backed accumulated funds/unspent funds (MFMA section 18(1)(b) and section 28(2)(e)) identified after the Original Budget approved and after annual financial statements audited (note: only where underspending could not
reasonably have been foreseen)
5. Increases of funds approved under MFMA section 31
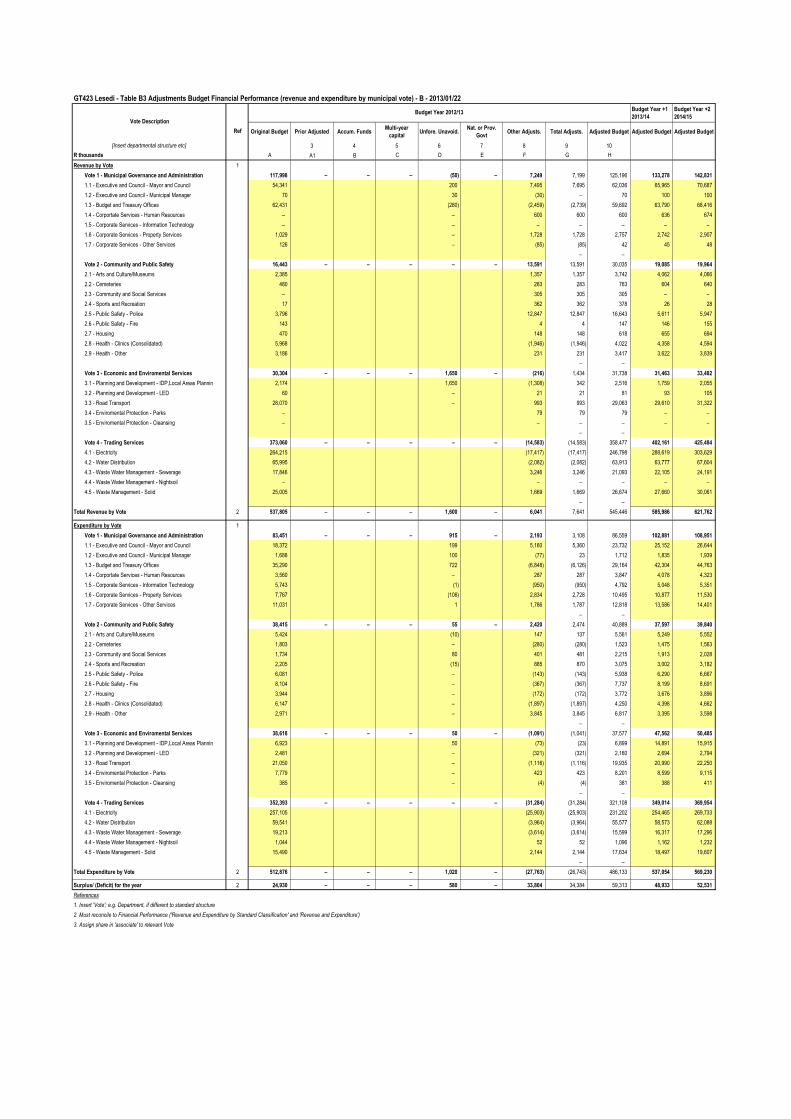
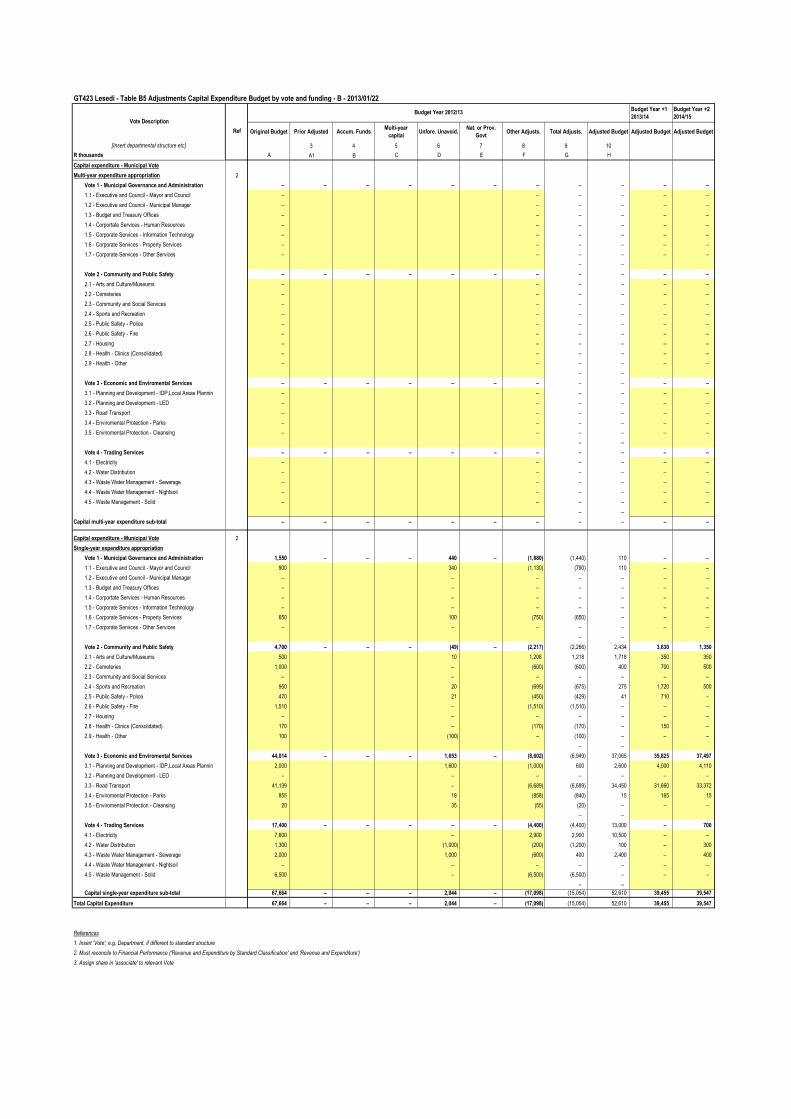
GT423 Lesedi - Table B3 Adjustments Budget Financial Performance (revenue and expenditure by municipal vote) - B - 2013/01/22
Budget Year +1
2013/14
Budget Year +2
2014/15
Original Budget Prior Adjusted Accum. FundsMulti-year
capitalUnfore. Unavoid.
Nat. or Prov.
GovtOther Adjusts. Total Adjusts. Adjusted Budget Adjusted Budget Adjusted Budget
[Insert departmental structure etc] 3 4 5 6 7 8 9 10
R thousands A A1 B C D E F G H
Revenue by Vote 1
Vote 1 - Municipal Governance and Administration 117,998 – – – (50) – 7,249 7,199 125,196 133,278 142,831
1.1 - Executive and Council - Mayor and Council 54,341 200 7,495 7,695 62,036 65,965 70,687
1.2 - Executive and Council - Municipal Manager 70 30 (30) – 70 100 100
1.3 - Budget and Treasury Offices 62,431 (280) (2,459) (2,739) 59,692 63,790 68,416
1.4 - Corportate Services - Human Resources – – 600 600 600 636 674
1.5 - Corporate Services - Information Technology – – – – – – –
1.6 - Corporate Services - Property Services 1,029 – 1,728 1,728 2,757 2,742 2,907
1.7 - Corporate Services - Other Services 126 – (85) (85) 42 45 48
– –
Vote 2 - Community and Public Safety 16,443 – – – – – 13,591 13,591 30,035 19,085 19,964
2.1 - Arts and Culture/Museums 2,385 1,357 1,357 3,742 4,062 4,066
2.2 - Cemeteries 480 283 283 763 604 640
2.3 - Community and Social Services – 305 305 305 – –
2.4 - Sports and Recreation 17 362 362 378 26 28
2.5 - Public Safety - Police 3,796 12,847 12,847 16,643 5,611 5,947
2.6 - Public Safety - Fire 143 4 4 147 146 155
2.7 - Housing 470 148 148 618 655 694
2.8 - Health - Clinics (Consolidated) 5,968 (1,946) (1,946) 4,022 4,358 4,594
2.9 - Health - Other 3,186 231 231 3,417 3,622 3,839
– –
Vote 3 - Economic and Enviromental Services 30,304 – – – 1,650 – (216) 1,434 31,738 31,463 33,482
3.1 - Planning and Development - IDP,Local Areas Plannin 2,174 1,650 (1,308) 342 2,516 1,759 2,055
3.2 - Planning and Development - LED 60 – 21 21 81 93 105
3.3 - Road Transport 28,070 – 993 993 29,063 29,610 31,322
3.4 - Enviromental Protection - Parks – 79 79 79 – –
3.5 - Enviromental Protection - Cleansing – – – – – –
– –
Vote 4 - Trading Services 373,060 – – – – – (14,583) (14,583) 358,477 402,161 425,484
4.1 - Electricity 264,215 (17,417) (17,417) 246,798 288,619 303,629
4.2 - Water Distribution 65,995 (2,082) (2,082) 63,913 63,777 67,604
4.3 - Waste Water Management - Sewerage 17,846 3,246 3,246 21,093 22,105 24,191
4.4 - Waste Water Management - Nightsoil – – – – – –
4.5 - Waste Management - Solid 25,005 1,669 1,669 26,674 27,660 30,061
– –
Total Revenue by Vote 2 537,805 – – – 1,600 – 6,041 7,641 545,446 585,986 621,762
Expenditure by Vote 1
Vote 1 - Municipal Governance and Administration 83,451 – – – 915 – 2,193 3,108 86,559 102,881 108,951
1.1 - Executive and Council - Mayor and Council 18,372 199 5,160 5,360 23,732 25,152 26,644
1.2 - Executive and Council - Municipal Manager 1,688 100 (77) 23 1,712 1,835 1,939
1.3 - Budget and Treasury Offices 35,290 722 (6,848) (6,126) 29,164 42,304 44,763
1.4 - Corportate Services - Human Resources 3,560 – 287 287 3,847 4,078 4,323
1.5 - Corporate Services - Information Technology 5,743 (1) (950) (950) 4,792 5,048 5,351
1.6 - Corporate Services - Property Services 7,767 (106) 2,834 2,728 10,495 10,877 11,530
1.7 - Corporate Services - Other Services 11,031 1 1,786 1,787 12,818 13,586 14,401
– –
Vote 2 - Community and Public Safety 38,415 – – – 55 – 2,420 2,474 40,889 37,597 39,840
2.1 - Arts and Culture/Museums 5,424 (10) 147 137 5,561 5,249 5,552
2.2 - Cemeteries 1,803 – (280) (280) 1,523 1,475 1,563
2.3 - Community and Social Services 1,734 80 401 481 2,215 1,913 2,028
2.4 - Sports and Recreation 2,205 (15) 885 870 3,075 3,002 3,182
2.5 - Public Safety - Police 6,081 – (143) (143) 5,938 6,290 6,667
2.6 - Public Safety - Fire 8,104 – (367) (367) 7,737 8,199 8,691
2.7 - Housing 3,944 – (172) (172) 3,772 3,676 3,896
2.8 - Health - Clinics (Consolidated) 6,147 – (1,897) (1,897) 4,250 4,398 4,662
2.9 - Health - Other 2,971 – 3,845 3,845 6,817 3,395 3,598
– –
Vote 3 - Economic and Enviromental Services 38,618 – – – 50 – (1,091) (1,041) 37,577 47,562 50,485
3.1 - Planning and Development - IDP,Local Areas Plannin 6,923 50 (73) (23) 6,899 14,891 15,915
3.2 - Planning and Development - LED 2,481 – (321) (321) 2,160 2,694 2,794
3.3 - Road Transport 21,050 – (1,116) (1,116) 19,935 20,990 22,250
3.4 - Enviromental Protection - Parks 7,779 – 423 423 8,201 8,599 9,115
3.5 - Enviromental Protection - Cleansing 385 – (4) (4) 381 388 411
– –
Vote 4 - Trading Services 352,393 – – – – – (31,284) (31,284) 321,108 349,014 369,954
4.1 - Electricity 257,105 (25,903) (25,903) 231,202 254,465 269,733
4.2 - Water Distribution 59,541 (3,964) (3,964) 55,577 58,573 62,088
4.3 - Waste Water Management - Sewerage 19,213 (3,614) (3,614) 15,599 16,317 17,296
4.4 - Waste Water Management - Nightsoil 1,044 52 52 1,096 1,162 1,232
4.5 - Waste Management - Solid 15,490 2,144 2,144 17,634 18,497 19,607
– –
Total Expenditure by Vote 2 512,876 – – – 1,020 – (27,763) (26,743) 486,133 537,054 569,230
Surplus/ (Deficit) for the year 2 24,930 – – – 580 – 33,804 34,384 59,313 48,933 52,531
References
1. Insert 'Vote'; e.g. Department, if different to standard structure
2. Must reconcile to Financial Performance ('Revenue and Expenditure by Standard Classification' and 'Revenue and Expenditure')
3. Assign share in 'associate' to relevant Vote
Vote Description
Ref
Budget Year 2012/13
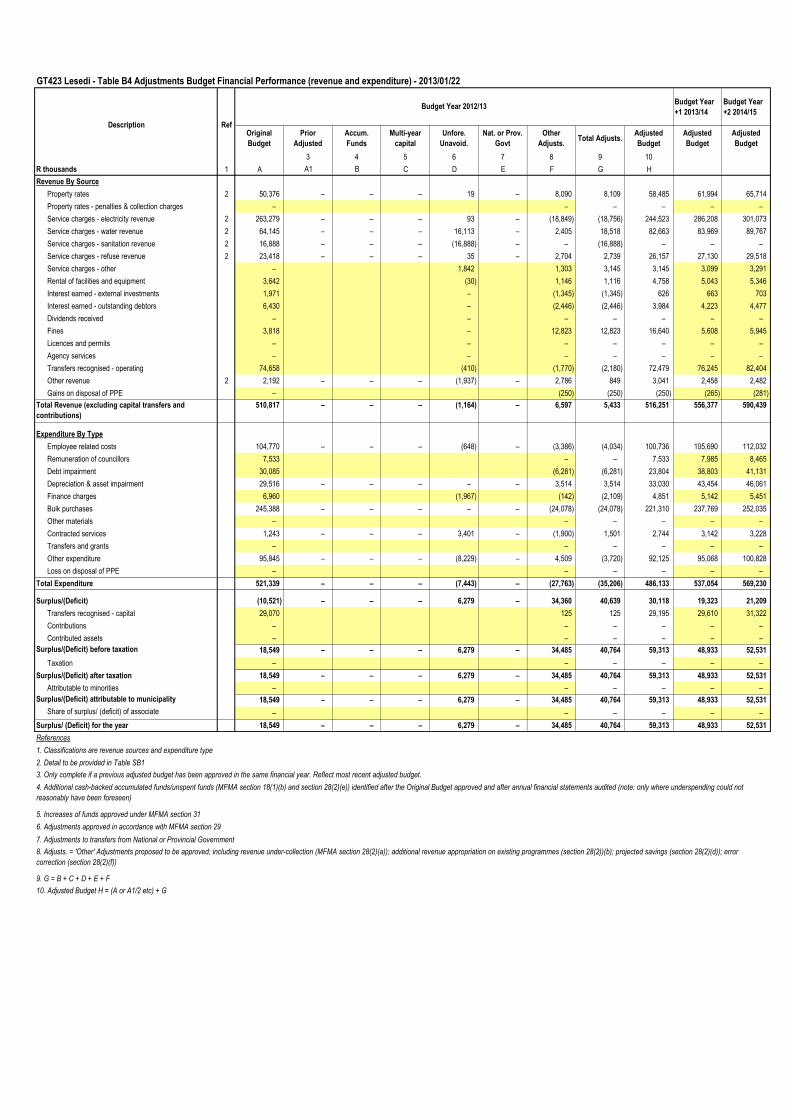
GT423 Lesedi - Table B4 Adjustments Budget Financial Performance (revenue and expenditure) - 2013/01/22
Budget Year
+1 2013/14
Budget Year
+2 2014/15
Original
Budget
Prior
Adjusted
Accum.
Funds
Multi-year
capital
Unfore.
Unavoid.
Nat. or Prov.
Govt
Other
Adjusts.Total Adjusts.
Adjusted
Budget
Adjusted
Budget
Adjusted
Budget
3 4 5 6 7 8 9 10
R thousands 1 A A1 B C D E F G H
Revenue By Source
Property rates 2 50,376 – – – 19 – 8,090 8,109 58,485 61,994 65,714
Property rates - penalties & collection charges – – – – – –
Service charges - electricity revenue 2 263,279 – – – 93 – (18,849) (18,756) 244,523 286,208 301,073
Service charges - water revenue 2 64,145 – – – 16,113 – 2,405 18,518 82,663 83,969 89,767
Service charges - sanitation revenue 2 16,888 – – – (16,888) – – (16,888) – – –
Service charges - refuse revenue 2 23,418 – – – 35 – 2,704 2,739 26,157 27,130 29,518
Service charges - other – 1,842 1,303 3,145 3,145 3,099 3,291
Rental of facilities and equipment 3,642 (30) 1,146 1,116 4,758 5,043 5,346
Interest earned - external investments 1,971 – (1,345) (1,345) 626 663 703
Interest earned - outstanding debtors 6,430 – (2,446) (2,446) 3,984 4,223 4,477
Dividends received – – – – – – –
Fines 3,818 – 12,823 12,823 16,640 5,608 5,945
Licences and permits – – – – – – –
Agency services – – – – – – –
Transfers recognised - operating 74,658 (410) (1,770) (2,180) 72,479 76,245 82,404
Other revenue 2 2,192 – – – (1,937) – 2,786 849 3,041 2,458 2,482
Gains on disposal of PPE – (250) (250) (250) (265) (281)
Total Revenue (excluding capital transfers and
contributions)
510,817 – – – (1,164) – 6,597 5,433 516,251 556,377 590,439
Expenditure By Type
Employee related costs 104,770 – – – (648) – (3,386) (4,034) 100,736 105,690 112,032
Remuneration of councillors 7,533 – – 7,533 7,985 8,465
Debt impairment 30,085 (6,281) (6,281) 23,804 38,803 41,131
Depreciation & asset impairment 29,516 – – – – – 3,514 3,514 33,030 43,454 46,061
Finance charges 6,960 (1,967) (142) (2,109) 4,851 5,142 5,451
Bulk purchases 245,388 – – – – – (24,078) (24,078) 221,310 237,769 252,035
Other materials – – – – – –
Contracted services 1,243 – – – 3,401 – (1,900) 1,501 2,744 3,142 3,228
Transfers and grants – – – – – –
Other expenditure 95,845 – – – (8,229) – 4,509 (3,720) 92,125 95,068 100,828
Loss on disposal of PPE – – – – – –
Total Expenditure 521,339 – – – (7,443) – (27,763) (35,206) 486,133 537,054 569,230
Surplus/(Deficit) (10,521) – – – 6,279 – 34,360 40,639 30,118 19,323 21,209
Transfers recognised - capital 29,070 125 125 29,195 29,610 31,322
Contributions – – – – – –
Contributed assets – – – – – –
Surplus/(Deficit) before taxation 18,549 – – – 6,279 – 34,485 40,764 59,313 48,933 52,531
Taxation – – – – – –
Surplus/(Deficit) after taxation 18,549 – – – 6,279 – 34,485 40,764 59,313 48,933 52,531
Attributable to minorities – – – – – –
Surplus/(Deficit) attributable to municipality 18,549 – – – 6,279 – 34,485 40,764 59,313 48,933 52,531
Share of surplus/ (deficit) of associate – – – – – –
Surplus/ (Deficit) for the year 18,549 – – – 6,279 – 34,485 40,764 59,313 48,933 52,531
References
1. Classifications are revenue sources and expenditure type
2. Detail to be provided in Table SB1
7. Adjustments to transfers from National or Provincial Government
9. G = B + C + D + E + F
Budget Year 2012/13
Ref
10. Adjusted Budget H = (A or A1/2 etc) + G
3. Only complete if a previous adjusted budget has been approved in the same financial year. Reflect most recent adjusted budget.
4. Additional cash-backed accumulated funds/unspent funds (MFMA section 18(1)(b) and section 28(2)(e)) identified after the Original Budget approved and after annual financial statements audited (note: only where underspending could not
reasonably have been foreseen)
5. Increases of funds approved under MFMA section 31
6. Adjustments approved in accordance with MFMA section 29
8. Adjusts. = 'Other' Adjustments proposed to be approved; including revenue under-collection (MFMA section 28(2)(a)); additional revenue appropriation on existing programmes (section 28(2))(b); projected savings (section 28(2)(d)); error
correction (section 28(2)(f))
Description
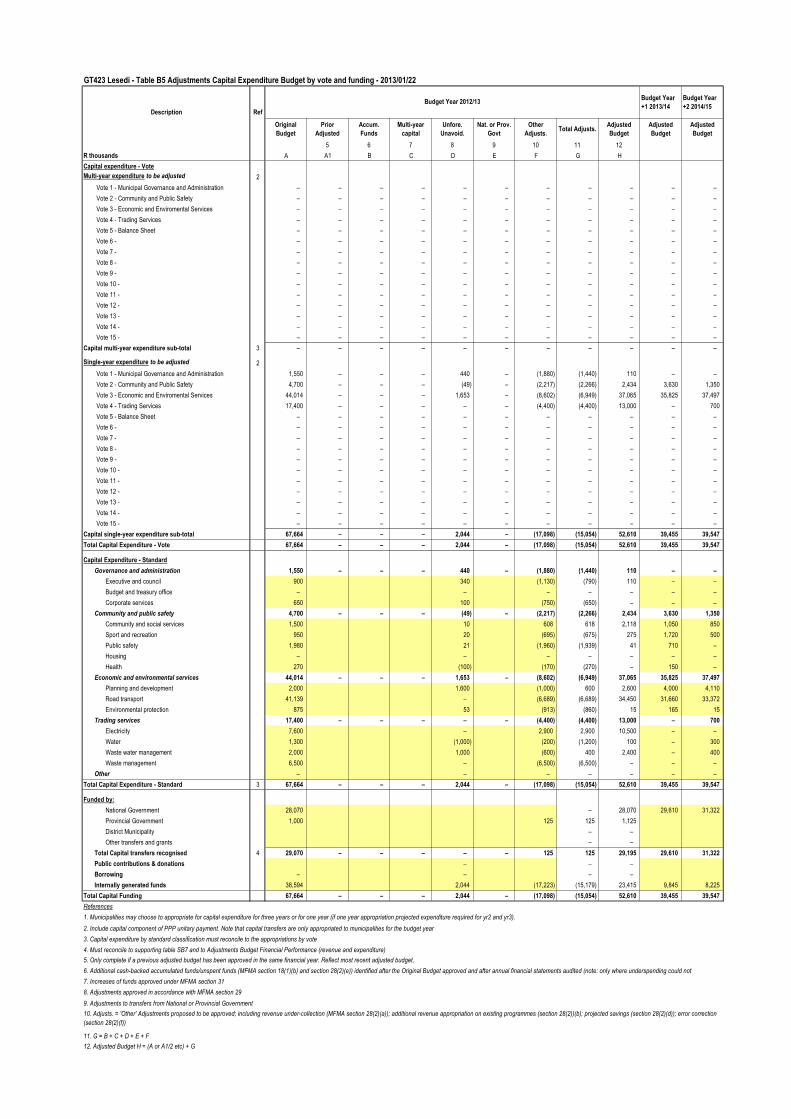
GT423 Lesedi - Table B5 Adjustments Capital Expenditure Budget by vote and funding - 2013/01/22
Budget Year
+1 2013/14
Budget Year
+2 2014/15
Original
Budget
Prior
Adjusted
Accum.
Funds
Multi-year
capital
Unfore.
Unavoid.
Nat. or Prov.
Govt
Other
Adjusts.Total Adjusts.
Adjusted
Budget
Adjusted
Budget
Adjusted
Budget
5 6 7 8 9 10 11 12
R thousands A A1 B C D E F G H
Capital expenditure - Vote
Multi-year expenditure to be adjusted 2
Vote 1 - Municipal Governance and Administration – – – – – – – – – – –
Vote 2 - Community and Public Safety – – – – – – – – – – –
Vote 3 - Economic and Enviromental Services – – – – – – – – – – –
Vote 4 - Trading Services – – – – – – – – – – –
Vote 5 - Balance Sheet – – – – – – – – – – –
Vote 6 - – – – – – – – – – – –
Vote 7 - – – – – – – – – – – –
Vote 8 - – – – – – – – – – – –
Vote 9 - – – – – – – – – – – –
Vote 10 - – – – – – – – – – – –
Vote 11 - – – – – – – – – – – –
Vote 12 - – – – – – – – – – – –
Vote 13 - – – – – – – – – – – –
Vote 14 - – – – – – – – – – – –
Vote 15 - – – – – – – – – – – –
Capital multi-year expenditure sub-total 3 – – – – – – – – – – –
Single-year expenditure to be adjusted 2
Vote 1 - Municipal Governance and Administration 1,550 – – – 440 – (1,880) (1,440) 110 – –
Vote 2 - Community and Public Safety 4,700 – – – (49) – (2,217) (2,266) 2,434 3,630 1,350
Vote 3 - Economic and Enviromental Services 44,014 – – – 1,653 – (8,602) (6,949) 37,065 35,825 37,497
Vote 4 - Trading Services 17,400 – – – – – (4,400) (4,400) 13,000 – 700
Vote 5 - Balance Sheet – – – – – – – – – – –
Vote 6 - – – – – – – – – – – –
Vote 7 - – – – – – – – – – – –
Vote 8 - – – – – – – – – – – –
Vote 9 - – – – – – – – – – – –
Vote 10 - – – – – – – – – – – –
Vote 11 - – – – – – – – – – – –
Vote 12 - – – – – – – – – – – –
Vote 13 - – – – – – – – – – – –
Vote 14 - – – – – – – – – – – –
Vote 15 - – – – – – – – – – – –
Capital single-year expenditure sub-total 67,664 – – – 2,044 – (17,098) (15,054) 52,610 39,455 39,547
Total Capital Expenditure - Vote 67,664 – – – 2,044 – (17,098) (15,054) 52,610 39,455 39,547
Capital Expenditure - Standard
Governance and administration 1,550 – – – 440 – (1,880) (1,440) 110 – –
Executive and council 900 340 (1,130) (790) 110 – –
Budget and treasury office – – – – – – –
Corporate services 650 100 (750) (650) – – –
Community and public safety 4,700 – – – (49) – (2,217) (2,266) 2,434 3,630 1,350
Community and social services 1,500 10 608 618 2,118 1,050 850
Sport and recreation 950 20 (695) (675) 275 1,720 500
Public safety 1,980 21 (1,960) (1,939) 41 710 –
Housing – – – – – – –
Health 270 (100) (170) (270) – 150 –
Economic and environmental services 44,014 – – – 1,653 – (8,602) (6,949) 37,065 35,825 37,497
Planning and development 2,000 1,600 (1,000) 600 2,600 4,000 4,110
Road transport 41,139 – (6,689) (6,689) 34,450 31,660 33,372
Environmental protection 875 53 (913) (860) 15 165 15
Trading services 17,400 – – – – – (4,400) (4,400) 13,000 – 700
Electricity 7,600 – 2,900 2,900 10,500 – –
Water 1,300 (1,000) (200) (1,200) 100 – 300
Waste water management 2,000 1,000 (600) 400 2,400 – 400
Waste management 6,500 – (6,500) (6,500) – – –
Other – – – – – – –
Total Capital Expenditure - Standard 3 67,664 – – – 2,044 – (17,098) (15,054) 52,610 39,455 39,547
Funded by:
National Government 28,070 – 28,070 29,610 31,322
Provincial Government 1,000 125 125 1,125
District Municipality – –
Other transfers and grants – –
Total Capital transfers recognised 4 29,070 – – – – – 125 125 29,195 29,610 31,322
Public contributions & donations – – –
Borrowing – – – –
Internally generated funds 38,594 2,044 (17,223) (15,179) 23,415 9,845 8,225
Total Capital Funding 67,664 – – – 2,044 – (17,098) (15,054) 52,610 39,455 39,547
References
1. Municipalities may choose to appropriate for capital expenditure for three years or for one year (if one year appropriation projected expenditure required for yr2 and yr3).
9. Adjustments to transfers from National or Provincial Government
11. G = B + C + D + E + F
4. Must reconcile to supporting table SB7 and to Adjustments Budget Financial Performance (revenue and expenditure)
5. Only complete if a previous adjusted budget has been approved in the same financial year. Reflect most recent adjusted budget.
6. Additional cash-backed accumulated funds/unspent funds (MFMA section 18(1)(b) and section 28(2)(e)) identified after the Original Budget approved and after annual financial statements audited (note: only where underspending could not
reasonably have been foreseen)7. Increases of funds approved under MFMA section 31
8. Adjustments approved in accordance with MFMA section 29
10. Adjusts. = 'Other' Adjustments proposed to be approved; including revenue under-collection (MFMA section 28(2)(a)); additional revenue appropriation on existing programmes (section 28(2))(b); projected savings (section 28(2)(d)); error correction
(section 28(2)(f))
12. Adjusted Budget H = (A or A1/2 etc) + G
Description Ref
2. Include capital component of PPP unitary payment. Note that capital transfers are only appropriated to municipalities for the budget year
Budget Year 2012/13
3. Capital expenditure by standard classification must reconcile to the appropriations by vote
GT423 Lesedi - Table B5 Adjustments Capital Expenditure Budget by vote and funding - B - 2013/01/22
Budget Year +1
2013/14
Budget Year +2
2014/15
Original Budget Prior Adjusted Accum. FundsMulti-year
capitalUnfore. Unavoid.
Nat. or Prov.
GovtOther Adjusts. Total Adjusts. Adjusted Budget Adjusted Budget Adjusted Budget
[Insert departmental structure etc] 3 4 5 6 7 8 9 10
R thousands A A1 B C D E F G H
Capital expenditure - Municipal Vote
Multi-year expenditure appropriation 2
Vote 1 - Municipal Governance and Administration – – – – – – – – – – –
1.1 - Executive and Council - Mayor and Council – – – – – –
1.2 - Executive and Council - Municipal Manager – – – – – –
1.3 - Budget and Treasury Offices – – – – – –
1.4 - Corportate Services - Human Resources – – – – – –
1.5 - Corporate Services - Information Technology – – – – – –
1.6 - Corporate Services - Property Services – – – – – –
1.7 - Corporate Services - Other Services – – – – – –
– –
Vote 2 - Community and Public Safety – – – – – – – – – – –
2.1 - Arts and Culture/Museums – – – – – –
2.2 - Cemeteries – – – – – –
2.3 - Community and Social Services – – – – – –
2.4 - Sports and Recreation – – – – – –
2.5 - Public Safety - Police – – – – – –
2.6 - Public Safety - Fire – – – – – –
2.7 - Housing – – – – – –
2.8 - Health - Clinics (Consolidated) – – – – – –
2.9 - Health - Other – – – – – –
– –
Vote 3 - Economic and Enviromental Services – – – – – – – – – – –
3.1 - Planning and Development - IDP,Local Areas Plannin – – – – – –
3.2 - Planning and Development - LED – – – – – –
3.3 - Road Transport – – – – – –
3.4 - Enviromental Protection - Parks – – – – – –
3.5 - Enviromental Protection - Cleansing – – – – – –
– –
Vote 4 - Trading Services – – – – – – – – – – –
4.1 - Electricity – – – – – –
4.2 - Water Distribution – – – – – –
4.3 - Waste Water Management - Sewerage – – – – – –
4.4 - Waste Water Management - Nightsoil – – – – – –
4.5 - Waste Management - Solid – – – – – –
– –
Capital multi-year expenditure sub-total – – – – – – – – – – –
Capital expenditure - Municipal Vote 2
Single-year expenditure appropriation
Vote 1 - Municipal Governance and Administration 1,550 – – – 440 – (1,880) (1,440) 110 – –
1.1 - Executive and Council - Mayor and Council 900 340 (1,130) (790) 110 – –
1.2 - Executive and Council - Municipal Manager – – – – – – –
1.3 - Budget and Treasury Offices – – – – – – –
1.4 - Corportate Services - Human Resources – – – – – – –
1.5 - Corporate Services - Information Technology – – – – – – –
1.6 - Corporate Services - Property Services 650 100 (750) (650) – – –
1.7 - Corporate Services - Other Services – – – – – – –
– –
Vote 2 - Community and Public Safety 4,700 – – – (49) – (2,217) (2,266) 2,434 3,630 1,350
2.1 - Arts and Culture/Museums 500 10 1,208 1,218 1,718 350 350
2.2 - Cemeteries 1,000 – (600) (600) 400 700 500
2.3 - Community and Social Services – – – – – – –
2.4 - Sports and Recreation 950 20 (695) (675) 275 1,720 500
2.5 - Public Safety - Police 470 21 (450) (429) 41 710 –
2.6 - Public Safety - Fire 1,510 – (1,510) (1,510) – – –
2.7 - Housing – – – – – – –
2.8 - Health - Clinics (Consolidated) 170 – (170) (170) – 150 –
2.9 - Health - Other 100 (100) – (100) – – –
– –
Vote 3 - Economic and Enviromental Services 44,014 – – – 1,653 – (8,602) (6,949) 37,065 35,825 37,497
3.1 - Planning and Development - IDP,Local Areas Plannin 2,000 1,600 (1,000) 600 2,600 4,000 4,110
3.2 - Planning and Development - LED – – – – – – –
3.3 - Road Transport 41,139 – (6,689) (6,689) 34,450 31,660 33,372
3.4 - Enviromental Protection - Parks 855 18 (858) (840) 15 165 15
3.5 - Enviromental Protection - Cleansing 20 35 (55) (20) – – –
– –
Vote 4 - Trading Services 17,400 – – – – – (4,400) (4,400) 13,000 – 700
4.1 - Electricity 7,600 – 2,900 2,900 10,500 – –
4.2 - Water Distribution 1,300 (1,000) (200) (1,200) 100 – 300
4.3 - Waste Water Management - Sewerage 2,000 1,000 (600) 400 2,400 – 400
4.4 - Waste Water Management - Nightsoil – – – – – – –
4.5 - Waste Management - Solid 6,500 – (6,500) (6,500) – – –
– –
Capital single-year expenditure sub-total 67,664 – – – 2,044 – (17,098) (15,054) 52,610 39,455 39,547
Total Capital Expenditure 67,664 – – – 2,044 – (17,098) (15,054) 52,610 39,455 39,547
References
1. Insert 'Vote'; e.g. Department, if different to standard structure
2. Must reconcile to Financial Performance ('Revenue and Expenditure by Standard Classification' and 'Revenue and Expenditure')
3. Assign share in 'associate' to relevant Vote
Vote Description
Ref
Budget Year 2012/13
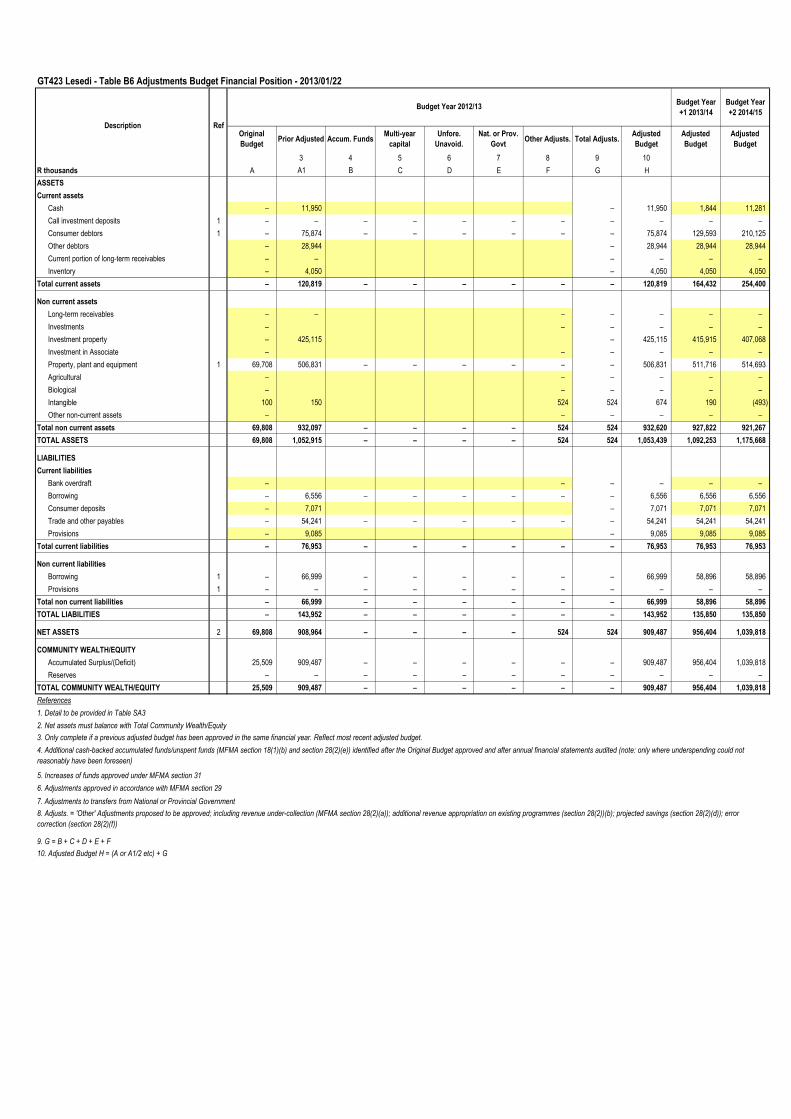
GT423 Lesedi - Table B6 Adjustments Budget Financial Position - 2013/01/22
Budget Year
+1 2013/14
Budget Year
+2 2014/15
Original
BudgetPrior Adjusted Accum. Funds
Multi-year
capital
Unfore.
Unavoid.
Nat. or Prov.
GovtOther Adjusts. Total Adjusts.
Adjusted
Budget
Adjusted
Budget
Adjusted
Budget
3 4 5 6 7 8 9 10
R thousands A A1 B C D E F G H
ASSETS
Current assets
Cash – 11,950 – 11,950 1,844 11,281
Call investment deposits 1 – – – – – – – – – – –
Consumer debtors 1 – 75,874 – – – – – – 75,874 129,593 210,125
Other debtors – 28,944 – 28,944 28,944 28,944
Current portion of long-term receivables – – – – – –
Inventory – 4,050 – 4,050 4,050 4,050
Total current assets – 120,819 – – – – – – 120,819 164,432 254,400
Non current assets
Long-term receivables – – – – – – –
Investments – – – – – –
Investment property – 425,115 – 425,115 415,915 407,068
Investment in Associate – – – – – –
Property, plant and equipment 1 69,708 506,831 – – – – – – 506,831 511,716 514,693
Agricultural – – – – – –
Biological – – – – – –
Intangible 100 150 524 524 674 190 (493)
Other non-current assets – – – – – –
Total non current assets 69,808 932,097 – – – – 524 524 932,620 927,822 921,267
TOTAL ASSETS 69,808 1,052,915 – – – – 524 524 1,053,439 1,092,253 1,175,668
LIABILITIES
Current liabilities
Bank overdraft – – – – – –
Borrowing – 6,556 – – – – – – 6,556 6,556 6,556
Consumer deposits – 7,071 – 7,071 7,071 7,071
Trade and other payables – 54,241 – – – – – – 54,241 54,241 54,241
Provisions – 9,085 – 9,085 9,085 9,085
Total current liabilities – 76,953 – – – – – – 76,953 76,953 76,953
Non current liabilities
Borrowing 1 – 66,999 – – – – – – 66,999 58,896 58,896
Provisions 1 – – – – – – – – – – –
Total non current liabilities – 66,999 – – – – – – 66,999 58,896 58,896
TOTAL LIABILITIES – 143,952 – – – – – – 143,952 135,850 135,850
NET ASSETS 2 69,808 908,964 – – – – 524 524 909,487 956,404 1,039,818
COMMUNITY WEALTH/EQUITY
Accumulated Surplus/(Deficit) 25,509 909,487 – – – – – – 909,487 956,404 1,039,818
Reserves – – – – – – – – – – –
TOTAL COMMUNITY WEALTH/EQUITY 25,509 909,487 – – – – – – 909,487 956,404 1,039,818
References
1. Detail to be provided in Table SA3
2. Net assets must balance with Total Community Wealth/Equity
7. Adjustments to transfers from National or Provincial Government
9. G = B + C + D + E + F
Budget Year 2012/13
Description Ref
10. Adjusted Budget H = (A or A1/2 etc) + G
6. Adjustments approved in accordance with MFMA section 29
8. Adjusts. = 'Other' Adjustments proposed to be approved; including revenue under-collection (MFMA section 28(2)(a)); additional revenue appropriation on existing programmes (section 28(2))(b); projected savings (section 28(2)(d)); error
correction (section 28(2)(f))
4. Additional cash-backed accumulated funds/unspent funds (MFMA section 18(1)(b) and section 28(2)(e)) identified after the Original Budget approved and after annual financial statements audited (note: only where underspending could not
reasonably have been foreseen)
5. Increases of funds approved under MFMA section 31
3. Only complete if a previous adjusted budget has been approved in the same financial year. Reflect most recent adjusted budget.
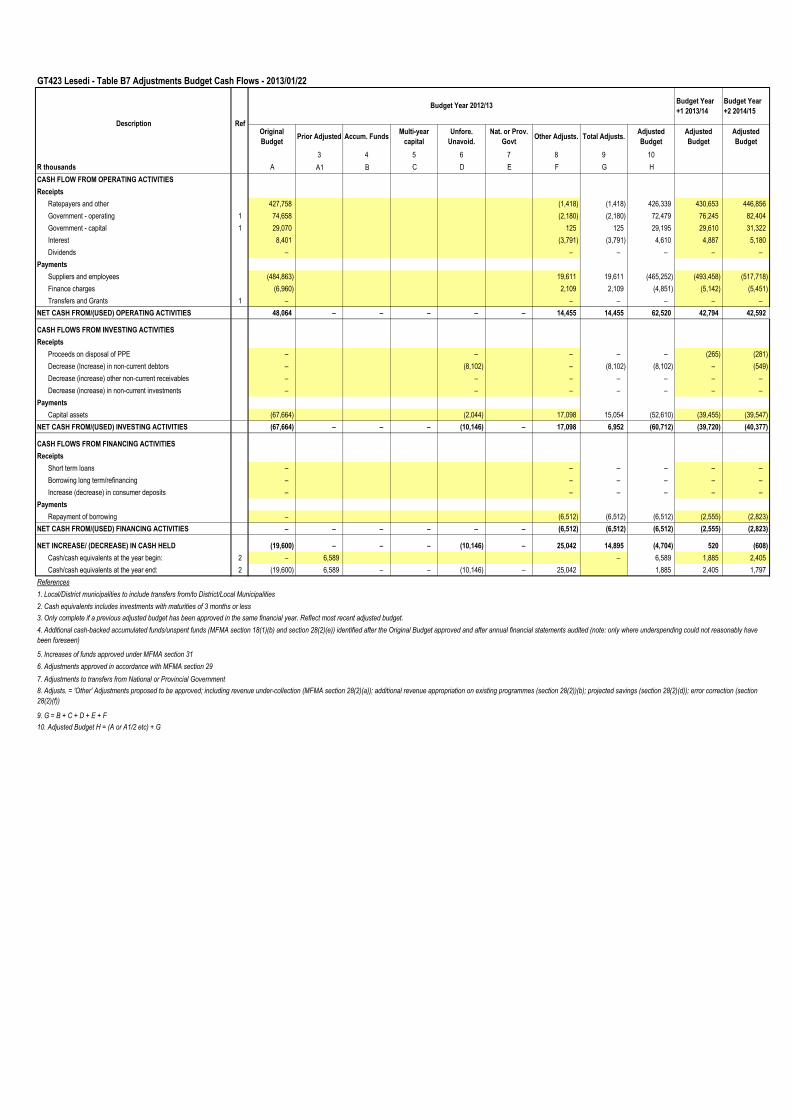
GT423 Lesedi - Table B7 Adjustments Budget Cash Flows - 2013/01/22
Budget Year
+1 2013/14
Budget Year
+2 2014/15
Original
BudgetPrior Adjusted Accum. Funds
Multi-year
capital
Unfore.
Unavoid.
Nat. or Prov.
GovtOther Adjusts. Total Adjusts.
Adjusted
Budget
Adjusted
Budget
Adjusted
Budget
3 4 5 6 7 8 9 10
R thousands A A1 B C D E F G H
CASH FLOW FROM OPERATING ACTIVITIES
Receipts
Ratepayers and other 427,758 (1,418) (1,418) 426,339 430,653 446,856
Government - operating 1 74,658 (2,180) (2,180) 72,479 76,245 82,404
Government - capital 1 29,070 125 125 29,195 29,610 31,322
Interest 8,401 (3,791) (3,791) 4,610 4,887 5,180
Dividends – – – – – –
Payments
Suppliers and employees (484,863) 19,611 19,611 (465,252) (493,458) (517,718)
Finance charges (6,960) 2,109 2,109 (4,851) (5,142) (5,451)
Transfers and Grants 1 – – – – – –
NET CASH FROM/(USED) OPERATING ACTIVITIES 48,064 – – – – – 14,455 14,455 62,520 42,794 42,592
CASH FLOWS FROM INVESTING ACTIVITIES
Receipts
Proceeds on disposal of PPE – – – – – (265) (281)
Decrease (Increase) in non-current debtors – (8,102) – (8,102) (8,102) – (549)
Decrease (increase) other non-current receivables – – – – – – –
Decrease (increase) in non-current investments – – – – – – –
Payments
Capital assets (67,664) (2,044) 17,098 15,054 (52,610) (39,455) (39,547)
NET CASH FROM/(USED) INVESTING ACTIVITIES (67,664) – – – (10,146) – 17,098 6,952 (60,712) (39,720) (40,377)
CASH FLOWS FROM FINANCING ACTIVITIES
Receipts
Short term loans – – – – – –
Borrowing long term/refinancing – – – – – –
Increase (decrease) in consumer deposits – – – – – –
Payments
Repayment of borrowing – (6,512) (6,512) (6,512) (2,555) (2,823)
NET CASH FROM/(USED) FINANCING ACTIVITIES – – – – – – (6,512) (6,512) (6,512) (2,555) (2,823)
NET INCREASE/ (DECREASE) IN CASH HELD (19,600) – – – (10,146) – 25,042 14,895 (4,704) 520 (608)
Cash/cash equivalents at the year begin: 2 – 6,589 – 6,589 1,885 2,405
Cash/cash equivalents at the year end: 2 (19,600) 6,589 – – (10,146) – 25,042 1,885 2,405 1,797
References
1. Local/District municipalities to include transfers from/to District/Local Municipalities
2. Cash equivalents includes investments with maturities of 3 months or less
7. Adjustments to transfers from National or Provincial Government
9. G = B + C + D + E + F
10. Adjusted Budget H = (A or A1/2 etc) + G
4. Additional cash-backed accumulated funds/unspent funds (MFMA section 18(1)(b) and section 28(2)(e)) identified after the Original Budget approved and after annual financial statements audited (note: only where underspending could not reasonably have
been foreseen)
8. Adjusts. = 'Other' Adjustments proposed to be approved; including revenue under-collection (MFMA section 28(2)(a)); additional revenue appropriation on existing programmes (section 28(2))(b); projected savings (section 28(2)(d)); error correction (section
28(2)(f))
Description Ref
Budget Year 2012/13
3. Only complete if a previous adjusted budget has been approved in the same financial year. Reflect most recent adjusted budget.
5. Increases of funds approved under MFMA section 31
6. Adjustments approved in accordance with MFMA section 29

GT423 Lesedi - Table B8 Cash backed reserves/accumulated surplus reconciliation - 2013/01/22
Budget Year
+1 2013/14
Budget Year
+2 2014/15
Original
Budget
Prior
Adjusted
Accum.
Funds
Multi-year
capital
Unfore.
Unavoid.
Nat. or Prov.
Govt
Other
Adjusts.Total Adjusts.
Adjusted
Budget
Adjusted
Budget
Adjusted
Budget
3 4 5 6 7 8 9 10
R thousands A A1 B C D E F G H
Cash and investments available
Cash/cash equivalents at the year end 1 (19,600) 6,589 – – (10,146) – 25,042 14,895 21,485 2,405 1,797
Other current investments > 90 days 19,600 5,361 – – 10,146 – (25,042) (14,895) (9,534) (561) 9,483
Non current assets - Investments 1 – – – – – – – – – – –
Cash and investments available: – 11,950 – – – – – – 11,950 1,844 11,281
Applications of cash and investments
Unspent conditional transfers – (806) – – – – – – (806) (806) (806)
Unspent borrowing – –
Statutory requirements – –
Other working capital requirements 2 – 26,971 – – 26,971 26,971 29,888
Other provisions – –
Long term investments committed – – – – – – –
Reserves to be backed by cash/investments – – – – – – –
Total Application of cash and investments: – 26,165 – – – – – – 26,165 26,165 29,082
Surplus(shortfall) – (14,214) – – – – – – (14,214) (24,321) (17,801)
References
1. Must reconcile with the Adjustments Budget Cash Flow and Adjustements Budget Financial Position
2. Council approval for policy required - include sufficient working capital (e.g. allowing for a % of current debtors > 90 days as uncollectable)
7. Adjustments to transfers from National or Provincial Government
9. G = B + C + D + E + F
10. Adjusted Budget H = (A or A1/2 etc) + G
6. Adjustments approved in accordance with MFMA section 29
5. Increases of funds approved under MFMA section 31
RefDescription
4. Additional cash-backed accumulated funds/unspent funds (MFMA section 18(1)(b) and section 28(2)(e)) identified after the Original Budget approved and after annual financial statements audited (note: only where underspending could not reasonably
have been foreseen)
Budget Year 2012/13
3. Only complete if a previous adjusted budget has been approved in the same financial year. Reflect most recent adjusted budget.
8. Adjusts. = 'Other' Adjustments proposed to be approved; including revenue under-collection (MFMA section 28(2)(a)); additional revenue appropriation on existing programmes (section 28(2))(b); projected savings (section 28(2)(d)); error correction
(section 28(2)(f))
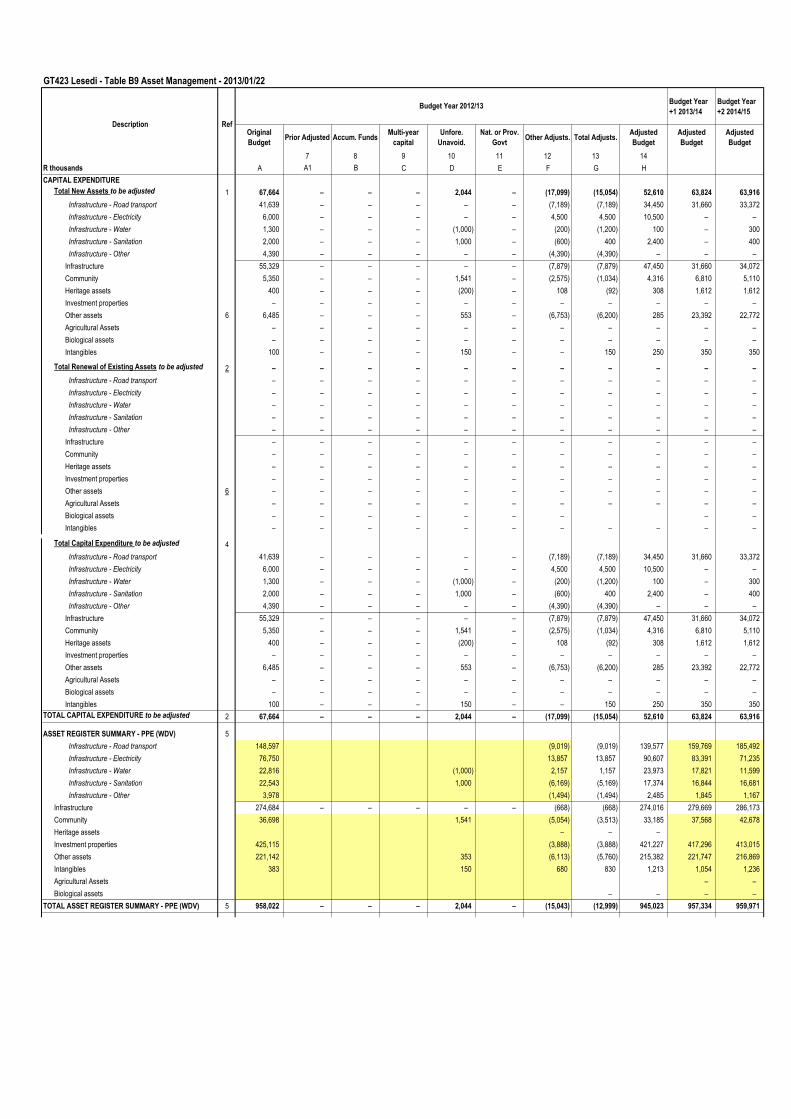
GT423 Lesedi - Table B9 Asset Management - 2013/01/22
Budget Year
+1 2013/14
Budget Year
+2 2014/15
Original
BudgetPrior Adjusted Accum. Funds
Multi-year
capital
Unfore.
Unavoid.
Nat. or Prov.
GovtOther Adjusts. Total Adjusts.
Adjusted
Budget
Adjusted
Budget
Adjusted
Budget
7 8 9 10 11 12 13 14
R thousands A A1 B C D E F G H
CAPITAL EXPENDITURE
Total New Assets to be adjusted 1 67,664 – – – 2,044 – (17,099) (15,054) 52,610 63,824 63,916
Infrastructure - Road transport 41,639 – – – – – (7,189) (7,189) 34,450 31,660 33,372
Infrastructure - Electricity 6,000 – – – – – 4,500 4,500 10,500 – –
Infrastructure - Water 1,300 – – – (1,000) – (200) (1,200) 100 – 300
Infrastructure - Sanitation 2,000 – – – 1,000 – (600) 400 2,400 – 400
Infrastructure - Other 4,390 – – – – – (4,390) (4,390) – – –
Infrastructure 55,329 – – – – – (7,879) (7,879) 47,450 31,660 34,072
Community 5,350 – – – 1,541 – (2,575) (1,034) 4,316 6,810 5,110
Heritage assets 400 – – – (200) – 108 (92) 308 1,612 1,612
Investment properties – – – – – – – – – – –
Other assets 6 6,485 – – – 553 – (6,753) (6,200) 285 23,392 22,772
Agricultural Assets – – – – – – – – – – –
Biological assets – – – – – – – – – – –
Intangibles 100 – – – 150 – – 150 250 350 350
Total Renewal of Existing Assets to be adjusted 2 – – – – – – – – – – –
Infrastructure - Road transport – – – – – – – – – – –
Infrastructure - Electricity – – – – – – – – – – –
Infrastructure - Water – – – – – – – – – – –
Infrastructure - Sanitation – – – – – – – – – – –
Infrastructure - Other – – – – – – – – – – –
Infrastructure – – – – – – – – – – –
Community – – – – – – – – – – –
Heritage assets – – – – – – – – – – –
Investment properties – – – – – – – – – – –
Other assets 6 – – – – – – – – – – –
Agricultural Assets – – – – – – – – – – –
Biological assets – – – – – – – – –
Intangibles – – – – – – – – – – –
Total Capital Expenditure to be adjusted 4
Infrastructure - Road transport 41,639 – – – – – (7,189) (7,189) 34,450 31,660 33,372
Infrastructure - Electricity 6,000 – – – – – 4,500 4,500 10,500 – –
Infrastructure - Water 1,300 – – – (1,000) – (200) (1,200) 100 – 300
Infrastructure - Sanitation 2,000 – – – 1,000 – (600) 400 2,400 – 400
Infrastructure - Other 4,390 – – – – – (4,390) (4,390) – – –
Infrastructure 55,329 – – – – – (7,879) (7,879) 47,450 31,660 34,072
Community 5,350 – – – 1,541 – (2,575) (1,034) 4,316 6,810 5,110
Heritage assets 400 – – – (200) – 108 (92) 308 1,612 1,612
Investment properties – – – – – – – – – – –
Other assets 6,485 – – – 553 – (6,753) (6,200) 285 23,392 22,772
Agricultural Assets – – – – – – – – – – –
Biological assets – – – – – – – – – – –
Intangibles 100 – – – 150 – – 150 250 350 350
TOTAL CAPITAL EXPENDITURE to be adjusted 2 67,664 – – – 2,044 – (17,099) (15,054) 52,610 63,824 63,916
ASSET REGISTER SUMMARY - PPE (WDV) 5
Infrastructure - Road transport 148,597 (9,019) (9,019) 139,577 159,769 185,492
Infrastructure - Electricity 76,750 13,857 13,857 90,607 83,391 71,235
Infrastructure - Water 22,816 (1,000) 2,157 1,157 23,973 17,821 11,599
Infrastructure - Sanitation 22,543 1,000 (6,169) (5,169) 17,374 16,844 16,681
Infrastructure - Other 3,978 (1,494) (1,494) 2,485 1,845 1,167
Infrastructure 274,684 – – – – – (668) (668) 274,016 279,669 286,173
Community 36,698 1,541 (5,054) (3,513) 33,185 37,568 42,678
Heritage assets – – –
Investment properties 425,115 (3,888) (3,888) 421,227 417,296 413,015
Other assets 221,142 353 (6,113) (5,760) 215,382 221,747 216,869
Intangibles 383 150 680 830 1,213 1,054 1,236
Agricultural Assets – –
Biological assets – – – –
TOTAL ASSET REGISTER SUMMARY - PPE (WDV) 5 958,022 – – – 2,044 – (15,043) (12,999) 945,023 957,334 959,971
Budget Year 2012/13
Description Ref
Budget Year
+1 2013/14
Budget Year
+2 2014/15
Original
BudgetPrior Adjusted Accum. Funds
Multi-year
capital
Unfore.
Unavoid.
Nat. or Prov.
GovtOther Adjusts. Total Adjusts.
Adjusted
Budget
Adjusted
Budget
Adjusted
Budget
7 8 9 10 11 12 13 14
R thousands A A1 B C D E F G H
Budget Year 2012/13
Description Ref
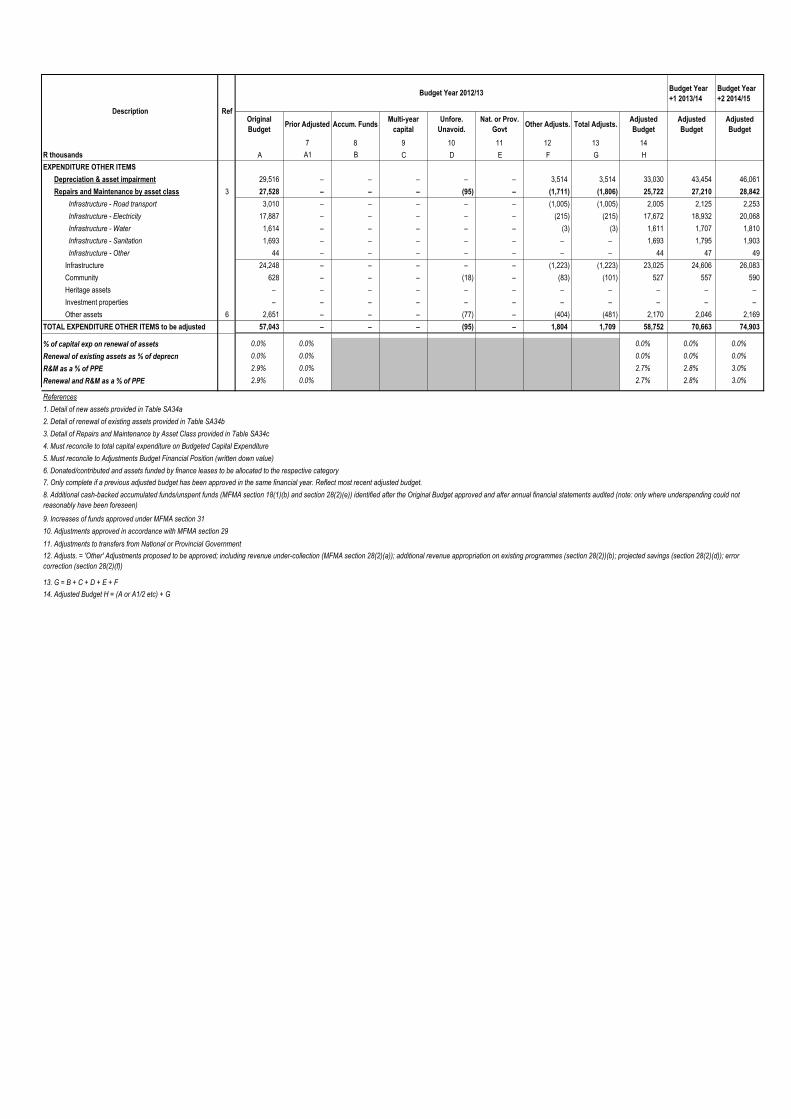
EXPENDITURE OTHER ITEMS
Depreciation & asset impairment 29,516 – – – – – 3,514 3,514 33,030 43,454 46,061
Repairs and Maintenance by asset class 3 27,528 – – – (95) – (1,711) (1,806) 25,722 27,210 28,842
Infrastructure - Road transport 3,010 – – – – – (1,005) (1,005) 2,005 2,125 2,253
Infrastructure - Electricity 17,887 – – – – – (215) (215) 17,672 18,932 20,068
Infrastructure - Water 1,614 – – – – – (3) (3) 1,611 1,707 1,810
Infrastructure - Sanitation 1,693 – – – – – – – 1,693 1,795 1,903
Infrastructure - Other 44 – – – – – – – 44 47 49
Infrastructure 24,248 – – – – – (1,223) (1,223) 23,025 24,606 26,083
Community 628 – – – (18) – (83) (101) 527 557 590
Heritage assets – – – – – – – – – – –
Investment properties – – – – – – – – – – –
Other assets 6 2,651 – – – (77) – (404) (481) 2,170 2,046 2,169
TOTAL EXPENDITURE OTHER ITEMS to be adjusted 57,043 – – – (95) – 1,804 1,709 58,752 70,663 74,903
% of capital exp on renewal of assets 0.0% 0.0% 0.0% 0.0% 0.0%
Renewal of existing assets as % of deprecn 0.0% 0.0% 0.0% 0.0% 0.0%
R&M as a % of PPE 2.9% 0.0% 2.7% 2.8% 3.0%
Renewal and R&M as a % of PPE 2.9% 0.0% 2.7% 2.8% 3.0%
References
1. Detail of new assets provided in Table SA34a
2. Detail of renewal of existing assets provided in Table SA34b
3. Detail of Repairs and Maintenance by Asset Class provided in Table SA34c
4. Must reconcile to total capital expenditure on Budgeted Capital Expenditure
5. Must reconcile to Adjustments Budget Financial Position (written down value)
6. Donated/contributed and assets funded by finance leases to be allocated to the respective category
11. Adjustments to transfers from National or Provincial Government
13. G = B + C + D + E + F
14. Adjusted Budget H = (A or A1/2 etc) + G
8. Additional cash-backed accumulated funds/unspent funds (MFMA section 18(1)(b) and section 28(2)(e)) identified after the Original Budget approved and after annual financial statements audited (note: only where underspending could not
reasonably have been foreseen)
12. Adjusts. = 'Other' Adjustments proposed to be approved; including revenue under-collection (MFMA section 28(2)(a)); additional revenue appropriation on existing programmes (section 28(2))(b); projected savings (section 28(2)(d)); error
correction (section 28(2)(f))
7. Only complete if a previous adjusted budget has been approved in the same financial year. Reflect most recent adjusted budget.
9. Increases of funds approved under MFMA section 31
10. Adjustments approved in accordance with MFMA section 29
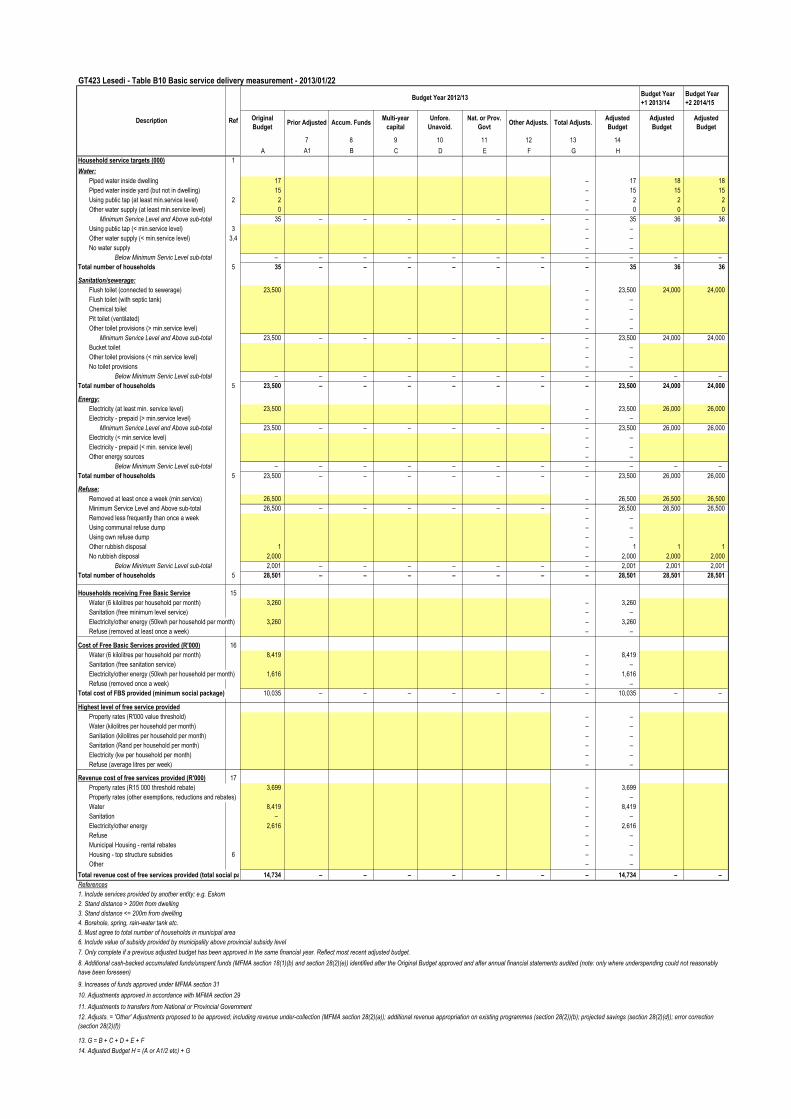
GT423 Lesedi - Table B10 Basic service delivery measurement - 2013/01/22
Budget Year
+1 2013/14
Budget Year
+2 2014/15
Original
BudgetPrior Adjusted Accum. Funds
Multi-year
capital
Unfore.
Unavoid.
Nat. or Prov.
GovtOther Adjusts. Total Adjusts.
Adjusted
Budget
Adjusted
Budget
Adjusted
Budget
7 8 9 10 11 12 13 14
A A1 B C D E F G H
Household service targets (000) 1
Water:
Piped water inside dwelling 17 – 17 18 18
Piped water inside yard (but not in dwelling) 15 – 15 15 15
Using public tap (at least min.service level) 2 2 – 2 2 2
Other water supply (at least min.service level) 0 – 0 0 0
Minimum Service Level and Above sub-total 35 – – – – – – – 35 36 36
Using public tap (< min.service level) 3 – –
Other water supply (< min.service level) 3,4 – –
No water supply – –
Below Minimum Servic Level sub-total – – – – – – – – – – –
Total number of households 5 35 – – – – – – – 35 36 36
Sanitation/sewerage:
Flush toilet (connected to sewerage) 23,500 – 23,500 24,000 24,000
Flush toilet (with septic tank) – –
Chemical toilet – –
Pit toilet (ventilated) – –
Other toilet provisions (> min.service level) – –
Minimum Service Level and Above sub-total 23,500 – – – – – – – 23,500 24,000 24,000
Bucket toilet – –
Other toilet provisions (< min.service level) – –
No toilet provisions – –
Below Minimum Servic Level sub-total – – – – – – – – – – –
Total number of households 5 23,500 – – – – – – – 23,500 24,000 24,000
Energy:
Electricity (at least min. service level) 23,500 – 23,500 26,000 26,000
Electricity - prepaid (> min.service level) – –
Minimum Service Level and Above sub-total 23,500 – – – – – – – 23,500 26,000 26,000
Electricity (< min.service level) – –
Electricity - prepaid (< min. service level) – –
Other energy sources – –
Below Minimum Servic Level sub-total – – – – – – – – – – –
Total number of households 5 23,500 – – – – – – – 23,500 26,000 26,000
Refuse:
Removed at least once a week (min.service) 26,500 – 26,500 26,500 26,500
Minimum Service Level and Above sub-total 26,500 – – – – – – – 26,500 26,500 26,500
Removed less frequently than once a week – –
Using communal refuse dump – –
Using own refuse dump – –
Other rubbish disposal 1 – 1 1 1
No rubbish disposal 2,000 – 2,000 2,000 2,000
Below Minimum Servic Level sub-total 2,001 – – – – – – – 2,001 2,001 2,001
Total number of households 5 28,501 – – – – – – – 28,501 28,501 28,501
Households receiving Free Basic Service 15
Water (6 kilolitres per household per month) 3,260 – 3,260
Sanitation (free minimum level service) – –
Electricity/other energy (50kwh per household per month) 3,260 – 3,260
Refuse (removed at least once a week) – –
Cost of Free Basic Services provided (R'000) 16
Water (6 kilolitres per household per month) 8,419 – 8,419
Sanitation (free sanitation service) – –
Electricity/other energy (50kwh per household per month) 1,616 – 1,616
Refuse (removed once a week) – –
Total cost of FBS provided (minimum social package) 10,035 – – – – – – – 10,035 – –
Highest level of free service provided
Property rates (R'000 value threshold) – –
Water (kilolitres per household per month) – –
Sanitation (kilolitres per household per month) – –
Sanitation (Rand per household per month) – –
Electricity (kw per household per month) – –
Refuse (average litres per week) – –
Revenue cost of free services provided (R'000) 17
Property rates (R15 000 threshold rebate) 3,699 – 3,699
Property rates (other exemptions, reductions and rebates) – –
Water 8,419 – 8,419
Sanitation – – –
Electricity/other energy 2,616 – 2,616
Refuse – –
Municipal Housing - rental rebates – –
Housing - top structure subsidies 6 – –
Other – –
Total revenue cost of free services provided (total social package) 14,734 – – – – – – – 14,734 – –
References
1. Include services provided by another entity; e.g. Eskom
2. Stand distance > 200m from dwelling
3. Stand distance <= 200m from dwelling
4. Borehole, spring, rain-water tank etc.
5. Must agree to total number of households in municipal area
6. Include value of subsidy provided by municipality above provincial subsidy level
11. Adjustments to transfers from National or Provincial Government
13. G = B + C + D + E + F
14. Adjusted Budget H = (A or A1/2 etc) + G
12. Adjusts. = 'Other' Adjustments proposed to be approved; including revenue under-collection (MFMA section 28(2)(a)); additional revenue appropriation on existing programmes (section 28(2))(b); projected savings (section 28(2)(d)); error correction
(section 28(2)(f))
Description Ref
Budget Year 2012/13
8. Additional cash-backed accumulated funds/unspent funds (MFMA section 18(1)(b) and section 28(2)(e)) identified after the Original Budget approved and after annual financial statements audited (note: only where underspending could not reasonably
have been foreseen)
7. Only complete if a previous adjusted budget has been approved in the same financial year. Reflect most recent adjusted budget.
9. Increases of funds approved under MFMA section 31
10. Adjustments approved in accordance with MFMA section 29
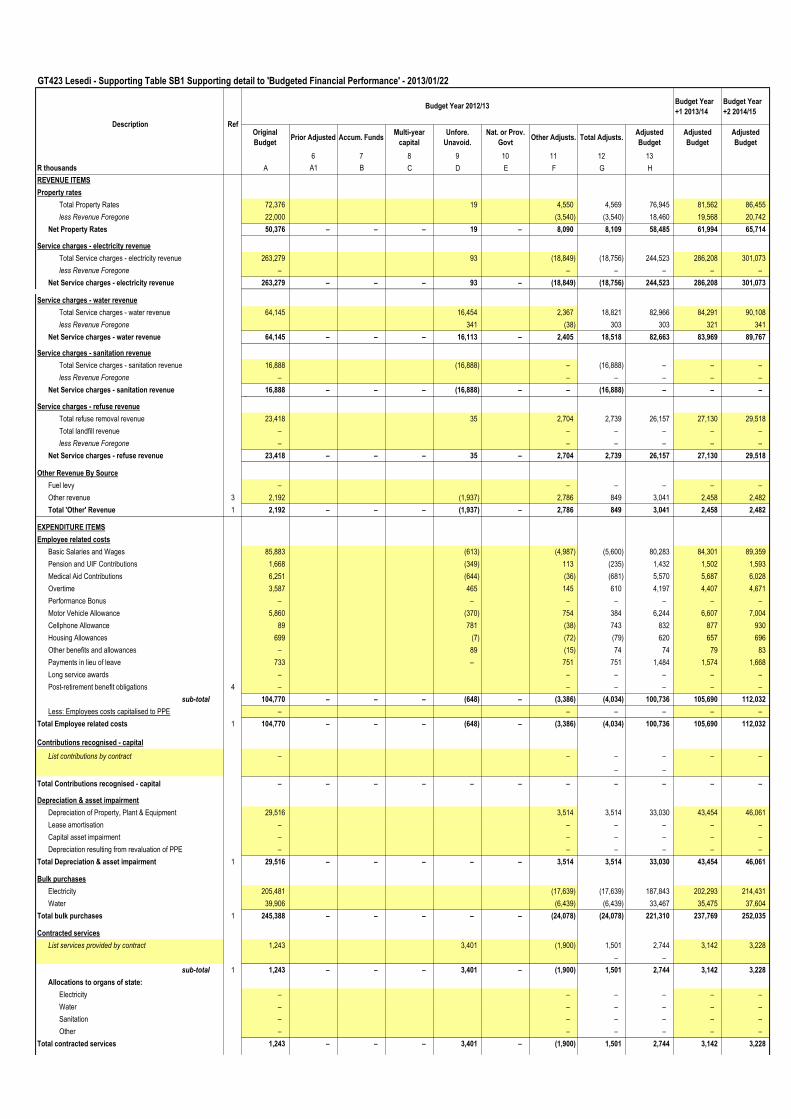
GT423 Lesedi - Supporting Table SB1 Supporting detail to 'Budgeted Financial Performance' - 2013/01/22
Budget Year
+1 2013/14
Budget Year
+2 2014/15
Original
BudgetPrior Adjusted Accum. Funds
Multi-year
capital
Unfore.
Unavoid.
Nat. or Prov.
GovtOther Adjusts. Total Adjusts.
Adjusted
Budget
Adjusted
Budget
Adjusted
Budget
6 7 8 9 10 11 12 13
R thousands A A1 B C D E F G H
REVENUE ITEMS
Property rates
Total Property Rates 72,376 19 4,550 4,569 76,945 81,562 86,455
less Revenue Foregone 22,000 (3,540) (3,540) 18,460 19,568 20,742
Net Property Rates 50,376 – – – 19 – 8,090 8,109 58,485 61,994 65,714
Service charges - electricity revenue
Total Service charges - electricity revenue 263,279 93 (18,849) (18,756) 244,523 286,208 301,073
less Revenue Foregone – – – – – –
Net Service charges - electricity revenue 263,279 – – – 93 – (18,849) (18,756) 244,523 286,208 301,073
Service charges - water revenue
Total Service charges - water revenue 64,145 16,454 2,367 18,821 82,966 84,291 90,108
less Revenue Foregone 341 (38) 303 303 321 341
Net Service charges - water revenue 64,145 – – – 16,113 – 2,405 18,518 82,663 83,969 89,767
Service charges - sanitation revenue
Total Service charges - sanitation revenue 16,888 (16,888) – (16,888) – – –
less Revenue Foregone – – – – – –
Net Service charges - sanitation revenue 16,888 – – – (16,888) – – (16,888) – – – .
Service charges - refuse revenue
Total refuse removal revenue 23,418 35 2,704 2,739 26,157 27,130 29,518
Total landfill revenue – – – – – –
less Revenue Foregone – – – – – –
Net Service charges - refuse revenue 23,418 – – – 35 – 2,704 2,739 26,157 27,130 29,518
Other Revenue By Source
Fuel levy – – – – – –
Other revenue 3 2,192 (1,937) 2,786 849 3,041 2,458 2,482
Total 'Other' Revenue 1 2,192 – – – (1,937) – 2,786 849 3,041 2,458 2,482
EXPENDITURE ITEMS
Employee related costs
Basic Salaries and Wages 85,883 (613) (4,987) (5,600) 80,283 84,301 89,359
Pension and UIF Contributions 1,668 (349) 113 (235) 1,432 1,502 1,593
Medical Aid Contributions 6,251 (644) (36) (681) 5,570 5,687 6,028
Overtime 3,587 465 145 610 4,197 4,407 4,671
Performance Bonus – – – – – – –
Motor Vehicle Allowance 5,860 (370) 754 384 6,244 6,607 7,004
Cellphone Allowance 89 781 (38) 743 832 877 930
Housing Allowances 699 (7) (72) (79) 620 657 696
Other benefits and allowances – 89 (15) 74 74 79 83
Payments in lieu of leave 733 – 751 751 1,484 1,574 1,668
Long service awards – – – – – –
Post-retirement benefit obligations 4 – – – – – –
sub-total 104,770 – – – (648) – (3,386) (4,034) 100,736 105,690 112,032
Less: Employees costs capitalised to PPE – – – – – –
Total Employee related costs 1 104,770 – – – (648) – (3,386) (4,034) 100,736 105,690 112,032
Contributions recognised - capital
List contributions by contract – – – – – –
– –
Total Contributions recognised - capital – – – – – – – – – – –
Depreciation & asset impairment
Depreciation of Property, Plant & Equipment 29,516 3,514 3,514 33,030 43,454 46,061
Lease amortisation – – – – – –
Capital asset impairment – – – – – –
Depreciation resulting from revaluation of PPE – – – – – –
Total Depreciation & asset impairment 1 29,516 – – – – – 3,514 3,514 33,030 43,454 46,061
Bulk purchases
Electricity 205,481 (17,639) (17,639) 187,843 202,293 214,431
Water 39,906 (6,439) (6,439) 33,467 35,475 37,604
Total bulk purchases 1 245,388 – – – – – (24,078) (24,078) 221,310 237,769 252,035
Contracted services
List services provided by contract 1,243 3,401 (1,900) 1,501 2,744 3,142 3,228
– –
sub-total 1 1,243 – – – 3,401 – (1,900) 1,501 2,744 3,142 3,228
Allocations to organs of state:
Electricity – – – – – –
Water – – – – – –
Sanitation – – – – – –
Other – – – – – –
Total contracted services 1,243 – – – 3,401 – (1,900) 1,501 2,744 3,142 3,228
Description Ref
Budget Year 2012/13
Budget Year
+1 2013/14
Budget Year
+2 2014/15
Original
BudgetPrior Adjusted Accum. Funds
Multi-year
capital
Unfore.
Unavoid.
Nat. or Prov.
GovtOther Adjusts. Total Adjusts.
Adjusted
Budget
Adjusted
Budget
Adjusted
Budget
6 7 8 9 10 11 12 13
R thousands A A1 B C D E F G H
Description Ref
Budget Year 2012/13
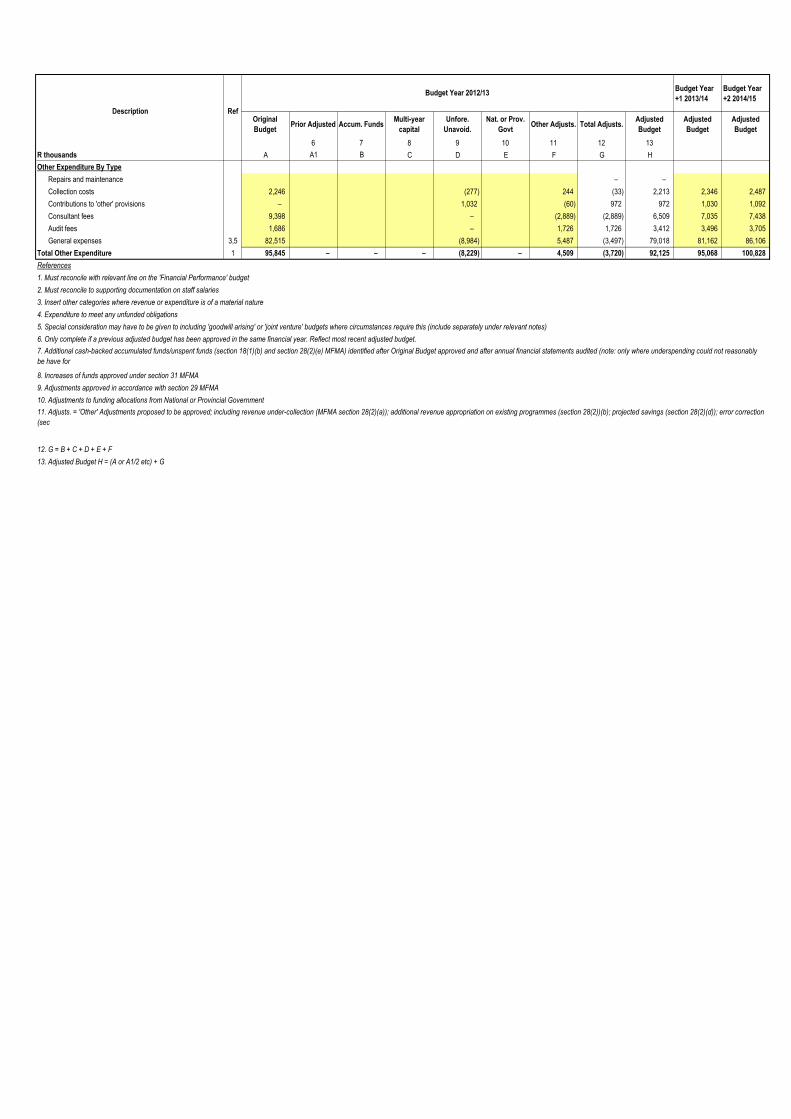
Other Expenditure By Type
Repairs and maintenance – –
Collection costs 2,246 (277) 244 (33) 2,213 2,346 2,487
Contributions to 'other' provisions – 1,032 (60) 972 972 1,030 1,092
Consultant fees 9,398 – (2,889) (2,889) 6,509 7,035 7,438
Audit fees 1,686 – 1,726 1,726 3,412 3,496 3,705
General expenses 3,5 82,515 (8,984) 5,487 (3,497) 79,018 81,162 86,106
Total Other Expenditure 1 95,845 – – – (8,229) – 4,509 (3,720) 92,125 95,068 100,828
References
1. Must reconcile with relevant line on the 'Financial Performance' budget
2. Must reconcile to supporting documentation on staff salaries
3. Insert other categories where revenue or expenditure is of a material nature
4. Expenditure to meet any unfunded obligations
5. Special consideration may have to be given to including 'goodwill arising' or 'joint venture' budgets where circumstances require this (include separately under relevant notes)
6. Only complete if a previous adjusted budget has been approved in the same financial year. Reflect most recent adjusted budget.
8. Increases of funds approved under section 31 MFMA
9. Adjustments approved in accordance with section 29 MFMA
10. Adjustments to funding allocations from National or Provincial Government
12. G = B + C + D + E + F
13. Adjusted Budget H = (A or A1/2 etc) + G
11. Adjusts. = 'Other' Adjustments proposed to be approved; including revenue under-collection (MFMA section 28(2)(a)); additional revenue appropriation on existing programmes (section 28(2))(b); projected savings (section 28(2)(d)); error correction
(sec
7. Additional cash-backed accumulated funds/unspent funds (section 18(1)(b) and section 28(2)(e) MFMA) identified after Original Budget approved and after annual financial statements audited (note: only where underspending could not reasonably
be have for
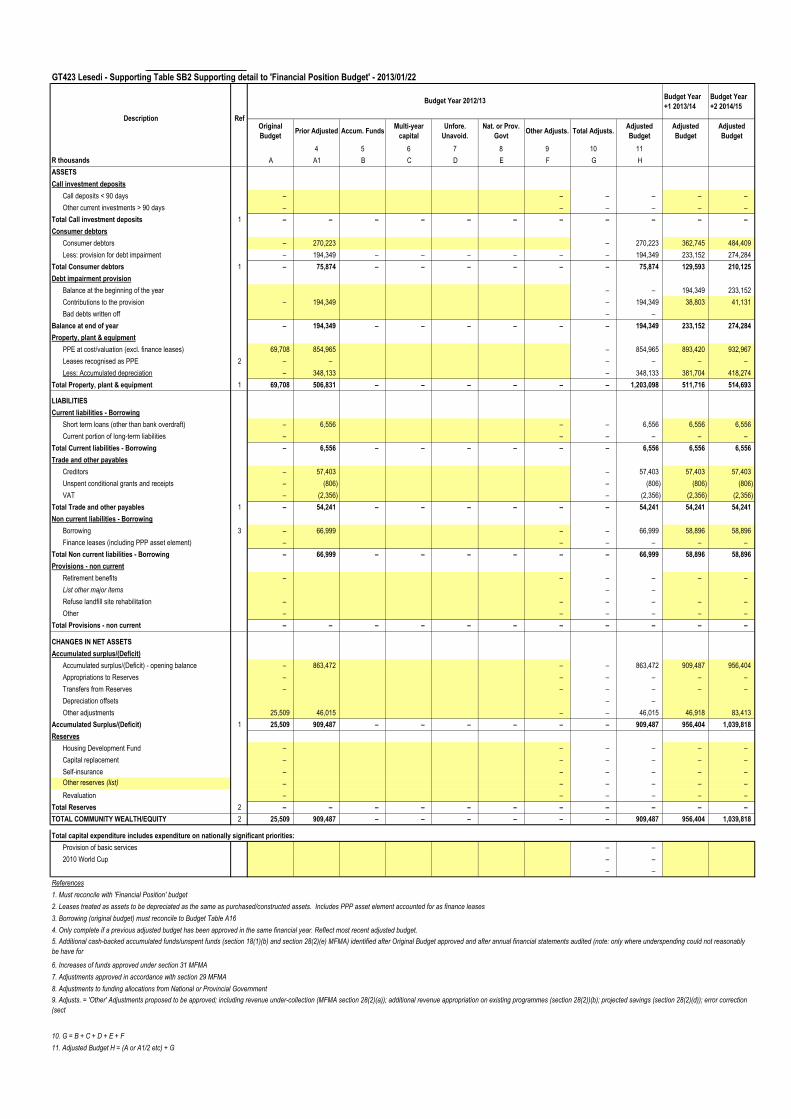
GT423 Lesedi - Supporting Table SB2 Supporting detail to 'Financial Position Budget' - 2013/01/22
Budget Year
+1 2013/14
Budget Year
+2 2014/15
Original
BudgetPrior Adjusted Accum. Funds
Multi-year
capital
Unfore.
Unavoid.
Nat. or Prov.
GovtOther Adjusts. Total Adjusts.
Adjusted
Budget
Adjusted
Budget
Adjusted
Budget
4 5 6 7 8 9 10 11
R thousands A A1 B C D E F G H
ASSETS
Call investment deposits
Call deposits < 90 days – – – – – –
Other current investments > 90 days – – – – – –
Total Call investment deposits 1 – – – – – – – – – – –
Consumer debtors
Consumer debtors – 270,223 – 270,223 362,745 484,409
Less: provision for debt impairment – 194,349 – – – – – – 194,349 233,152 274,284
Total Consumer debtors 1 – 75,874 – – – – – – 75,874 129,593 210,125
Debt impairment provision
Balance at the beginning of the year – – 194,349 233,152
Contributions to the provision – 194,349 – 194,349 38,803 41,131
Bad debts written off – –
Balance at end of year – 194,349 – – – – – – 194,349 233,152 274,284
Property, plant & equipment
PPE at cost/valuation (excl. finance leases) 69,708 854,965 – 854,965 893,420 932,967
Leases recognised as PPE 2 – – – – – –
Less: Accumulated depreciation – 348,133 – 348,133 381,704 418,274
Total Property, plant & equipment 1 69,708 506,831 – – – – – – 1,203,098 511,716 514,693
LIABILITIES
Current liabilities - Borrowing
Short term loans (other than bank overdraft) – 6,556 – – 6,556 6,556 6,556
Current portion of long-term liabilities – – – – – –
Total Current liabilities - Borrowing – 6,556 – – – – – – 6,556 6,556 6,556
Trade and other payables
Creditors – 57,403 – 57,403 57,403 57,403
Unspent conditional grants and receipts – (806) – (806) (806) (806)
VAT – (2,356) – (2,356) (2,356) (2,356)
Total Trade and other payables 1 – 54,241 – – – – – – 54,241 54,241 54,241
Non current liabilities - Borrowing
Borrowing 3 – 66,999 – – 66,999 58,896 58,896
Finance leases (including PPP asset element) – – – – – –
Total Non current liabilities - Borrowing – 66,999 – – – – – – 66,999 58,896 58,896
Provisions - non current
Retirement benefits – – – – – –
List other major items – –
Refuse landfill site rehabilitation – – – – – –
Other – – – – – –
Total Provisions - non current – – – – – – – – – – –
CHANGES IN NET ASSETS
Accumulated surplus/(Deficit)
Accumulated surplus/(Deficit) - opening balance – 863,472 – – 863,472 909,487 956,404
Appropriations to Reserves – – – – – –
Transfers from Reserves – – – – – –
Depreciation offsets – –
Other adjustments 25,509 46,015 – – 46,015 46,918 83,413
Accumulated Surplus/(Deficit) 1 25,509 909,487 – – – – – – 909,487 956,404 1,039,818
Reserves
Housing Development Fund – – – – – –
Capital replacement – – – – – –
Self-insurance – – – – – –
Other reserves (list) – – – – – –
Revaluation – – – – – –
Total Reserves 2 – – – – – – – – – – –
TOTAL COMMUNITY WEALTH/EQUITY 2 25,509 909,487 – – – – – – 909,487 956,404 1,039,818
Total capital expenditure includes expenditure on nationally significant priorities:
Provision of basic services – –
2010 World Cup – –
– –
References
1. Must reconcile with 'Financial Position' budget
2. Leases treated as assets to be depreciated as the same as purchased/constructed assets. Includes PPP asset element accounted for as finance leases
3. Borrowing (original budget) must reconcile to Budget Table A16
4. Only complete if a previous adjusted budget has been approved in the same financial year. Reflect most recent adjusted budget.
6. Increases of funds approved under section 31 MFMA
7. Adjustments approved in accordance with section 29 MFMA
8. Adjustments to funding allocations from National or Provincial Government
10. G = B + C + D + E + F
11. Adjusted Budget H = (A or A1/2 etc) + G
9. Adjusts. = 'Other' Adjustments proposed to be approved; including revenue under-collection (MFMA section 28(2)(a)); additional revenue appropriation on existing programmes (section 28(2))(b); projected savings (section 28(2)(d)); error correction
(sect
5. Additional cash-backed accumulated funds/unspent funds (section 18(1)(b) and section 28(2)(e) MFMA) identified after Original Budget approved and after annual financial statements audited (note: only where underspending could not reasonably
be have for
RefDescription
Budget Year 2012/13
Headings compulsory, but R&M should be distributed
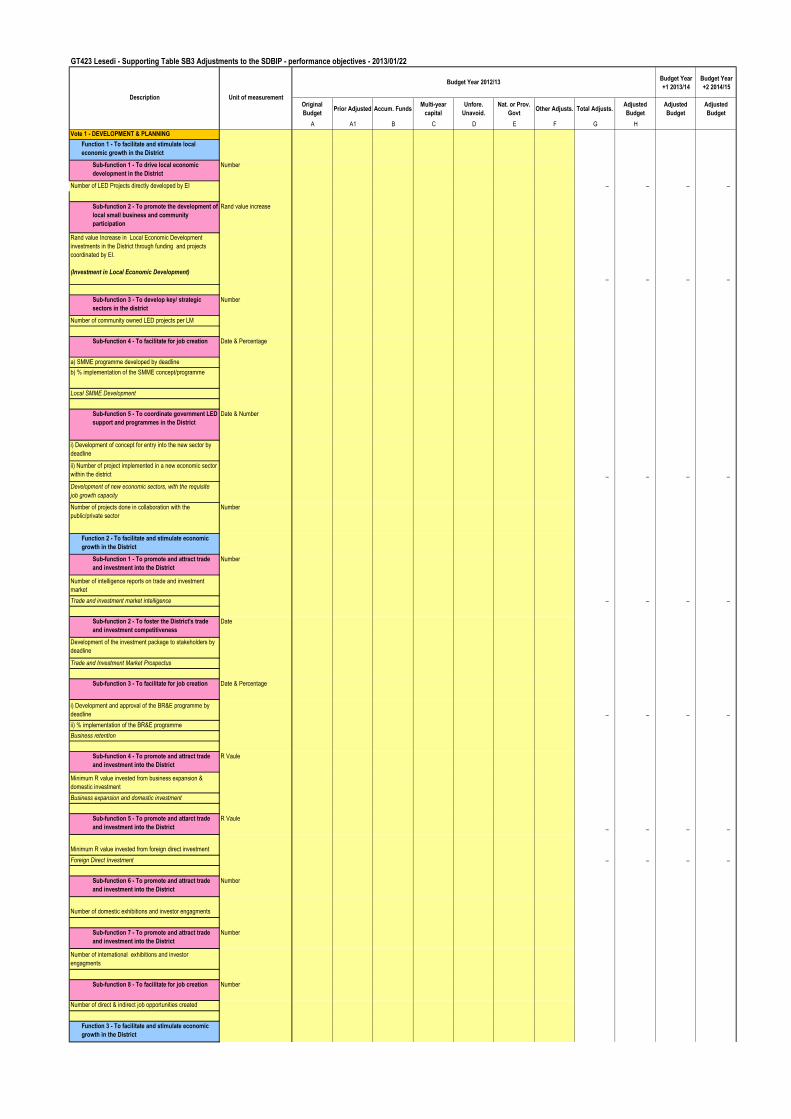
GT423 Lesedi - Supporting Table SB3 Adjustments to the SDBIP - performance objectives - 2013/01/22
Budget Year
+1 2013/14
Budget Year
+2 2014/15
Original
BudgetPrior Adjusted Accum. Funds
Multi-year
capital
Unfore.
Unavoid.
Nat. or Prov.
GovtOther Adjusts. Total Adjusts.
Adjusted
Budget
Adjusted
Budget
Adjusted
Budget
A A1 B C D E F G H
Vote 1 - DEVELOPMENT & PLANNING
Function 1 - To facilitate and stimulate local
economic growth in the District
Sub-function 1 - To drive local economic
development in the District
Number
Number of LED Projects directly developed by EI – – – –
Sub-function 2 - To promote the development of
local small business and community
participation
Rand value increase
Rand value Increase in Local Economic Development
investments in the District through funding and projects
coordinated by EI.
(Investment in Local Economic Development)– – – –
Sub-function 3 - To develop key/ strategic
sectors in the district
Number
Number of community owned LED projects per LM
Sub-function 4 - To facilitate for job creation Date & Percentage
a) SMME programme developed by deadline
b) % implementation of the SMME concept/programme
Local SMME Development
Sub-function 5 - To coordinate government LED
support and programmes in the District
Date & Number
i) Development of concept for entry into the new sector by
deadline
ii) Number of project implemented in a new economic sector
within the district – – – –
Development of new economic sectors, with the requisite
job growth capacity
Number of projects done in collaboration with the
public/private sector
Number
Function 2 - To facilitate and stimulate economic
growth in the District
Sub-function 1 - To promote and attract trade
and investment into the District
Number
Number of intelligence reports on trade and investment
market
Trade and investment market intelligence – – – –
Sub-function 2 - To foster the District's trade
and investment competitiveness
Date
Development of the investment package to stakeholders by
deadline
Trade and Investment Market Prospectus
Sub-function 3 - To facilitate for job creation Date & Percentage
i) Development and approval of the BR&E programme by
deadline – – – –
ii) % implementation of the BR&E programme
Business retention
Sub-function 4 - To promote and attract trade
and investment into the District
R Vaule
Minimum R value invested from business expansion &
domestic investment
Business expansion and domestic investment
Sub-function 5 - To promote and attarct trade
and investment into the District
R Vaule
– – – –
Minimum R value invested from foreign direct investment
Foreign Direct Investment – – – –
Sub-function 6 - To promote and attract trade
and investment into the District
Number
Number of domestic exhibitions and investor engagments
Sub-function 7 - To promote and attract trade
and investment into the District
Number
Number of international exhibitions and investor
engagments
Sub-function 8 - To facilitate for job creation Number
Number of direct & indirect job opportunities created
Function 3 - To facilitate and stimulate economic
growth in the District
Description Unit of measurement
Budget Year 2012/13
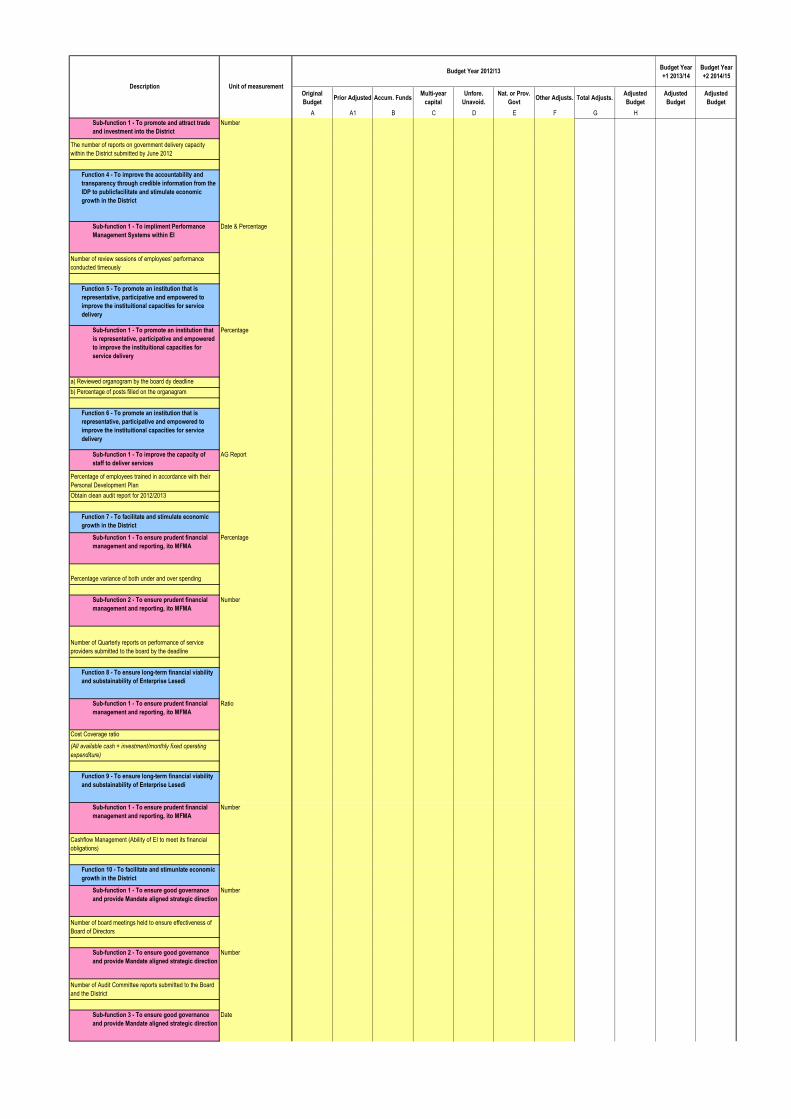
Budget Year
+1 2013/14
Budget Year
+2 2014/15
Original
BudgetPrior Adjusted Accum. Funds
Multi-year
capital
Unfore.
Unavoid.
Nat. or Prov.
GovtOther Adjusts. Total Adjusts.
Adjusted
Budget
Adjusted
Budget
Adjusted
Budget
A A1 B C D E F G H
Description Unit of measurement
Budget Year 2012/13
Sub-function 1 - To promote and attract trade
and investment into the District
Number
The number of reports on government delivery capacity
within the District submitted by June 2012
Function 4 - To improve the accountability and
transparency through credible information from the
IDP to publicfacilitate and stimulate economic
growth in the District
Sub-function 1 - To impliment Performance
Management Systems within EI
Date & Percentage
Number of review sessions of employees' performance
conducted timeously
Function 5 - To promote an institution that is
representative, participative and empowered to
improve the instituitional capacities for service
delivery
Sub-function 1 - To promote an institution that
is representative, participative and empowered
to improve the instituitional capacities for
service delivery
Percentage
a) Reviewed organogram by the board dy deadline
b) Percentage of posts filled on the organagram
Function 6 - To promote an institution that is
representative, participative and empowered to
improve the instituitional capacities for service
delivery
Sub-function 1 - To improve the capacity of
staff to deliver services
AG Report
Percentage of employees trained in accordance with their
Personal Development Plan
Obtain clean audit report for 2012/2013
Function 7 - To facilitate and stimulate economic
growth in the District
Sub-function 1 - To ensure prudent financial
management and reporting, ito MFMA
Percentage
Percentage variance of both under and over spending
Sub-function 2 - To ensure prudent financial
management and reporting, ito MFMA
Number
Number of Quarterly reports on performance of service
providers submitted to the board by the deadline
Function 8 - To ensure long-term financial viability
and substainability of Enterprise Lesedi
Sub-function 1 - To ensure prudent financial
management and reporting, ito MFMA
Ratio
Cost Coverage ratio
(All available cash + investment/monthly fixed operating
expenditure)
Function 9 - To ensure long-term financial viability
and substainability of Enterprise Lesedi
Sub-function 1 - To ensure prudent financial
management and reporting, ito MFMA
Number
Cashflow Management (Ability of EI to meet its financial
obligations)
Function 10 - To facilitate and stimunlate economic
growth in the District
Sub-function 1 - To ensure good governance
and provide Mandate aligned strategic direction
Number
Number of board meetings held to ensure effectiveness of
Board of Directors
Sub-function 2 - To ensure good governance
and provide Mandate aligned strategic direction
Number
Number of Audit Committee reports submitted to the Board
and the District
Sub-function 3 - To ensure good governance
and provide Mandate aligned strategic direction
Date
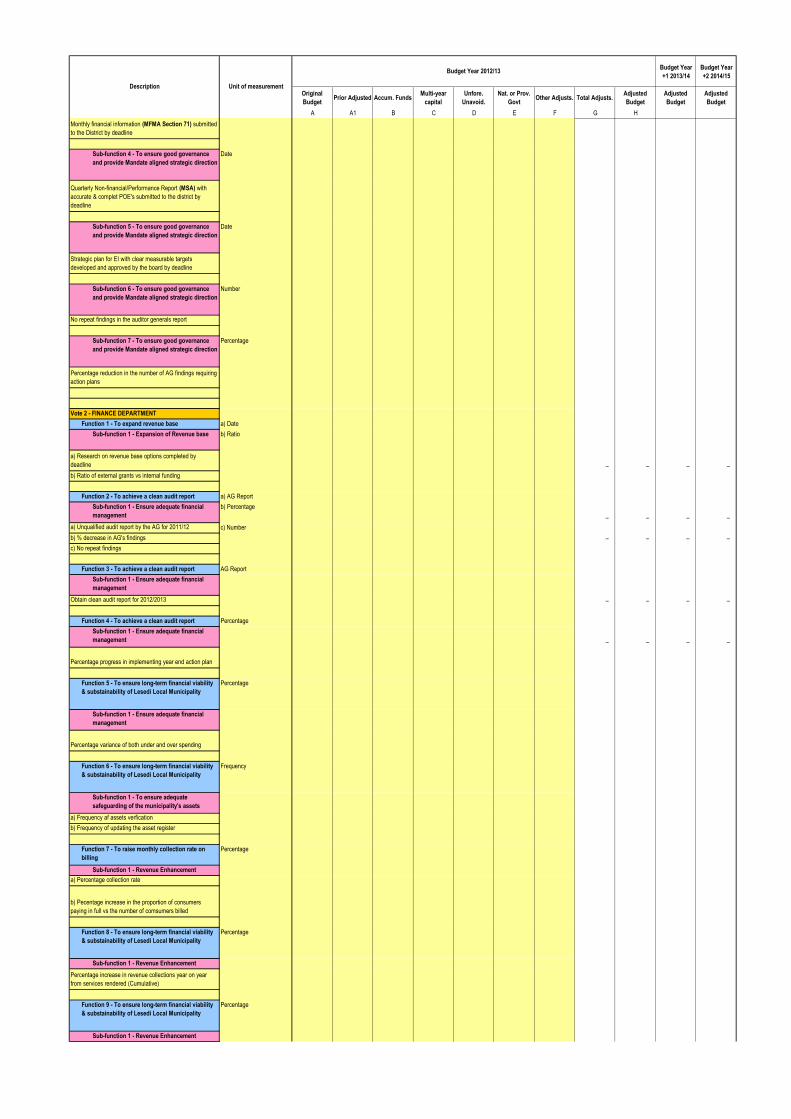
Budget Year
+1 2013/14
Budget Year
+2 2014/15
Original
BudgetPrior Adjusted Accum. Funds
Multi-year
capital
Unfore.
Unavoid.
Nat. or Prov.
GovtOther Adjusts. Total Adjusts.
Adjusted
Budget
Adjusted
Budget
Adjusted
Budget
A A1 B C D E F G H
Description Unit of measurement
Budget Year 2012/13
Monthly financial information (MFMA Section 71) submitted
to the District by deadline
Sub-function 4 - To ensure good governance
and provide Mandate aligned strategic direction
Date
Quarterly Non-financial/Performance Report (MSA) with
accurate & complet POE's submitted to the district by
deadline
Sub-function 5 - To ensure good governance
and provide Mandate aligned strategic direction
Date
Strategic plan for EI with clear measurable targets
developed and approved by the board by deadline
Sub-function 6 - To ensure good governance
and provide Mandate aligned strategic direction
Number
No repeat findings in the auditor generals report
Sub-function 7 - To ensure good governance
and provide Mandate aligned strategic direction
Percentage
Percentage reduction in the number of AG findings requiring
action plans
Vote 2 - FINANCE DEPARTMENT
Function 1 - To expand revenue base a) Date
Sub-function 1 - Expansion of Revenue base b) Ratio
a) Research on revenue base options completed by
deadline – – – –
b) Ratio of external grants vs internal funding
Function 2 - To achieve a clean audit report a) AG Report
Sub-function 1 - Ensure adequate financial
management
b) Percentage
– – – –
a) Unqualified audit report by the AG for 2011/12 c) Number
b) % decrease in AG's findings – – – –
c) No repeat findings
Function 3 - To achieve a clean audit report AG Report
Sub-function 1 - Ensure adequate financial
management
Obtain clean audit report for 2012/2013 – – – –
Function 4 - To achieve a clean audit report Percentage
Sub-function 1 - Ensure adequate financial
management – – – –
Percentage progress in implementing year end action plan
Function 5 - To ensure long-term financial viability
& substainability of Lesedi Local Municipality
Percentage
Sub-function 1 - Ensure adequate financial
management
Percentage variance of both under and over spending
Function 6 - To ensure long-term financial viability
& substainability of Lesedi Local Municipality
Frequency
Sub-function 1 - To ensure adequate
safeguarding of the municipality's assets
a) Frequency af assets verfication
b) Frequency of updating the asset register
Function 7 - To raise monthly collection rate on
billing
Percentage
Sub-function 1 - Revenue Enhancement
a) Percentage collection rate
b) Pecentage increase in the proportion of consumers
paying in full vs the number of comsumers billed
Function 8 - To ensure long-term financial viability
& substainability of Lesedi Local Municipality
Percentage
Sub-function 1 - Revenue Enhancement
Percentage increase in revenue collections year on year
from services rendered (Cumulative)
Function 9 - To ensure long-term financial viability
& substainability of Lesedi Local Municipality
Percentage
Sub-function 1 - Revenue Enhancement
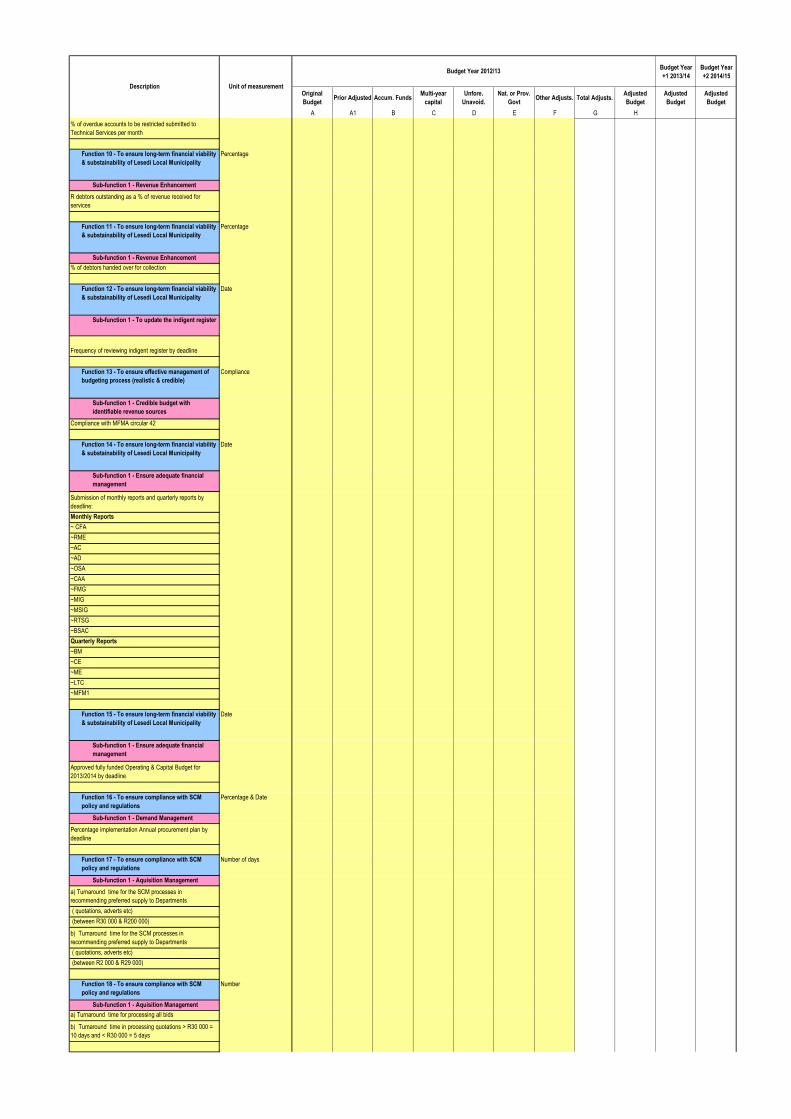
Budget Year
+1 2013/14
Budget Year
+2 2014/15
Original
BudgetPrior Adjusted Accum. Funds
Multi-year
capital
Unfore.
Unavoid.
Nat. or Prov.
GovtOther Adjusts. Total Adjusts.
Adjusted
Budget
Adjusted
Budget
Adjusted
Budget
A A1 B C D E F G H
Description Unit of measurement
Budget Year 2012/13
% of overdue accounts to be restricted submitted to
Technical Services per month
Function 10 - To ensure long-term financial viability
& substainability of Lesedi Local Municipality
Percentage
Sub-function 1 - Revenue Enhancement
R debtors outstanding as a % of revenue received for
services
Function 11 - To ensure long-term financial viability
& substainability of Lesedi Local Municipality
Percentage
Sub-function 1 - Revenue Enhancement
% of debtors handed over for collection
Function 12 - To ensure long-term financial viability
& substainability of Lesedi Local Municipality
Date
Sub-function 1 - To update the indigent register
Frequency of reviewing indigent register by deadline
Function 13 - To ensure effective management of
budgeting process (realistic & credible)
Compliance
Sub-function 1 - Credible budget with
identifiable revenue sources
Compliance with MFMA circular 42
Function 14 - To ensure long-term financial viability
& substainability of Lesedi Local Municipality
Date
Sub-function 1 - Ensure adequate financial
management
Submission of monthly reports and quarterly reports by
deadline:
Monthly Reports
~ CFA
~RME
~AC
~AD
~OSA
~CAA
~FMG
~MIG
~MSIG
~RTSG
~BSAC
Quarterly Reports
~BM
~CE
~ME
~LTC
~MFM1
Function 15 - To ensure long-term financial viability
& substainability of Lesedi Local Municipality
Date
Sub-function 1 - Ensure adequate financial
management
Approved fully funded Operating & Capital Budget for
2013/2014 by deadline
Function 16 - To ensure compliance with SCM
policy and regulations
Percentage & Date
Sub-function 1 - Demand Management
Percentage implementation Annual procurement plan by
deadline
Function 17 - To ensure compliance with SCM
policy and regulations
Number of days
Sub-function 1 - Aquisition Management
a) Turnaround time for the SCM processes in
recommending preferred supply to Departments
( quotations, adverts etc)
(between R30 000 & R200 000)
b) Turnaround time for the SCM processes in
recommending preferred supply to Departments
( quotations, adverts etc)
(between R2 000 & R29 000)
Function 18 - To ensure compliance with SCM
policy and regulations
Number
Sub-function 1 - Aquisition Management
a) Turnaround time for processing all bids
b) Turnaround time in processing quotations > R30 000 =
10 days and < R30 000 = 5 days
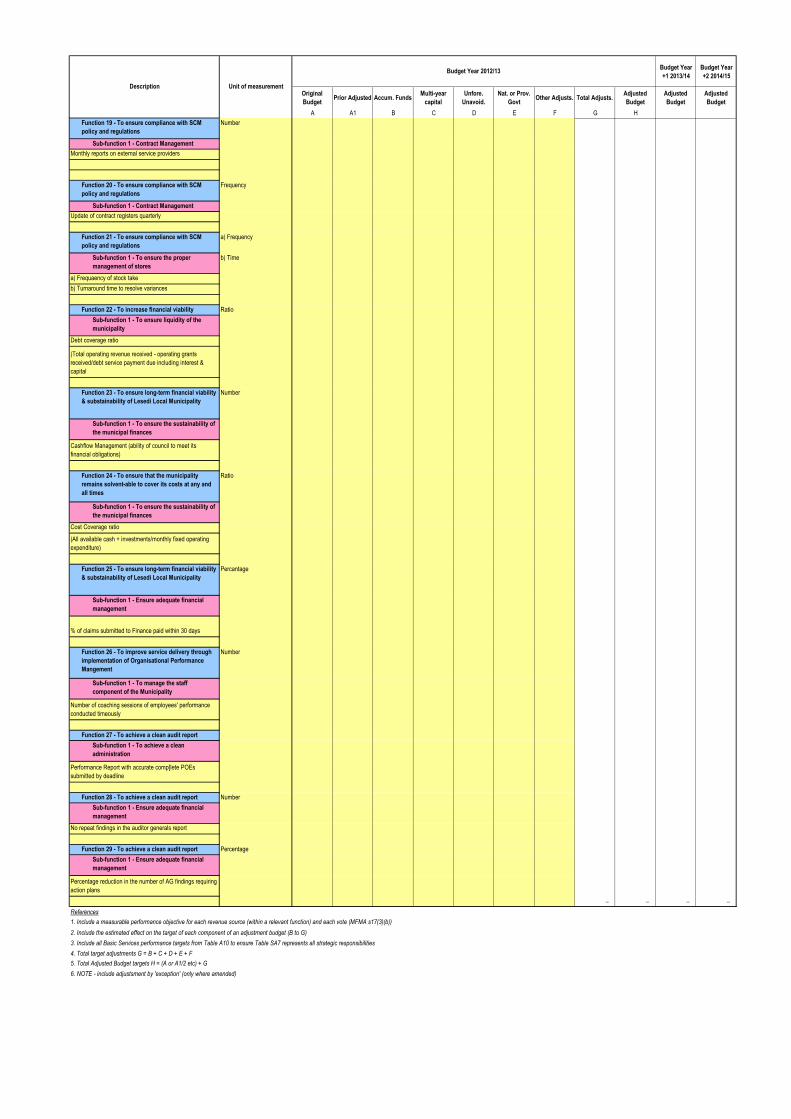
Budget Year
+1 2013/14
Budget Year
+2 2014/15
Original
BudgetPrior Adjusted Accum. Funds
Multi-year
capital
Unfore.
Unavoid.
Nat. or Prov.
GovtOther Adjusts. Total Adjusts.
Adjusted
Budget
Adjusted
Budget
Adjusted
Budget
A A1 B C D E F G H
Description Unit of measurement
Budget Year 2012/13
Function 19 - To ensure compliance with SCM
policy and regulations
Number
Sub-function 1 - Contract Management
Monthly reports on external service providers
Function 20 - To ensure compliance with SCM
policy and regulations
Frequency
Sub-function 1 - Contract Management
Update of contract registers quarterly
Function 21 - To ensure compliance with SCM
policy and regulations
a) Frequency
Sub-function 1 - To ensure the proper
management of stores
b) Time
a) Frequaency of stock take
b) Turnaround time to resolve variances
Function 22 - To increase financial viability Ratio
Sub-function 1 - To ensure liquidity of the
municipality
Debt coverage ratio
(Total operating revenue received - operating grants
received/debt service payment due including interest &
capital
Function 23 - To ensure long-term financial viability
& substainability of Lesedi Local Municipality
Number
Sub-function 1 - To ensure the sustainability of
the municipal finances
Cashflow Management (ability of council to meet its
financial obligations)
Function 24 - To ensure that the municipality
remains solvent-able to cover its costs at any and
all times
Ratio
Sub-function 1 - To ensure the sustainability of
the municipal finances
Cost Coverage ratio
(All available cash + investments/monthly fixed operating
expenditure)
Function 25 - To ensure long-term financial viability
& substainability of Lesedi Local Municipality
Percantage
Sub-function 1 - Ensure adequate financial
management
% of claims submitted to Finance paid within 30 days
Function 26 - To improve service delivery through
implementation of Organisational Performance
Mangement
Number
Sub-function 1 - To manage the staff
component of the Municipality
Number of coaching sessions of employees' performance
conducted timeously
Function 27 - To achieve a clean audit report
Sub-function 1 - To achieve a clean
administration
Performance Report with accurate comp[lete POEs
submitted by deadline
Function 28 - To achieve a clean audit report Number
Sub-function 1 - Ensure adequate financial
management
No repeat findings in the auditor generals report
Function 29 - To achieve a clean audit report Percentage
Sub-function 1 - Ensure adequate financial
management
Percentage reduction in the number of AG findings requiring
action plans
– – – –
References
2. Include the estimated effect on the target of each component of an adjustment budget (B to G)
3. Include all Basic Services performance targets from Table A10 to ensure Table SA7 represents all strategic responsibilities
4. Total target adjustments G = B + C + D + E + F
6. NOTE - include adjustsment by 'exception' (only where amended)
1. Include a measurable performance objective for each revenue source (within a relevant function) and each vote (MFMA s17(3)(b))
5. Total Adjusted Budget targets H = (A or A1/2 etc) + G
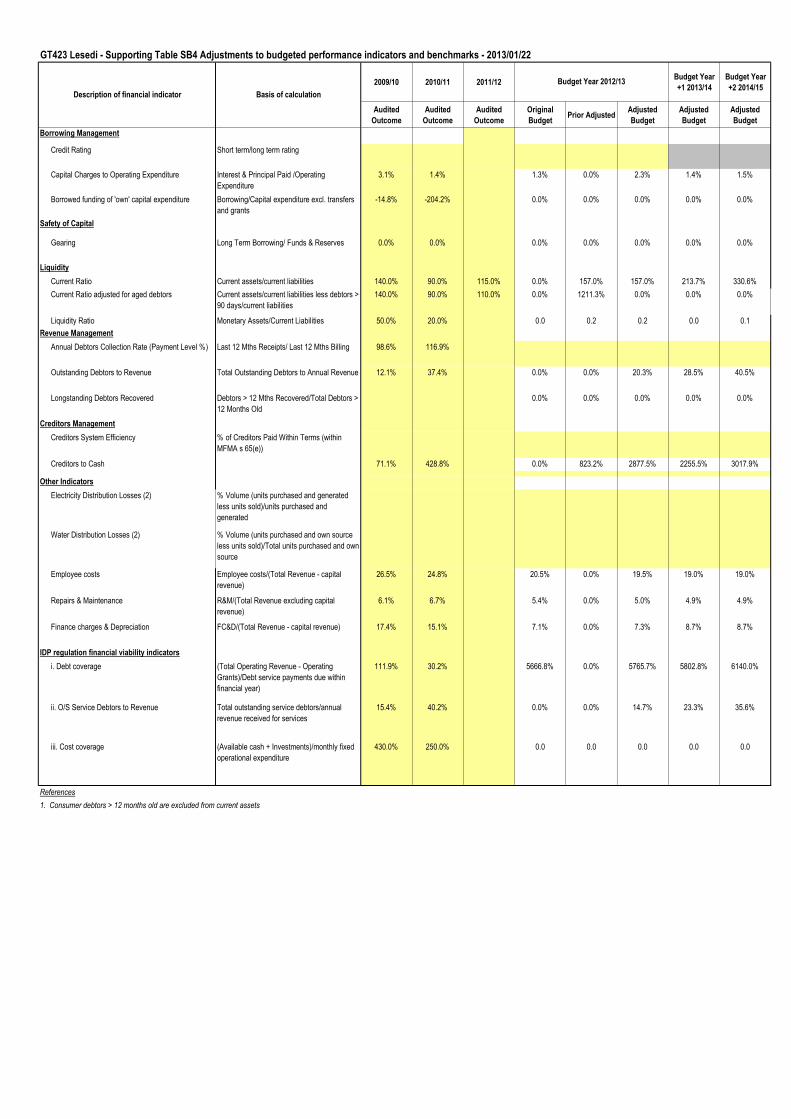
GT423 Lesedi - Supporting Table SB4 Adjustments to budgeted performance indicators and benchmarks - 2013/01/22
2009/10 2010/11 2011/12Budget Year
+1 2013/14
Budget Year
+2 2014/15
Audited
Outcome
Audited
Outcome
Audited
Outcome
Original
BudgetPrior Adjusted
Adjusted
Budget
Adjusted
Budget
Adjusted
Budget
Borrowing Management
Credit Rating Short term/long term rating
Capital Charges to Operating Expenditure Interest & Principal Paid /Operating
Expenditure
3.1% 1.4% 1.3% 0.0% 2.3% 1.4% 1.5%
Borrowed funding of 'own' capital expenditure Borrowing/Capital expenditure excl. transfers
and grants
-14.8% -204.2% 0.0% 0.0% 0.0% 0.0% 0.0%
Safety of Capital
Gearing Long Term Borrowing/ Funds & Reserves 0.0% 0.0% 0.0% 0.0% 0.0% 0.0% 0.0%
Liquidity
Current Ratio Current assets/current liabilities 140.0% 90.0% 115.0% 0.0% 157.0% 157.0% 213.7% 330.6%
Current Ratio adjusted for aged debtors Current assets/current liabilities less debtors >
90 days/current liabilities
140.0% 90.0% 110.0% 0.0% 1211.3% 0.0% 0.0% 0.0%
Liquidity Ratio Monetary Assets/Current Liabilities 50.0% 20.0% 0.0 0.2 0.2 0.0 0.1
Revenue Management
Annual Debtors Collection Rate (Payment Level %) Last 12 Mths Receipts/ Last 12 Mths Billing 98.6% 116.9%
Outstanding Debtors to Revenue Total Outstanding Debtors to Annual Revenue 12.1% 37.4% 0.0% 0.0% 20.3% 28.5% 40.5%
Longstanding Debtors Recovered Debtors > 12 Mths Recovered/Total Debtors >
12 Months Old
0.0% 0.0% 0.0% 0.0% 0.0%
Creditors Management
Creditors System Efficiency % of Creditors Paid Within Terms (within
MFMA s 65(e))
Creditors to Cash 71.1% 428.8% 0.0% 823.2% 2877.5% 2255.5% 3017.9%
Other Indicators
Electricity Distribution Losses (2) % Volume (units purchased and generated
less units sold)/units purchased and
generated
Water Distribution Losses (2) % Volume (units purchased and own source
less units sold)/Total units purchased and own
source
Employee costs Employee costs/(Total Revenue - capital
revenue)
26.5% 24.8% 20.5% 0.0% 19.5% 19.0% 19.0%
Repairs & Maintenance R&M/(Total Revenue excluding capital
revenue)
6.1% 6.7% 5.4% 0.0% 5.0% 4.9% 4.9%
Finance charges & Depreciation FC&D/(Total Revenue - capital revenue) 17.4% 15.1% 7.1% 0.0% 7.3% 8.7% 8.7%
IDP regulation financial viability indicators
i. Debt coverage (Total Operating Revenue - Operating
Grants)/Debt service payments due within
financial year)
111.9% 30.2% 5666.8% 0.0% 5765.7% 5802.8% 6140.0%
ii. O/S Service Debtors to Revenue Total outstanding service debtors/annual
revenue received for services
15.4% 40.2% 0.0% 0.0% 14.7% 23.3% 35.6%
iii. Cost coverage (Available cash + Investments)/monthly fixed
operational expenditure
430.0% 250.0% 0.0 0.0 0.0 0.0 0.0
References
1. Consumer debtors > 12 months old are excluded from current assets
Description of financial indicator Basis of calculation
Budget Year 2012/13
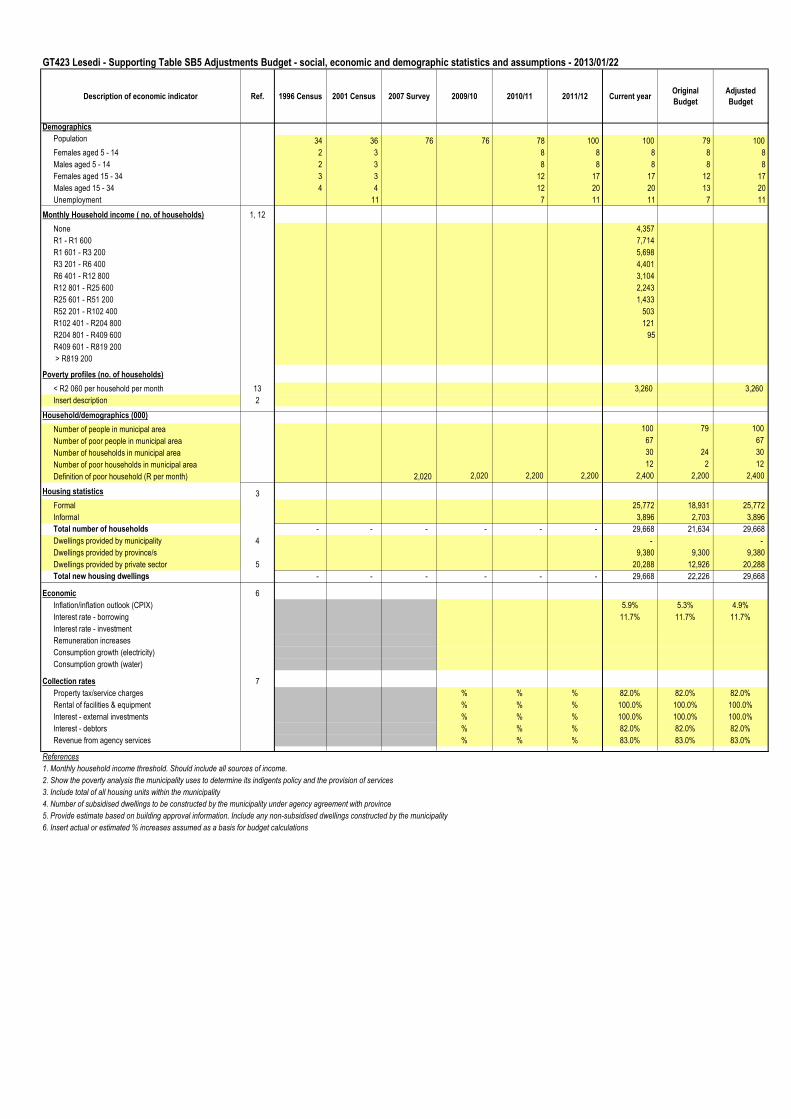
GT423 Lesedi - Supporting Table SB5 Adjustments Budget - social, economic and demographic statistics and assumptions - 2013/01/22
Description of economic indicator Ref. 1996 Census 2001 Census 2007 Survey 2009/10 2010/11 2011/12 Current yearOriginal
Budget
Adjusted
Budget
Demographics
Population 34 36 76 76 78 100 100 79 100
Females aged 5 - 14 2 3 8 8 8 8 8
Males aged 5 - 14 2 3 8 8 8 8 8
Females aged 15 - 34 3 3 12 17 17 12 17
Males aged 15 - 34 4 4 12 20 20 13 20
Unemployment 11 7 11 11 7 11
Monthly Household income ( no. of households) 1, 12
None 4,357
R1 - R1 600 7,714
R1 601 - R3 200 5,698
R3 201 - R6 400 4,401
R6 401 - R12 800 3,104
R12 801 - R25 600 2,243
R25 601 - R51 200 1,433
R52 201 - R102 400 503
R102 401 - R204 800 121
R204 801 - R409 600 95
R409 601 - R819 200
> R819 200
Poverty profiles (no. of households)
< R2 060 per household per month 13 3,260 3,260
Insert description 2
Household/demographics (000)
Number of people in municipal area 100 79 100
Number of poor people in municipal area 67 67
Number of households in municipal area 30 24 30
Number of poor households in municipal area 12 2 12
Definition of poor household (R per month) 2,020 2,020 2,200 2,200 2,400 2,200 2,400
Housing statistics 3
Formal 25,772 18,931 25,772
Informal 3,896 2,703 3,896
Total number of households - - - - - - 29,668 21,634 29,668
Dwellings provided by municipality 4 - -
Dwellings provided by province/s 9,380 9,300 9,380
Dwellings provided by private sector 5 20,288 12,926 20,288
Total new housing dwellings - - - - - - 29,668 22,226 29,668
Economic 6
Inflation/inflation outlook (CPIX) 5.9% 5.3% 4.9%
Interest rate - borrowing 11.7% 11.7% 11.7%
Interest rate - investment
Remuneration increases
Consumption growth (electricity)
Consumption growth (water)
Collection rates 7
Property tax/service charges % % % 82.0% 82.0% 82.0%
Rental of facilities & equipment % % % 100.0% 100.0% 100.0%
Interest - external investments % % % 100.0% 100.0% 100.0%
Interest - debtors % % % 82.0% 82.0% 82.0%
Revenue from agency services % % % 83.0% 83.0% 83.0%
References
1. Monthly household income threshold. Should include all sources of income.
2. Show the poverty analysis the municipality uses to determine its indigents policy and the provision of services
3. Include total of all housing units within the municipality
4. Number of subsidised dwellings to be constructed by the municipality under agency agreement with province
5. Provide estimate based on building approval information. Include any non-subsidised dwellings constructed by the municipality
6. Insert actual or estimated % increases assumed as a basis for budget calculations
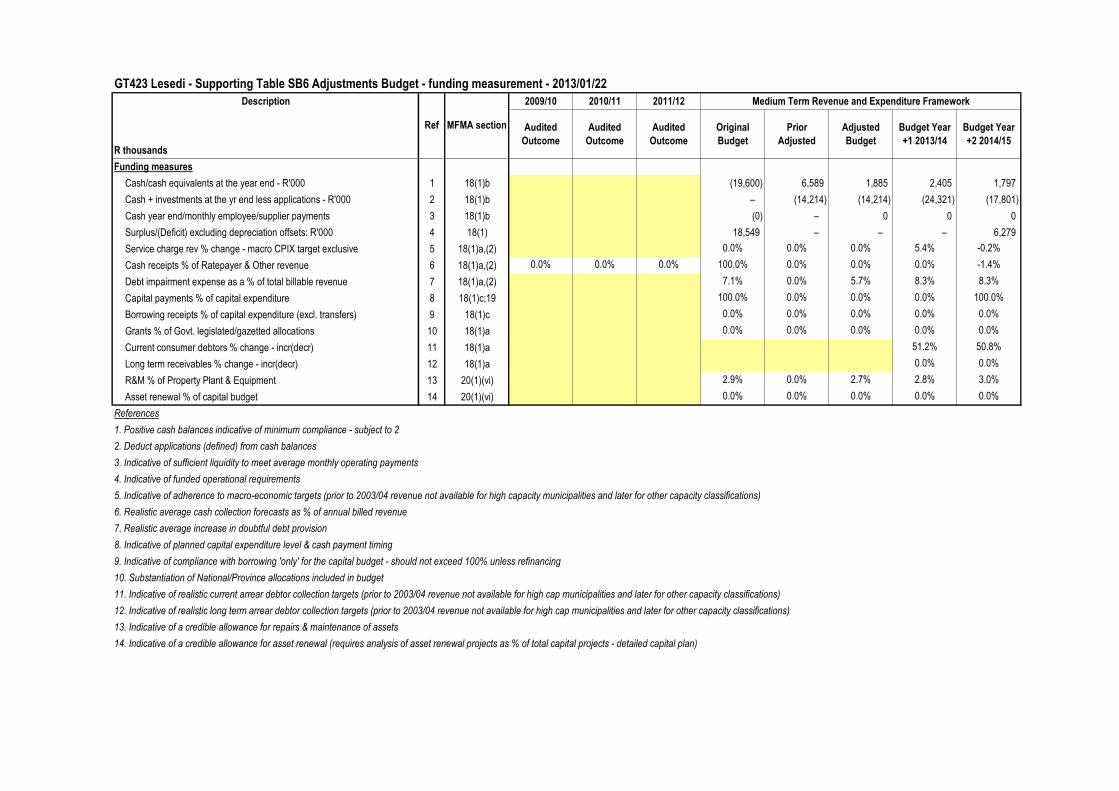
GT423 Lesedi - Supporting Table SB6 Adjustments Budget - funding measurement - 2013/01/22
Description 2009/10 2010/11 2011/12 Medium Term Revenue and Expenditure Framework
R thousands
Audited
Outcome
Audited
Outcome
Audited
Outcome
Original
Budget
Prior
Adjusted
Adjusted
Budget
Budget Year
+1 2013/14
Budget Year
+2 2014/15
Funding measures
Cash/cash equivalents at the year end - R'000 1 18(1)b (19,600) 6,589 1,885 2,405 1,797
Cash + investments at the yr end less applications - R'000 2 18(1)b – (14,214) (14,214) (24,321) (17,801)
Cash year end/monthly employee/supplier payments 3 18(1)b (0) – 0 0 0
Surplus/(Deficit) excluding depreciation offsets: R'000 4 18(1) 18,549 – – – 6,279
Service charge rev % change - macro CPIX target exclusive 5 18(1)a,(2) 0.0% 0.0% 0.0% 5.4% -0.2%
Cash receipts % of Ratepayer & Other revenue 6 18(1)a,(2) 0.0% 0.0% 0.0% 100.0% 0.0% 0.0% 0.0% -1.4%
Debt impairment expense as a % of total billable revenue 7 18(1)a,(2) 7.1% 0.0% 5.7% 8.3% 8.3%
Capital payments % of capital expenditure 8 18(1)c;19 100.0% 0.0% 0.0% 0.0% 100.0%
Borrowing receipts % of capital expenditure (excl. transfers) 9 18(1)c 0.0% 0.0% 0.0% 0.0% 0.0%
Grants % of Govt. legislated/gazetted allocations 10 18(1)a 0.0% 0.0% 0.0% 0.0% 0.0%
Current consumer debtors % change - incr(decr) 11 18(1)a 51.2% 50.8%
Long term receivables % change - incr(decr) 12 18(1)a 0.0% 0.0%
R&M % of Property Plant & Equipment 13 20(1)(vi) 2.9% 0.0% 2.7% 2.8% 3.0%
Asset renewal % of capital budget 14 20(1)(vi) 0.0% 0.0% 0.0% 0.0% 0.0%
References
1. Positive cash balances indicative of minimum compliance - subject to 2
2. Deduct applications (defined) from cash balances
3. Indicative of sufficient liquidity to meet average monthly operating payments
4. Indicative of funded operational requirements
5. Indicative of adherence to macro-economic targets (prior to 2003/04 revenue not available for high capacity municipalities and later for other capacity classifications)
6. Realistic average cash collection forecasts as % of annual billed revenue
7. Realistic average increase in doubtful debt provision
8. Indicative of planned capital expenditure level & cash payment timing
9. Indicative of compliance with borrowing 'only' for the capital budget - should not exceed 100% unless refinancing
10. Substantiation of National/Province allocations included in budget
11. Indicative of realistic current arrear debtor collection targets (prior to 2003/04 revenue not available for high cap municipalities and later for other capacity classifications)
12. Indicative of realistic long term arrear debtor collection targets (prior to 2003/04 revenue not available for high cap municipalities and later for other capacity classifications)
13. Indicative of a credible allowance for repairs & maintenance of assets
14. Indicative of a credible allowance for asset renewal (requires analysis of asset renewal projects as % of total capital projects - detailed capital plan)
Ref MFMA section
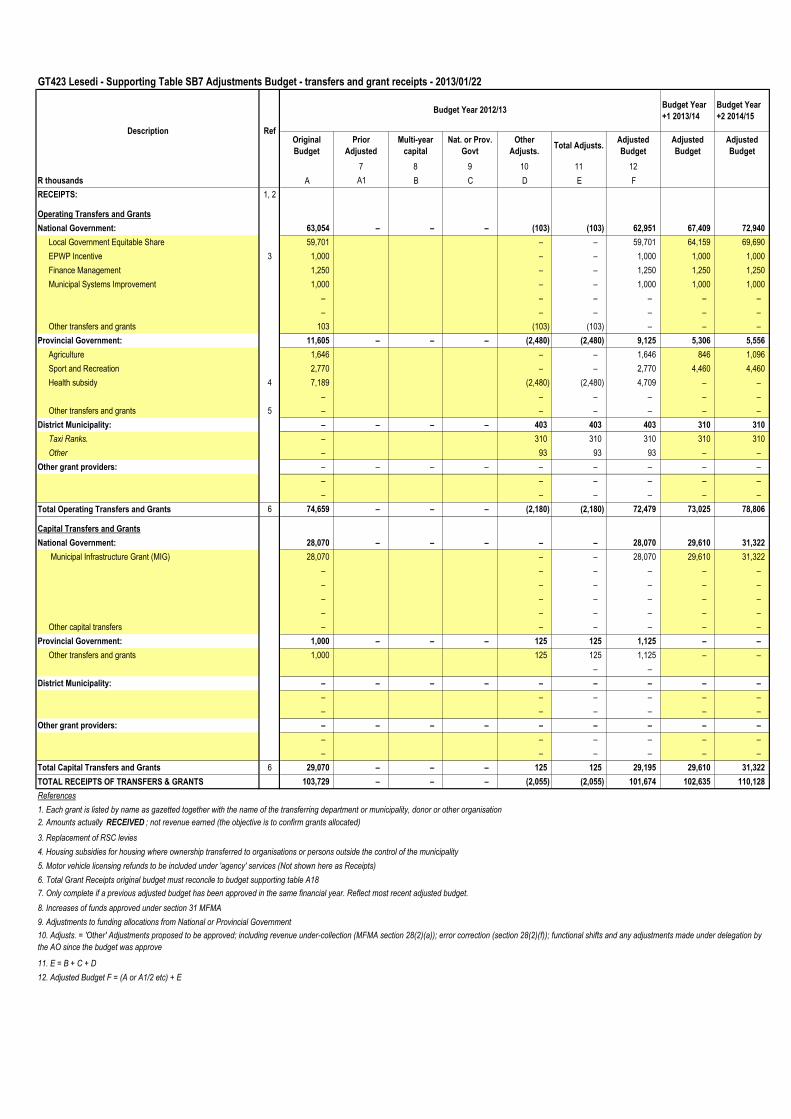
GT423 Lesedi - Supporting Table SB7 Adjustments Budget - transfers and grant receipts - 2013/01/22
Budget Year
+1 2013/14
Budget Year
+2 2014/15
Original
Budget
Prior
Adjusted
Multi-year
capital
Nat. or Prov.
Govt
Other
Adjusts.Total Adjusts.
Adjusted
Budget
Adjusted
Budget
Adjusted
Budget
7 8 9 10 11 12
R thousands A A1 B C D E F
RECEIPTS: 1, 2
Operating Transfers and Grants
National Government: 63,054 – – – (103) (103) 62,951 67,409 72,940
Local Government Equitable Share 59,701 – – 59,701 64,159 69,690
EPWP Incentive 3 1,000 – – 1,000 1,000 1,000
Finance Management 1,250 – – 1,250 1,250 1,250
Municipal Systems Improvement 1,000 – – 1,000 1,000 1,000
– – – – – –
– – – – – –
Other transfers and grants 103 (103) (103) – – –
Provincial Government: 11,605 – – – (2,480) (2,480) 9,125 5,306 5,556
Agriculture 1,646 – – 1,646 846 1,096
Sport and Recreation 2,770 – – 2,770 4,460 4,460
Health subsidy 4 7,189 (2,480) (2,480) 4,709 – –
– – – – – –
Other transfers and grants 5 – – – – – –
District Municipality: – – – – 403 403 403 310 310
Taxi Ranks. – 310 310 310 310 310
Other – 93 93 93 – –
Other grant providers: – – – – – – – – –
– – – – – –
– – – – – –
Total Operating Transfers and Grants 6 74,659 – – – (2,180) (2,180) 72,479 73,025 78,806
Capital Transfers and Grants
National Government: 28,070 – – – – – 28,070 29,610 31,322
Municipal Infrastructure Grant (MIG) 28,070 – – 28,070 29,610 31,322
– – – – – –
– – – – – –
– – – – – –
– – – – – –
Other capital transfers – – – – – –
Provincial Government: 1,000 – – – 125 125 1,125 – –
Other transfers and grants 1,000 125 125 1,125 – –
– –
District Municipality: – – – – – – – – –
– – – – – –
– – – – – –
Other grant providers: – – – – – – – – –
– – – – – –
– – – – – –
Total Capital Transfers and Grants 6 29,070 – – – 125 125 29,195 29,610 31,322
TOTAL RECEIPTS OF TRANSFERS & GRANTS 103,729 – – – (2,055) (2,055) 101,674 102,635 110,128
References
1. Each grant is listed by name as gazetted together with the name of the transferring department or municipality, donor or other organisation
2. Amounts actually RECEIVED ; not revenue earned (the objective is to confirm grants allocated)
3. Replacement of RSC levies
4. Housing subsidies for housing where ownership transferred to organisations or persons outside the control of the municipality
5. Motor vehicle licensing refunds to be included under 'agency' services (Not shown here as Receipts)
6. Total Grant Receipts original budget must reconcile to budget supporting table A18
8. Increases of funds approved under section 31 MFMA
9. Adjustments to funding allocations from National or Provincial Government
11. E = B + C + D
12. Adjusted Budget F = (A or A1/2 etc) + E
10. Adjusts. = 'Other' Adjustments proposed to be approved; including revenue under-collection (MFMA section 28(2)(a)); error correction (section 28(2)(f)); functional shifts and any adjustments made under delegation by
the AO since the budget was approve
7. Only complete if a previous adjusted budget has been approved in the same financial year. Reflect most recent adjusted budget.
Description Ref
Budget Year 2012/13
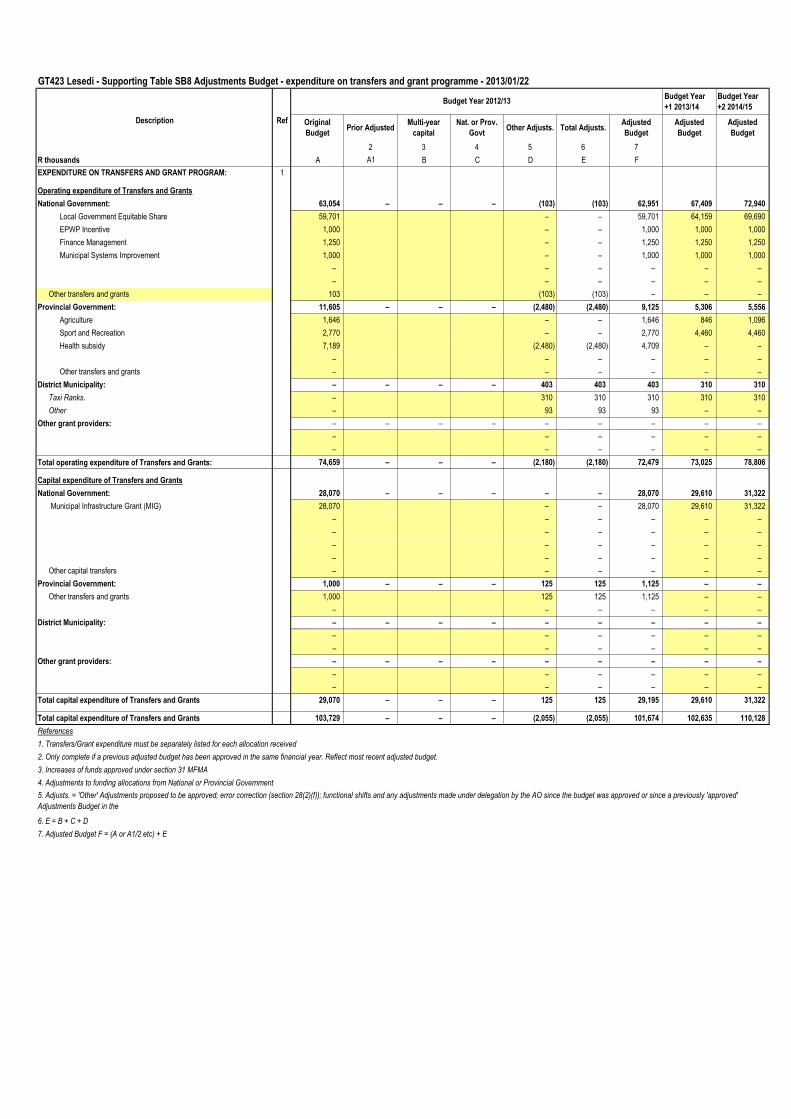
GT423 Lesedi - Supporting Table SB8 Adjustments Budget - expenditure on transfers and grant programme - 2013/01/22
Budget Year
+1 2013/14
Budget Year
+2 2014/15
Original
BudgetPrior Adjusted
Multi-year
capital
Nat. or Prov.
GovtOther Adjusts. Total Adjusts.
Adjusted
Budget
Adjusted
Budget
Adjusted
Budget
2 3 4 5 6 7
R thousands A A1 B C D E F
EXPENDITURE ON TRANSFERS AND GRANT PROGRAM: 1
Operating expenditure of Transfers and Grants
National Government: 63,054 – – – (103) (103) 62,951 67,409 72,940
Local Government Equitable Share 59,701 – – 59,701 64,159 69,690
EPWP Incentive 1,000 – – 1,000 1,000 1,000
Finance Management 1,250 – – 1,250 1,250 1,250
Municipal Systems Improvement 1,000 – – 1,000 1,000 1,000
– – – – – –
– – – – – –
Other transfers and grants 103 (103) (103) – – –
Provincial Government: 11,605 – – – (2,480) (2,480) 9,125 5,306 5,556
Agriculture 1,646 – – 1,646 846 1,096
Sport and Recreation 2,770 – – 2,770 4,460 4,460
Health subsidy 7,189 (2,480) (2,480) 4,709 – –
– – – – – –
Other transfers and grants – – – – – –
District Municipality: – – – – 403 403 403 310 310
Taxi Ranks. – 310 310 310 310 310
Other – 93 93 93 – –
Other grant providers: – – – – – – – – –
– – – – – –
– – – – – –
Total operating expenditure of Transfers and Grants: 74,659 – – – (2,180) (2,180) 72,479 73,025 78,806
Capital expenditure of Transfers and Grants
National Government: 28,070 – – – – – 28,070 29,610 31,322
Municipal Infrastructure Grant (MIG) 28,070 – – 28,070 29,610 31,322
– – – – – –
– – – – – –
– – – – – –
– – – – – –
Other capital transfers – – – – – –
Provincial Government: 1,000 – – – 125 125 1,125 – –
Other transfers and grants 1,000 125 125 1,125 – –
– – – – – –
District Municipality: – – – – – – – – –
– – – – – –
– – – – – –
Other grant providers: – – – – – – – – –
– – – – – –
– – – – – –
Total capital expenditure of Transfers and Grants 29,070 – – – 125 125 29,195 29,610 31,322
Total capital expenditure of Transfers and Grants 103,729 – – – (2,055) (2,055) 101,674 102,635 110,128
References
1. Transfers/Grant expenditure must be separately listed for each allocation received
2. Only complete if a previous adjusted budget has been approved in the same financial year. Reflect most recent adjusted budget.
3. Increases of funds approved under section 31 MFMA
4. Adjustments to funding allocations from National or Provincial Government
6. E = B + C + D
7. Adjusted Budget F = (A or A1/2 etc) + E
5. Adjusts. = 'Other' Adjustments proposed to be approved; error correction (section 28(2)(f)); functional shifts and any adjustments made under delegation by the AO since the budget was approved or since a previously 'approved'
Adjustments Budget in the
Description Ref
Budget Year 2012/13
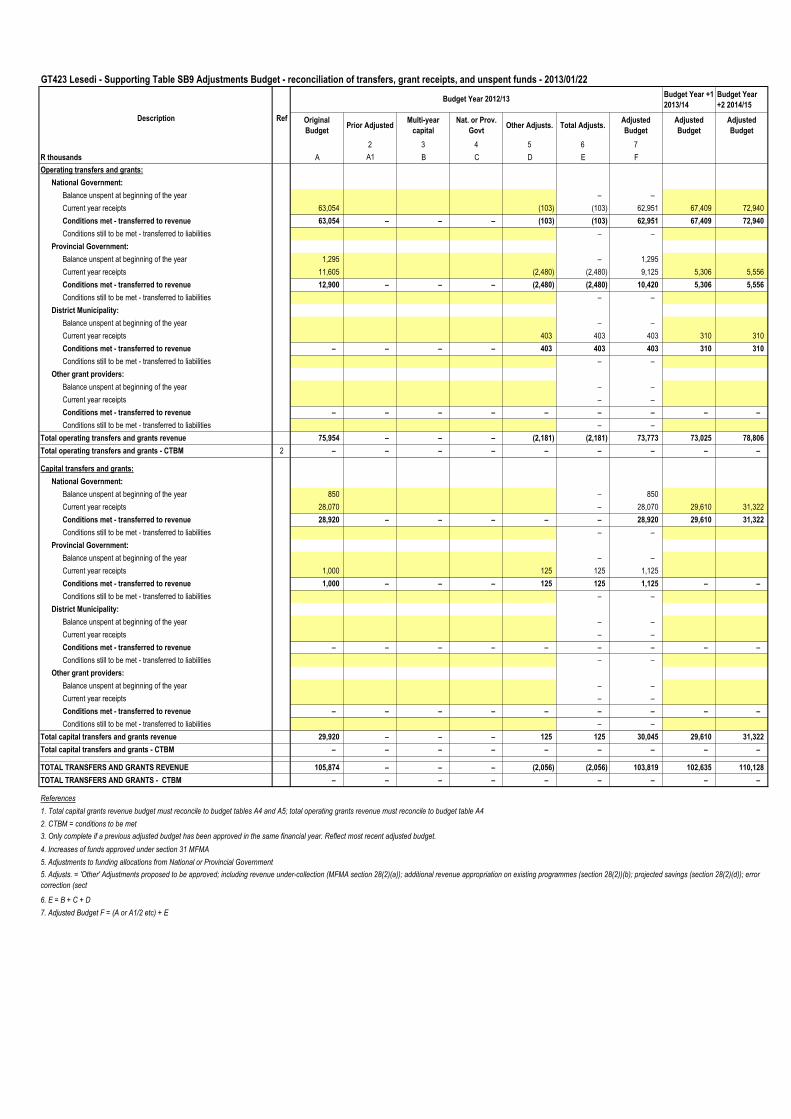
GT423 Lesedi - Supporting Table SB9 Adjustments Budget - reconciliation of transfers, grant receipts, and unspent funds - 2013/01/22
Budget Year +1
2013/14
Budget Year
+2 2014/15
Original
BudgetPrior Adjusted
Multi-year
capital
Nat. or Prov.
GovtOther Adjusts. Total Adjusts.
Adjusted
Budget
Adjusted
Budget
Adjusted
Budget
2 3 4 5 6 7
R thousands A A1 B C D E F
Operating transfers and grants:
National Government:
Balance unspent at beginning of the year – –
Current year receipts 63,054 (103) (103) 62,951 67,409 72,940
Conditions met - transferred to revenue 63,054 – – – (103) (103) 62,951 67,409 72,940
Conditions still to be met - transferred to liabilities – –
Provincial Government:
Balance unspent at beginning of the year 1,295 – 1,295
Current year receipts 11,605 (2,480) (2,480) 9,125 5,306 5,556
Conditions met - transferred to revenue 12,900 – – – (2,480) (2,480) 10,420 5,306 5,556
Conditions still to be met - transferred to liabilities – –
District Municipality:
Balance unspent at beginning of the year – –
Current year receipts 403 403 403 310 310
Conditions met - transferred to revenue – – – – 403 403 403 310 310
Conditions still to be met - transferred to liabilities – –
Other grant providers:
Balance unspent at beginning of the year – –
Current year receipts – –
Conditions met - transferred to revenue – – – – – – – – –
Conditions still to be met - transferred to liabilities – –
Total operating transfers and grants revenue 75,954 – – – (2,181) (2,181) 73,773 73,025 78,806
Total operating transfers and grants - CTBM 2 – – – – – – – – –
Capital transfers and grants:
National Government:
Balance unspent at beginning of the year 850 – 850
Current year receipts 28,070 – 28,070 29,610 31,322
Conditions met - transferred to revenue 28,920 – – – – – 28,920 29,610 31,322
Conditions still to be met - transferred to liabilities – –
Provincial Government:
Balance unspent at beginning of the year – –
Current year receipts 1,000 125 125 1,125
Conditions met - transferred to revenue 1,000 – – – 125 125 1,125 – –
Conditions still to be met - transferred to liabilities – –
District Municipality:
Balance unspent at beginning of the year – –
Current year receipts – –
Conditions met - transferred to revenue – – – – – – – – –
Conditions still to be met - transferred to liabilities – –
Other grant providers:
Balance unspent at beginning of the year – –
Current year receipts – –
Conditions met - transferred to revenue – – – – – – – – –
Conditions still to be met - transferred to liabilities – –
Total capital transfers and grants revenue 29,920 – – – 125 125 30,045 29,610 31,322
Total capital transfers and grants - CTBM – – – – – – – – –
TOTAL TRANSFERS AND GRANTS REVENUE 105,874 – – – (2,056) (2,056) 103,819 102,635 110,128
TOTAL TRANSFERS AND GRANTS - CTBM – – – – – – – – –
References
1. Total capital grants revenue budget must reconcile to budget tables A4 and A5; total operating grants revenue must reconcile to budget table A4
2. CTBM = conditions to be met
4. Increases of funds approved under section 31 MFMA
5. Adjustments to funding allocations from National or Provincial Government
6. E = B + C + D
7. Adjusted Budget F = (A or A1/2 etc) + E
3. Only complete if a previous adjusted budget has been approved in the same financial year. Reflect most recent adjusted budget.
5. Adjusts. = 'Other' Adjustments proposed to be approved; including revenue under-collection (MFMA section 28(2)(a)); additional revenue appropriation on existing programmes (section 28(2))(b); projected savings (section 28(2)(d)); error
correction (sect
Budget Year 2012/13
Description Ref
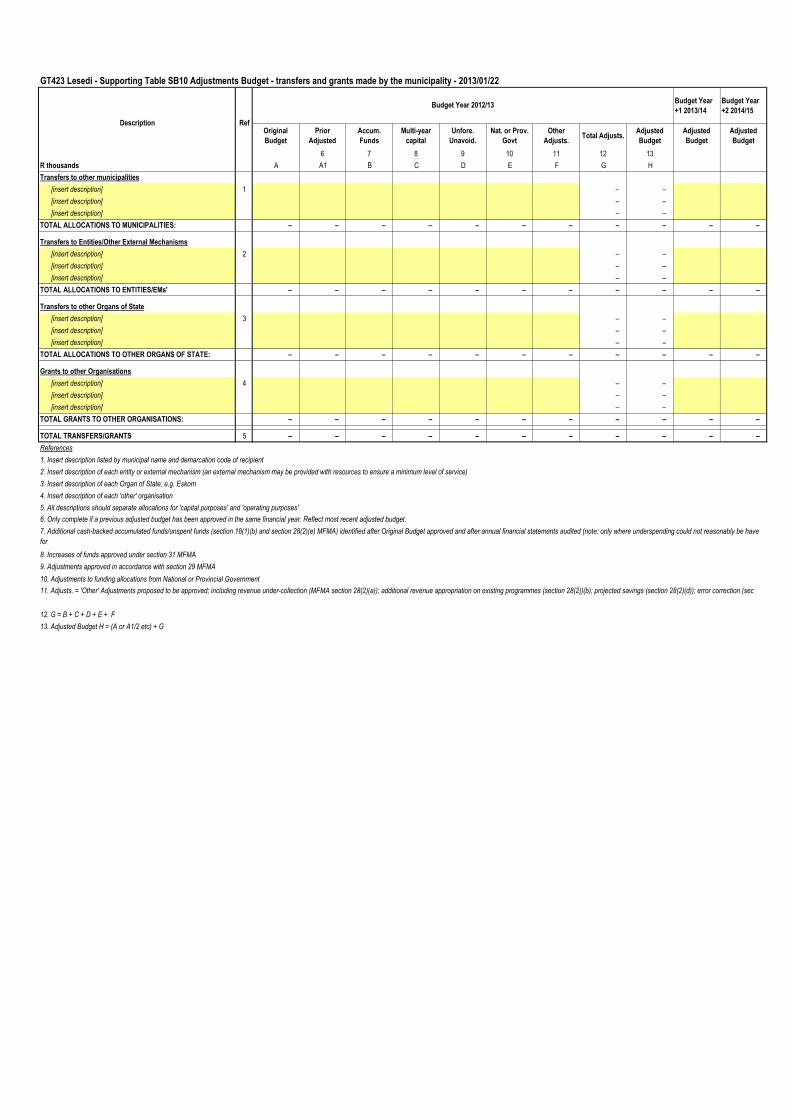
GT423 Lesedi - Supporting Table SB10 Adjustments Budget - transfers and grants made by the municipality - 2013/01/22
Budget Year
+1 2013/14
Budget Year
+2 2014/15
Original
Budget
Prior
Adjusted
Accum.
Funds
Multi-year
capital
Unfore.
Unavoid.
Nat. or Prov.
Govt
Other
Adjusts.Total Adjusts.
Adjusted
Budget
Adjusted
Budget
Adjusted
Budget
6 7 8 9 10 11 12 13
R thousands A A1 B C D E F G H
Transfers to other municipalities
[insert description] 1 – –
[insert description] – –
[insert description] – –
TOTAL ALLOCATIONS TO MUNICIPALITIES: – – – – – – – – – – –
Transfers to Entities/Other External Mechanisms
[insert description] 2 – –
[insert description] – –
[insert description] – –
TOTAL ALLOCATIONS TO ENTITIES/EMs' – – – – – – – – – – –
Transfers to other Organs of State
[insert description] 3 – –
[insert description] – –
[insert description] – –
TOTAL ALLOCATIONS TO OTHER ORGANS OF STATE: – – – – – – – – – – –
Grants to other Organisations
[insert description] 4 – –
[insert description] – –
[insert description] – –
TOTAL GRANTS TO OTHER ORGANISATIONS: – – – – – – – – – – –
TOTAL TRANSFERS/GRANTS 5 – – – – – – – – – – –
References
1. Insert description listed by municipal name and demarcation code of recipient
2. Insert description of each entity or external mechanism (an external mechanism may be provided with resources to ensure a minimum level of service)
3. Insert description of each Organ of State; e.g. Eskom
4. Insert description of each 'other' organisation
5. All descriptions should separate allocations for 'capital purposes' and 'operating purposes'
10. Adjustments to funding allocations from National or Provincial Government
12. G = B + C + D + E + F
13. Adjusted Budget H = (A or A1/2 etc) + G
Description Ref
7. Additional cash-backed accumulated funds/unspent funds (section 18(1)(b) and section 28(2)(e) MFMA) identified after Original Budget approved and after annual financial statements audited (note: only where underspending could not reasonably be have
for
Budget Year 2012/13
11. Adjusts. = 'Other' Adjustments proposed to be approved; including revenue under-collection (MFMA section 28(2)(a)); additional revenue appropriation on existing programmes (section 28(2))(b); projected savings (section 28(2)(d)); error correction (sec
6. Only complete if a previous adjusted budget has been approved in the same financial year. Reflect most recent adjusted budget.
9. Adjustments approved in accordance with section 29 MFMA
8. Increases of funds approved under section 31 MFMA
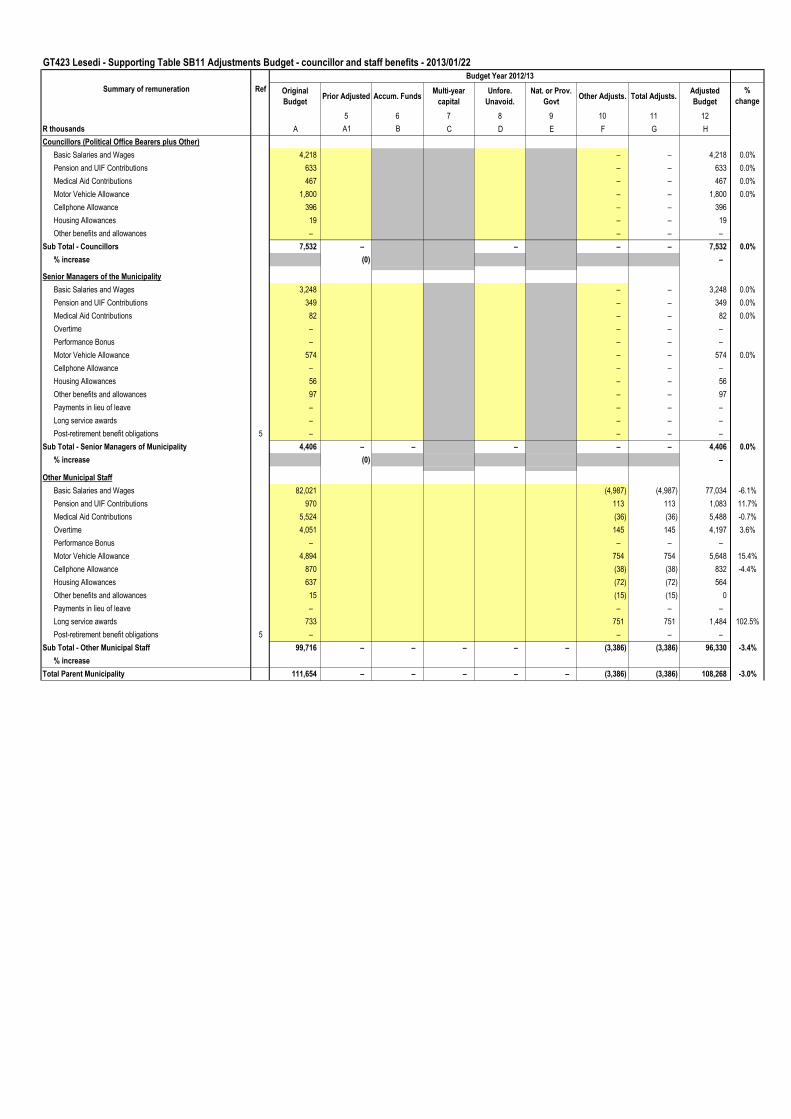
GT423 Lesedi - Supporting Table SB11 Adjustments Budget - councillor and staff benefits - 2013/01/22
Original
BudgetPrior Adjusted Accum. Funds
Multi-year
capital
Unfore.
Unavoid.
Nat. or Prov.
GovtOther Adjusts. Total Adjusts.
Adjusted
Budget
%
change
5 6 7 8 9 10 11 12
R thousands A A1 B C D E F G H
Councillors (Political Office Bearers plus Other)
Basic Salaries and Wages 4,218 – – 4,218 0.0%
Pension and UIF Contributions 633 – – 633 0.0%
Medical Aid Contributions 467 – – 467 0.0%
Motor Vehicle Allowance 1,800 – – 1,800 0.0%
Cellphone Allowance 396 – – 396
Housing Allowances 19 – – 19
Other benefits and allowances – – – –
Sub Total - Councillors 7,532 – – – – 7,532 0.0%
% increase (0) –
Senior Managers of the Municipality
Basic Salaries and Wages 3,248 – – 3,248 0.0%
Pension and UIF Contributions 349 – – 349 0.0%
Medical Aid Contributions 82 – – 82 0.0%
Overtime – – – –
Performance Bonus – – – –
Motor Vehicle Allowance 574 – – 574 0.0%
Cellphone Allowance – – – –
Housing Allowances 56 – – 56
Other benefits and allowances 97 – – 97
Payments in lieu of leave – – – –
Long service awards – – – –
Post-retirement benefit obligations 5 – – – –
Sub Total - Senior Managers of Municipality 4,406 – – – – – 4,406 0.0%
% increase (0) –
Other Municipal Staff
Basic Salaries and Wages 82,021 (4,987) (4,987) 77,034 -6.1%
Pension and UIF Contributions 970 113 113 1,083 11.7%
Medical Aid Contributions 5,524 (36) (36) 5,488 -0.7%
Overtime 4,051 145 145 4,197 3.6%
Performance Bonus – – – –
Motor Vehicle Allowance 4,894 754 754 5,648 15.4%
Cellphone Allowance 870 (38) (38) 832 -4.4%
Housing Allowances 637 (72) (72) 564
Other benefits and allowances 15 (15) (15) 0
Payments in lieu of leave – – – –
Long service awards 733 751 751 1,484 102.5%
Post-retirement benefit obligations 5 – – – –
Sub Total - Other Municipal Staff 99,716 – – – – – (3,386) (3,386) 96,330 -3.4%
% increase
Total Parent Municipality 111,654 – – – – – (3,386) (3,386) 108,268 -3.0%
Summary of remuneration Ref
Budget Year 2012/13
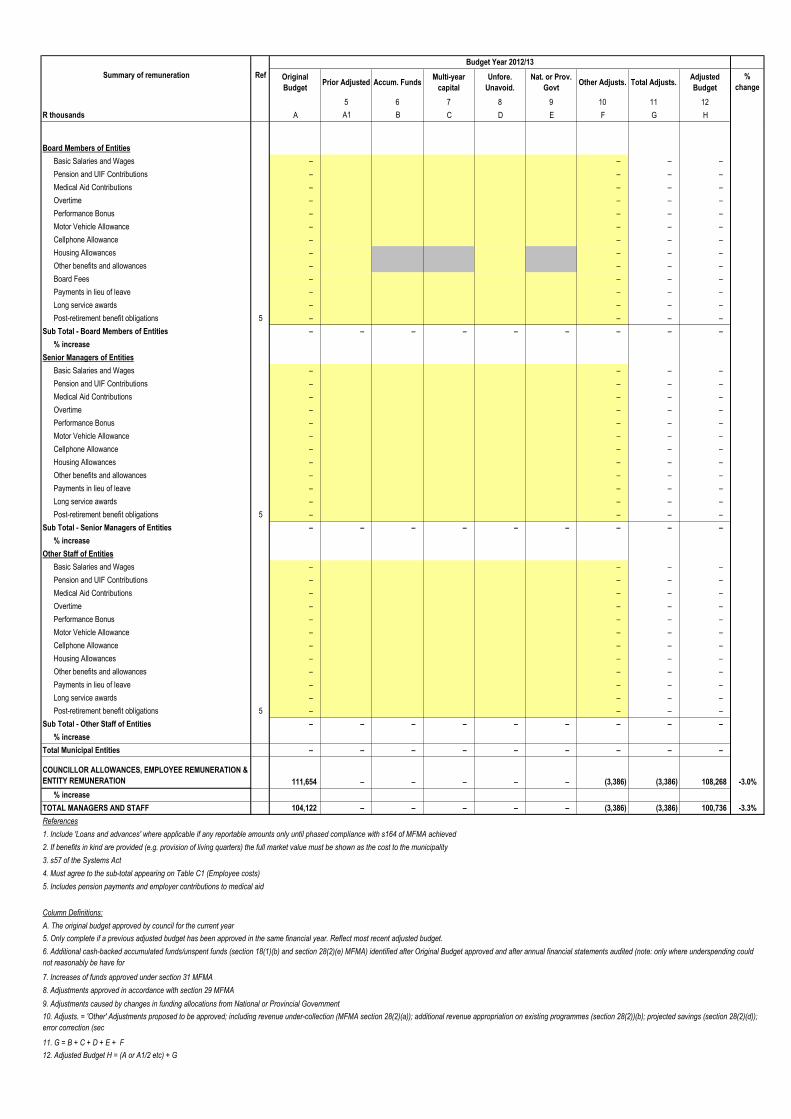
Original
BudgetPrior Adjusted Accum. Funds
Multi-year
capital
Unfore.
Unavoid.
Nat. or Prov.
GovtOther Adjusts. Total Adjusts.
Adjusted
Budget
%
change
5 6 7 8 9 10 11 12
R thousands A A1 B C D E F G H
Summary of remuneration Ref
Budget Year 2012/13
Board Members of Entities
Basic Salaries and Wages – – – –
Pension and UIF Contributions – – – –
Medical Aid Contributions – – – –
Overtime – – – –
Performance Bonus – – – –
Motor Vehicle Allowance – – – –
Cellphone Allowance – – – –
Housing Allowances – – – –
Other benefits and allowances – – – –
Board Fees – – – –
Payments in lieu of leave – – – –
Long service awards – – – –
Post-retirement benefit obligations 5 – – – –
Sub Total - Board Members of Entities – – – – – – – – –
% increase
Senior Managers of Entities
Basic Salaries and Wages – – – –
Pension and UIF Contributions – – – –
Medical Aid Contributions – – – –
Overtime – – – –
Performance Bonus – – – –
Motor Vehicle Allowance – – – –
Cellphone Allowance – – – –
Housing Allowances – – – –
Other benefits and allowances – – – –
Payments in lieu of leave – – – –
Long service awards – – – –
Post-retirement benefit obligations 5 – – – –
Sub Total - Senior Managers of Entities – – – – – – – – –
% increase
Other Staff of Entities
Basic Salaries and Wages – – – –
Pension and UIF Contributions – – – –
Medical Aid Contributions – – – –
Overtime – – – –
Performance Bonus – – – –
Motor Vehicle Allowance – – – –
Cellphone Allowance – – – –
Housing Allowances – – – –
Other benefits and allowances – – – –
Payments in lieu of leave – – – –
Long service awards – – – –
Post-retirement benefit obligations 5 – – – –
Sub Total - Other Staff of Entities – – – – – – – – –
% increase
Total Municipal Entities – – – – – – – – –
COUNCILLOR ALLOWANCES, EMPLOYEE REMUNERATION &
ENTITY REMUNERATION 111,654 – – – – – (3,386) (3,386) 108,268 -3.0%
% increase
TOTAL MANAGERS AND STAFF 104,122 – – – – – (3,386) (3,386) 100,736 -3.3%
References
1. Include 'Loans and advances' where applicable if any reportable amounts only until phased compliance with s164 of MFMA achieved
2. If benefits in kind are provided (e.g. provision of living quarters) the full market value must be shown as the cost to the municipality
3. s57 of the Systems Act
4. Must agree to the sub-total appearing on Table C1 (Employee costs)
5. Includes pension payments and employer contributions to medical aid
Column Definitions:
A. The original budget approved by council for the current year
9. Adjustments caused by changes in funding allocations from National or Provincial Government
11. G = B + C + D + E + F
10. Adjusts. = 'Other' Adjustments proposed to be approved; including revenue under-collection (MFMA section 28(2)(a)); additional revenue appropriation on existing programmes (section 28(2))(b); projected savings (section 28(2)(d));
error correction (sec
12. Adjusted Budget H = (A or A1/2 etc) + G
5. Only complete if a previous adjusted budget has been approved in the same financial year. Reflect most recent adjusted budget.
7. Increases of funds approved under section 31 MFMA
8. Adjustments approved in accordance with section 29 MFMA
6. Additional cash-backed accumulated funds/unspent funds (section 18(1)(b) and section 28(2)(e) MFMA) identified after Original Budget approved and after annual financial statements audited (note: only where underspending could
not reasonably be have for
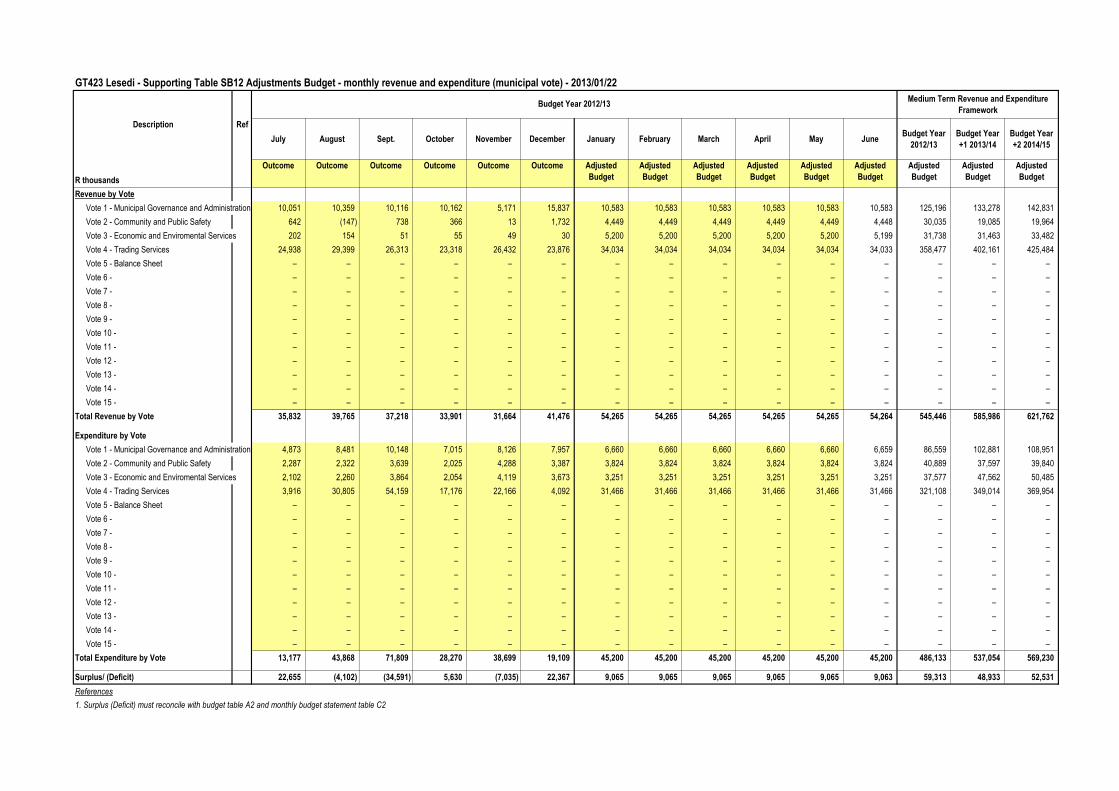
GT423 Lesedi - Supporting Table SB12 Adjustments Budget - monthly revenue and expenditure (municipal vote) - 2013/01/22
Medium Term Revenue and Expenditure
Framework
July August Sept. October November December January February March April May JuneBudget Year
2012/13
Budget Year
+1 2013/14
Budget Year
+2 2014/15
R thousands
Outcome Outcome Outcome Outcome Outcome Outcome Adjusted
Budget
Adjusted
Budget
Adjusted
Budget
Adjusted
Budget
Adjusted
Budget
Adjusted
Budget
Adjusted
Budget
Adjusted
Budget
Adjusted
Budget
Revenue by Vote
Vote 1 - Municipal Governance and Administration 10,051 10,359 10,116 10,162 5,171 15,837 10,583 10,583 10,583 10,583 10,583 10,583 125,196 133,278 142,831
Vote 2 - Community and Public Safety 642 (147) 738 366 13 1,732 4,449 4,449 4,449 4,449 4,449 4,448 30,035 19,085 19,964
Vote 3 - Economic and Enviromental Services 202 154 51 55 49 30 5,200 5,200 5,200 5,200 5,200 5,199 31,738 31,463 33,482
Vote 4 - Trading Services 24,938 29,399 26,313 23,318 26,432 23,876 34,034 34,034 34,034 34,034 34,034 34,033 358,477 402,161 425,484
Vote 5 - Balance Sheet – – – – – – – – – – – – – – –
Vote 6 - – – – – – – – – – – – – – – –
Vote 7 - – – – – – – – – – – – – – – –
Vote 8 - – – – – – – – – – – – – – – –
Vote 9 - – – – – – – – – – – – – – – –
Vote 10 - – – – – – – – – – – – – – – –
Vote 11 - – – – – – – – – – – – – – – –
Vote 12 - – – – – – – – – – – – – – – –
Vote 13 - – – – – – – – – – – – – – – –
Vote 14 - – – – – – – – – – – – – – – –
Vote 15 - – – – – – – – – – – – – – – –
Total Revenue by Vote 35,832 39,765 37,218 33,901 31,664 41,476 54,265 54,265 54,265 54,265 54,265 54,264 545,446 585,986 621,762
Expenditure by Vote
Vote 1 - Municipal Governance and Administration 4,873 8,481 10,148 7,015 8,126 7,957 6,660 6,660 6,660 6,660 6,660 6,659 86,559 102,881 108,951
Vote 2 - Community and Public Safety 2,287 2,322 3,639 2,025 4,288 3,387 3,824 3,824 3,824 3,824 3,824 3,824 40,889 37,597 39,840
Vote 3 - Economic and Enviromental Services 2,102 2,260 3,864 2,054 4,119 3,673 3,251 3,251 3,251 3,251 3,251 3,251 37,577 47,562 50,485
Vote 4 - Trading Services 3,916 30,805 54,159 17,176 22,166 4,092 31,466 31,466 31,466 31,466 31,466 31,466 321,108 349,014 369,954
Vote 5 - Balance Sheet – – – – – – – – – – – – – – –
Vote 6 - – – – – – – – – – – – – – – –
Vote 7 - – – – – – – – – – – – – – – –
Vote 8 - – – – – – – – – – – – – – – –
Vote 9 - – – – – – – – – – – – – – – –
Vote 10 - – – – – – – – – – – – – – – –
Vote 11 - – – – – – – – – – – – – – – –
Vote 12 - – – – – – – – – – – – – – – –
Vote 13 - – – – – – – – – – – – – – – –
Vote 14 - – – – – – – – – – – – – – – –
Vote 15 - – – – – – – – – – – – – – – –
Total Expenditure by Vote 13,177 43,868 71,809 28,270 38,699 19,109 45,200 45,200 45,200 45,200 45,200 45,200 486,133 537,054 569,230
Surplus/ (Deficit) 22,655 (4,102) (34,591) 5,630 (7,035) 22,367 9,065 9,065 9,065 9,065 9,065 9,063 59,313 48,933 52,531
References
1. Surplus (Deficit) must reconcile with budget table A2 and monthly budget statement table C2
Description
Budget Year 2012/13
Ref
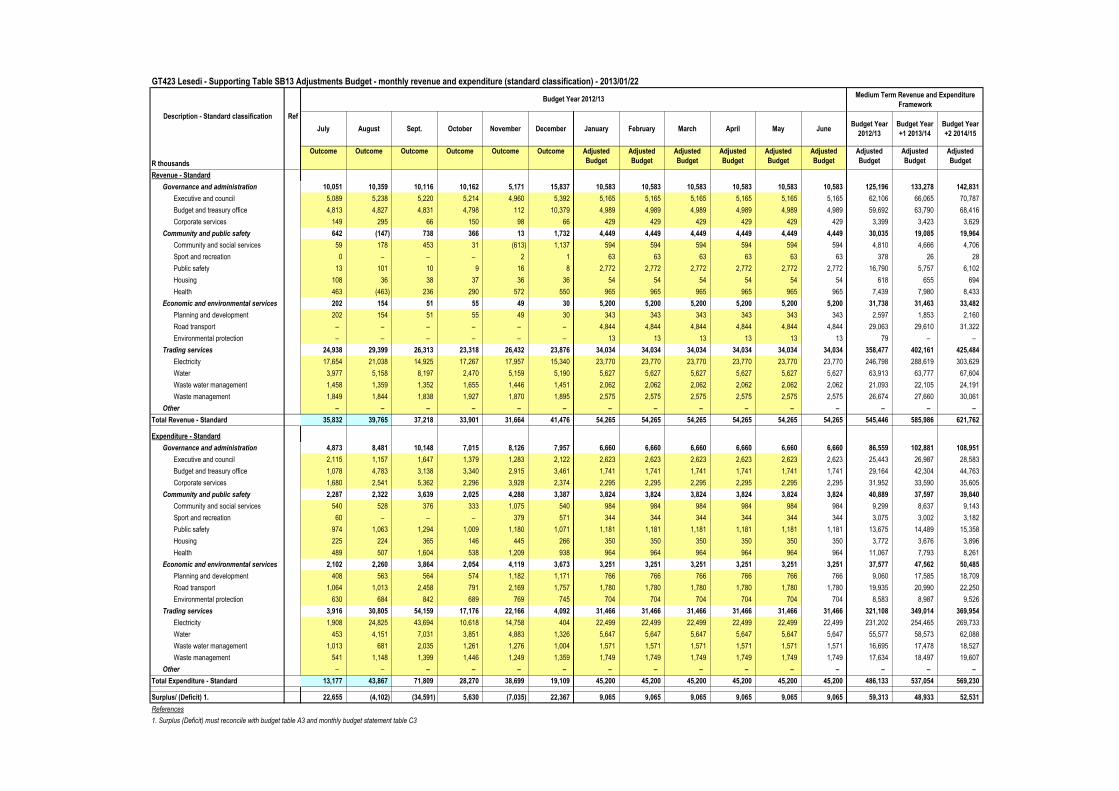
GT423 Lesedi - Supporting Table SB13 Adjustments Budget - monthly revenue and expenditure (standard classification) - 2013/01/22
Medium Term Revenue and Expenditure
Framework
July August Sept. October November December January February March April May JuneBudget Year
2012/13
Budget Year
+1 2013/14
Budget Year
+2 2014/15
R thousands
Outcome Outcome Outcome Outcome Outcome Outcome Adjusted
Budget
Adjusted
Budget
Adjusted
Budget
Adjusted
Budget
Adjusted
Budget
Adjusted
Budget
Adjusted
Budget
Adjusted
Budget
Adjusted
Budget
Revenue - Standard
Governance and administration 10,051 10,359 10,116 10,162 5,171 15,837 10,583 10,583 10,583 10,583 10,583 10,583 125,196 133,278 142,831
Executive and council 5,089 5,238 5,220 5,214 4,960 5,392 5,165 5,165 5,165 5,165 5,165 5,165 62,106 66,065 70,787
Budget and treasury office 4,813 4,827 4,831 4,798 112 10,379 4,989 4,989 4,989 4,989 4,989 4,989 59,692 63,790 68,416
Corporate services 149 295 66 150 98 66 429 429 429 429 429 429 3,399 3,423 3,629
Community and public safety 642 (147) 738 366 13 1,732 4,449 4,449 4,449 4,449 4,449 4,449 30,035 19,085 19,964
Community and social services 59 178 453 31 (613) 1,137 594 594 594 594 594 594 4,810 4,666 4,706
Sport and recreation 0 – – – 2 1 63 63 63 63 63 63 378 26 28
Public safety 13 101 10 9 16 8 2,772 2,772 2,772 2,772 2,772 2,772 16,790 5,757 6,102
Housing 108 36 38 37 36 36 54 54 54 54 54 54 618 655 694
Health 463 (463) 236 290 572 550 965 965 965 965 965 965 7,439 7,980 8,433
Economic and environmental services 202 154 51 55 49 30 5,200 5,200 5,200 5,200 5,200 5,200 31,738 31,463 33,482
Planning and development 202 154 51 55 49 30 343 343 343 343 343 343 2,597 1,853 2,160
Road transport – – – – – – 4,844 4,844 4,844 4,844 4,844 4,844 29,063 29,610 31,322
Environmental protection – – – – – – 13 13 13 13 13 13 79 – –
Trading services 24,938 29,399 26,313 23,318 26,432 23,876 34,034 34,034 34,034 34,034 34,034 34,034 358,477 402,161 425,484
Electricity 17,654 21,038 14,925 17,267 17,957 15,340 23,770 23,770 23,770 23,770 23,770 23,770 246,798 288,619 303,629
Water 3,977 5,158 8,197 2,470 5,159 5,190 5,627 5,627 5,627 5,627 5,627 5,627 63,913 63,777 67,604
Waste water management 1,458 1,359 1,352 1,655 1,446 1,451 2,062 2,062 2,062 2,062 2,062 2,062 21,093 22,105 24,191
Waste management 1,849 1,844 1,838 1,927 1,870 1,895 2,575 2,575 2,575 2,575 2,575 2,575 26,674 27,660 30,061
Other – – – – – – – – – – – – – – –
Total Revenue - Standard 35,832 39,765 37,218 33,901 31,664 41,476 54,265 54,265 54,265 54,265 54,265 54,265 545,446 585,986 621,762
Expenditure - Standard
Governance and administration 4,873 8,481 10,148 7,015 8,126 7,957 6,660 6,660 6,660 6,660 6,660 6,660 86,559 102,881 108,951
Executive and council 2,115 1,157 1,647 1,379 1,283 2,122 2,623 2,623 2,623 2,623 2,623 2,623 25,443 26,987 28,583
Budget and treasury office 1,078 4,783 3,138 3,340 2,915 3,461 1,741 1,741 1,741 1,741 1,741 1,741 29,164 42,304 44,763
Corporate services 1,680 2,541 5,362 2,296 3,928 2,374 2,295 2,295 2,295 2,295 2,295 2,295 31,952 33,590 35,605
Community and public safety 2,287 2,322 3,639 2,025 4,288 3,387 3,824 3,824 3,824 3,824 3,824 3,824 40,889 37,597 39,840
Community and social services 540 528 376 333 1,075 540 984 984 984 984 984 984 9,299 8,637 9,143
Sport and recreation 60 – – – 379 571 344 344 344 344 344 344 3,075 3,002 3,182
Public safety 974 1,063 1,294 1,009 1,180 1,071 1,181 1,181 1,181 1,181 1,181 1,181 13,675 14,489 15,358
Housing 225 224 365 146 445 266 350 350 350 350 350 350 3,772 3,676 3,896
Health 489 507 1,604 538 1,209 938 964 964 964 964 964 964 11,067 7,793 8,261
Economic and environmental services 2,102 2,260 3,864 2,054 4,119 3,673 3,251 3,251 3,251 3,251 3,251 3,251 37,577 47,562 50,485
Planning and development 408 563 564 574 1,182 1,171 766 766 766 766 766 766 9,060 17,585 18,709
Road transport 1,064 1,013 2,458 791 2,169 1,757 1,780 1,780 1,780 1,780 1,780 1,780 19,935 20,990 22,250
Environmental protection 630 684 842 689 769 745 704 704 704 704 704 704 8,583 8,987 9,526
Trading services 3,916 30,805 54,159 17,176 22,166 4,092 31,466 31,466 31,466 31,466 31,466 31,466 321,108 349,014 369,954
Electricity 1,908 24,825 43,694 10,618 14,758 404 22,499 22,499 22,499 22,499 22,499 22,499 231,202 254,465 269,733
Water 453 4,151 7,031 3,851 4,883 1,326 5,647 5,647 5,647 5,647 5,647 5,647 55,577 58,573 62,088
Waste water management 1,013 681 2,035 1,261 1,276 1,004 1,571 1,571 1,571 1,571 1,571 1,571 16,695 17,478 18,527
Waste management 541 1,148 1,399 1,446 1,249 1,359 1,749 1,749 1,749 1,749 1,749 1,749 17,634 18,497 19,607
Other – – – – – – – – – – – – – – –
Total Expenditure - Standard 13,177 43,867 71,809 28,270 38,699 19,109 45,200 45,200 45,200 45,200 45,200 45,200 486,133 537,054 569,230
Surplus/ (Deficit) 1. 22,655 (4,102) (34,591) 5,630 (7,035) 22,367 9,065 9,065 9,065 9,065 9,065 9,065 59,313 48,933 52,531
References
1. Surplus (Deficit) must reconcile with budget table A3 and monthly budget statement table C3
Description - Standard classification Ref
Budget Year 2012/13
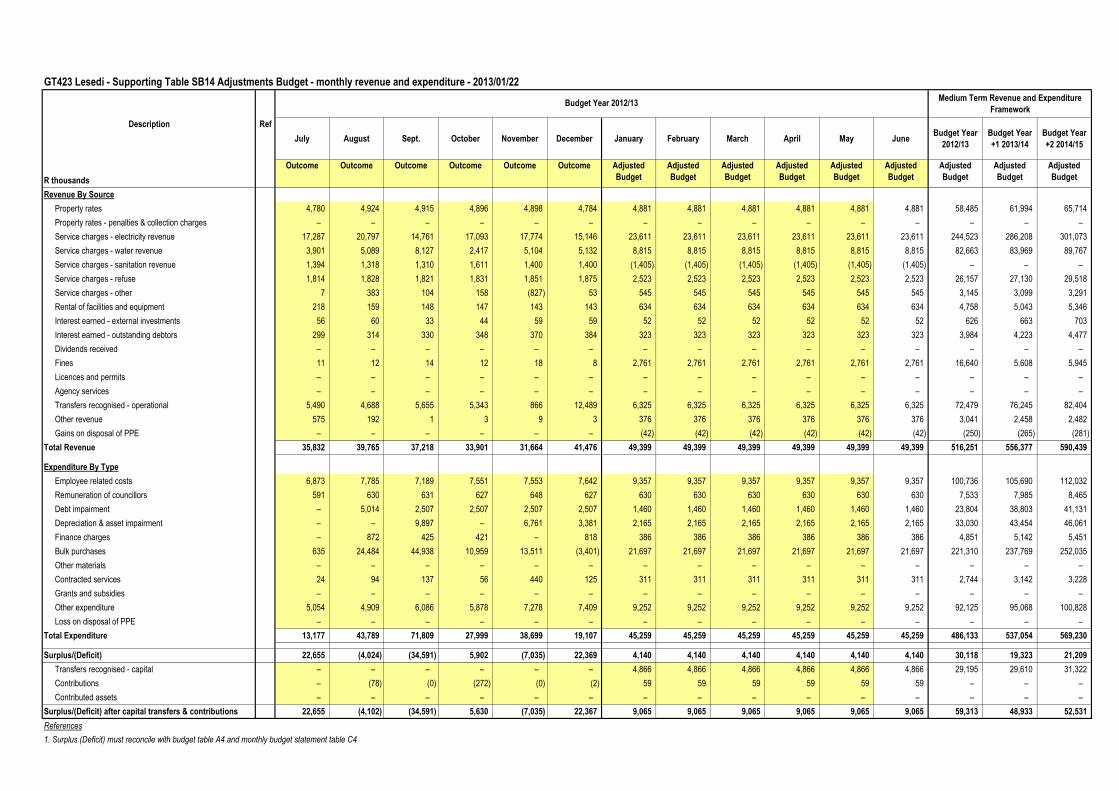
GT423 Lesedi - Supporting Table SB14 Adjustments Budget - monthly revenue and expenditure - 2013/01/22
Medium Term Revenue and Expenditure
Framework
July August Sept. October November December January February March April May JuneBudget Year
2012/13
Budget Year
+1 2013/14
Budget Year
+2 2014/15
R thousands
Outcome Outcome Outcome Outcome Outcome Outcome Adjusted
Budget
Adjusted
Budget
Adjusted
Budget
Adjusted
Budget
Adjusted
Budget
Adjusted
Budget
Adjusted
Budget
Adjusted
Budget
Adjusted
Budget
Revenue By Source
Property rates 4,780 4,924 4,915 4,896 4,898 4,784 4,881 4,881 4,881 4,881 4,881 4,881 58,485 61,994 65,714
Property rates - penalties & collection charges – – – – – – – – – – – – – – –
Service charges - electricity revenue 17,287 20,797 14,761 17,093 17,774 15,146 23,611 23,611 23,611 23,611 23,611 23,611 244,523 286,208 301,073
Service charges - water revenue 3,901 5,089 8,127 2,417 5,104 5,132 8,815 8,815 8,815 8,815 8,815 8,815 82,663 83,969 89,767
Service charges - sanitation revenue 1,394 1,318 1,310 1,611 1,400 1,400 (1,405) (1,405) (1,405) (1,405) (1,405) (1,405) – – –
Service charges - refuse 1,814 1,828 1,821 1,831 1,851 1,875 2,523 2,523 2,523 2,523 2,523 2,523 26,157 27,130 29,518
Service charges - other 7 383 104 158 (827) 53 545 545 545 545 545 545 3,145 3,099 3,291
Rental of facilities and equipment 218 159 148 147 143 143 634 634 634 634 634 634 4,758 5,043 5,346
Interest earned - external investments 56 60 33 44 59 59 52 52 52 52 52 52 626 663 703
Interest earned - outstanding debtors 299 314 330 348 370 384 323 323 323 323 323 323 3,984 4,223 4,477
Dividends received – – – – – – – – – – – – – – –
Fines 11 12 14 12 18 8 2,761 2,761 2,761 2,761 2,761 2,761 16,640 5,608 5,945
Licences and permits – – – – – – – – – – – – – – –
Agency services – – – – – – – – – – – – – – –
Transfers recognised - operational 5,490 4,688 5,655 5,343 866 12,489 6,325 6,325 6,325 6,325 6,325 6,325 72,479 76,245 82,404
Other revenue 575 192 1 3 9 3 376 376 376 376 376 376 3,041 2,458 2,482
Gains on disposal of PPE – – – – – – (42) (42) (42) (42) (42) (42) (250) (265) (281)
Total Revenue 35,832 39,765 37,218 33,901 31,664 41,476 49,399 49,399 49,399 49,399 49,399 49,399 516,251 556,377 590,439
Expenditure By Type
Employee related costs 6,873 7,785 7,189 7,551 7,553 7,642 9,357 9,357 9,357 9,357 9,357 9,357 100,736 105,690 112,032
Remuneration of councillors 591 630 631 627 648 627 630 630 630 630 630 630 7,533 7,985 8,465
Debt impairment – 5,014 2,507 2,507 2,507 2,507 1,460 1,460 1,460 1,460 1,460 1,460 23,804 38,803 41,131
Depreciation & asset impairment – – 9,897 – 6,761 3,381 2,165 2,165 2,165 2,165 2,165 2,165 33,030 43,454 46,061
Finance charges – 872 425 421 – 818 386 386 386 386 386 386 4,851 5,142 5,451
Bulk purchases 635 24,484 44,938 10,959 13,511 (3,401) 21,697 21,697 21,697 21,697 21,697 21,697 221,310 237,769 252,035
Other materials – – – – – – – – – – – – – – –
Contracted services 24 94 137 56 440 125 311 311 311 311 311 311 2,744 3,142 3,228
Grants and subsidies – – – – – – – – – – – – – – –
Other expenditure 5,054 4,909 6,086 5,878 7,278 7,409 9,252 9,252 9,252 9,252 9,252 9,252 92,125 95,068 100,828
Loss on disposal of PPE – – – – – – – – – – – – – – –
Total Expenditure 13,177 43,789 71,809 27,999 38,699 19,107 45,259 45,259 45,259 45,259 45,259 45,259 486,133 537,054 569,230
Surplus/(Deficit) 22,655 (4,024) (34,591) 5,902 (7,035) 22,369 4,140 4,140 4,140 4,140 4,140 4,140 30,118 19,323 21,209
Transfers recognised - capital – – – – – – 4,866 4,866 4,866 4,866 4,866 4,866 29,195 29,610 31,322
Contributions – (78) (0) (272) (0) (2) 59 59 59 59 59 59 – – –
Contributed assets – – – – – – – – – – – – – – –
Surplus/(Deficit) after capital transfers & contributions 22,655 (4,102) (34,591) 5,630 (7,035) 22,367 9,065 9,065 9,065 9,065 9,065 9,065 59,313 48,933 52,531
References
1. Surplus (Deficit) must reconcile with budget table A4 and monthly budget statement table C4
Description Ref
Budget Year 2012/13
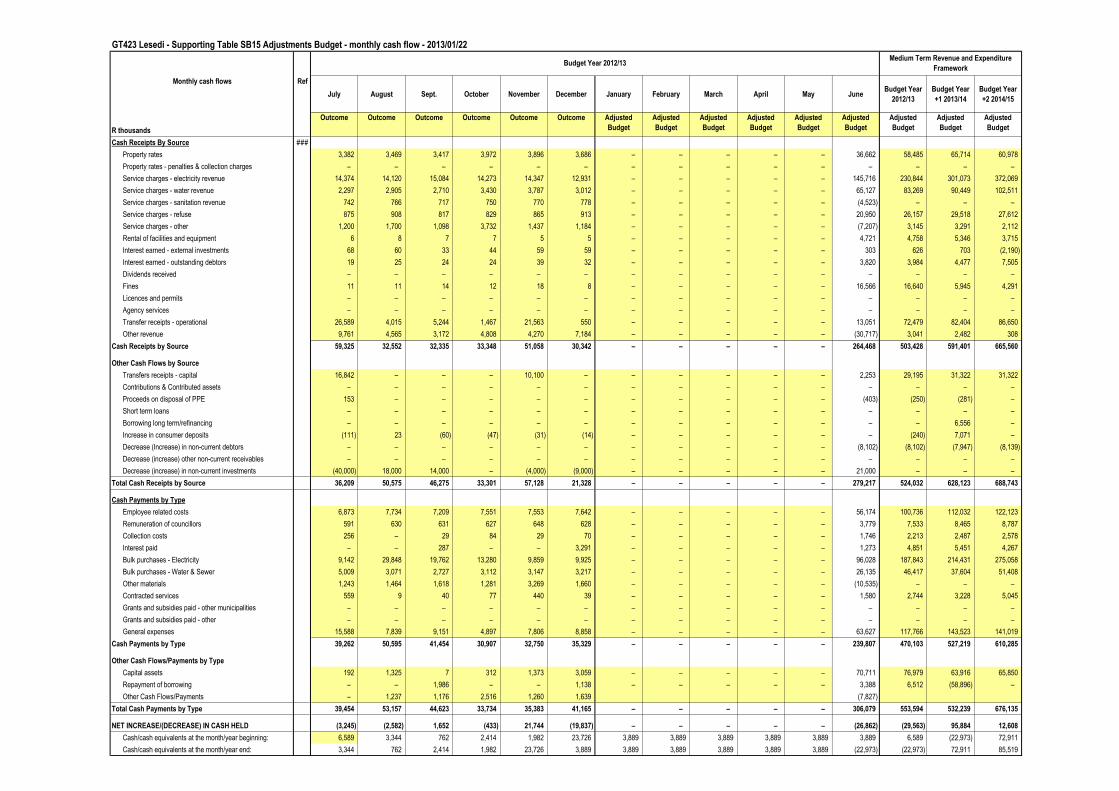
GT423 Lesedi - Supporting Table SB15 Adjustments Budget - monthly cash flow - 2013/01/22
July August Sept. October November December January February March April May JuneBudget Year
2012/13
Budget Year
+1 2013/14
Budget Year
+2 2014/15
R thousands
Outcome Outcome Outcome Outcome Outcome Outcome Adjusted
Budget
Adjusted
Budget
Adjusted
Budget
Adjusted
Budget
Adjusted
Budget
Adjusted
Budget
Adjusted
Budget
Adjusted
Budget
Adjusted
Budget
Cash Receipts By Source ###
Property rates 3,382 3,469 3,417 3,972 3,896 3,686 – – – – – 36,662 58,485 65,714 60,978
Property rates - penalties & collection charges – – – – – – – – – – – – – – –
Service charges - electricity revenue 14,374 14,120 15,084 14,273 14,347 12,931 – – – – – 145,716 230,844 301,073 372,069
Service charges - water revenue 2,297 2,905 2,710 3,430 3,787 3,012 – – – – – 65,127 83,269 90,449 102,511
Service charges - sanitation revenue 742 766 717 750 770 778 – – – – – (4,523) – – –
Service charges - refuse 875 908 817 829 865 913 – – – – – 20,950 26,157 29,518 27,612
Service charges - other 1,200 1,700 1,098 3,732 1,437 1,184 – – – – – (7,207) 3,145 3,291 2,112
Rental of facilities and equipment 6 8 7 7 5 5 – – – – – 4,721 4,758 5,346 3,715
Interest earned - external investments 68 60 33 44 59 59 – – – – – 303 626 703 (2,190)
Interest earned - outstanding debtors 19 25 24 24 39 32 – – – – – 3,820 3,984 4,477 7,505
Dividends received – – – – – – – – – – – – – – –
Fines 11 11 14 12 18 8 – – – – – 16,566 16,640 5,945 4,291
Licences and permits – – – – – – – – – – – – – – –
Agency services – – – – – – – – – – – – – – –
Transfer receipts - operational 26,589 4,015 5,244 1,467 21,563 550 – – – – – 13,051 72,479 82,404 86,650
Other revenue 9,761 4,565 3,172 4,808 4,270 7,184 – – – – – (30,717) 3,041 2,482 308
Cash Receipts by Source 59,325 32,552 32,335 33,348 51,058 30,342 – – – – – 264,468 503,428 591,401 665,560
Other Cash Flows by Source
Transfers receipts - capital 16,842 – – – 10,100 – – – – – – 2,253 29,195 31,322 31,322
Contributions & Contributed assets – – – – – – – – – – – – – – –
Proceeds on disposal of PPE 153 – – – – – – – – – – (403) (250) (281) –
Short term loans – – – – – – – – – – – – – – –
Borrowing long term/refinancing – – – – – – – – – – – – – 6,556 –
Increase in consumer deposits (111) 23 (60) (47) (31) (14) – – – – – – (240) 7,071 –
Decrease (Increase) in non-current debtors – – – – – – – – – – – (8,102) (8,102) (7,947) (8,139)
Decrease (increase) other non-current receivables – – – – – – – – – – – – – – –
Decrease (increase) in non-current investments (40,000) 18,000 14,000 – (4,000) (9,000) – – – – – 21,000 – – –
Total Cash Receipts by Source 36,209 50,575 46,275 33,301 57,128 21,328 – – – – – 279,217 524,032 628,123 688,743
Cash Payments by Type
Employee related costs 6,873 7,734 7,209 7,551 7,553 7,642 – – – – – 56,174 100,736 112,032 122,123
Remuneration of councillors 591 630 631 627 648 628 – – – – – 3,779 7,533 8,465 8,787
Collection costs 256 – 29 84 29 70 – – – – – 1,746 2,213 2,487 2,578
Interest paid – – 287 – – 3,291 – – – – – 1,273 4,851 5,451 4,267
Bulk purchases - Electricity 9,142 29,848 19,762 13,280 9,859 9,925 – – – – – 96,028 187,843 214,431 275,058
Bulk purchases - Water & Sewer 5,009 3,071 2,727 3,112 3,147 3,217 – – – – – 26,135 46,417 37,604 51,408
Other materials 1,243 1,464 1,618 1,281 3,269 1,660 – – – – – (10,535) – – –
Contracted services 559 9 40 77 440 39 – – – – – 1,580 2,744 3,228 5,045
Grants and subsidies paid - other municipalities – – – – – – – – – – – – – – –
Grants and subsidies paid - other – – – – – – – – – – – – – – –
General expenses 15,588 7,839 9,151 4,897 7,806 8,858 – – – – – 63,627 117,766 143,523 141,019
Cash Payments by Type 39,262 50,595 41,454 30,907 32,750 35,329 – – – – – 239,807 470,103 527,219 610,285
Other Cash Flows/Payments by Type
Capital assets 192 1,325 7 312 1,373 3,059 – – – – – 70,711 76,979 63,916 65,850
Repayment of borrowing – – 1,986 – – 1,138 – – – – – 3,388 6,512 (58,896) –
Other Cash Flows/Payments – 1,237 1,176 2,516 1,260 1,639 (7,827)
Total Cash Payments by Type 39,454 53,157 44,623 33,734 35,383 41,165 – – – – – 306,079 553,594 532,239 676,135
NET INCREASE/(DECREASE) IN CASH HELD (3,245) (2,582) 1,652 (433) 21,744 (19,837) – – – – – (26,862) (29,563) 95,884 12,608
Cash/cash equivalents at the month/year beginning: 6,589 3,344 762 2,414 1,982 23,726 3,889 3,889 3,889 3,889 3,889 3,889 6,589 (22,973) 72,911
Cash/cash equivalents at the month/year end: 3,344 762 2,414 1,982 23,726 3,889 3,889 3,889 3,889 3,889 3,889 (22,973) (22,973) 72,911 85,519
Monthly cash flows
Medium Term Revenue and Expenditure
Framework
Ref
Budget Year 2012/13
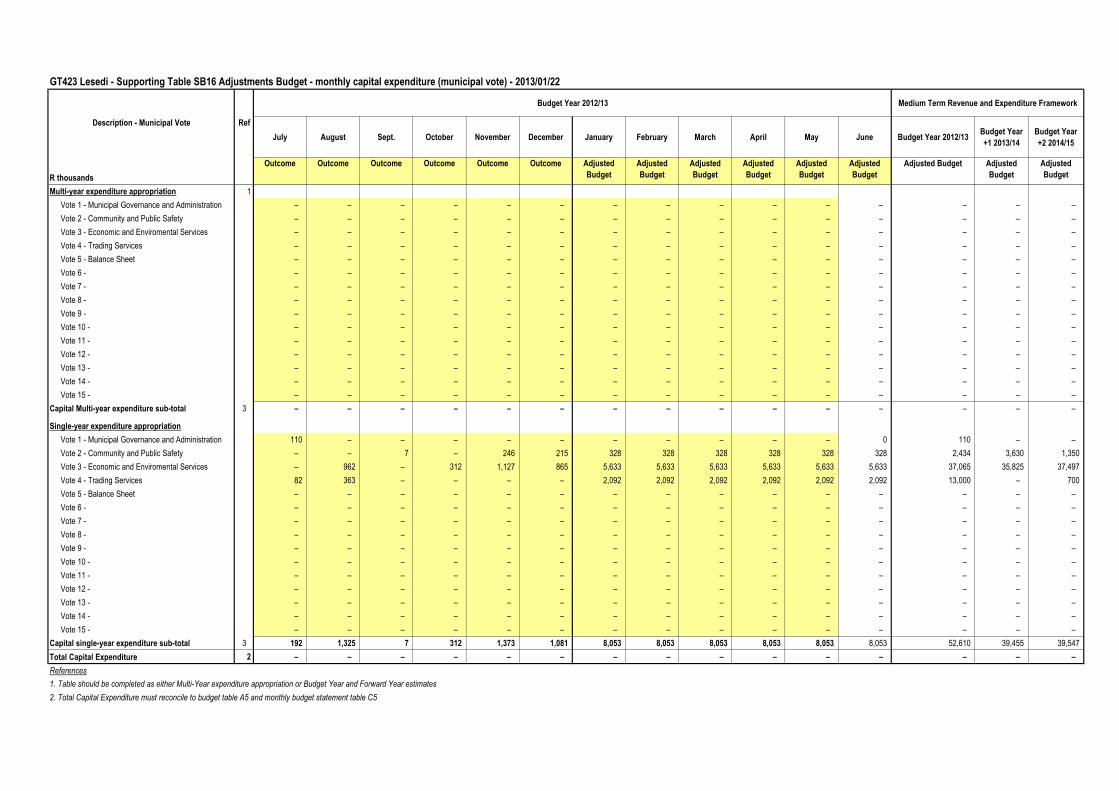
GT423 Lesedi - Supporting Table SB16 Adjustments Budget - monthly capital expenditure (municipal vote) - 2013/01/22
Budget Year 2012/13 Medium Term Revenue and Expenditure Framework
July August Sept. October November December January February March April May June Budget Year 2012/13Budget Year
+1 2013/14
Budget Year
+2 2014/15
R thousands
Outcome Outcome Outcome Outcome Outcome Outcome Adjusted
Budget
Adjusted
Budget
Adjusted
Budget
Adjusted
Budget
Adjusted
Budget
Adjusted
Budget
Adjusted Budget Adjusted
Budget
Adjusted
Budget
Multi-year expenditure appropriation 1
Vote 1 - Municipal Governance and Administration – – – – – – – – – – – – – – –
Vote 2 - Community and Public Safety – – – – – – – – – – – – – – –
Vote 3 - Economic and Enviromental Services – – – – – – – – – – – – – – –
Vote 4 - Trading Services – – – – – – – – – – – – – – –
Vote 5 - Balance Sheet – – – – – – – – – – – – – – –
Vote 6 - – – – – – – – – – – – – – – –
Vote 7 - – – – – – – – – – – – – – – –
Vote 8 - – – – – – – – – – – – – – – –
Vote 9 - – – – – – – – – – – – – – – –
Vote 10 - – – – – – – – – – – – – – – –
Vote 11 - – – – – – – – – – – – – – – –
Vote 12 - – – – – – – – – – – – – – – –
Vote 13 - – – – – – – – – – – – – – – –
Vote 14 - – – – – – – – – – – – – – – –
Vote 15 - – – – – – – – – – – – – – – –
Capital Multi-year expenditure sub-total 3 – – – – – – – – – – – – – – – – – – –
Single-year expenditure appropriation
Vote 1 - Municipal Governance and Administration 110 – – – – – – – – – – 0 110 – –
Vote 2 - Community and Public Safety – – 7 – 246 215 328 328 328 328 328 328 2,434 3,630 1,350
Vote 3 - Economic and Enviromental Services – 962 – 312 1,127 865 5,633 5,633 5,633 5,633 5,633 5,633 37,065 35,825 37,497
Vote 4 - Trading Services 82 363 – – – – 2,092 2,092 2,092 2,092 2,092 2,092 13,000 – 700
Vote 5 - Balance Sheet – – – – – – – – – – – – – – –
Vote 6 - – – – – – – – – – – – – – – –
Vote 7 - – – – – – – – – – – – – – – –
Vote 8 - – – – – – – – – – – – – – – –
Vote 9 - – – – – – – – – – – – – – – –
Vote 10 - – – – – – – – – – – – – – – –
Vote 11 - – – – – – – – – – – – – – – –
Vote 12 - – – – – – – – – – – – – – – –
Vote 13 - – – – – – – – – – – – – – – –
Vote 14 - – – – – – – – – – – – – – – –
Vote 15 - – – – – – – – – – – – – – – –
Capital single-year expenditure sub-total 3 192 1,325 7 312 1,373 1,081 8,053 8,053 8,053 8,053 8,053 8,053 52,610 39,455 39,547
Total Capital Expenditure 2 – – – – – – – – – – – – – – –
References
1. Table should be completed as either Multi-Year expenditure appropriation or Budget Year and Forward Year estimates
2. Total Capital Expenditure must reconcile to budget table A5 and monthly budget statement table C5
Description - Municipal Vote Ref
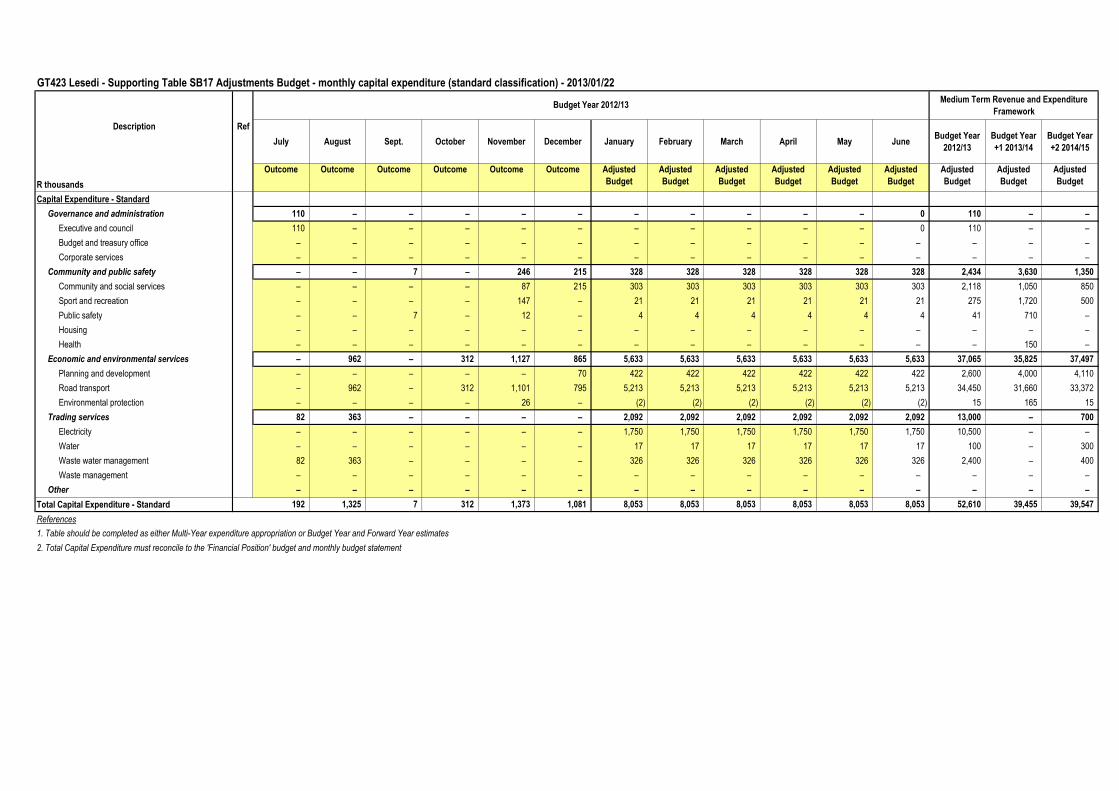
GT423 Lesedi - Supporting Table SB17 Adjustments Budget - monthly capital expenditure (standard classification) - 2013/01/22
Medium Term Revenue and Expenditure
Framework
July August Sept. October November December January February March April May JuneBudget Year
2012/13
Budget Year
+1 2013/14
Budget Year
+2 2014/15
R thousands
Outcome Outcome Outcome Outcome Outcome Outcome Adjusted
Budget
Adjusted
Budget
Adjusted
Budget
Adjusted
Budget
Adjusted
Budget
Adjusted
Budget
Adjusted
Budget
Adjusted
Budget
Adjusted
Budget
Capital Expenditure - Standard
Governance and administration 110 – – – – – – – – – – 0 110 – –
Executive and council 110 – – – – – – – – – – 0 110 – –
Budget and treasury office – – – – – – – – – – – – – – –
Corporate services – – – – – – – – – – – – – – –
Community and public safety – – 7 – 246 215 328 328 328 328 328 328 2,434 3,630 1,350
Community and social services – – – – 87 215 303 303 303 303 303 303 2,118 1,050 850
Sport and recreation – – – – 147 – 21 21 21 21 21 21 275 1,720 500
Public safety – – 7 – 12 – 4 4 4 4 4 4 41 710 –
Housing – – – – – – – – – – – – – – –
Health – – – – – – – – – – – – – 150 –
Economic and environmental services – 962 – 312 1,127 865 5,633 5,633 5,633 5,633 5,633 5,633 37,065 35,825 37,497
Planning and development – – – – – 70 422 422 422 422 422 422 2,600 4,000 4,110
Road transport – 962 – 312 1,101 795 5,213 5,213 5,213 5,213 5,213 5,213 34,450 31,660 33,372
Environmental protection – – – – 26 – (2) (2) (2) (2) (2) (2) 15 165 15
Trading services 82 363 – – – – 2,092 2,092 2,092 2,092 2,092 2,092 13,000 – 700
Electricity – – – – – – 1,750 1,750 1,750 1,750 1,750 1,750 10,500 – –
Water – – – – – – 17 17 17 17 17 17 100 – 300
Waste water management 82 363 – – – – 326 326 326 326 326 326 2,400 – 400
Waste management – – – – – – – – – – – – – – –
Other – – – – – – – – – – – – – – –
Total Capital Expenditure - Standard 192 1,325 7 312 1,373 1,081 8,053 8,053 8,053 8,053 8,053 8,053 52,610 39,455 39,547
References
1. Table should be completed as either Multi-Year expenditure appropriation or Budget Year and Forward Year estimates
2. Total Capital Expenditure must reconcile to the 'Financial Position' budget and monthly budget statement
Description Ref
Budget Year 2012/13
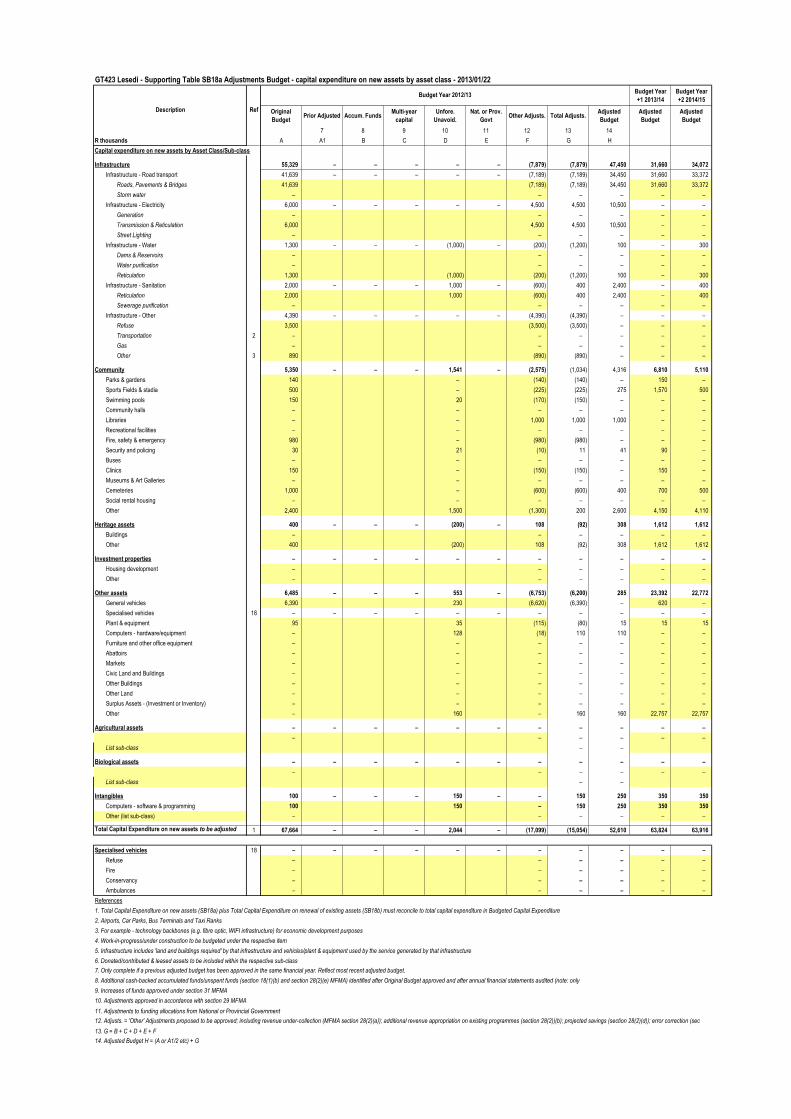
GT423 Lesedi - Supporting Table SB18a Adjustments Budget - capital expenditure on new assets by asset class - 2013/01/22
Budget Year
+1 2013/14
Budget Year
+2 2014/15
Original
BudgetPrior Adjusted Accum. Funds
Multi-year
capital
Unfore.
Unavoid.
Nat. or Prov.
GovtOther Adjusts. Total Adjusts.
Adjusted
Budget
Adjusted
Budget
Adjusted
Budget
7 8 9 10 11 12 13 14
R thousands A A1 B C D E F G H
Capital expenditure on new assets by Asset Class/Sub-class
Infrastructure 55,329 – – – – – (7,879) (7,879) 47,450 31,660 34,072
Infrastructure - Road transport 41,639 – – – – – (7,189) (7,189) 34,450 31,660 33,372
Roads, Pavements & Bridges 41,639 (7,189) (7,189) 34,450 31,660 33,372
Storm water – – – – – –
Infrastructure - Electricity 6,000 – – – – – 4,500 4,500 10,500 – –
Generation – – – – – –
Transmission & Reticulation 6,000 4,500 4,500 10,500 – –
Street Lighting – – – – – –
Infrastructure - Water 1,300 – – – (1,000) – (200) (1,200) 100 – 300
Dams & Reservoirs – – – – – –
Water purification – – – – – –
Reticulation 1,300 (1,000) (200) (1,200) 100 – 300
Infrastructure - Sanitation 2,000 – – – 1,000 – (600) 400 2,400 – 400
Reticulation 2,000 1,000 (600) 400 2,400 – 400
Sewerage purification – – – – – –
Infrastructure - Other 4,390 – – – – – (4,390) (4,390) – – –
Refuse 3,500 (3,500) (3,500) – – –
Transportation 2 – – – – – –
Gas – – – – – –
Other 3 890 (890) (890) – – – – –
Community 5,350 – – – 1,541 – (2,575) (1,034) 4,316 6,810 5,110
Parks & gardens 140 – (140) (140) – 150 –
Sports Fields & stadia 500 – (225) (225) 275 1,570 500
Swimming pools 150 20 (170) (150) – – –
Community halls – – – – – – –
Libraries – – 1,000 1,000 1,000 – –
Recreational facilities – – – – – – –
Fire, safety & emergency 980 – (980) (980) – – –
Security and policing 30 21 (10) 11 41 90 –
Buses – – – – – – –
Clinics 150 – (150) (150) – 150 –
Museums & Art Galleries – – – – – – –
Cemeteries 1,000 – (600) (600) 400 700 500
Social rental housing – – – – – – –
Other 2,400 1,500 (1,300) 200 2,600 4,150 4,110
Heritage assets 400 – – – (200) – 108 (92) 308 1,612 1,612
Buildings – – – – – –
Other 400 (200) 108 (92) 308 1,612 1,612
Investment properties – – – – – – – – – – –
Housing development – – – – – –
Other – – – – – –
Other assets 6,485 – – – 553 – (6,753) (6,200) 285 23,392 22,772
General vehicles 6,390 230 (6,620) (6,390) – 620 –
Specialised vehicles 18 – – – – – – – – – – –
Plant & equipment 95 35 (115) (80) 15 15 15
Computers - hardware/equipment – 128 (18) 110 110 – –
Furniture and other office equipment – – – – – – –
Abattoirs – – – – – – –
Markets – – – – – – –
Civic Land and Buildings – – – – – – –
Other Buildings – – – – – – –
Other Land – – – – – – –
Surplus Assets - (Investment or Inventory) – – – – – – –
Other – 160 – 160 160 22,757 22,757
Agricultural assets – – – – – – – – – – –
– – – – – –
List sub-class – –
Biological assets – – – – – – – – – – –
– – – – – –
List sub-class – –
Intangibles 100 – – – 150 – – 150 250 350 350
Computers - software & programming 100 150 – 150 250 350 350
Other (list sub-class) – – – – – –
Total Capital Expenditure on new assets to be adjusted 1 67,664 – – – 2,044 – (17,099) (15,054) 52,610 63,824 63,916
Specialised vehicles 18 – – – – – – – – – – –
Refuse – – – – – –
Fire – – – – – –
Conservancy – – – – – –
Ambulances – – – – – –
References
1. Total Capital Expenditure on new assets (SB18a) plus Total Capital Expenditure on renewal of existing assets (SB18b) must reconcile to total capital expenditure in Budgeted Capital Expenditure
2. Airports, Car Parks, Bus Terminals and Taxi Ranks
3. For example - technology backbones (e.g. fibre optic, WIFI infrastructure) for economic development purposes
4. Work-in-progress/under construction to be budgeted under the respective item
5. Infrastructure includes 'land and buildings required' by that infrastructure and vehicles/plant & equipment used by the service generated by that infrastructure
6. Donated/contributed & leased assets to be included within the respective sub-class
11. Adjustments to funding allocations from National or Provincial Government
13. G = B + C + D + E + F
Description
12. Adjusts. = 'Other' Adjustments proposed to be approved; including revenue under-collection (MFMA section 28(2)(a)); additional revenue appropriation on existing programmes (section 28(2))(b); projected savings (section 28(2)(d)); error correction (sec
14. Adjusted Budget H = (A or A1/2 etc) + G
7. Only complete if a previous adjusted budget has been approved in the same financial year. Reflect most recent adjusted budget.
8. Additional cash-backed accumulated funds/unspent funds (section 18(1)(b) and section 28(2)(e) MFMA) identified after Original Budget approved and after annual financial statements audited (note: only
where underspending could not reasonably be have for9. Increases of funds approved under section 31 MFMA
10. Adjustments approved in accordance with section 29 MFMA
Budget Year 2012/13
Ref
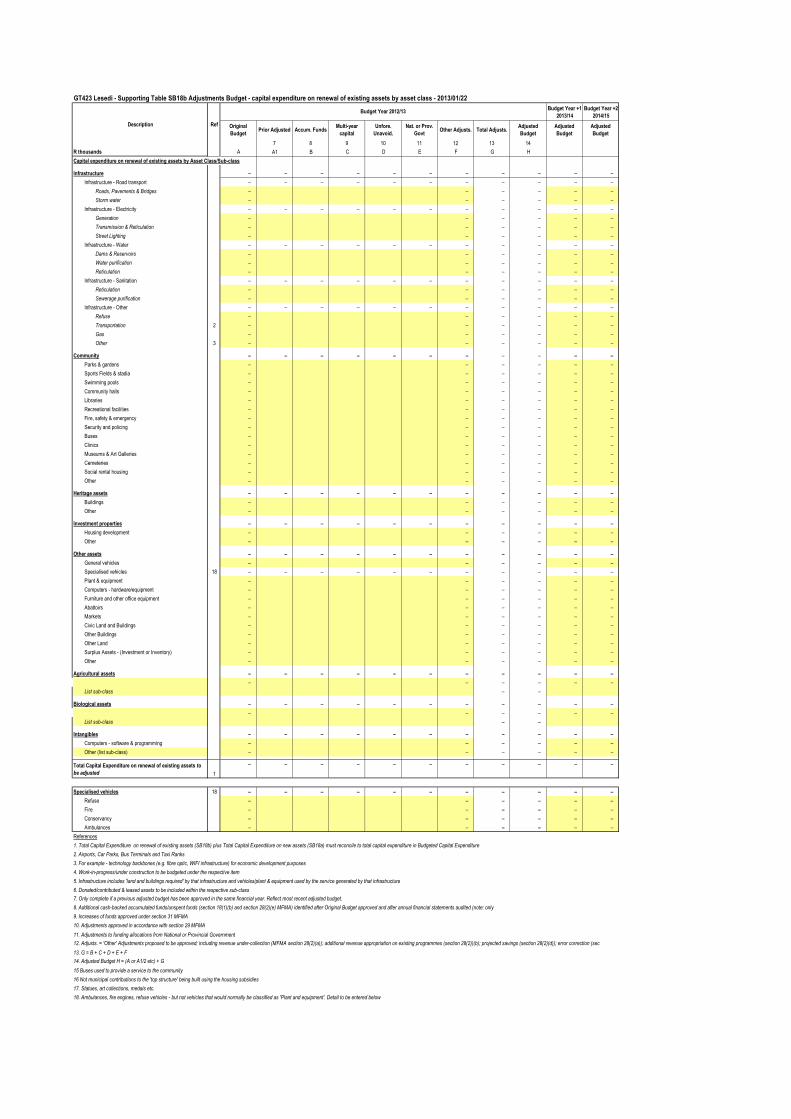
GT423 Lesedi - Supporting Table SB18b Adjustments Budget - capital expenditure on renewal of existing assets by asset class - 2013/01/22
Budget Year +1
2013/14
Budget Year +2
2014/15
Original
BudgetPrior Adjusted Accum. Funds
Multi-year
capital
Unfore.
Unavoid.
Nat. or Prov.
GovtOther Adjusts. Total Adjusts.
Adjusted
Budget
Adjusted
Budget
Adjusted
Budget
7 8 9 10 11 12 13 14
R thousands A A1 B C D E F G H
Capital expenditure on renewal of existing assets by Asset Class/Sub-class
Infrastructure – – – – – – – – – – –
Infrastructure - Road transport – – – – – – – – – – –
Roads, Pavements & Bridges – – – – – –
Storm water – – – – – –
Infrastructure - Electricity – – – – – – – – – – –
Generation – – – – – –
Transmission & Reticulation – – – – – –
Street Lighting – – – – – –
Infrastructure - Water – – – – – – – – – – –
Dams & Reservoirs – – – – – –
Water purification – – – – – –
Reticulation – – – – – –
Infrastructure - Sanitation – – – – – – – – – – –
Reticulation – – – – – –
Sewerage purification – – – – – –
Infrastructure - Other – – – – – – – – – – –
Refuse – – – – – –
Transportation 2 – – – – – –
Gas – – – – – –
Other 3 – – – – – – – –
Community – – – – – – – – – – –
Parks & gardens – – – – – –
Sports Fields & stadia – – – – – –
Swimming pools – – – – – –
Community halls – – – – – –
Libraries – – – – – –
Recreational facilities – – – – – –
Fire, safety & emergency – – – – – –
Security and policing – – – – – –
Buses – – – – – –
Clinics – – – – – –
Museums & Art Galleries – – – – – –
Cemeteries – – – – – –
Social rental housing – – – – – –
Other – – – – – –
Heritage assets – – – – – – – – – – –
Buildings – – – – – –
Other – – – – – –
Investment properties – – – – – – – – – – –
Housing development – – – – – –
Other – – – – – –
Other assets – – – – – – – – – – –
General vehicles – – – – – –
Specialised vehicles 18 – – – – – – – – – – –
Plant & equipment – – – – – –
Computers - hardware/equipment – – – – – –
Furniture and other office equipment – – – – – –
Abattoirs – – – – – –
Markets – – – – – –
Civic Land and Buildings – – – – – –
Other Buildings – – – – – –
Other Land – – – – – –
Surplus Assets - (Investment or Inventory) – – – – – –
Other – – – – – –
Agricultural assets – – – – – – – – – – –
– – – – – –
List sub-class – –
Biological assets – – – – – – – – – – –
– – – – – –
List sub-class – –
Intangibles – – – – – – – – – – –
Computers - software & programming – – – – – –
Other (list sub-class) – – – – – –
Total Capital Expenditure on renewal of existing assets to
be adjusted 1
– – – – – – – – – – –
Specialised vehicles 18 – – – – – – – – – – –
Refuse – – – – – –
Fire – – – – – –
Conservancy – – – – – –
Ambulances – – – – – –
References
1. Total Capital Expenditure on renewal of existing assets (SB18b) plus Total Capital Expenditure on new assets (SB18a) must reconcile to total capital expenditure in Budgeted Capital Expenditure
2. Airports, Car Parks, Bus Terminals and Taxi Ranks
3. For example - technology backbones (e.g. fibre optic, WIFI infrastructure) for economic development purposes
4. Work-in-progress/under construction to be budgeted under the respective item
5. Infrastructure includes 'land and buildings required' by that infrastructure and vehicles/plant & equipment used by the service generated by that infrastructure
6. Donated/contributed & leased assets to be included within the respective sub-class
11. Adjustments to funding allocations from National or Provincial Government
13. G = B + C + D + E + F
15 Buses used to provide a service to the community
16 Not municipal contributions to the 'top structure' being built using the housing subsidies
17. Statues, art collections, medals etc.
18. Ambulances, fire engines, refuse vehicles - but not vehicles that would normally be classified as 'Plant and equipment'. Detail to be entered below
Description Ref
Budget Year 2012/13
7. Only complete if a previous adjusted budget has been approved in the same financial year. Reflect most recent adjusted budget.
14. Adjusted Budget H = (A or A1/2 etc) + G
8. Additional cash-backed accumulated funds/unspent funds (section 18(1)(b) and section 28(2)(e) MFMA) identified after Original Budget approved and after annual financial statements audited (note: only
where underspending could not reasonably be have for9. Increases of funds approved under section 31 MFMA
10. Adjustments approved in accordance with section 29 MFMA
12. Adjusts. = 'Other' Adjustments proposed to be approved; including revenue under-collection (MFMA section 28(2)(a)); additional revenue appropriation on existing programmes (section 28(2))(b); projected savings (section 28(2)(d)); error correction (sec

GT423 Lesedi - Supporting Table SB18c Adjustments Budget - expenditure on repairs and maintenance by asset class - 2013/01/22
Budget Year
+1 2013/14
Budget Year
+2 2014/15
Original
BudgetPrior Adjusted Accum. Funds
Multi-year
capital
Unfore.
Unavoid.
Nat. or Prov.
GovtOther Adjusts. Total Adjusts.
Adjusted
Budget
Adjusted
Budget
Adjusted
Budget
7 8 9 10 11 12 13 14
R thousands A A1 B C D E F G H
Repairs and maintenance expenditure by Asset Class/Sub-class
Infrastructure 24,248 – – – – – (1,223) (1,223) 23,025 24,606 26,083
Infrastructure - Road transport 3,010 – – – – – (1,005) (1,005) 2,005 2,125 2,253
Roads, Pavements & Bridges 3,010 (1,005) (1,005) 2,005 2,125 2,253
Storm water – – – – – –
Infrastructure - Electricity 17,887 – – – – – (215) (215) 17,672 18,932 20,068
Generation – – – – – –
Transmission & Reticulation 17,137 (215) (215) 16,922 18,137 19,226
Street Lighting 750 – – 750 795 843
Infrastructure - Water 1,614 – – – – – (3) (3) 1,611 1,707 1,810
Dams & Reservoirs – – – – – –
Water purification – – – – – –
Reticulation 1,614 (3) (3) 1,611 1,707 1,810
Infrastructure - Sanitation 1,693 – – – – – – – 1,693 1,795 1,903
Reticulation 1,693 – – 1,693 1,795 1,903
Sewerage purification – – – – – –
Infrastructure - Other 44 – – – – – – – 44 47 49
Refuse 44 – – 44 47 49
Transportation 2 – – – – – –
Gas – – – – – –
Other 3 – – – – – – – –
Community 628 – – – (18) – (83) (101) 527 557 590
Parks & gardens 5 – (2) (2) 3 3 3
Sports Fields & stadia 102 – (0) (0) 102 108 115
Swimming pools 32 (20) – (20) 12 13 13
Community halls – – – – – – –
Libraries – – – – – – –
Recreational facilities – – – – – – –
Fire, safety & emergency 149 – (74) (74) 75 77 82
Security and policing 320 – (1) (1) 319 338 358
Buses – – – – – – –
Clinics 21 2 (6) (4) 17 18 19
Museums & Art Galleries – – – – – – –
Cemeteries – – – – – – –
Social rental housing – – – – – – –
Other – – – – – – –
Heritage assets – – – – – – – – – – –
Buildings – – – – – –
Other – – – – – –
Investment properties – – – – – – – – – – –
Housing development – – – – – –
Other – – – – – –
Other assets 2,651 – – – (77) – (404) (481) 2,170 2,046 2,169
General vehicles 231 – – 231 245 260
Specialised vehicles 18 – – – – – – – – – – –
Plant & equipment 505 4 (196) (193) 312 313 332
Computers - hardware/equipment – – – – – – –
Furniture and other office equipment 501 (16) (261) (277) 224 214 226
Abattoirs – – – – – – –
Markets – – – – – – –
Civic Land and Buildings 1,414 (65) 53 (12) 1,402 1,275 1,351
Other Buildings – – – – – – –
Other Land – – – – – – –
Surplus Assets - (Investment or Inventory) – – – – – – –
Other – – – – – – –
Agricultural assets – – – – – – – – – – –
– – – – – –
List sub-class – –
Biological assets – – – – – – – – – – –
– – – – – –
List sub-class – –
Intangibles – – – – – – – – – – –
Computers - software & programming – – – – – –
Other (list sub-class) – – – – – –
Total Repairs and Maintenance Expenditure to be
adjusted 1
27,528 – – – (95) – (1,711) (1,806) 25,722 27,210 28,842
Specialised vehicles 18 – – – – – – – – – – –
Refuse – – – – – –
Fire – – – – – –
Conservancy – – – – – –
Ambulances – – – – – –
References
1. Total Repairs and Maintenance Expenditure by Asset Category must reconcile to total repairs and maintenance expenditure on Table SB1
2. Airports, Car Parks, Bus Terminals and Taxi Ranks
3. For example - technology backbones (e.g. fibre optic, WIFI infrastructure) for economic development purposes
4. Work-in-progress/under construction to be budgeted under the respective item
5. Infrastructure includes 'land and buildings required' by that infrastructure and vehicles/plant & equipment used by the service generated by that infrastructure
6. Donated/contributed & leased assets to be included within the respective sub-class
11. Adjustments to funding allocations from National or Provincial Government
13. G = B + C + D + E + F
15. Buses used to provide a service to the community
16. Not municipal contributions to the 'top structure' being built using the housing subsidies
17. Statues, art collections, medals etc.
18. Ambulances, fire engines, refuse vehicles - but not vehicles that would normally be classified as 'Plant and equipment'. Detail to be entered below
Description Ref
Budget Year 2012/13
7. Only complete if a previous adjusted budget has been approved in the same financial year. Reflect most recent adjusted budget.
14. Adjusted Budget H = (A or A1/2 etc) + G
8. Additional cash-backed accumulated funds/unspent funds (section 18(1)(b) and section 28(2)(e) MFMA) identified after Original Budget approved and after annual financial statements audited (note: only
where underspending could not reasonably be have for9. Increases of funds approved under section 31 MFMA
10. Adjustments approved in accordance with section 29 MFMA
12. Adjusts. = 'Other' Adjustments proposed to be approved; including revenue under-collection (MFMA section 28(2)(a)); additional revenue appropriation on existing programmes (section 28(2))(b); projected savings (section 28(2)(d)); error correction (sec
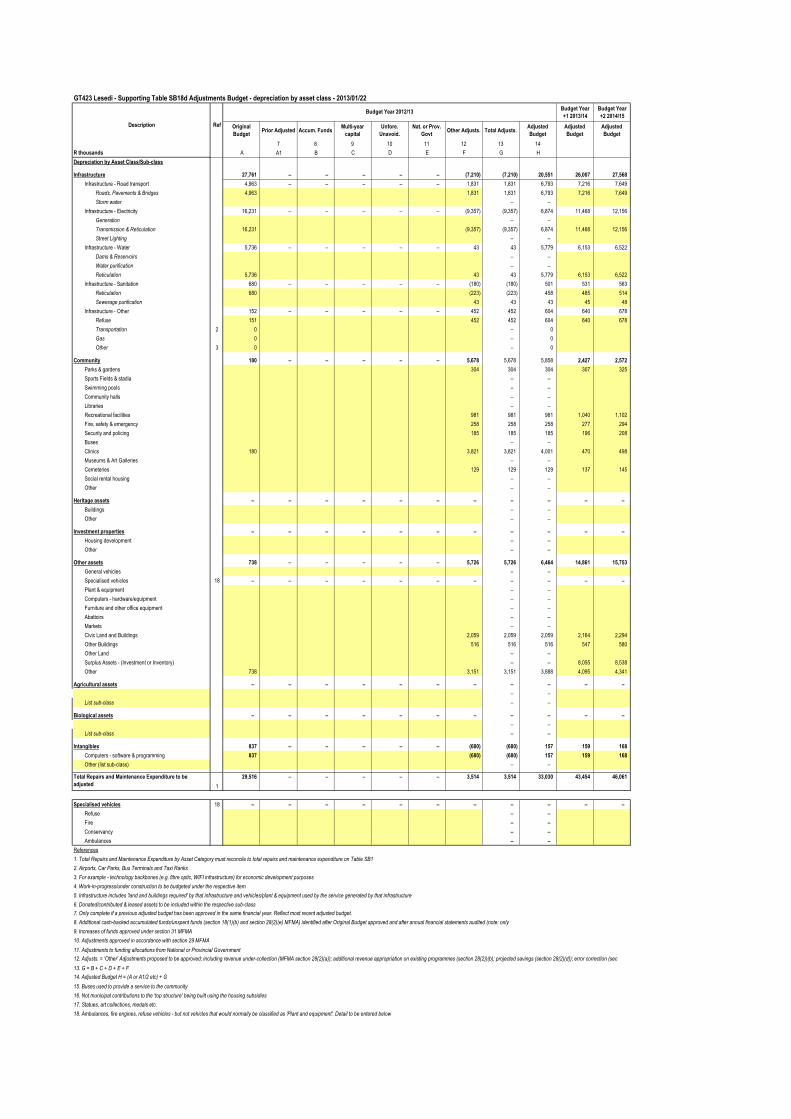
GT423 Lesedi - Supporting Table SB18d Adjustments Budget - depreciation by asset class - 2013/01/22
Budget Year
+1 2013/14
Budget Year
+2 2014/15
Original
BudgetPrior Adjusted Accum. Funds
Multi-year
capital
Unfore.
Unavoid.
Nat. or Prov.
GovtOther Adjusts. Total Adjusts.
Adjusted
Budget
Adjusted
Budget
Adjusted
Budget
7 8 9 10 11 12 13 14
R thousands A A1 B C D E F G H
Depreciation by Asset Class/Sub-class
Infrastructure 27,761 – – – – – (7,210) (7,210) 20,551 26,007 27,568
Infrastructure - Road transport 4,963 – – – – – 1,831 1,831 6,793 7,216 7,649
Roads, Pavements & Bridges 4,963 1,831 1,831 6,793 7,216 7,649
Storm water – –
Infrastructure - Electricity 16,231 – – – – – (9,357) (9,357) 6,874 11,468 12,156
Generation – –
Transmission & Reticulation 16,231 (9,357) (9,357) 6,874 11,468 12,156
Street Lighting – –
Infrastructure - Water 5,736 – – – – – 43 43 5,779 6,153 6,522
Dams & Reservoirs – –
Water purification – –
Reticulation 5,736 43 43 5,779 6,153 6,522
Infrastructure - Sanitation 680 – – – – – (180) (180) 501 531 563
Reticulation 680 (223) (223) 458 485 514
Sewerage purification 43 43 43 45 48
Infrastructure - Other 152 – – – – – 452 452 604 640 678
Refuse 151 452 452 604 640 678
Transportation 2 0 – 0
Gas 0 – 0
Other 3 0 – 0 – –
Community 180 – – – – – 5,678 5,678 5,858 2,427 2,572
Parks & gardens 304 304 304 307 325
Sports Fields & stadia – –
Swimming pools – –
Community halls – –
Libraries – –
Recreational facilities 981 981 981 1,040 1,102
Fire, safety & emergency 258 258 258 277 294
Security and policing 185 185 185 196 208
Buses – –
Clinics 180 3,821 3,821 4,001 470 498
Museums & Art Galleries – –
Cemeteries 129 129 129 137 145
Social rental housing – –
Other – –
Heritage assets – – – – – – – – – – –
Buildings – –
Other – –
Investment properties – – – – – – – – – – –
Housing development – –
Other – –
Other assets 738 – – – – – 5,726 5,726 6,464 14,861 15,753
General vehicles – –
Specialised vehicles 18 – – – – – – – – – – –
Plant & equipment – –
Computers - hardware/equipment – –
Furniture and other office equipment – –
Abattoirs – –
Markets – –
Civic Land and Buildings 2,059 2,059 2,059 2,164 2,294
Other Buildings 516 516 516 547 580
Other Land – –
Surplus Assets - (Investment or Inventory) – – 8,055 8,538
Other 738 3,151 3,151 3,888 4,095 4,341
Agricultural assets – – – – – – – – – – –
– –
List sub-class – –
Biological assets – – – – – – – – – – –
– –
List sub-class – –
Intangibles 837 – – – – – (680) (680) 157 159 168
Computers - software & programming 837 (680) (680) 157 159 168
Other (list sub-class) – –
Total Repairs and Maintenance Expenditure to be
adjusted 1
29,516 – – – – – 3,514 3,514 33,030 43,454 46,061
Specialised vehicles 18 – – – – – – – – – – –
Refuse – –
Fire – –
Conservancy – –
Ambulances – –
References
1. Total Repairs and Maintenance Expenditure by Asset Category must reconcile to total repairs and maintenance expenditure on Table SB1
2. Airports, Car Parks, Bus Terminals and Taxi Ranks
3. For example - technology backbones (e.g. fibre optic, WIFI infrastructure) for economic development purposes
4. Work-in-progress/under construction to be budgeted under the respective item
5. Infrastructure includes 'land and buildings required' by that infrastructure and vehicles/plant & equipment used by the service generated by that infrastructure
6. Donated/contributed & leased assets to be included within the respective sub-class
11. Adjustments to funding allocations from National or Provincial Government
13. G = B + C + D + E + F
15. Buses used to provide a service to the community
16. Not municipal contributions to the 'top structure' being built using the housing subsidies
17. Statues, art collections, medals etc.
18. Ambulances, fire engines, refuse vehicles - but not vehicles that would normally be classified as 'Plant and equipment'. Detail to be entered below
10. Adjustments approved in accordance with section 29 MFMA
12. Adjusts. = 'Other' Adjustments proposed to be approved; including revenue under-collection (MFMA section 28(2)(a)); additional revenue appropriation on existing programmes (section 28(2))(b); projected savings (section 28(2)(d)); error correction (sec
14. Adjusted Budget H = (A or A1/2 etc) + G
Description Ref
Budget Year 2012/13
7. Only complete if a previous adjusted budget has been approved in the same financial year. Reflect most recent adjusted budget.
8. Additional cash-backed accumulated funds/unspent funds (section 18(1)(b) and section 28(2)(e) MFMA) identified after Original Budget approved and after annual financial statements audited (note: only
where underspending could not reasonably be have for9. Increases of funds approved under section 31 MFMA
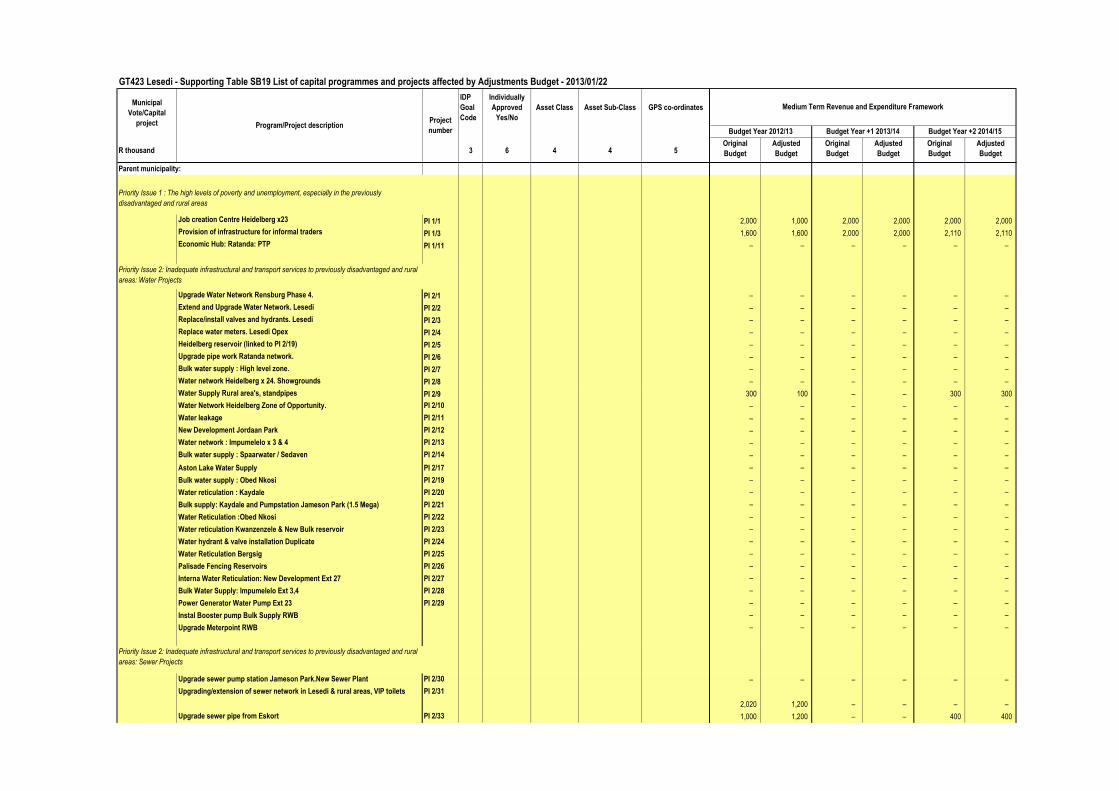
GT423 Lesedi - Supporting Table SB19 List of capital programmes and projects affected by Adjustments Budget - 2013/01/22
IDP
Goal
Code
Individually
Approved
Yes/No
Asset Class Asset Sub-Class GPS co-ordinates
R thousand 3 6 4 4 5Original
Budget
Adjusted
Budget
Original
Budget
Adjusted
Budget
Original
Budget
Adjusted
Budget
Parent municipality:
Job creation Centre Heidelberg x23 PI 1/1 2,000 1,000 2,000 2,000 2,000 2,000
Provision of infrastructure for informal traders PI 1/3 1,600 1,600 2,000 2,000 2,110 2,110
Economic Hub: Ratanda: PTP PI 1/11 – – – – – –
Upgrade Water Network Rensburg Phase 4. PI 2/1 – – – – – –
Extend and Upgrade Water Network. Lesedi PI 2/2 – – – – – –
Replace/install valves and hydrants. Lesedi PI 2/3 – – – – – –
Replace water meters. Lesedi Opex PI 2/4 – – – – – –
Heidelberg reservoir (linked to PI 2/19) PI 2/5 – – – – – –
Upgrade pipe work Ratanda network. PI 2/6 – – – – – –
Bulk water supply : High level zone. PI 2/7 – – – – – –
Water network Heidelberg x 24. Showgrounds PI 2/8 – – – – – –
Water Supply Rural area's, standpipes PI 2/9 300 100 – – 300 300
Water Network Heidelberg Zone of Opportunity. PI 2/10 – – – – – –
Water leakage PI 2/11 – – – – – –
New Development Jordaan Park PI 2/12 – – – – – –
Water network : Impumelelo x 3 & 4 PI 2/13 – – – – – –
Bulk water supply : Spaarwater / Sedaven PI 2/14 – – – – – –
Aston Lake Water Supply PI 2/17 – – – – – –
Bulk water supply : Obed Nkosi PI 2/19 – – – – – –
Water reticulation : Kaydale PI 2/20 – – – – – –
Bulk supply: Kaydale and Pumpstation Jameson Park (1.5 Mega) PI 2/21 – – – – – –
Water Reticulation :Obed Nkosi PI 2/22 – – – – – –
Water reticulation Kwanzenzele & New Bulk reservoir PI 2/23 – – – – – –
Water hydrant & valve installation Duplicate PI 2/24 – – – – – –
Water Reticulation Bergsig PI 2/25 – – – – – –
Palisade Fencing Reservoirs PI 2/26 – – – – – –
Interna Water Reticulation: New Development Ext 27 PI 2/27 – – – – – –
Bulk Water Supply: Impumelelo Ext 3,4 PI 2/28 – – – – – –
Power Generator Water Pump Ext 23 PI 2/29 – – – – – –
Instal Booster pump Bulk Supply RWB – – – – – –
Upgrade Meterpoint RWB – – – – – –
Upgrade sewer pump station Jameson Park.New Sewer Plant PI 2/30 – – – – – –
Upgrading/extension of sewer network in Lesedi & rural areas, VIP toilets PI 2/31
2,020 1,200 – – – –
Upgrade sewer pipe from Eskort PI 2/33 1,000 1,200 – – 400 400
Program/Project descriptionProject
number
Priority Issue 2: Inadequate infrastructural and transport services to previously disadvantaged and rural
areas: Water Projects
Priority Issue 1 : The high levels of poverty and unemployment, especially in the previously
disadvantaged and rural areas
Priority Issue 2: Inadequate infrastructural and transport services to previously disadvantaged and rural
areas: Sewer Projects
Medium Term Revenue and Expenditure Framework
Budget Year 2012/13 Budget Year +1 2013/14 Budget Year +2 2014/15
Municipal
Vote/Capital
project
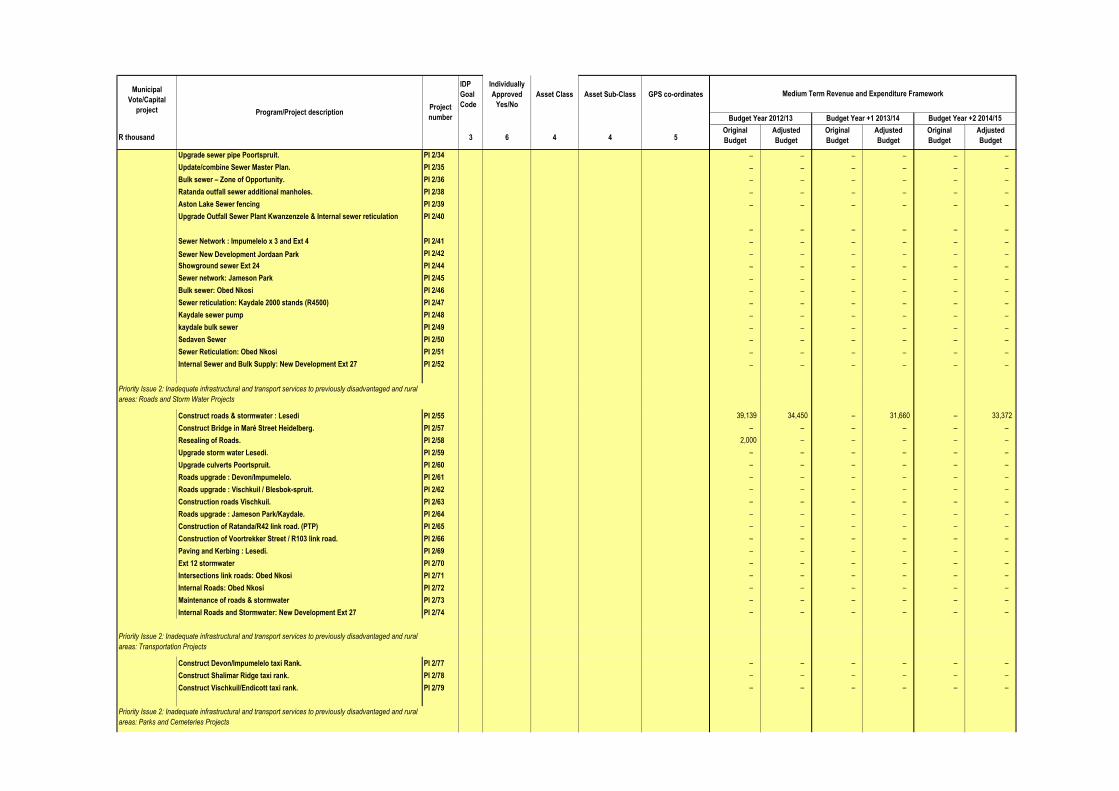
IDP
Goal
Code
Individually
Approved
Yes/No
Asset Class Asset Sub-Class GPS co-ordinates
R thousand 3 6 4 4 5Original
Budget
Adjusted
Budget
Original
Budget
Adjusted
Budget
Original
Budget
Adjusted
Budget
Program/Project descriptionProject
number
Medium Term Revenue and Expenditure Framework
Budget Year 2012/13 Budget Year +1 2013/14 Budget Year +2 2014/15
Municipal
Vote/Capital
project
Upgrade sewer pipe Poortspruit. PI 2/34 – – – – – –
Update/combine Sewer Master Plan. PI 2/35 – – – – – –
Bulk sewer – Zone of Opportunity. PI 2/36 – – – – – –
Ratanda outfall sewer additional manholes. PI 2/38 – – – – – –
Aston Lake Sewer fencing PI 2/39 – – – – – –
Upgrade Outfall Sewer Plant Kwanzenzele & Internal sewer reticulation PI 2/40
– – – – – –
Sewer Network : Impumelelo x 3 and Ext 4 PI 2/41 – – – – – –
Sewer New Development Jordaan Park PI 2/42 – – – – – –
Showground sewer Ext 24 PI 2/44 – – – – – –
Sewer network: Jameson Park PI 2/45 – – – – – –
Bulk sewer: Obed Nkosi PI 2/46 – – – – – –
Sewer reticulation: Kaydale 2000 stands (R4500) PI 2/47 – – – – – –
Kaydale sewer pump PI 2/48 – – – – – –
kaydale bulk sewer PI 2/49 – – – – – –
Sedaven Sewer PI 2/50 – – – – – –
Sewer Reticulation: Obed Nkosi PI 2/51 – – – – – –
Internal Sewer and Bulk Supply: New Development Ext 27 PI 2/52 – – – – – –
Construct roads & stormwater : Lesedi PI 2/55 39,139 34,450 – 31,660 – 33,372
Construct Bridge in Maré Street Heidelberg. PI 2/57 – – – – – –
Resealing of Roads. PI 2/58 2,000 – – – – –
Upgrade storm water Lesedi. PI 2/59 – – – – – –
Upgrade culverts Poortspruit. PI 2/60 – – – – – –
Roads upgrade : Devon/Impumelelo. PI 2/61 – – – – – –
Roads upgrade : Vischkuil / Blesbok-spruit. PI 2/62 – – – – – –
Construction roads Vischkuil. PI 2/63 – – – – – –
Roads upgrade : Jameson Park/Kaydale. PI 2/64 – – – – – –
Construction of Ratanda/R42 link road. (PTP) PI 2/65 – – – – – –
Construction of Voortrekker Street / R103 link road. PI 2/66 – – – – – –
Paving and Kerbing : Lesedi. PI 2/69 – – – – – –
Ext 12 stormwater PI 2/70 – – – – – –
Intersections link roads: Obed Nkosi PI 2/71 – – – – – –
Internal Roads: Obed Nkosi PI 2/72 – – – – – –
Maintenance of roads & stormwater PI 2/73 – – – – – –
Internal Roads and Stormwater: New Development Ext 27 PI 2/74 – – – – – –
Construct Devon/Impumelelo taxi Rank. PI 2/77 – – – – – –
Construct Shalimar Ridge taxi rank. PI 2/78 – – – – – –
Construct Vischkuil/Endicott taxi rank. PI 2/79 – – – – – –
Priority Issue 2: Inadequate infrastructural and transport services to previously disadvantaged and rural
areas: Roads and Storm Water Projects
Priority Issue 2: Inadequate infrastructural and transport services to previously disadvantaged and rural
areas: Transportation Projects
Priority Issue 2: Inadequate infrastructural and transport services to previously disadvantaged and rural
areas: Parks and Cemeteries Projects
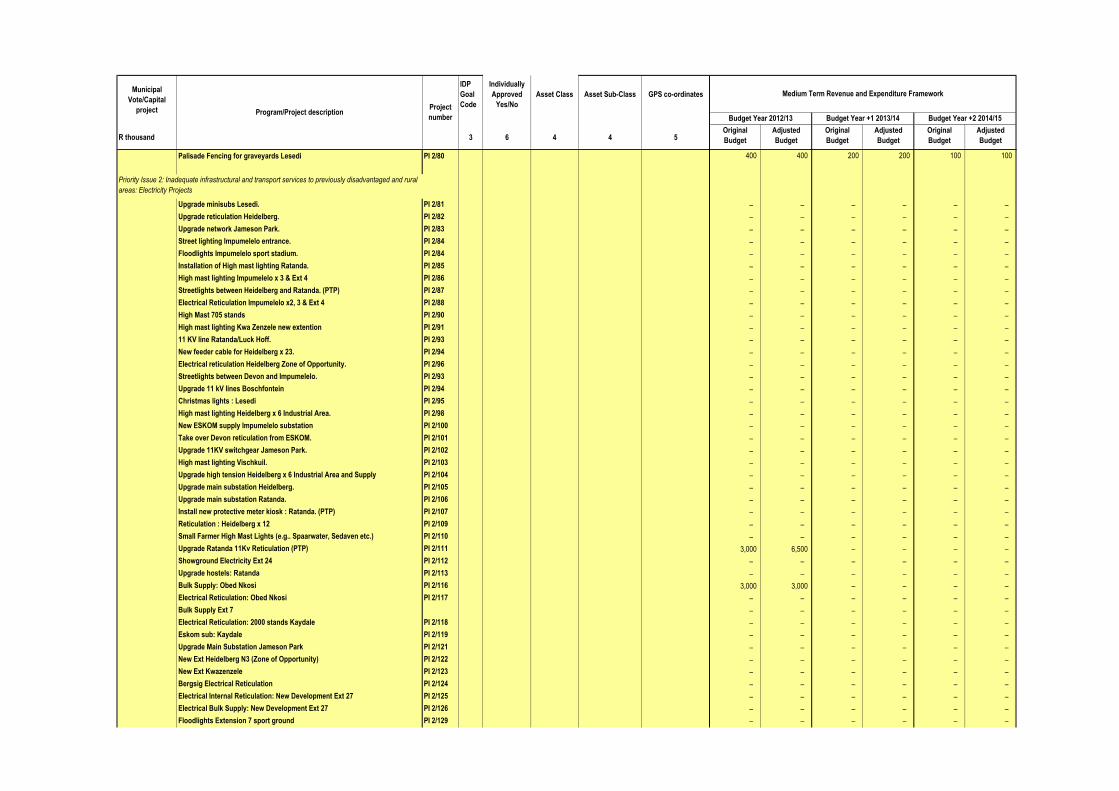
IDP
Goal
Code
Individually
Approved
Yes/No
Asset Class Asset Sub-Class GPS co-ordinates
R thousand 3 6 4 4 5Original
Budget
Adjusted
Budget
Original
Budget
Adjusted
Budget
Original
Budget
Adjusted
Budget
Program/Project descriptionProject
number
Medium Term Revenue and Expenditure Framework
Budget Year 2012/13 Budget Year +1 2013/14 Budget Year +2 2014/15
Municipal
Vote/Capital
project
Palisade Fencing for graveyards Lesedi PI 2/80 400 400 200 200 100 100
Upgrade minisubs Lesedi. PI 2/81 – – – – – –
Upgrade reticulation Heidelberg. PI 2/82 – – – – – –
Upgrade network Jameson Park. PI 2/83 – – – – – –
Street lighting Impumelelo entrance. PI 2/84 – – – – – –
Floodlights Impumelelo sport stadium. PI 2/84 – – – – – –
Installation of High mast lighting Ratanda. PI 2/85 – – – – – –
High mast lighting Impumelelo x 3 & Ext 4 PI 2/86 – – – – – –
Streetlights between Heidelberg and Ratanda. (PTP) PI 2/87 – – – – – –
Electrical Reticulation Impumelelo x2, 3 & Ext 4 PI 2/88 – – – – – –
High Mast 705 stands PI 2/90 – – – – – –
High mast lighting Kwa Zenzele new extention PI 2/91 – – – – – –
11 KV line Ratanda/Luck Hoff. PI 2/93 – – – – – –
New feeder cable for Heidelberg x 23. PI 2/94 – – – – – –
Electrical reticulation Heidelberg Zone of Opportunity. PI 2/96 – – – – – –
Streetlights between Devon and Impumelelo. PI 2/93 – – – – – –
Upgrade 11 kV lines Boschfontein PI 2/94 – – – – – –
Christmas lights : Lesedi PI 2/95 – – – – – –
High mast lighting Heidelberg x 6 Industrial Area. PI 2/98 – – – – – –
New ESKOM supply Impumelelo substation PI 2/100 – – – – – –
Take over Devon reticulation from ESKOM. PI 2/101 – – – – – –
Upgrade 11KV switchgear Jameson Park. PI 2/102 – – – – – –
High mast lighting Vischkuil. PI 2/103 – – – – – –
Upgrade high tension Heidelberg x 6 Industrial Area and Supply PI 2/104 – – – – – –
Upgrade main substation Heidelberg. PI 2/105 – – – – – –
Upgrade main substation Ratanda. PI 2/106 – – – – – –
Install new protective meter kiosk : Ratanda. (PTP) PI 2/107 – – – – – –
Reticulation : Heidelberg x 12 PI 2/109 – – – – – –
Small Farmer High Mast Lights (e.g.. Spaarwater, Sedaven etc.) PI 2/110 – – – – – –
Upgrade Ratanda 11Kv Reticulation (PTP) PI 2/111 3,000 6,500 – – – –
Showground Electricity Ext 24 PI 2/112 – – – – – –
Upgrade hostels: Ratanda PI 2/113 – – – – – –
Bulk Supply: Obed Nkosi PI 2/116 3,000 3,000 – – – –
Electrical Reticulation: Obed Nkosi PI 2/117 – – – – – –
Bulk Supply Ext 7 – – – – – –
Electrical Reticulation: 2000 stands Kaydale PI 2/118 – – – – – –
Eskom sub: Kaydale PI 2/119 – – – – – –
Upgrade Main Substation Jameson Park PI 2/121 – – – – – –
New Ext Heidelberg N3 (Zone of Opportunity) PI 2/122 – – – – – –
New Ext Kwazenzele PI 2/123 – – – – – –
Bergsig Electrical Reticulation PI 2/124 – – – – – –
Electrical Internal Reticulation: New Development Ext 27 PI 2/125 – – – – – –
Electrical Bulk Supply: New Development Ext 27 PI 2/126 – – – – – –
Floodlights Extension 7 sport ground PI 2/129 – – – – – –
Priority Issue 2: Inadequate infrastructural and transport services to previously disadvantaged and rural
areas: Electricity Projects
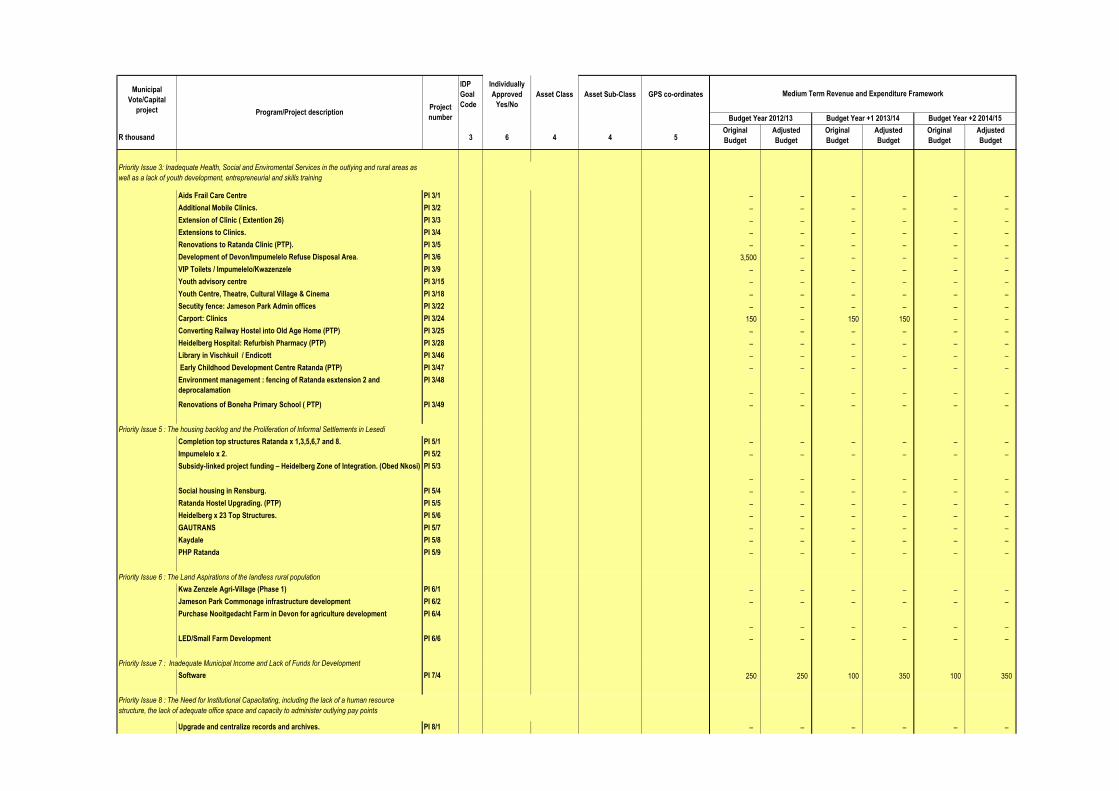
IDP
Goal
Code
Individually
Approved
Yes/No
Asset Class Asset Sub-Class GPS co-ordinates
R thousand 3 6 4 4 5Original
Budget
Adjusted
Budget
Original
Budget
Adjusted
Budget
Original
Budget
Adjusted
Budget
Program/Project descriptionProject
number
Medium Term Revenue and Expenditure Framework
Budget Year 2012/13 Budget Year +1 2013/14 Budget Year +2 2014/15
Municipal
Vote/Capital
project
Aids Frail Care Centre PI 3/1 – – – – – –
Additional Mobile Clinics. PI 3/2 – – – – – –
Extension of Clinic ( Extention 26) PI 3/3 – – – – – –
Extensions to Clinics. PI 3/4 – – – – – –
Renovations to Ratanda Clinic (PTP). PI 3/5 – – – – – –
Development of Devon/Impumelelo Refuse Disposal Area. PI 3/6 3,500 – – – – –
VIP Toilets / Impumelelo/Kwazenzele PI 3/9 – – – – – –
Youth advisory centre PI 3/15 – – – – – –
Youth Centre, Theatre, Cultural Village & Cinema PI 3/18 – – – – – –
Secutity fence: Jameson Park Admin offices PI 3/22 – – – – – –
Carport: Clinics PI 3/24 150 – 150 150 – –
Converting Railway Hostel into Old Age Home (PTP) PI 3/25 – – – – – –
Heidelberg Hospital: Refurbish Pharmacy (PTP) PI 3/28 – – – – – –
Library in Vischkuil / Endicott PI 3/46 – – – – – –
Early Childhood Development Centre Ratanda (PTP) PI 3/47 – – – – – –
Environment management : fencing of Ratanda esxtension 2 and
deprocalamation
PI 3/48
– – – – – –
Renovations of Boneha Primary School ( PTP) PI 3/49 – – – – – –
Completion top structures Ratanda x 1,3,5,6,7 and 8. PI 5/1 – – – – – –
Impumelelo x 2. PI 5/2 – – – – – –
Subsidy-linked project funding – Heidelberg Zone of Integration. (Obed Nkosi) PI 5/3
– – – – – –
Social housing in Rensburg. PI 5/4 – – – – – –
Ratanda Hostel Upgrading. (PTP) PI 5/5 – – – – – –
Heidelberg x 23 Top Structures. PI 5/6 – – – – – –
GAUTRANS PI 5/7 – – – – – –
Kaydale PI 5/8 – – – – – –
PHP Ratanda PI 5/9 – – – – – –
Kwa Zenzele Agri-Village (Phase 1) PI 6/1 – – – – – –
Jameson Park Commonage infrastructure development PI 6/2 – – – – – –
Purchase Nooitgedacht Farm in Devon for agriculture development PI 6/4
– – – – – –
LED/Small Farm Development PI 6/6 – – – – – –
Software PI 7/4 250 250 100 350 100 350
Upgrade and centralize records and archives. PI 8/1 – – – – – –
Priority Issue 3: Inadequate Health, Social and Enviromental Services in the outlying and rural areas as
well as a lack of youth development, entrepreneurial and skills training
Priority Issue 5 : The housing backlog and the Proliferation of Informal Settlements in Lesedi
Priority Issue 7 : Inadequate Municipal Income and Lack of Funds for Development
Priority Issue 6 : The Land Aspirations of the landless rural population
Priority Issue 8 : The Need for Institutional Capacitating, including the lack of a human resource
structure, the lack of adequate office space and capacity to administer outlying pay points
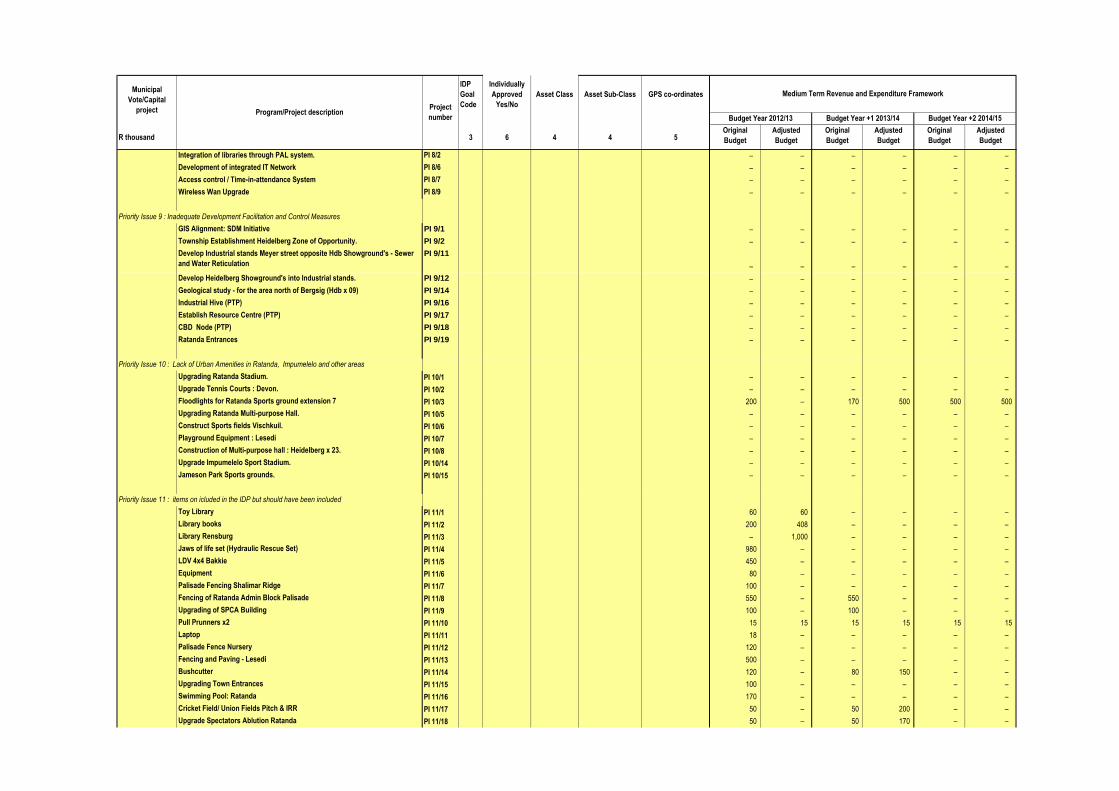
IDP
Goal
Code
Individually
Approved
Yes/No
Asset Class Asset Sub-Class GPS co-ordinates
R thousand 3 6 4 4 5Original
Budget
Adjusted
Budget
Original
Budget
Adjusted
Budget
Original
Budget
Adjusted
Budget
Program/Project descriptionProject
number
Medium Term Revenue and Expenditure Framework
Budget Year 2012/13 Budget Year +1 2013/14 Budget Year +2 2014/15
Municipal
Vote/Capital
project
Integration of libraries through PAL system. PI 8/2 – – – – – –
Development of integrated IT Network PI 8/6 – – – – – –
Access control / Time-in-attendance System PI 8/7 – – – – – –
Wireless Wan Upgrade PI 8/9 – – – – – –
GIS Alignment: SDM Initiative PI 9/1 – – – – – –
Township Establishment Heidelberg Zone of Opportunity. PI 9/2 – – – – – –
Develop Industrial stands Meyer street opposite Hdb Showground's - Sewer
and Water Reticulation
PI 9/11
– – – – – –
Develop Heidelberg Showground's into Industrial stands. PI 9/12 – – – – – –
Geological study - for the area north of Bergsig (Hdb x 09) PI 9/14 – – – – – –
Industrial Hive (PTP) PI 9/16 – – – – – –
Establish Resource Centre (PTP) PI 9/17 – – – – – –
CBD Node (PTP) PI 9/18 – – – – – –
Ratanda Entrances PI 9/19 – – – – – –
Upgrading Ratanda Stadium. PI 10/1 – – – – – –
Upgrade Tennis Courts : Devon. PI 10/2 – – – – – –
Floodlights for Ratanda Sports ground extension 7 PI 10/3 200 – 170 500 500 500
Upgrading Ratanda Multi-purpose Hall. PI 10/5 – – – – – –
Construct Sports fields Vischkuil. PI 10/6 – – – – – –
Playground Equipment : Lesedi PI 10/7 – – – – – –
Construction of Multi-purpose hall : Heidelberg x 23. PI 10/8 – – – – – –
Upgrade Impumelelo Sport Stadium. PI 10/14 – – – – – –
Jameson Park Sports grounds. PI 10/15 – – – – – –
Toy Library PI 11/1 60 60 – – – –
Library books PI 11/2 200 408 – – – –
Library Rensburg PI 11/3 – 1,000 – – – –
Jaws of life set (Hydraulic Rescue Set) PI 11/4 980 – – – – –
LDV 4x4 Bakkie PI 11/5 450 – – – – –
Equipment PI 11/6 80 – – – – –
Palisade Fencing Shalimar Ridge PI 11/7 100 – – – – –
Fencing of Ratanda Admin Block Palisade PI 11/8 550 – 550 – – –
Upgrading of SPCA Building PI 11/9 100 – 100 – – –
Pull Prunners x2 PI 11/10 15 15 15 15 15 15
Laptop PI 11/11 18 – – – – –
Palisade Fence Nursery PI 11/12 120 – – – – –
Fencing and Paving - Lesedi PI 11/13 500 – – – – –
Bushcutter PI 11/14 120 – 80 150 – –
Upgrading Town Entrances PI 11/15 100 – – – – –
Swimming Pool: Ratanda PI 11/16 170 – – – – –
Cricket Field/ Union Fields Pitch & IRR PI 11/17 50 – 50 200 – –
Upgrade Spectators Ablution Ratanda PI 11/18 50 – 50 170 – –
Priority Issue 10 : Lack of Urban Amenities in Ratanda, Impumelelo and other areas
Priority Issue 9 : Inadequate Development Facilitation and Control Measures
Priority Issue 11 : items on icluded in the IDP but should have been included
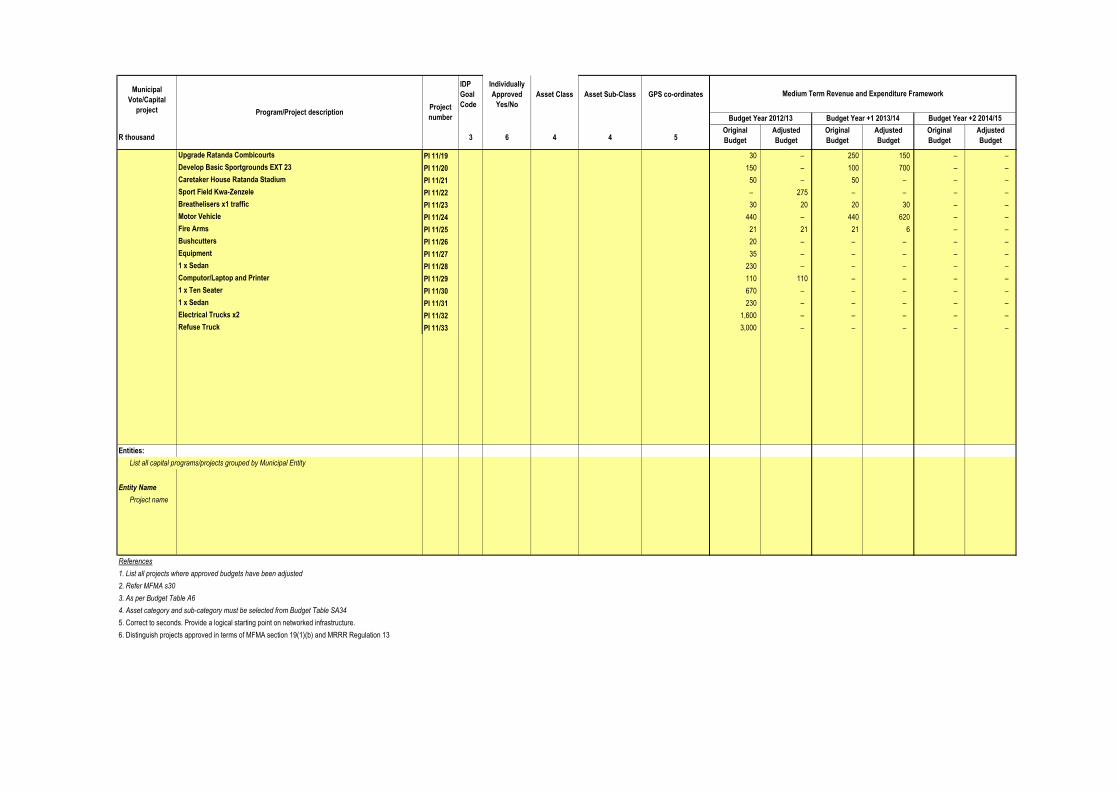
IDP
Goal
Code
Individually
Approved
Yes/No
Asset Class Asset Sub-Class GPS co-ordinates
R thousand 3 6 4 4 5Original
Budget
Adjusted
Budget
Original
Budget
Adjusted
Budget
Original
Budget
Adjusted
Budget
Program/Project descriptionProject
number
Medium Term Revenue and Expenditure Framework
Budget Year 2012/13 Budget Year +1 2013/14 Budget Year +2 2014/15
Municipal
Vote/Capital
project
Upgrade Ratanda Combicourts PI 11/19 30 – 250 150 – –
Develop Basic Sportgrounds EXT 23 PI 11/20 150 – 100 700 – –
Caretaker House Ratanda Stadium PI 11/21 50 – 50 – – –
Sport Field Kwa-Zenzele PI 11/22 – 275 – – – –
Breathelisers x1 traffic PI 11/23 30 20 20 30 – –
Motor Vehicle PI 11/24 440 – 440 620 – –
Fire Arms PI 11/25 21 21 21 6 – –
Bushcutters PI 11/26 20 – – – – –
Equipment PI 11/27 35 – – – – –
1 x Sedan PI 11/28 230 – – – – –
Computor/Laptop and Printer PI 11/29 110 110 – – – –
1 x Ten Seater PI 11/30 670 – – – – –
1 x Sedan PI 11/31 230 – – – – –
Electrical Trucks x2 PI 11/32 1,600 – – – – –
Refuse Truck PI 11/33 3,000 – – – – –
Entities:
List all capital programs/projects grouped by Municipal Entity
Entity Name
Project name
References
1. List all projects where approved budgets have been adjusted
2. Refer MFMA s30
3. As per Budget Table A6
4. Asset category and sub-category must be selected from Budget Table SA34
5. Correct to seconds. Provide a logical starting point on networked infrastructure.
6. Distinguish projects approved in terms of MFMA section 19(1)(b) and MRRR Regulation 13
Budget Year
+1 2013/14
Budget Year
+2 2014/15
Original
BudgetPrior Adjusted Accum. Funds
Multi-year
capital
Unfore.
Unavoid.
Nat. or Prov.
GovtOther Adjusts. Total Adjusts.
Adjusted
Budget
Adjusted
Budget
Adjusted
Budget
3 4 5 6 8 9 10 11
R thousands A A1 B C D E F G H
Revenue By Municipal Entity
Entity 1 total revenue – –
Entity 2 total revenue – –
Entity 3 (etc) total revenue – –
– –
– –
– –
– –
– –
– –
– –
Total Operating Revenue 1 – – – – – – – – – – –
Expenditure By Municipal Entity
Entity 1 total operating expenditure – –
Entity 2 total operating expenditure – –
Entity 3 etc. total operating expenditure – –
– –
– –
– –
– –
– –
– –
– –
Total Operating Expenditure 2 – – – – – – – – – – –
Capital Expenditure By Municipal Entity
Entity 1 total capital expenditure – –
Entity 2 total capital expenditure – –
Entity 3 etc. total capital expenditure – –
– –
– –
– –
– –
– –
– –
– –
Total Capital Expenditure 2 – – – – – – – – – – –
References
1. Must reconcile to the sum of all municipal entity monthly revenue reports
2. Must reconcile to the sum of all municipal entity monthly expenditure reports
7. Adjustments made under delegation by the AO since the budget was approved or since a previously 'approved' Adjustments Budget in the same financial year
8. Adjustments to funding allocations by National or Provincial Government
10. H = B + C + D + E + F + G
11. Adjusted Budget (I) = (A or A1/2 etc) + H
9. Adjusts. = 'Other' Adjustments approved by entity Board; including revenue under-collection ; additional revenue appropriation on existing programmes; projected savings; error correction
5. Increases of funds approved under section 87 MFMA
6. Adjustments approved in accordance with section 87 MFMA
3. Only complete if a previous adjusted budget has been approved in the same financial year. Reflect most recent adjusted budget.
4. Additional cash-backed accumulated funds/unspent funds identified after Original Budget approved and after annual financial statements audited (note: only where underspending could not reasonably be have foreseen)
GT423 Lesedi - Supporting Table SB20 Not required - 2013/01/22
Description Ref
Budget Year 2012/13