Embed Size (px)
Citation preview
27/09/2010
Commercial-in-Confidence
Clear Focus — The economic impact of
vision loss in New Zealand in 2009
September 2010
Report by Access Economics Pty Limited for
VISION 2020 Australia in support of the VISION
2020 New Zealand Trust
Clear Focus — The economic impact of vision loss in New Zealand in 2009
2
© Access Economics Pty Limited
This work is copyright. The Copyright Act 1968 (Australia) permits fair dealing for study, research, news reporting,
criticism or review. Selected passages, tables or diagrams may be reproduced for such purposes provided
acknowledgment of the source is included. Permission for any more extensive reproduction must be obtained from
Access Economics Pty Limited through the contact officer listed for this report.
Disclaimer
While every effort has been made to ensure the accuracy of this document and any attachments, the uncertain nature
of economic data, forecasting and analysis means that Access Economics Pty Limited is unable to make any warranties
in relation to the information contained herein. Access Economics Pty Limited, its employees and agents disclaim
liability for any loss or damage which may arise as a consequence of any person relying on the information contained
in this document and any attachments.
Access Economics Pty Limited ABN 82 113 621 361
www.AccessEconomics.com.au
CANBERRA MELBOURNE SYDNEY
Level 1
9 Sydney Avenue
Barton ACT 2600
Level 27
150 Lonsdale Street
Melbourne VIC 3000
Suite 1401, Level 14
68 Pitt Street
Sydney NSW 2000
T: +61 2 6175 2000
F: +61 2 6175 2001 T: +61 3 9659 8300
F: +61 3 9659 8301
T: +61 2 9376 2500
F: +61 2 9376 2501
For information on this report please contact Lynne Pezzullo or Penny Taylor
Report prepared by
Penny Taylor
Katie Mapp
Economic impact of vision loss in New Zealand
Commercial-in-Confidence
Acknowledgements
This report was co-commissioned by VISION 2020 New Zealand and VISION 2020 Australia. A
generous invitation from VISION 2020 Australia to join this 2009 review has led to the first
comprehensive analysis of the financial and personal costs of vision loss in New Zealand.
The financial support of the Royal Australian and New Zealand College of Ophthalmologists
(New Zealand branch) and the Royal New Zealand Foundation of the Blind in association with
VISION 2020 New Zealand is gratefully acknowledged.
VISION 2020 New Zealand is a national body committed to the prevention of avoidable
blindness and vision loss in New Zealand. The right to sight, transforming eye health and vision
care through early detection, treatment and education.
Access Economics would like to acknowledge with appreciation the comments and expert
input from the following contributors.
■ Don McKenzie, Chair, VISION 2020 New Zealand;
■ David Squirrell, ophthalmologist;
■ Dianne Sharp, ophthalmologist;
■ Geoff Duff, ophthalmologist;
■ Professor Richard Edwards, Department of Public Health, Otago University, Wellington;
■ Mike Frith, optometrist;
■ New Zealand Ministry of Health;
■ Health Research Council of New Zealand;
■ Royal New Zealand Foundation of the Blind;
■ Statistics New Zealand;
■ Work and Income New Zealand;
■ PHARMAC, the Pharmaceutical Management Agency of New Zealand; and
■ Carers New Zealand.
Economic impact of vision loss in New Zealand
Commercial-in-Confidence
Contents
Executive Summary ....................................................................................................................... 1
1 Background ......................................................................................................................... 3
2 Prevalence rates and projections ....................................................................................... 4
2.1 Definitions - vision loss and blindness ................................................................................... 4
2.2 Studies of the prevalence of vision loss in New Zealand ....................................................... 5
2.3 The basis for epidemiological estimates in this report .......................................................... 6
2.4 Cataract .................................................................................................................................. 8
2.5 Diabetic retinopathy ............................................................................................................ 11
2.6 Glaucoma ............................................................................................................................. 13
2.7 Age-related macular degeneration ...................................................................................... 16
2.8 Refractive error .................................................................................................................... 19
2.9 Overall prevalence of vision loss and projections ................................................................ 24
3 Mortality ........................................................................................................................... 31
3.1 Co-morbidities ..................................................................................................................... 31
4 Health costs ....................................................................................................................... 33
4.2 Hospital inpatient................................................................................................................. 33
4.3 Hospital outpatient .............................................................................................................. 36
4.4 Summary of hospital costs ................................................................................................... 37
4.5 General Practice (GP) ........................................................................................................... 38
4.6 Pharmaceuticals ................................................................................................................... 39
4.7 Allied health ......................................................................................................................... 42
4.8 Research ............................................................................................................................... 42
4.9 Aged care ............................................................................................................................. 43
4.10 Health costs summary .......................................................................................................... 43
4.11 Health expenditure projections to 2020 .............................................................................. 45
5 Other financial costs ......................................................................................................... 48
5.1 Productivity losses ............................................................................................................... 48
5.2 Informal care costs ............................................................................................................... 50
5.3 Funeral costs ........................................................................................................................ 53
5.4 Aids and home modifications .............................................................................................. 53
5.5 Welfare payments ................................................................................................................ 54
5.6 Deadweight losses from transfers ....................................................................................... 56
5.7 Summary of other financial costs ........................................................................................ 57
6 Loss of wellbeing ............................................................................................................... 59
6.1 Methodology ........................................................................................................................ 59
6.2 Loss of wellbeing from vision disorders in 2009 .................................................................. 62
7 The total cost of vision loss in New Zealand ..................................................................... 66
8 International comparisons ................................................................................................ 68
9 New Zealand health policy in context ............................................................................... 77
Economic impact of vision loss in New Zealand
Commercial-in-Confidence
References ................................................................................................................................... 83
Appendix A: Literature search ..................................................................................................... 92
Charts
Chart 2.1 : Projections of New Zealanders (aged 40 or over) with vision loss, 2009 .................. 25
Chart 2.2 : Vision loss by cause among New Zealanders aged 40 or over, 2009(a) .................... 28
Chart 2.3 : Vision loss not correctable by refraction, by cause among Australians aged 40 or
over, 2004 ................................................................................................................................... 29
Chart 2.4 : Blindness by cause among New Zealanders aged 50 or over, 2009 ......................... 30
Chart 4.1 : Annual public hospital inpatient and day stay expenditure on diseases of the eye
and adnexa, by age, 2009-10 ($) ................................................................................................. 34
Chart 4.2 : Public hospital inpatient and day stay expenditure by disease, 2009 ...................... 35
Chart 4.3 : Hospital discharge rates for diseases of the eye and adnexa per 1,000 people (a) .. 36
Chart 4.4 : Location of medical specialist appointment for adults 2006-07 ............................... 37
Chart 4.5 : Health system expenditure, 2009 (total $198 million) (a) (b) ................................... 44
Chart 4.6 : Health system costs ($), 2009 and 2020.................................................................... 47
Chart 7.1 : Components of total economic cost of vision loss in 2009 (total $2.8 billion) ......... 67
Chart 8.1 : Projections of Australians aged 40 or over with vision loss ...................................... 75
Tables
Table 2.1 : Total number of people with a vision loss in New Zealand by ethnicity and age,
2006 5
Table 2.2 : Proportion of children in New Zealand with a permanent vision problem, 2006-07
(%) 6
Table 2.3 : Rate of vision loss by age and ethnicity, 2006 ............................................................. 7
Table 2.4 : Prevalence rates for vision loss and blindness from cataract, 2009 ........................... 8
Table 2.5 : Vision loss from cataract – projected numbers of non-Māori people ........................ 9
Table 2.6 : Vision loss from cataract - projected numbers of Māori people .............................. 10
Table 2.7 : Blindness from cataract - projected numbers of non-Māori people ........................ 10
Table 2.8 : Blindness from cataract - projected numbers of Māori people ................................ 10
Table 2.9 : Prevalence rates for vision loss and blindness from diabetic retinopathy, 2009 ..... 12
Table 2.10 : Vision loss from diabetic retinopathy – projected numbers of non-Māori people 12
Table 2.11 : Vision loss from diabetic retinopathy - projected numbers of Māori people ......... 13
Table 2.12 : Prevalence rates for vision loss and blindness from glaucoma ............................... 14
Economic impact of vision loss in New Zealand
Commercial-in-Confidence
Table 2.13 : Vision loss from glaucoma – projected numbers of non-Māori people .................. 15
Table 2.14 : Vision loss from glaucoma - projected numbers of Māori people .......................... 15
Table 2.15 : Blindness from glaucoma - projected numbers of non-Māori people .................... 15
Table 2.16 : Blindness from glaucoma - projected numbers of Māori people ........................... 16
Table 2.17 : Prevalence rates for vision loss and blindness from AMD ...................................... 17
Table 2.18 : Vision loss from AMD – projected numbers of non-Māori people ......................... 18
Table 2.19 : Vision loss from AMD - projected numbers of Māori people ................................. 18
Table 2.20 : Blindness from AMD - projected numbers of non-Māori people ........................... 19
Table 2.21 : Blindness from AMD - projected numbers of Māori people ................................... 19
Table 2.22 : Prevalence rates for vision loss and blindness from uncorrected refractive error(a)20
Table 2.23 : Vision loss from uncorrected refractive error – projected numbers of non-Māori
people.......................................................................................................................................... 21
Table 2.24 : Vision loss from uncorrected refractive error - projected numbers of Māori people21
Table 2.25 : Blindness from uncorrected refractive error - projected numbers of non-Māori
people.......................................................................................................................................... 22
Table 2.26 : Blindness from uncorrected refractive error - projected numbers of Māori people22
Table 2.27 : Near vision loss due to uncorrected presbyopia in those with normal distance
vision - number of people(a) ....................................................................................................... 23
Table 2.28 : Prevalence rates for overall vision loss and blindness (b) ....................................... 24
Table 2.29 : Overall vision loss - numbers of non-Māori people (a) ........................................... 25
Table 2.30 : Overall vision loss - numbers of Māori people (a) ................................................... 26
Table 2.31 : Overall blindness – numbers of non-Māori people ................................................. 26
Table 2.32 : Overall blindness – numbers of Māori people ........................................................ 27
Table 4.1 : Health service use, age-standardised, by gender and ethnicity, 2006-07 ................ 33
Table 4.2 : Public hospital inpatient and day stay discharge rates per 1,000 people, 2006-07 .. 35
Table 4.3 : Overall hospital costs, 2009....................................................................................... 38
Table 4.4 : Number of vision related GP visits, RNZFB survey population, 2006 ........................ 38
Table 4.5 : Total spend on vision related GP appointments, moderately and severely vision
impaired population (visual acuity ≥ 6/24), 2009 ....................................................................... 39
Table 4.6 : PHARMAC subsidised glaucoma medications, volume of prescriptions and
expenditure, 2009 (a) .................................................................................................................. 40
Table 4.7 : Prevalence of wet AMD (vision impaired population), 2009 .................................... 40
Table 4.8 : Expenditure on bevacizumab, ranibizumab, and combination of the two agents,
2009 (a) ....................................................................................................................................... 41
Table 4.9 : HRC research projects relating to vision loss, 2009, $............................................... 42
Table 4.10 : Probability of Residing in an Aged Care Facility due to vision loss and associated
per annum costs, 2009 ................................................................................................................ 43
Economic impact of vision loss in New Zealand
Commercial-in-Confidence
Table 4.11 : Health system costs, 2009 (a) .................................................................................. 44
Table 4.12 : Health system costs - projections to 2020 .............................................................. 46
Table 5.1 : Labour force status of adults aged 15–64 with a seeing disability living in households48
Table 5.2 : AWE for full-time and part-time employed in 2009 ................................................. 49
Table 5.3 : Productivity loss due to lower employment, 2009 ................................................... 49
Table 5.4 : Lost lifetime earnings due to premature death, 2009 .............................................. 50
Table 5.5 : Productivity loss due to lower employment, 2009 ................................................... 50
Table 5.6 : Assistance needed by adults with a seeing disability, 2006 ...................................... 51
Table 5.7 : Assistance provided to individuals with vision loss (visual acuity worse than 6/24),
2006 52
Table 5.8 : Opportunity cost of informal care for those with moderate to severe vision loss,
2009 53
Table 5.9 : Equipment, technology or services used by individuals with a seeing disability, 200154
Table 5.10 : Equipment, technology or services used by RNZFB members, 2006 ...................... 54
Table 5.11 : Welfare benefits for the vision impaired, April 2009 .............................................. 55
Table 5.12 : Welfare payments made to vision impaired individuals or their carers, 2009 ....... 56
Table 5.13 : Summary of other financial costs associated with vision loss in 2009 ................... 57
Table 6.1 : Vision disorders - derived disability weights(a) ......................................................... 63
Table 6.2 : Estimated YLDs from vision disorders in 2009 (a) (b) ................................................ 63
Table 6.3 : Estimated YLLs from vision disorders in 2009 (a) ..................................................... 64
Table 6.4 : Estimated DALYs from vision disorders in 2009 (a) .................................................. 64
Table 7.1 : Summary of total cost of vision loss in 2009 by cost type ....................................... 66
Table 8.1 : Prevalence rates for vision loss (%) ........................................................................... 68
Table 8.2 : Distribution of vision impairment based on best-corrected visual acuity by cause (%)69
Table 8.3 : Summary of global results for the burden of disease study in vision impairment,
(USD) 70
Table 8.4 : Vision loss in the UK, 2008 ........................................................................................ 71
Table 8.5 : Summary of costs associated with partial sight and blindness in UK adults 2008 .... 71
Table 8.6 : Prevalence of vision loss, Canada, 2007 .................................................................... 72
Table 8.7 : Comparing the economic impact of vision loss in Australia and New Zealand, 2009 76
Table A.1 : Literature searches conducted for this report through MEDLINE/PubMed ............. 92
Economic impact of vision loss in New Zealand
Commercial-in-Confidence
Glossary
AMD Age related macular degeneration
AWE Average weekly earnings
BMES Blue Mountains Eye Study
CERA Centre for Eye Research Australia
CNV Choroidal neovascularisation
CPI Consumer price index
DALY Disability adjusted life year
DM Diabetes mellitus
DR Diabetic retinopathy
DWL Deadweight loss
GA Geographic Atrophic
GP General Practice
HRC Health Research Council
IVI Impact of Vision Impairment (Questionnaire)
MD macular degeneration
MOH Ministry of Health
NHS National Health Survey
NZBDS New Zealand Burden of Disease Study
OECD Organisation for Economic Co-operation and Development
R&D Research and development
RE Refractive error
RNZFB Royal New Zealand Foundation of the Blind
RPE Retinal pigment epithelium
RR Relative risk
VIP (Melbourne) Visual Impairment Project
VSLY Value of a statistical life year
WHO World Health Organisation
WINZ Work and Income New Zealand
WTP Willingness-to-pay
YLD Years lived with disability
YLL (healthy) years of life lost
Economic impact of vision loss in New Zealand
1 Commercial-in-Confidence
Executive Summary
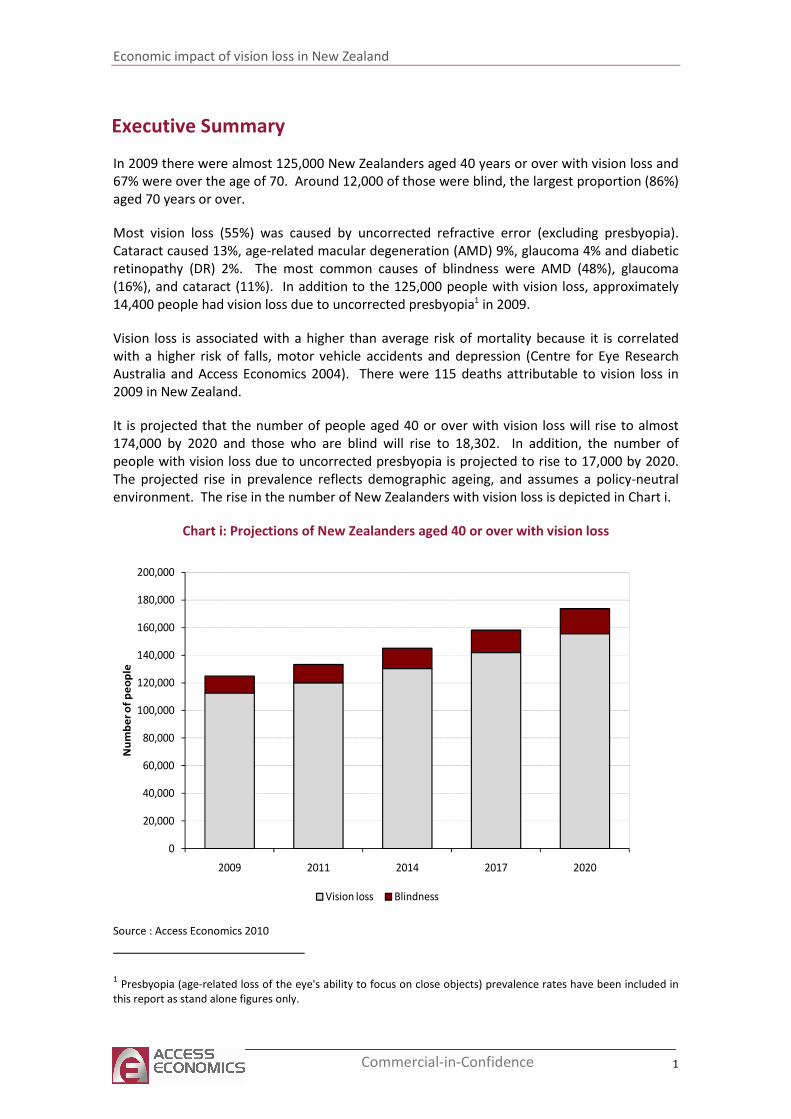
In 2009 there were almost 125,000 New Zealanders aged 40 years or over with vision loss and
67% were over the age of 70. Around 12,000 of those were blind, the largest proportion (86%)
aged 70 years or over.
Most vision loss (55%) was caused by uncorrected refractive error (excluding presbyopia).
Cataract caused 13%, age-related macular degeneration (AMD) 9%, glaucoma 4% and diabetic
retinopathy (DR) 2%. The most common causes of blindness were AMD (48%), glaucoma
(16%), and cataract (11%). In addition to the 125,000 people with vision loss, approximately
14,400 people had vision loss due to uncorrected presbyopia1 in 2009.
Vision loss is associated with a higher than average risk of mortality because it is correlated
with a higher risk of falls, motor vehicle accidents and depression (Centre for Eye Research
Australia and Access Economics 2004). There were 115 deaths attributable to vision loss in
2009 in New Zealand.
It is projected that the number of people aged 40 or over with vision loss will rise to almost
174,000 by 2020 and those who are blind will rise to 18,302. In addition, the number of
people with vision loss due to uncorrected presbyopia is projected to rise to 17,000 by 2020.
The projected rise in prevalence reflects demographic ageing, and assumes a policy-neutral
environment. The rise in the number of New Zealanders with vision loss is depicted in Chart i.
Chart i: Projections of New Zealanders aged 40 or over with vision loss
0
20,000
40,000
60,000
80,000
100,000
120,000
140,000
160,000
180,000
200,000
2009 2011 2014 2017 2020
Nu
mb
er
of
pe
op
le
Vision loss Blindness
Source : Access Economics 2010
1 Presbyopia (age-related loss of the eye's ability to focus on close objects) prevalence rates have been included in
this report as stand alone figures only.
Economic impact of vision loss in New Zealand
2 Commercial-in-Confidence
In 2009, the total financial cost of vision loss (excluding loss of wellbeing) was estimated to be
$400 million, or $3,206 per person with vision loss aged over 40 years.
■ In 2009, total health system expenditure on disorders of the eye and adnexa was
estimated at $198 million or $1,583 per person with vision loss aged over 40.
■ Productivity losses of those with vision loss were approximately $112 million in 2009.
This included losses due to lower than average employment rates (adjusted for age) of
those with vision loss, losses resulting from premature mortality, and the ‘bring forward’
of employer search and hiring costs due to premature mortality
■ Productivity losses of family and friends who care for people with vision loss on an
unpaid basis were around $21 million. This reflects the opportunity cost of informal
carers’ time.
■ The costs of aids and the ‘bring forward’ of funeral costs were approximately $30 million
in 2009.
■ Deadweight losses (the economic cost associated with administering the taxation and
transfer system and which also arises because of distortions to behaviour) were
estimated to be $39 million in 2009.
■ The loss of wellbeing that results from vision loss was estimated using Disability
Adjusted Life Years (DALYs),2 which incorporate the detriment to health, as well as
premature mortality. In 2009, vision loss was associated with 11,756 DALYs.
■ The monetary value of the loss of well being in 2009 was $2.4 billion. If this is added to
the financial costs, the overall cost of vision loss in 2009 was $2.8 billion, or $22,217 per
person with vision loss aged over 40.
Access Economics
2010
2 Note that the term ‘loss of wellbeing’ is used throughout this report instead of the well defined concept in health
economics, ‘burden of disease’ as measured by disability adjusted life years (DALYs). It measures the suffering and
premature death from a disease or injury and does not imply that people experiencing disease or injury are a
burden on society.
Economic impact of vision loss in New Zealand
3 Commercial-in-Confidence
1 Background
This report was sponsored by VISION 2020 New Zealand in collaboration with VISION 2020
Australia. It complements a similar report, ‘Clear focus: the economic impact of vision loss in
Australia in 2009’ (Access Economics 2010), and updates a previous report commissioned by
the Centre for Eye Research Australia, ‘Clear insight: the Economic Impact and Cost of Vision
Loss in Australia’ (Access Economics 2004). This report estimates the economic impact of
vision loss in New Zealand in 2009. The prevalence, direct health system costs, indirect costs
and loss of wellbeing are reported, with a focus on the most common sources of vision loss:
■ Cataract;
■ Diabetic retinopathy;
■ Glaucoma;
■ Age-related macular degeneration; and
■ Uncorrected refractive error - hyperopia, myopia, astigmatism and presbyopia.
Few previous economic studies on vision loss have been undertaken in New Zealand. A 2006
report commissioned by the Royal New Zealand Foundation of the Blind (RNZFB) found the
combined cost to society and the individual of moderate vision loss and blindness was
between $88.5 million and $816 million in 2004 with most costs borne by the individual and
their family. This estimate does not include data collected from all secondary sources such as
all government payments and RNZFB costs due to lack of information or consistency in the
data received.
Several employment and life satisfaction studies of New Zealanders with vision loss have been
completed by La Grow et al (2005, 2007, 2008, 2009) including an analysis of data from the
2006 Health, Work, and Retirement Study. It was found those with vision loss were financially
disadvantaged, in worse physical and mental health, and had less social support than
individuals with no vision problems (La Grow et al 2009). La Grow and Daye (2005) earlier
found 79% of the surveyed RNZFB population aged between 18 and 65 had experienced
barriers to gaining and retaining employment. Career advancement was also thought to be
restricted. No significant differences were found by sex, age, or degree of vision loss.
This report provides comprehensive data on the overall prevalence of mild to severe vision
loss, including blindness, in the non-Māori and Māori populations in 2009. Health system
expenditures, productivity losses, informal care costs, the cost of aids, government welfare
payments, and loss of wellbeing have then been summed to estimate the overall cost of mild
to severe vision loss in New Zealand in 2009.
Economic impact of vision loss in New Zealand
4 Commercial-in-Confidence
2 Prevalence rates and projections
This chapter presents estimates of the prevalence of vision loss and blindness from various eye
conditions in 2009, as well as projections to 2020. Prevalence estimates are produced for the
following common specific eye conditions:
■ Cataract;
■ Diabetic retinopathy (DR).
■ Glaucoma;
■ Age-related macular degeneration (AMD); and
■ Uncorrected refractive error (RE).
2.1 Definitions - vision loss and blindness
Vision loss can broadly be defined as a limitation in one or more functions of the eye or vision
system. This most commonly involves impairment of visual acuity (sharpness or clarity of
vision), visual field (the ability to detect objects to either side, above or below the direction of
sight), and/or colour vision. Colour blindness, a genetic inability or reduced ability to
distinguish differences in hue, is not a subject of this report.
Unimpaired vision is recorded as 6/6 (20/20 in imperial measures). The first number in this
ratio is interpreted as the furthermost distance in metres that a particular individual can
clearly see an object. The second number is the distance at which an individual with
unimpaired vision can clearly see the same object. A figure of 6/12, for example, would
indicate that an individual can clearly see at a distance of six metres what a person with
unimpaired vision could see at a distance of twelve metres.
Visual field is measured in terms of degrees from the point of fixation. For example, <10o field
means that the person can only see in a visual field of less than ten degrees radius from the
point of fixation.
Government departments in New Zealand are guided by the World Health Organisation
(WHO) International Classification of Diseases when defining vision loss (personal
communication, RNZFB 28 April 2010). Low vision is defined as visual acuity of less than 6/18,
but equal to or better than 3/60, or a corresponding visual field loss to less than 20 degrees in
the better eye with best possible correction. Blindness is defined as visual acuity of less than
3/60, or a corresponding visual field loss to less than 10 degrees in the better eye with best
possible correction. RNZFB membership is based on visual acuity not exceeding 6/24 in the
better eye with correcting lenses or serious limitations in the field of vision generally not
greater than 20 degrees in the widest diameter3.
This report defines vision loss as being less than driving vision, which is measured as 6/12.
Blindness prevalence and projections are estimated by using the definition of visual acuity of
less than 6/60 or visual field of less than 10 degrees, or both. The definitions of vision loss
used here reflect the epidemiological studies used as the basis for the prevalence estimates as
outlined in section 2.3. Notably, they incorporate low vision and blindness as per the WHO
3 http://www.rnzfb.org.nz/members/become-a-member/membership-criteria
Economic impact of vision loss in New Zealand
5 Commercial-in-Confidence
definitions, but include an additional group with milder vision loss (equal to 6/18 but worse
than 6/12).
2.2 Studies of the prevalence of vision loss in New Zealand
Literature searches were undertaken in March 2010 for epidemiological evidence of vision loss
in New Zealand through the PubMed/MEDLINE database. Search terms and results are listed
in Appendix A, Table A.1. Large scale ophthalmological surveys of the prevalence of vision loss
in New Zealand were not identified by this review. However, three (non clinical) sources of
estimates of the prevalence of vision loss were identified — Statistics New Zealand (2002,
2007), RNZFB (2006) and Ministry of Health (2008).
The 2001 and 2006 New Zealand disability surveys (Statistics New Zealand 2002, 2007)
investigated the prevalence of vision loss in the adult population. Survey responses do not
necessarily reflect medical diagnoses because respondents nominated their degree of seeing
disability from a list of descriptors of severity:
■ Can see newspaper print, but with difficulty;
■ Cannot see newspaper print;
■ Can see someone’s face across the room, but with difficulty; and
■ Cannot see someone’s face across the room.
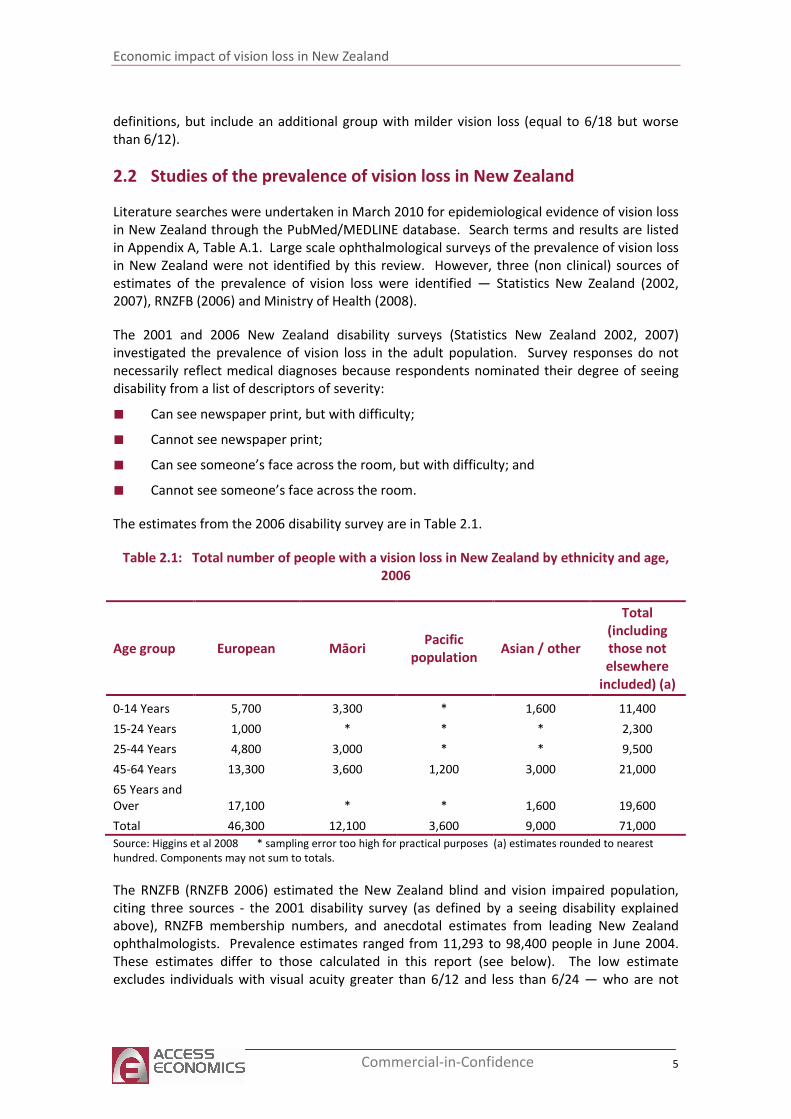
The estimates from the 2006 disability survey are in Table 2.1.
Table 2.1: Total number of people with a vision loss in New Zealand by ethnicity and age,
2006
Age group European Māori Pacific
population Asian / other
Total
(including
those not
elsewhere
included) (a)
0-14 Years 5,700 3,300 * 1,600 11,400
15-24 Years 1,000 * * * 2,300
25-44 Years 4,800 3,000 * * 9,500
45-64 Years 13,300 3,600 1,200 3,000 21,000
65 Years and
Over 17,100 * * 1,600 19,600
Total 46,300 12,100 3,600 9,000 71,000
Source: Higgins et al 2008 * sampling error too high for practical purposes (a) estimates rounded to nearest
hundred. Components may not sum to totals.
The RNZFB (RNZFB 2006) estimated the New Zealand blind and vision impaired population,
citing three sources - the 2001 disability survey (as defined by a seeing disability explained
above), RNZFB membership numbers, and anecdotal estimates from leading New Zealand
ophthalmologists. Prevalence estimates ranged from 11,293 to 98,400 people in June 2004.
These estimates differ to those calculated in this report (see below). The low estimate
excludes individuals with visual acuity greater than 6/12 and less than 6/24 — who are not
Economic impact of vision loss in New Zealand
6 Commercial-in-Confidence
eligible for RNZFB membership — but who are included as part of the population with vision
loss in this report. The high estimate is based on self-report by respondents to the New
Zealand disability survey based on the definitions above. The basis for the epidemiological
estimates in this report is explained in section 2.3.
The New Zealand Health Survey (Ministry of Health 2008) was last conducted in 2006-07 and
involved more than 17,000 New Zealanders. The prevalence of vision loss was only measured
in children (Table 2.2). Adults were asked if they had been, ‘told by a doctor that their child
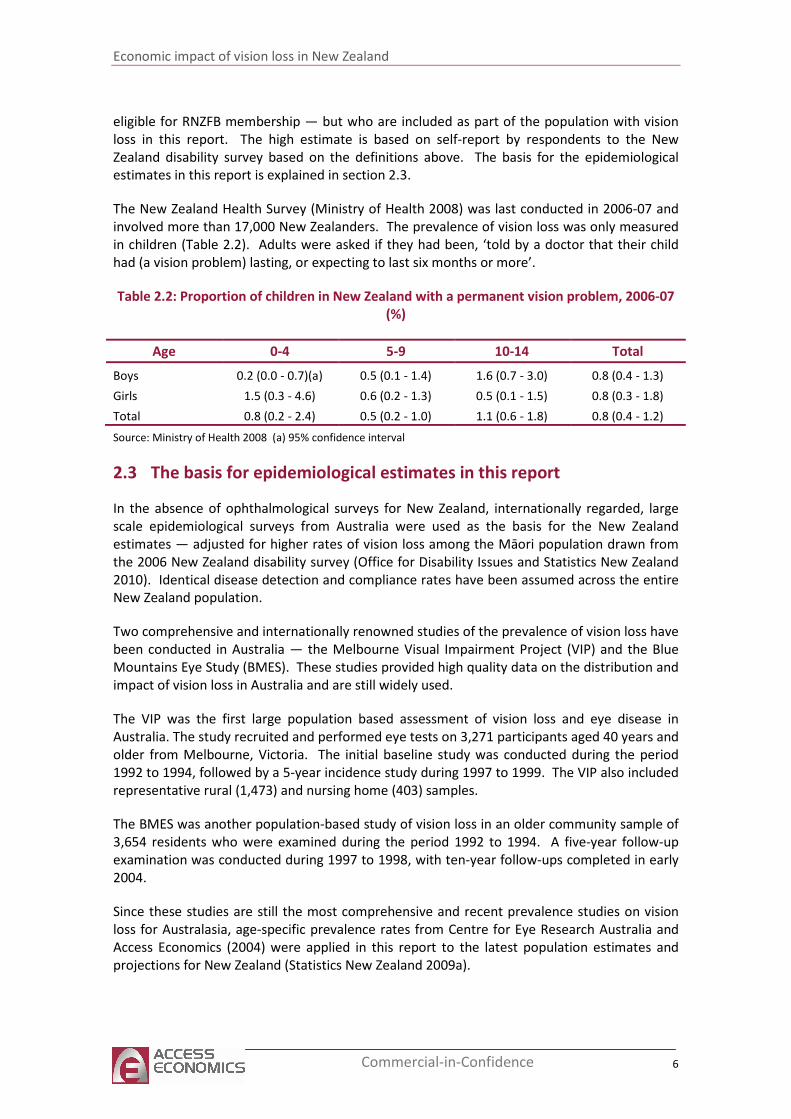
had (a vision problem) lasting, or expecting to last six months or more’.
Table 2.2: Proportion of children in New Zealand with a permanent vision problem, 2006-07
(%)
Age 0-4 5-9 10-14 Total
Boys 0.2 (0.0 - 0.7)(a) 0.5 (0.1 - 1.4) 1.6 (0.7 - 3.0) 0.8 (0.4 - 1.3)
Girls 1.5 (0.3 - 4.6) 0.6 (0.2 - 1.3) 0.5 (0.1 - 1.5) 0.8 (0.3 - 1.8)
Total 0.8 (0.2 - 2.4) 0.5 (0.2 - 1.0) 1.1 (0.6 - 1.8) 0.8 (0.4 - 1.2)
Source: Ministry of Health 2008 (a) 95% confidence interval
2.3 The basis for epidemiological estimates in this report
In the absence of ophthalmological surveys for New Zealand, internationally regarded, large
scale epidemiological surveys from Australia were used as the basis for the New Zealand
estimates — adjusted for higher rates of vision loss among the Māori population drawn from
the 2006 New Zealand disability survey (Office for Disability Issues and Statistics New Zealand
2010). Identical disease detection and compliance rates have been assumed across the entire
New Zealand population.
Two comprehensive and internationally renowned studies of the prevalence of vision loss have
been conducted in Australia — the Melbourne Visual Impairment Project (VIP) and the Blue
Mountains Eye Study (BMES). These studies provided high quality data on the distribution and
impact of vision loss in Australia and are still widely used.
The VIP was the first large population based assessment of vision loss and eye disease in
Australia. The study recruited and performed eye tests on 3,271 participants aged 40 years and
older from Melbourne, Victoria. The initial baseline study was conducted during the period
1992 to 1994, followed by a 5-year incidence study during 1997 to 1999. The VIP also included
representative rural (1,473) and nursing home (403) samples.
The BMES was another population-based study of vision loss in an older community sample of
3,654 residents who were examined during the period 1992 to 1994. A five-year follow-up
examination was conducted during 1997 to 1998, with ten-year follow-ups completed in early
2004.
Since these studies are still the most comprehensive and recent prevalence studies on vision
loss for Australasia, age-specific prevalence rates from Centre for Eye Research Australia and
Access Economics (2004) were applied in this report to the latest population estimates and
projections for New Zealand (Statistics New Zealand 2009a).
Economic impact of vision loss in New Zealand
7 Commercial-in-Confidence
Refined rates for the prevalence of glaucoma for this report were drawn from Centre for Eye
Research Australia and Access Economics (2008) as discussed in Section 2.6. In addition, the
age-specific prevalence profile for DR was adjusted to account for differences in the
prevalence of diabetes mellitus by ethnicity. This adjustment is detailed in Section 2.5.
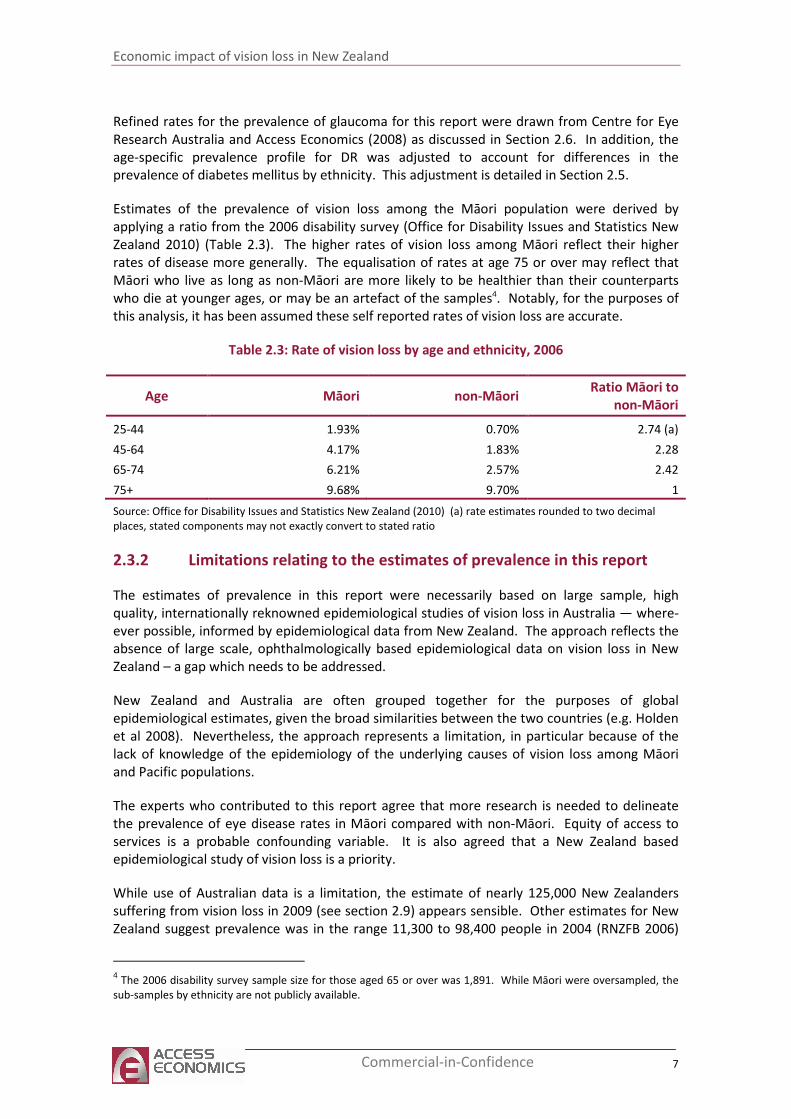
Estimates of the prevalence of vision loss among the Māori population were derived by
applying a ratio from the 2006 disability survey (Office for Disability Issues and Statistics New
Zealand 2010) (Table 2.3). The higher rates of vision loss among Māori reflect their higher
rates of disease more generally. The equalisation of rates at age 75 or over may reflect that
Māori who live as long as non-Māori are more likely to be healthier than their counterparts
who die at younger ages, or may be an artefact of the samples4. Notably, for the purposes of
this analysis, it has been assumed these self reported rates of vision loss are accurate.
Table 2.3: Rate of vision loss by age and ethnicity, 2006
Age Māori non-Māori Ratio Māori to
non-Māori
25-44 1.93% 0.70% 2.74 (a)
45-64 4.17% 1.83% 2.28
65-74 6.21% 2.57% 2.42
75+ 9.68% 9.70% 1
Source: Office for Disability Issues and Statistics New Zealand (2010) (a) rate estimates rounded to two decimal
places, stated components may not exactly convert to stated ratio
2.3.2 Limitations relating to the estimates of prevalence in this report
The estimates of prevalence in this report were necessarily based on large sample, high
quality, internationally reknowned epidemiological studies of vision loss in Australia — where-
ever possible, informed by epidemiological data from New Zealand. The approach reflects the
absence of large scale, ophthalmologically based epidemiological data on vision loss in New
Zealand – a gap which needs to be addressed.
New Zealand and Australia are often grouped together for the purposes of global
epidemiological estimates, given the broad similarities between the two countries (e.g. Holden
et al 2008). Nevertheless, the approach represents a limitation, in particular because of the
lack of knowledge of the epidemiology of the underlying causes of vision loss among Māori
and Pacific populations.
The experts who contributed to this report agree that more research is needed to delineate
the prevalence of eye disease rates in Māori compared with non-Māori. Equity of access to
services is a probable confounding variable. It is also agreed that a New Zealand based
epidemiological study of vision loss is a priority.
While use of Australian data is a limitation, the estimate of nearly 125,000 New Zealanders
suffering from vision loss in 2009 (see section 2.9) appears sensible. Other estimates for New
Zealand suggest prevalence was in the range 11,300 to 98,400 people in 2004 (RNZFB 2006)
4 The 2006 disability survey sample size for those aged 65 or over was 1,891. While Māori were oversampled, the
sub-samples by ethnicity are not publicly available.
Economic impact of vision loss in New Zealand
8 Commercial-in-Confidence
and 71,000 in 2006 (Statistics New Zealand 2007). Given the different definitions of vision loss
used in these studies (in particular the addition in this study of those with milder vision loss —
ie better than 6/24 and worse than 6/12 as explained in section 2.2), the ageing of the New
Zealand population, and broad similarities between the New Zealand and Australian
populations, the estimate of prevalence here provides a useful base for deriving associated
economic and social costs.
2.4 Cataract
A cataract is a crystalline lens that has gone cloudy resulting in a reduction in vision. The lens
is made mostly of water and protein, with the protein arranged to let light pass through and
focus on the retina. Some of the protein may clump together and cloud an area of the lens.
This is a cataract. Over time, the cataract may grow larger and cloud more of the lens, making
it harder to see. The most common symptoms of cataract are cloudy or blurry vision; problems
with light - headlights that seem too bright, glare from lamps or the sun, or a halo or haze
around lights; colours that seem faded; double or multiple vision; and /or frequent changes
required in eyeglasses or contact lenses.
There are four main causes of cataract:
■ Age-related cataract: Most cataracts are related to aging.
■ Congenital cataract: Some babies are born with cataracts or develop them in childhood,
often in both eyes. If they affect vision, they may need to be removed.
■ Secondary cataract: Cataracts may be linked to certain other health issues, such as
diabetes or steroid use.
■ Traumatic cataract: Cataracts can develop soon after an eye injury, or years later.
Causes of cataract are still uncertain. Detection is through an eye examination including a
visual acuity test (eye chart test) and pupil dilation (where the pupil is widened with eye-drops
to allow the eye care professional to see more of the lens and look for other eye problems).
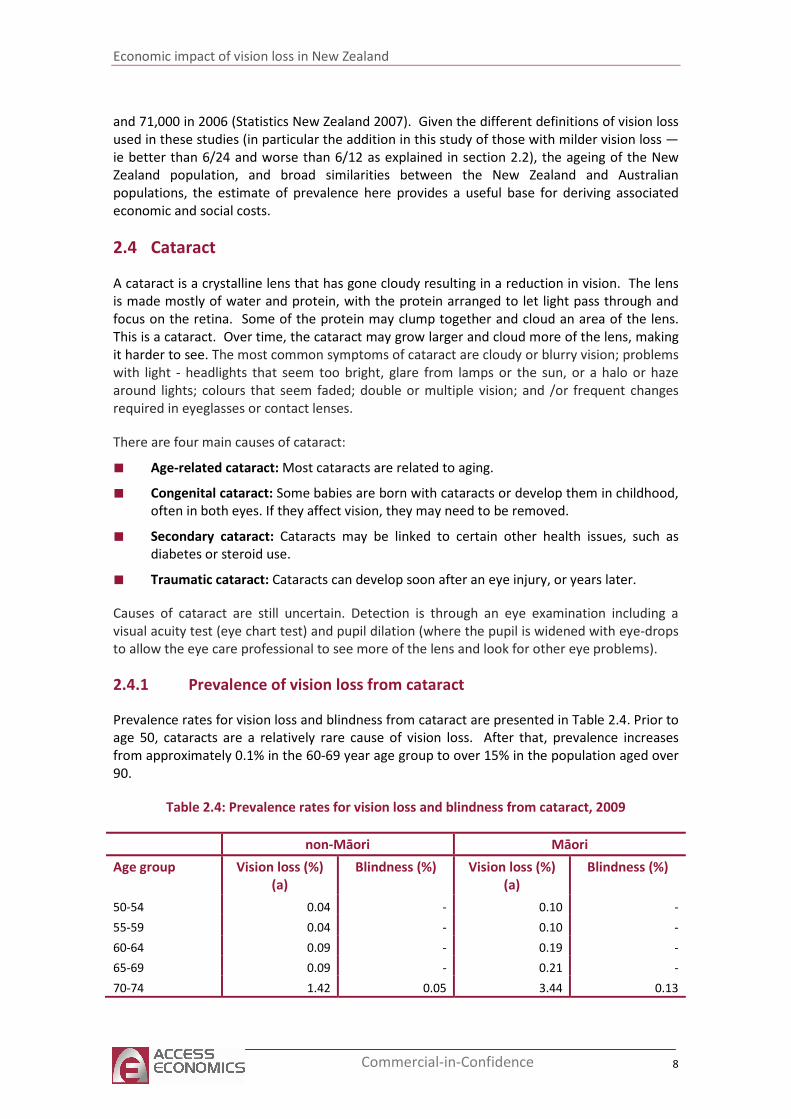
2.4.1 Prevalence of vision loss from cataract
Prevalence rates for vision loss and blindness from cataract are presented in Table 2.4. Prior to
age 50, cataracts are a relatively rare cause of vision loss. After that, prevalence increases
from approximately 0.1% in the 60-69 year age group to over 15% in the population aged over
90.
Table 2.4: Prevalence rates for vision loss and blindness from cataract, 2009
non-Māori Māori
Age group Vision loss (%)
(a)
Blindness (%) Vision loss (%)
(a)
Blindness (%)
50-54 0.04 - 0.10 -
55-59 0.04 - 0.10 -
60-64 0.09 - 0.19 -
65-69 0.09 - 0.21 -
70-74 1.42 0.05 3.44 0.13
Economic impact of vision loss in New Zealand
9 Commercial-in-Confidence
non-Māori Māori
75-79 1.42 0.05 1.42 0.05
80-84 6.63 0.75 6.63 0.75
85-89 6.63 0.75 6.63 0.75
90+ 15.17 1.51 15.17 1.51
Source: Centre for Eye Research Australia and Access Economics (2004) (from BMES and VIP study data-sets), Office
for Disability Issues and Statistics New Zealand 2010 (a) Including blindness
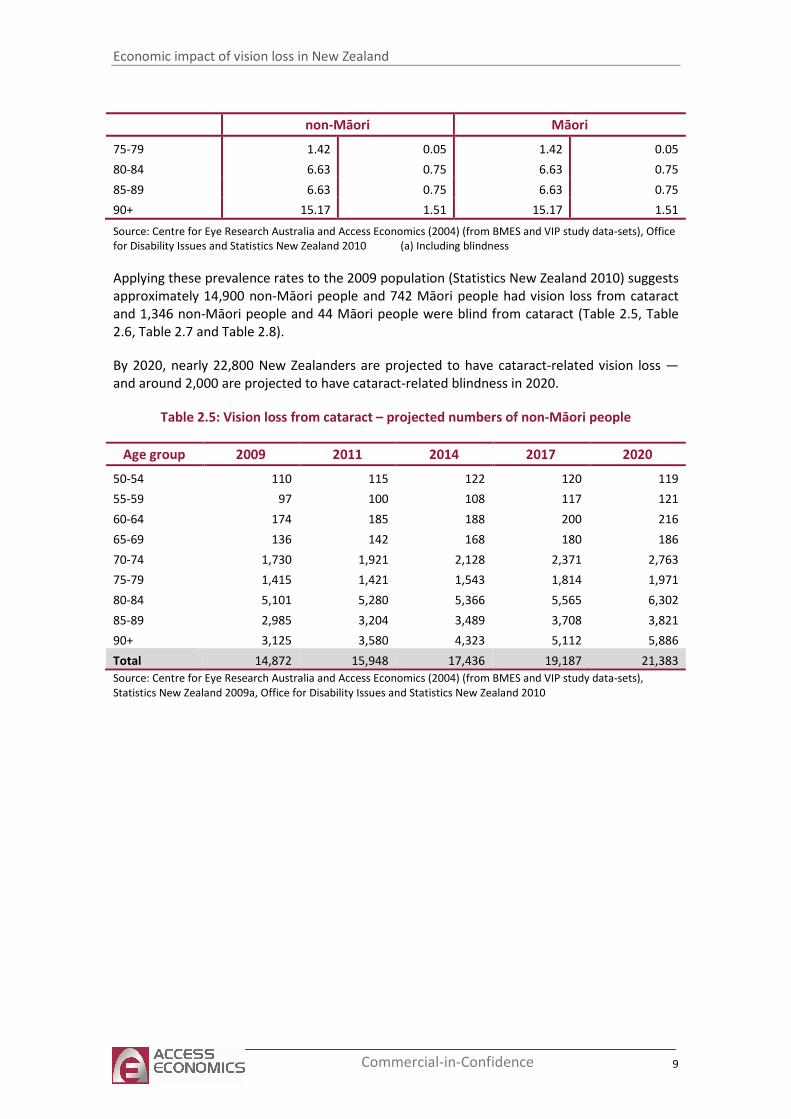
Applying these prevalence rates to the 2009 population (Statistics New Zealand 2010) suggests
approximately 14,900 non-Māori people and 742 Māori people had vision loss from cataract
and 1,346 non-Māori people and 44 Māori people were blind from cataract (Table 2.5, Table
2.6, Table 2.7 and Table 2.8).
By 2020, nearly 22,800 New Zealanders are projected to have cataract-related vision loss —
and around 2,000 are projected to have cataract-related blindness in 2020.
Table 2.5: Vision loss from cataract – projected numbers of non-Māori people
Age group 2009 2011 2014 2017 2020
50-54 110 115 122 120 119
55-59 97 100 108 117 121
60-64 174 185 188 200 216
65-69 136 142 168 180 186
70-74 1,730 1,921 2,128 2,371 2,763
75-79 1,415 1,421 1,543 1,814 1,971
80-84 5,101 5,280 5,366 5,565 6,302
85-89 2,985 3,204 3,489 3,708 3,821
90+ 3,125 3,580 4,323 5,112 5,886
Total 14,872 15,948 17,436 19,187 21,383
Source: Centre for Eye Research Australia and Access Economics (2004) (from BMES and VIP study data-sets),
Statistics New Zealand 2009a, Office for Disability Issues and Statistics New Zealand 2010
Economic impact of vision loss in New Zealand
10 Commercial-in-Confidence
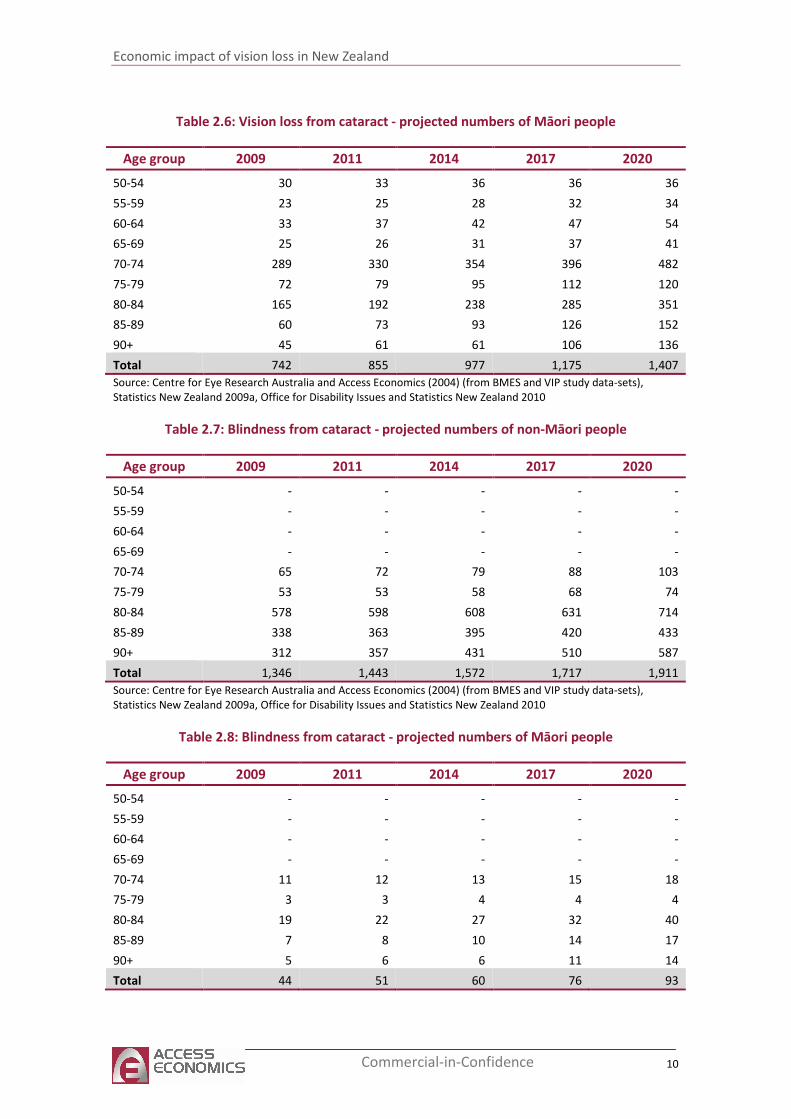
Table 2.6: Vision loss from cataract - projected numbers of Māori people
Age group 2009 2011 2014 2017 2020
50-54 30 33 36 36 36
55-59 23 25 28 32 34
60-64 33 37 42 47 54
65-69 25 26 31 37 41
70-74 289 330 354 396 482
75-79 72 79 95 112 120
80-84 165 192 238 285 351
85-89 60 73 93 126 152
90+ 45 61 61 106 136
Total 742 855 977 1,175 1,407
Source: Centre for Eye Research Australia and Access Economics (2004) (from BMES and VIP study data-sets),
Statistics New Zealand 2009a, Office for Disability Issues and Statistics New Zealand 2010
Table 2.7: Blindness from cataract - projected numbers of non-Māori people
Age group 2009 2011 2014 2017 2020
50-54 - - - - -
55-59 - - - - -
60-64 - - - - -
65-69 - - - - -
70-74 65 72 79 88 103
75-79 53 53 58 68 74
80-84 578 598 608 631 714
85-89 338 363 395 420 433
90+ 312 357 431 510 587
Total 1,346 1,443 1,572 1,717 1,911
Source: Centre for Eye Research Australia and Access Economics (2004) (from BMES and VIP study data-sets),
Statistics New Zealand 2009a, Office for Disability Issues and Statistics New Zealand 2010
Table 2.8: Blindness from cataract - projected numbers of Māori people
Age group 2009 2011 2014 2017 2020
50-54 - - - - -
55-59 - - - - -
60-64 - - - - -
65-69 - - - - -
70-74 11 12 13 15 18
75-79 3 3 4 4 4
80-84 19 22 27 32 40
85-89 7 8 10 14 17
90+ 5 6 6 11 14
Total 44 51 60 76 93
Economic impact of vision loss in New Zealand
11 Commercial-in-Confidence
Source: Centre for Eye Research Australia and Access Economics (2004) (from BMES and VIP study data-sets),
Statistics New Zealand 2009a, Office for Disability Issues and Statistics New Zealand 2010
2.5 Diabetic retinopathy
DR is an important cause of vision impairment. It occurs when diabetes mellitus (DM) damages
the tiny blood vessels inside the retina, and usually affects both eyes. At first, microaneurysms
occur. As the disease progresses, some blood vessels that nourish the retina are blocked.
There are two ways that vision loss occurs:
■ Proliferative retinopathy: if many blood vessels are blocked, and several areas of the
retina are deprived of their blood supply, signals are sent to grow new blood vessels,
which may be abnormal and fragile, growing along the retina and along the surface of
the clear, vitreous gel that fills the inside of the eye. These blood vessels have thin,
fragile walls that, if they leak blood into the centre of the eye, can result in blurred vision
and blindness.
■ Macular oedema: fluid can leak into the centre of the retina – at the macula, causing
swelling and blurred vision. This is more likely to occur as the disease progresses. About
half of people with proliferative retinopathy also have macular oedema.
In its early stages, DR causes no symptoms. If bleeding occurs, the person may see specks of
blood, or spots, “floating” in their vision. Occasionally spots clear without treatment, but
haemorrhages tend to happen more than once, often during sleep. The earlier treatment is
received, the more likely it is to be effective.
The prevalence of DR is of course highly dependent on the prevalence of DM. The Ministry of
Health (2007) projected the prevalence of type 2 diabetes would increase 45% between 2001
and 2011 due to population growth, an ageing population, and growth in the prevalence of
obesity. The VIP and BMES prevalence data for DR (Centre for Eye Research Australia and
Access Economics 2004) were adjusted upwards to account for the increase in diagnosed
diabetes reported by the Australian Bureau of Statistics (2009) between 2004-05 and 2007-08.
The age-specific increases in DM prevalence for those aged 35+ were used to develop
weightings which were then applied to age-specific DR prevalence rates. The adjusted
prevalence rates for vision loss from DR are presented in Table 2.9. It is important to note that
Australian data from the VIP and BMES show a very small proportion with vision-threatening
DR. This is in stark contrast with US data (Kempen et al, 2004) that estimates that 0.75% of the
population over 40 (ie, nearly one quarter of Americans with DR) have vision-threatening DR.
The sample data were also inadequate to determine the proportion of those with vision-
impairing DR who are blind (hence the lack of estimates for blindness in Table 2.9).
Estimates of the prevalence of diabetic retinopathy (DR) across different ethnic groups vary.
The prevalence of diabetes in New Zealand has been estimated at around 4% by the Ministry
of Health with rates around three times higher in the Māori and Pacific populations than
among other New Zealanders5. Simmons et al (2007) found the prevalence of moderate or
more severe retinopathy to be 4% of the European type 2 diabetic population compared with
12.9% and 15.8% in the Māori and Pacific populations. Joshy (2006) likewise found a lower
disease burden in the European population where vision-threatening retinopathy was
observed in 2.5% of Europeans, compared with 4.6%, 4.3% and 4.9% in the Asian, Māori, and
Pacific populations respectively.
5 http://www.moh.govt.nz/diabetes accessed 30 March 2010
Economic impact of vision loss in New Zealand
12 Commercial-in-Confidence
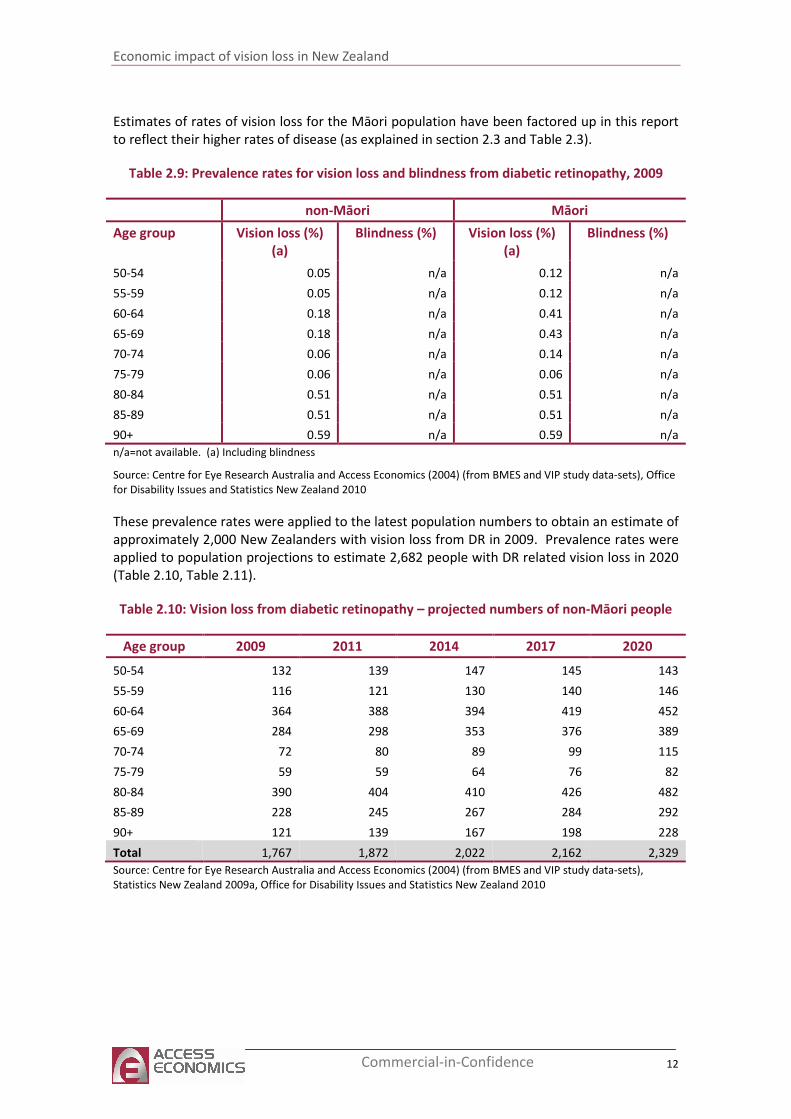
Estimates of rates of vision loss for the Māori population have been factored up in this report
to reflect their higher rates of disease (as explained in section 2.3 and Table 2.3).
Table 2.9: Prevalence rates for vision loss and blindness from diabetic retinopathy, 2009
non-Māori Māori
Age group Vision loss (%)
(a)
Blindness (%) Vision loss (%)
(a)
Blindness (%)
50-54 0.05 n/a 0.12 n/a
55-59 0.05 n/a 0.12 n/a
60-64 0.18 n/a 0.41 n/a
65-69 0.18 n/a 0.43 n/a
70-74 0.06 n/a 0.14 n/a
75-79 0.06 n/a 0.06 n/a
80-84 0.51 n/a 0.51 n/a
85-89 0.51 n/a 0.51 n/a
90+ 0.59 n/a 0.59 n/a
n/a=not available. (a) Including blindness
Source: Centre for Eye Research Australia and Access Economics (2004) (from BMES and VIP study data-sets), Office
for Disability Issues and Statistics New Zealand 2010
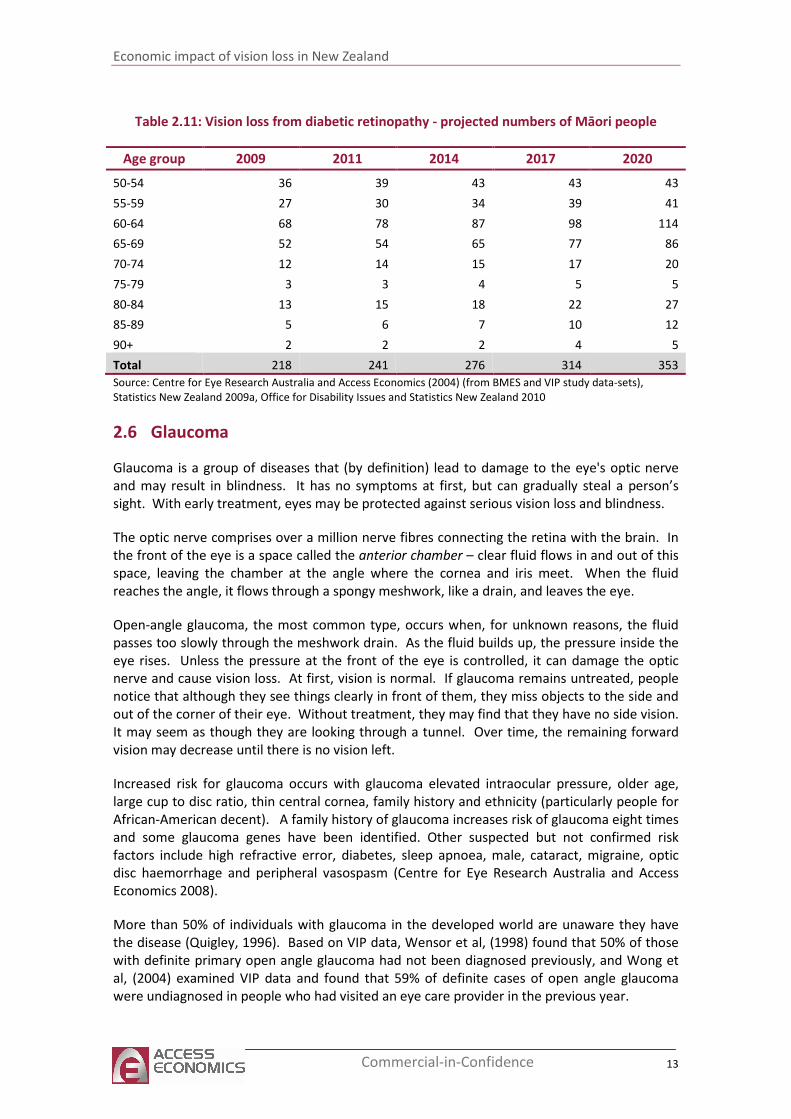
These prevalence rates were applied to the latest population numbers to obtain an estimate of
approximately 2,000 New Zealanders with vision loss from DR in 2009. Prevalence rates were
applied to population projections to estimate 2,682 people with DR related vision loss in 2020
(Table 2.10, Table 2.11).
Table 2.10: Vision loss from diabetic retinopathy – projected numbers of non-Māori people
Age group 2009 2011 2014 2017 2020
50-54 132 139 147 145 143
55-59 116 121 130 140 146
60-64 364 388 394 419 452
65-69 284 298 353 376 389
70-74 72 80 89 99 115
75-79 59 59 64 76 82
80-84 390 404 410 426 482
85-89 228 245 267 284 292
90+ 121 139 167 198 228
Total 1,767 1,872 2,022 2,162 2,329
Source: Centre for Eye Research Australia and Access Economics (2004) (from BMES and VIP study data-sets),
Statistics New Zealand 2009a, Office for Disability Issues and Statistics New Zealand 2010
Economic impact of vision loss in New Zealand
13 Commercial-in-Confidence
Table 2.11: Vision loss from diabetic retinopathy - projected numbers of Māori people
Age group 2009 2011 2014 2017 2020
50-54 36 39 43 43 43
55-59 27 30 34 39 41
60-64 68 78 87 98 114
65-69 52 54 65 77 86
70-74 12 14 15 17 20
75-79 3 3 4 5 5
80-84 13 15 18 22 27
85-89 5 6 7 10 12
90+ 2 2 2 4 5
Total 218 241 276 314 353
Source: Centre for Eye Research Australia and Access Economics (2004) (from BMES and VIP study data-sets),
Statistics New Zealand 2009a, Office for Disability Issues and Statistics New Zealand 2010
2.6 Glaucoma
Glaucoma is a group of diseases that (by definition) lead to damage to the eye's optic nerve
and may result in blindness. It has no symptoms at first, but can gradually steal a person’s
sight. With early treatment, eyes may be protected against serious vision loss and blindness.
The optic nerve comprises over a million nerve fibres connecting the retina with the brain. In
the front of the eye is a space called the anterior chamber – clear fluid flows in and out of this
space, leaving the chamber at the angle where the cornea and iris meet. When the fluid
reaches the angle, it flows through a spongy meshwork, like a drain, and leaves the eye.
Open-angle glaucoma, the most common type, occurs when, for unknown reasons, the fluid
passes too slowly through the meshwork drain. As the fluid builds up, the pressure inside the
eye rises. Unless the pressure at the front of the eye is controlled, it can damage the optic
nerve and cause vision loss. At first, vision is normal. If glaucoma remains untreated, people
notice that although they see things clearly in front of them, they miss objects to the side and
out of the corner of their eye. Without treatment, they may find that they have no side vision.
It may seem as though they are looking through a tunnel. Over time, the remaining forward
vision may decrease until there is no vision left.
Increased risk for glaucoma occurs with glaucoma elevated intraocular pressure, older age,
large cup to disc ratio, thin central cornea, family history and ethnicity (particularly people for
African-American decent). A family history of glaucoma increases risk of glaucoma eight times
and some glaucoma genes have been identified. Other suspected but not confirmed risk
factors include high refractive error, diabetes, sleep apnoea, male, cataract, migraine, optic
disc haemorrhage and peripheral vasospasm (Centre for Eye Research Australia and Access
Economics 2008).
More than 50% of individuals with glaucoma in the developed world are unaware they have
the disease (Quigley, 1996). Based on VIP data, Wensor et al, (1998) found that 50% of those
with definite primary open angle glaucoma had not been diagnosed previously, and Wong et
al, (2004) examined VIP data and found that 59% of definite cases of open angle glaucoma
were undiagnosed in people who had visited an eye care provider in the previous year.
Economic impact of vision loss in New Zealand
14 Commercial-in-Confidence
Glaucoma is detected through an eye examination including visual acuity, visual field,
measurement of intraocular pressure,, assessment of the angle of the anterior chamber and
optic nerve examination. Although there is no cure for glaucoma, early diagnosis and
treatment are important to control it and thus protect sight.
2.6.1 Prevalence of vision loss from glaucoma
Prevalence rates for this report were drawn from Centre for Eye Research Australia and Access
Economics (2008). While these are for primary open angle glaucoma, this is the most common
form of the disease. These rates are preferable as they have been refined to account for small
sample sizes of those with glaucoma in the VIP and BMES.
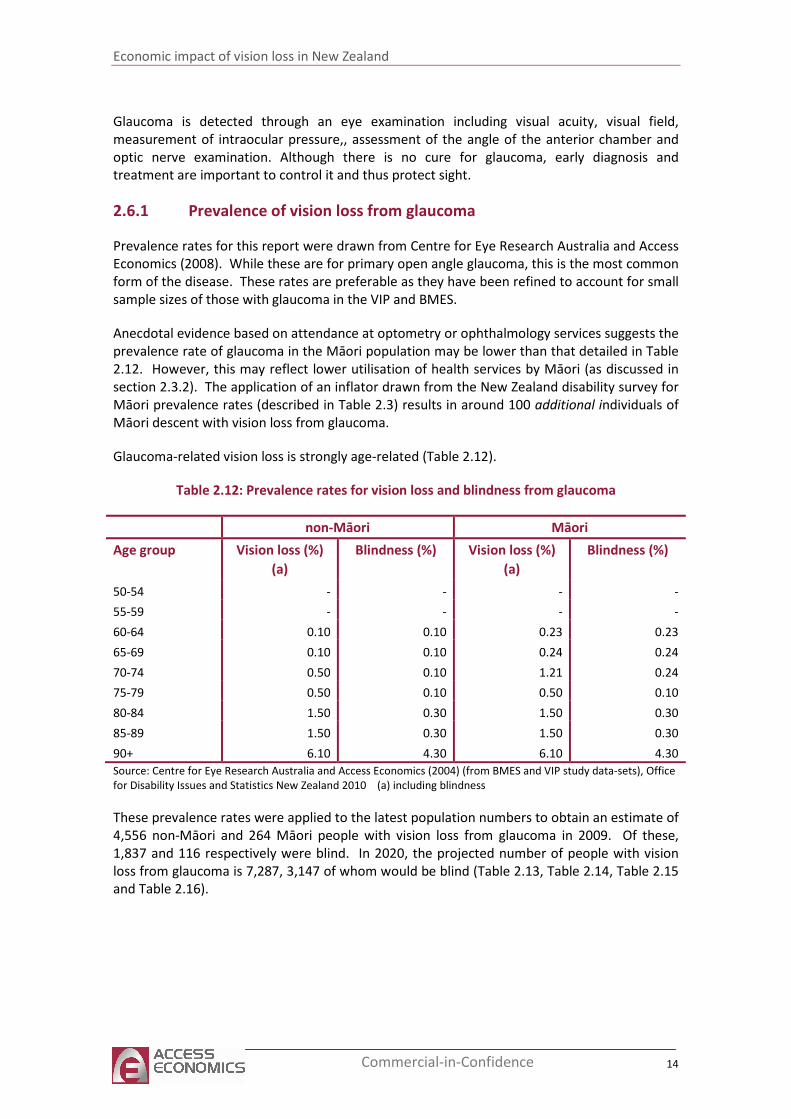
Anecdotal evidence based on attendance at optometry or ophthalmology services suggests the
prevalence rate of glaucoma in the Māori population may be lower than that detailed in Table
2.12. However, this may reflect lower utilisation of health services by Māori (as discussed in
section 2.3.2). The application of an inflator drawn from the New Zealand disability survey for
Māori prevalence rates (described in Table 2.3) results in around 100 additional individuals of
Māori descent with vision loss from glaucoma.
Glaucoma-related vision loss is strongly age-related (Table 2.12).
Table 2.12: Prevalence rates for vision loss and blindness from glaucoma
non-Māori Māori
Age group Vision loss (%)
(a)
Blindness (%) Vision loss (%)
(a)
Blindness (%)
50-54 - - - -
55-59 - - - -
60-64 0.10 0.10 0.23 0.23
65-69 0.10 0.10 0.24 0.24
70-74 0.50 0.10 1.21 0.24
75-79 0.50 0.10 0.50 0.10
80-84 1.50 0.30 1.50 0.30
85-89 1.50 0.30 1.50 0.30
90+ 6.10 4.30 6.10 4.30
Source: Centre for Eye Research Australia and Access Economics (2004) (from BMES and VIP study data-sets), Office
for Disability Issues and Statistics New Zealand 2010 (a) including blindness
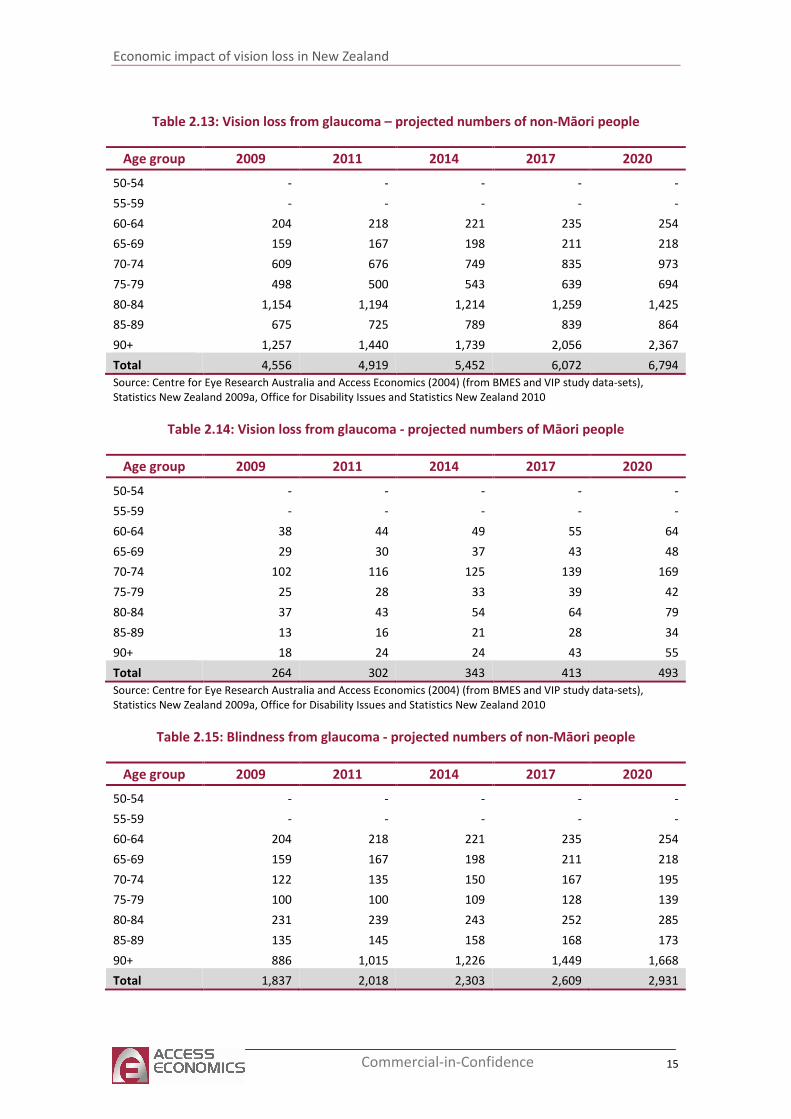
These prevalence rates were applied to the latest population numbers to obtain an estimate of
4,556 non-Māori and 264 Māori people with vision loss from glaucoma in 2009. Of these,
1,837 and 116 respectively were blind. In 2020, the projected number of people with vision
loss from glaucoma is 7,287, 3,147 of whom would be blind (Table 2.13, Table 2.14, Table 2.15
and Table 2.16).
Economic impact of vision loss in New Zealand
15 Commercial-in-Confidence
Table 2.13: Vision loss from glaucoma – projected numbers of non-Māori people
Age group 2009 2011 2014 2017 2020
50-54 - - - - -
55-59 - - - - -
60-64 204 218 221 235 254
65-69 159 167 198 211 218
70-74 609 676 749 835 973
75-79 498 500 543 639 694
80-84 1,154 1,194 1,214 1,259 1,425
85-89 675 725 789 839 864
90+ 1,257 1,440 1,739 2,056 2,367
Total 4,556 4,919 5,452 6,072 6,794
Source: Centre for Eye Research Australia and Access Economics (2004) (from BMES and VIP study data-sets),
Statistics New Zealand 2009a, Office for Disability Issues and Statistics New Zealand 2010
Table 2.14: Vision loss from glaucoma - projected numbers of Māori people
Age group 2009 2011 2014 2017 2020
50-54 - - - - -
55-59 - - - - -
60-64 38 44 49 55 64
65-69 29 30 37 43 48
70-74 102 116 125 139 169
75-79 25 28 33 39 42
80-84 37 43 54 64 79
85-89 13 16 21 28 34
90+ 18 24 24 43 55
Total 264 302 343 413 493
Source: Centre for Eye Research Australia and Access Economics (2004) (from BMES and VIP study data-sets),
Statistics New Zealand 2009a, Office for Disability Issues and Statistics New Zealand 2010
Table 2.15: Blindness from glaucoma - projected numbers of non-Māori people
Age group 2009 2011 2014 2017 2020
50-54 - - - - -
55-59 - - - - -
60-64 204 218 221 235 254
65-69 159 167 198 211 218
70-74 122 135 150 167 195
75-79 100 100 109 128 139
80-84 231 239 243 252 285
85-89 135 145 158 168 173
90+ 886 1,015 1,226 1,449 1,668
Total 1,837 2,018 2,303 2,609 2,931
Economic impact of vision loss in New Zealand
16 Commercial-in-Confidence
Source: Centre for Eye Research Australia and Access Economics (2004) (from BMES and VIP study data-sets),
Statistics New Zealand 2009a, Office for Disability Issues and Statistics New Zealand 2010
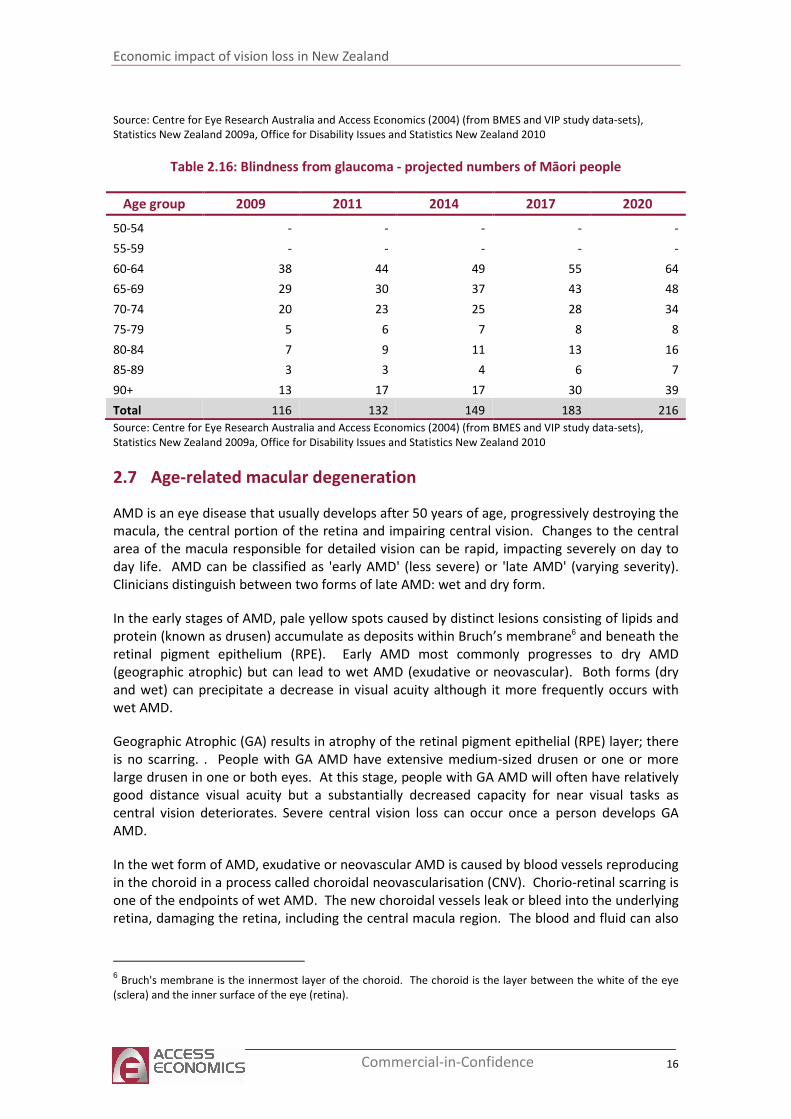
Table 2.16: Blindness from glaucoma - projected numbers of Māori people
Age group 2009 2011 2014 2017 2020
50-54 - - - - -
55-59 - - - - -
60-64 38 44 49 55 64
65-69 29 30 37 43 48
70-74 20 23 25 28 34
75-79 5 6 7 8 8
80-84 7 9 11 13 16
85-89 3 3 4 6 7
90+ 13 17 17 30 39
Total 116 132 149 183 216
Source: Centre for Eye Research Australia and Access Economics (2004) (from BMES and VIP study data-sets),
Statistics New Zealand 2009a, Office for Disability Issues and Statistics New Zealand 2010
2.7 Age-related macular degeneration
AMD is an eye disease that usually develops after 50 years of age, progressively destroying the
macula, the central portion of the retina and impairing central vision. Changes to the central
area of the macula responsible for detailed vision can be rapid, impacting severely on day to
day life. AMD can be classified as 'early AMD' (less severe) or 'late AMD' (varying severity).
Clinicians distinguish between two forms of late AMD: wet and dry form.
In the early stages of AMD, pale yellow spots caused by distinct lesions consisting of lipids and
protein (known as drusen) accumulate as deposits within Bruch’s membrane6 and beneath the
retinal pigment epithelium (RPE). Early AMD most commonly progresses to dry AMD
(geographic atrophic) but can lead to wet AMD (exudative or neovascular). Both forms (dry
and wet) can precipitate a decrease in visual acuity although it more frequently occurs with
wet AMD.
Geographic Atrophic (GA) results in atrophy of the retinal pigment epithelial (RPE) layer; there
is no scarring. . People with GA AMD have extensive medium-sized drusen or one or more
large drusen in one or both eyes. At this stage, people with GA AMD will often have relatively
good distance visual acuity but a substantially decreased capacity for near visual tasks as
central vision deteriorates. Severe central vision loss can occur once a person develops GA
AMD.
In the wet form of AMD, exudative or neovascular AMD is caused by blood vessels reproducing
in the choroid in a process called choroidal neovascularisation (CNV). Chorio-retinal scarring is
one of the endpoints of wet AMD. The new choroidal vessels leak or bleed into the underlying
retina, damaging the retina, including the central macula region. The blood and fluid can also
6 Bruch's membrane is the innermost layer of the choroid. The choroid is the layer between the white of the eye
(sclera) and the inner surface of the eye (retina).
Economic impact of vision loss in New Zealand
17 Commercial-in-Confidence
cause macular scarring or the detachment of either the retinal pigment epithelium or sensory
retina.
In all types, wet AMD is characterised by the appearance of central visual blurring and
distortion, with straight lines appearing crooked or wavy. It can occur in one eye without any
symptoms being recognised by the person, although symptoms become more noticeable once
the second eye is affected.
Progression of AMD will usually occur less rapidly if lifestyle risk factors are addressed.
Epidemiological studies have identified several risk factors that can increase the risk of
developing AMD and increase the speed at which the disease progresses. Cigarette smoking is
the main lifestyle risk factor for AMD, although alcohol consumption and obesity have been
shown to be associated with an increase in developing AMD. Control of these modifiable risk
factors could reduce the risk of developing AMD by half (45%) (Tomany et al, 2004).
Progression of AMD will also occur more slowly if protective measures are taken. Nutrition, or
more specifically dietary antioxidants, plays an important role in the occurrence, prevention
and treatment of AMD. Recent research has shown that some foods such spinach, egg yolks,
seafood (especially oysters), seeds, nuts, whole grains and fatty fish can decrease a person's
risk for the disease by up to 65% (Tan et al, 2008). Since there is currently no effective
treatment for GA AMD, prevention is the first approach to reducing vision loss.
For neovascular AMD, substantial progress has been made in the development of new and
effective treatments. Ranibizumab (Lucentis®) and bevacizumab (Avastin®), anti-VEGF agents,
are new therapies that can slow the progression of neovascular AMD and in some cases
restore some vision to the individual.
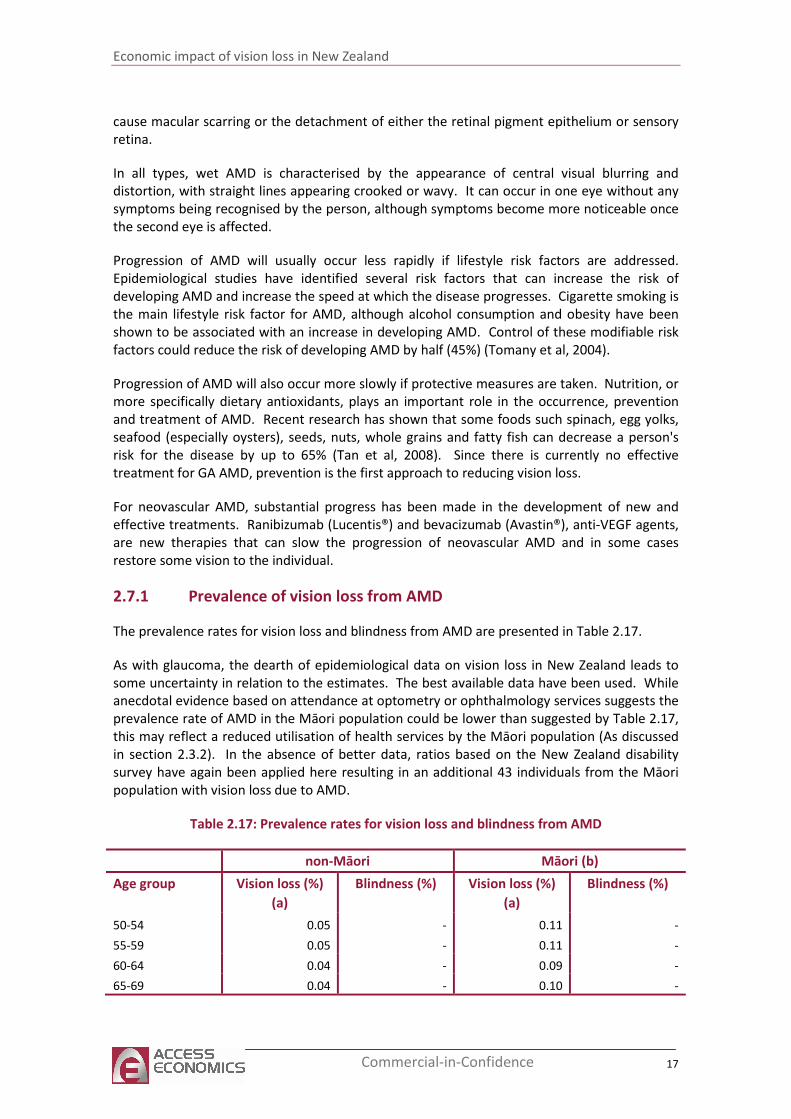
2.7.1 Prevalence of vision loss from AMD
The prevalence rates for vision loss and blindness from AMD are presented in Table 2.17.
As with glaucoma, the dearth of epidemiological data on vision loss in New Zealand leads to
some uncertainty in relation to the estimates. The best available data have been used. While
anecdotal evidence based on attendance at optometry or ophthalmology services suggests the
prevalence rate of AMD in the Māori population could be lower than suggested by Table 2.17,
this may reflect a reduced utilisation of health services by the Māori population (As discussed
in section 2.3.2). In the absence of better data, ratios based on the New Zealand disability
survey have again been applied here resulting in an additional 43 individuals from the Māori
population with vision loss due to AMD.
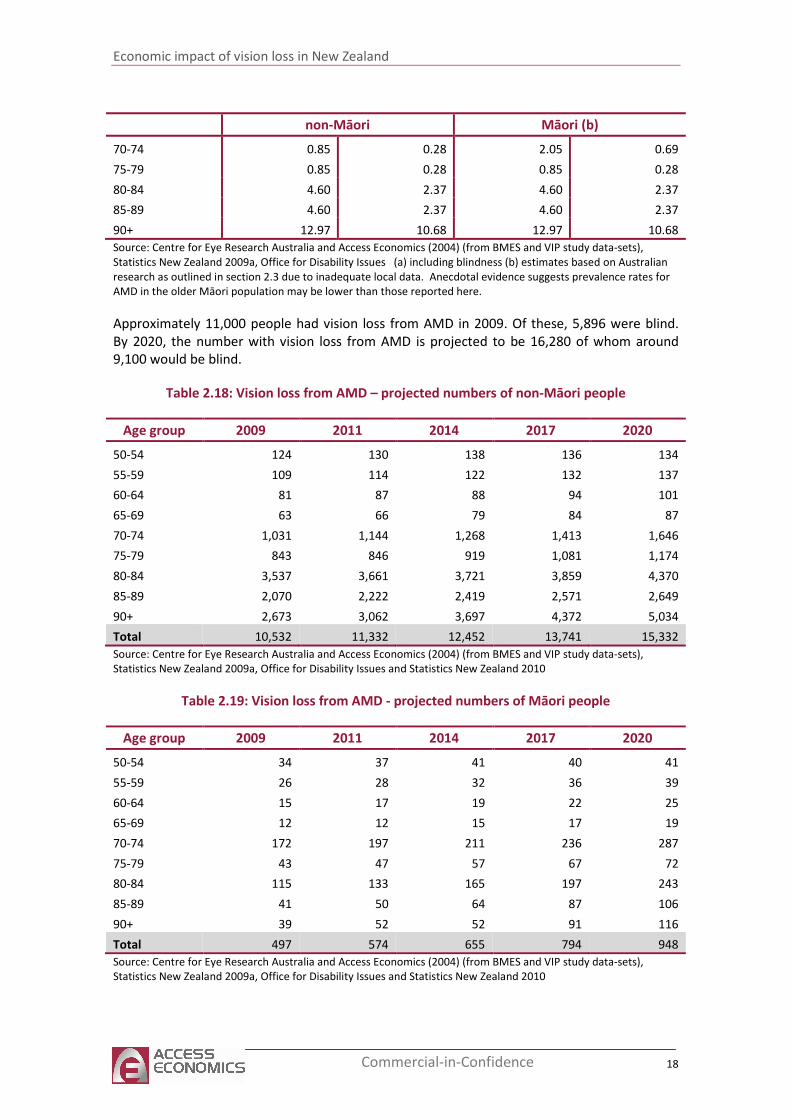
Table 2.17: Prevalence rates for vision loss and blindness from AMD
non-Māori Māori (b)
Age group Vision loss (%)
(a)
Blindness (%) Vision loss (%)
(a)
Blindness (%)
50-54 0.05 - 0.11 -
55-59 0.05 - 0.11 -
60-64 0.04 - 0.09 -
65-69 0.04 - 0.10 -
Economic impact of vision loss in New Zealand
18 Commercial-in-Confidence
non-Māori Māori (b)
70-74 0.85 0.28 2.05 0.69
75-79 0.85 0.28 0.85 0.28
80-84 4.60 2.37 4.60 2.37
85-89 4.60 2.37 4.60 2.37
90+ 12.97 10.68 12.97 10.68
Source: Centre for Eye Research Australia and Access Economics (2004) (from BMES and VIP study data-sets),
Statistics New Zealand 2009a, Office for Disability Issues (a) including blindness (b) estimates based on Australian
research as outlined in section 2.3 due to inadequate local data. Anecdotal evidence suggests prevalence rates for
AMD in the older Māori population may be lower than those reported here.
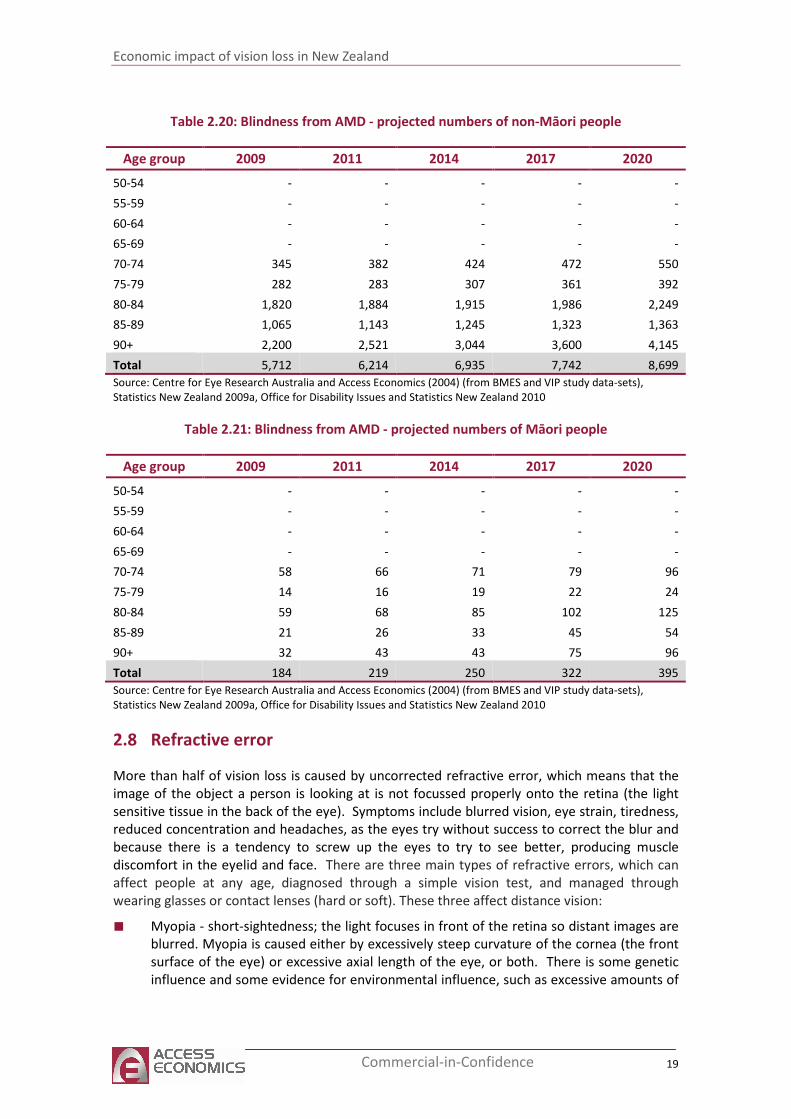
Approximately 11,000 people had vision loss from AMD in 2009. Of these, 5,896 were blind.
By 2020, the number with vision loss from AMD is projected to be 16,280 of whom around
9,100 would be blind.
Table 2.18: Vision loss from AMD – projected numbers of non-Māori people
Age group 2009 2011 2014 2017 2020
50-54 124 130 138 136 134
55-59 109 114 122 132 137
60-64 81 87 88 94 101
65-69 63 66 79 84 87
70-74 1,031 1,144 1,268 1,413 1,646
75-79 843 846 919 1,081 1,174
80-84 3,537 3,661 3,721 3,859 4,370
85-89 2,070 2,222 2,419 2,571 2,649
90+ 2,673 3,062 3,697 4,372 5,034
Total 10,532 11,332 12,452 13,741 15,332
Source: Centre for Eye Research Australia and Access Economics (2004) (from BMES and VIP study data-sets),
Statistics New Zealand 2009a, Office for Disability Issues and Statistics New Zealand 2010
Table 2.19: Vision loss from AMD - projected numbers of Māori people
Age group 2009 2011 2014 2017 2020
50-54 34 37 41 40 41
55-59 26 28 32 36 39
60-64 15 17 19 22 25
65-69 12 12 15 17 19
70-74 172 197 211 236 287
75-79 43 47 57 67 72
80-84 115 133 165 197 243
85-89 41 50 64 87 106
90+ 39 52 52 91 116
Total 497 574 655 794 948
Source: Centre for Eye Research Australia and Access Economics (2004) (from BMES and VIP study data-sets),
Statistics New Zealand 2009a, Office for Disability Issues and Statistics New Zealand 2010
Economic impact of vision loss in New Zealand
19 Commercial-in-Confidence
Table 2.20: Blindness from AMD - projected numbers of non-Māori people
Age group 2009 2011 2014 2017 2020
50-54 - - - - -
55-59 - - - - -
60-64 - - - - -
65-69 - - - - -
70-74 345 382 424 472 550
75-79 282 283 307 361 392
80-84 1,820 1,884 1,915 1,986 2,249
85-89 1,065 1,143 1,245 1,323 1,363
90+ 2,200 2,521 3,044 3,600 4,145
Total 5,712 6,214 6,935 7,742 8,699
Source: Centre for Eye Research Australia and Access Economics (2004) (from BMES and VIP study data-sets),
Statistics New Zealand 2009a, Office for Disability Issues and Statistics New Zealand 2010
Table 2.21: Blindness from AMD - projected numbers of Māori people
Age group 2009 2011 2014 2017 2020
50-54 - - - - -
55-59 - - - - -
60-64 - - - - -
65-69 - - - - -
70-74 58 66 71 79 96
75-79 14 16 19 22 24
80-84 59 68 85 102 125
85-89 21 26 33 45 54
90+ 32 43 43 75 96
Total 184 219 250 322 395
Source: Centre for Eye Research Australia and Access Economics (2004) (from BMES and VIP study data-sets),
Statistics New Zealand 2009a, Office for Disability Issues and Statistics New Zealand 2010
2.8 Refractive error
More than half of vision loss is caused by uncorrected refractive error, which means that the
image of the object a person is looking at is not focussed properly onto the retina (the light
sensitive tissue in the back of the eye). Symptoms include blurred vision, eye strain, tiredness,
reduced concentration and headaches, as the eyes try without success to correct the blur and
because there is a tendency to screw up the eyes to try to see better, producing muscle
discomfort in the eyelid and face. There are three main types of refractive errors, which can
affect people at any age, diagnosed through a simple vision test, and managed through
wearing glasses or contact lenses (hard or soft). These three affect distance vision:
■ Myopia - short-sightedness; the light focuses in front of the retina so distant images are
blurred. Myopia is caused either by excessively steep curvature of the cornea (the front
surface of the eye) or excessive axial length of the eye, or both. There is some genetic
influence and some evidence for environmental influence, such as excessive amounts of
Economic impact of vision loss in New Zealand
20 Commercial-in-Confidence
near work. Spectacles or contact lenses (concave) enable clear vision by diverging
incoming light rays, so they are properly focussed on the retina, as per the diagram.
■ Hyperopia - long-sightedness; the light focuses behind the retina so close images are
blurred. The average person is a little hyperopic, however significant hyperopia cannot
be accommodated and is thought to be genetic (the eyeball may be a little smaller than
average). Retinoscopy and refraction tests are required for diagnosis, with correction
through a convex lens, which converge the light rays, as per the diagram.
■ Astigmatism - is focusing error that causes asymmetric blur at all distances, mostly
caused by the shape of the cornea or by slight tilting of the lens – either inherited or a
normal variation accompanying growth. Non-spherical curvatures result in light focusing
at two different locations, rather than to a point. Most people have at least very slight
astigmatism, again correctable through wearing spectacles and lenses. Sometimes
correction of astigmatism can cause change in the apparent size and shape of objects
and may affect judgement of distance. A person may feel taller or shorter, or walls may
appear to slope and floors curve. In most cases, adjustment to these side effects takes
only a week or so. However, astigmatism correction may thus involve a compromise
between optimal clarity and visual discomfort. There is also a fourth type of related eye
focussing disorder which affects distance vision. It is related to age, and essentially
affects everyone over the age of forty.
■ Uncorrected presbyopia - is age-related vision difficulty at normal reading distance. In
youth, to focus on close objects, a muscle in the eye changes the shape of the lens,
called accommodation. With ageing, the lens loses its flexibility and is less able to
change shape. Although, like stiffening joints or greying hair, presbyopia cannot be
prevented, it can be corrected by spectacles or lenses, such as bifocal prescriptions, with
distant vision in the top half of the lens and near vision in the lower half. Other options
include `look-overs’ or half-glasses, trifocals, progressive lenses and some special
contact lenses. Presbyopia is usually first noticed around the age of 40-45 years
(although in reality the process has been occurring since childhood) and continues
changing vision to about age 65; from 65 onwards, there are unlikely to be any further
significant vision changes. Between the ages of 45 and 65, reading glasses may need to
be changed every few years for optimal correction.
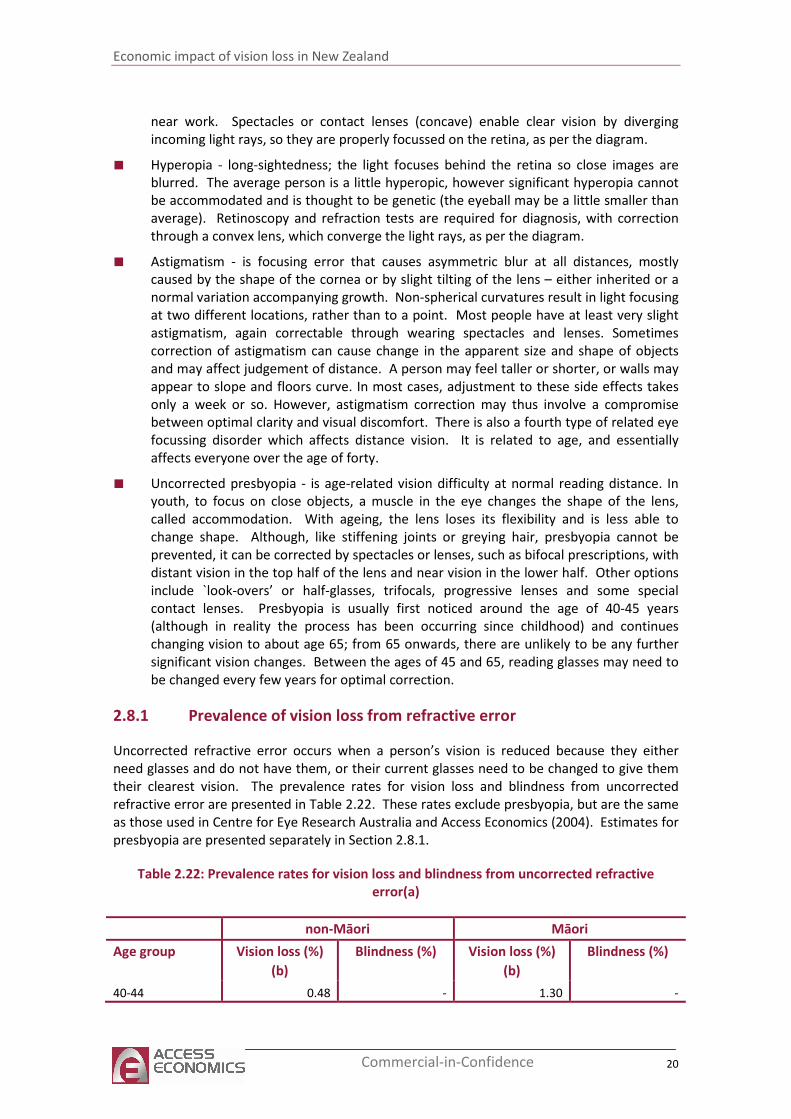
2.8.1 Prevalence of vision loss from refractive error
Uncorrected refractive error occurs when a person’s vision is reduced because they either
need glasses and do not have them, or their current glasses need to be changed to give them
their clearest vision. The prevalence rates for vision loss and blindness from uncorrected
refractive error are presented in Table 2.22. These rates exclude presbyopia, but are the same
as those used in Centre for Eye Research Australia and Access Economics (2004). Estimates for
presbyopia are presented separately in Section 2.8.1.
Table 2.22: Prevalence rates for vision loss and blindness from uncorrected refractive
error(a)
non-Māori Māori
Age group Vision loss (%)
(b)
Blindness (%) Vision loss (%)
(b)
Blindness (%)
40-44 0.48 - 1.30 -
Economic impact of vision loss in New Zealand
21 Commercial-in-Confidence
non-Māori Māori
45-49 0.48 - 1.08 -
50-54 1.84 - 4.21 -
55-59 1.84 - 4.21 -
60-64 3.92 0.04 8.93 0.09
65-69 3.92 0.04 9.49 0.10
70-74 7.81 0.01 18.91 0.02
75-79 7.81 0.01 7.81 0.01
80-84 13.01 0.18 13.01 0.18
85-89 13.01 0.18 13.01 0.18
90+ 7.86 0.00 7.86 0.00
(a) Excluding presbyopia. (b) including blindness
Source: Centre for Eye Research Australia and Access Economics (2004) (from BMES and VIP study data-sets), Office
for Disability Issues and Statistics New Zealand 2010
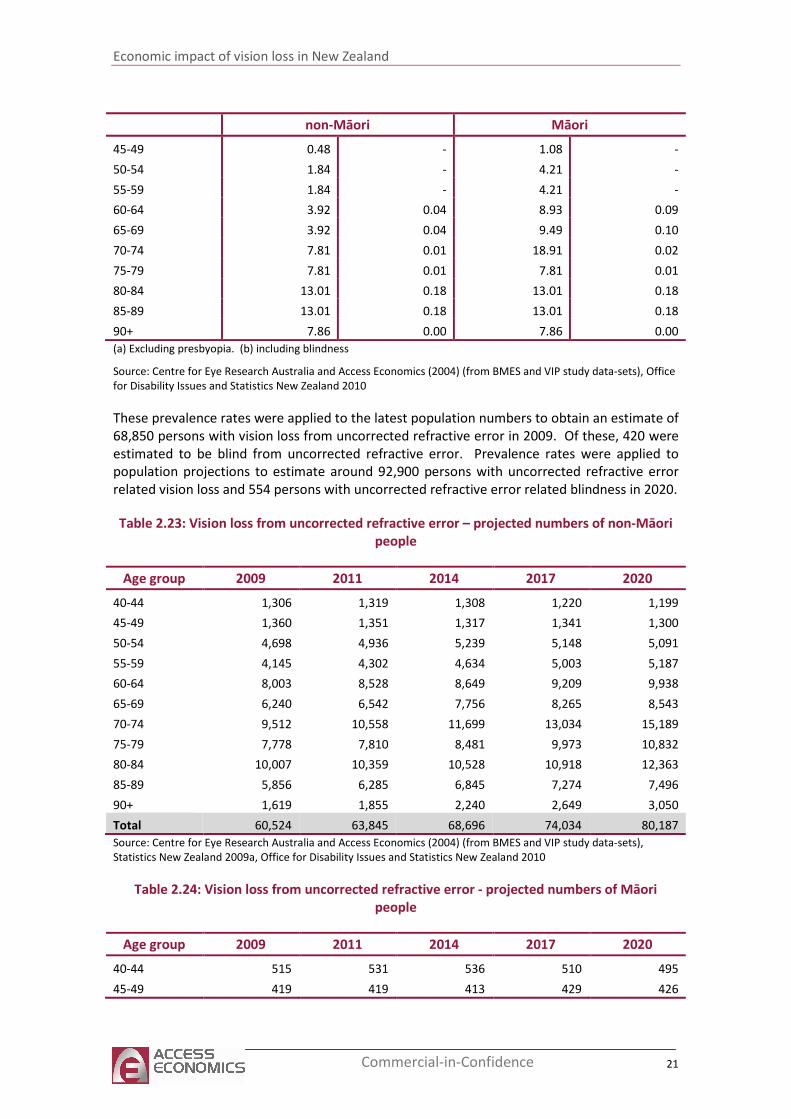
These prevalence rates were applied to the latest population numbers to obtain an estimate of
68,850 persons with vision loss from uncorrected refractive error in 2009. Of these, 420 were
estimated to be blind from uncorrected refractive error. Prevalence rates were applied to
population projections to estimate around 92,900 persons with uncorrected refractive error
related vision loss and 554 persons with uncorrected refractive error related blindness in 2020.
Table 2.23: Vision loss from uncorrected refractive error – projected numbers of non-Māori
people
Age group 2009 2011 2014 2017 2020
40-44 1,306 1,319 1,308 1,220 1,199
45-49 1,360 1,351 1,317 1,341 1,300
50-54 4,698 4,936 5,239 5,148 5,091
55-59 4,145 4,302 4,634 5,003 5,187
60-64 8,003 8,528 8,649 9,209 9,938
65-69 6,240 6,542 7,756 8,265 8,543
70-74 9,512 10,558 11,699 13,034 15,189
75-79 7,778 7,810 8,481 9,973 10,832
80-84 10,007 10,359 10,528 10,918 12,363
85-89 5,856 6,285 6,845 7,274 7,496
90+ 1,619 1,855 2,240 2,649 3,050
Total 60,524 63,845 68,696 74,034 80,187
Source: Centre for Eye Research Australia and Access Economics (2004) (from BMES and VIP study data-sets),
Statistics New Zealand 2009a, Office for Disability Issues and Statistics New Zealand 2010
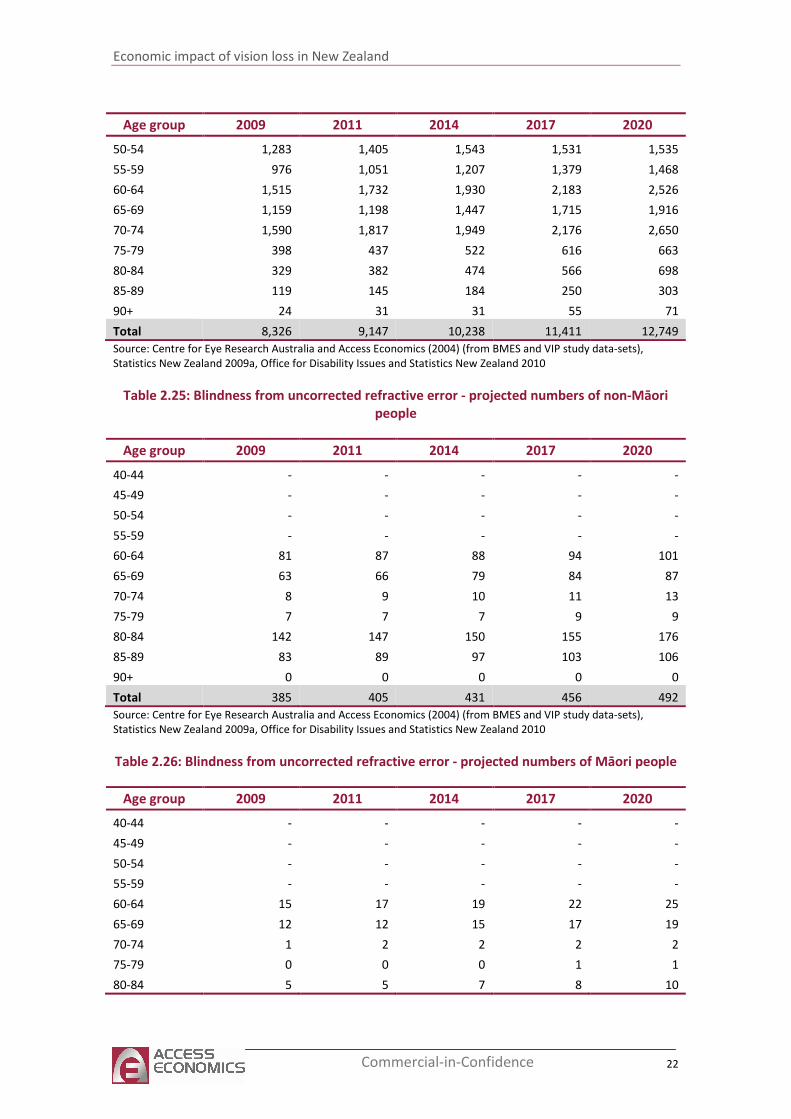
Table 2.24: Vision loss from uncorrected refractive error - projected numbers of Māori
people
Age group 2009 2011 2014 2017 2020
40-44 515 531 536 510 495
45-49 419 419 413 429 426
Economic impact of vision loss in New Zealand
22 Commercial-in-Confidence
Age group 2009 2011 2014 2017 2020
50-54 1,283 1,405 1,543 1,531 1,535
55-59 976 1,051 1,207 1,379 1,468
60-64 1,515 1,732 1,930 2,183 2,526
65-69 1,159 1,198 1,447 1,715 1,916
70-74 1,590 1,817 1,949 2,176 2,650
75-79 398 437 522 616 663
80-84 329 382 474 566 698
85-89 119 145 184 250 303
90+ 24 31 31 55 71
Total 8,326 9,147 10,238 11,411 12,749
Source: Centre for Eye Research Australia and Access Economics (2004) (from BMES and VIP study data-sets),
Statistics New Zealand 2009a, Office for Disability Issues and Statistics New Zealand 2010
Table 2.25: Blindness from uncorrected refractive error - projected numbers of non-Māori
people
Age group 2009 2011 2014 2017 2020
40-44 - - - - -
45-49 - - - - -
50-54 - - - - -
55-59 - - - - -
60-64 81 87 88 94 101
65-69 63 66 79 84 87
70-74 8 9 10 11 13
75-79 7 7 7 9 9
80-84 142 147 150 155 176
85-89 83 89 97 103 106
90+ 0 0 0 0 0
Total 385 405 431 456 492
Source: Centre for Eye Research Australia and Access Economics (2004) (from BMES and VIP study data-sets),
Statistics New Zealand 2009a, Office for Disability Issues and Statistics New Zealand 2010
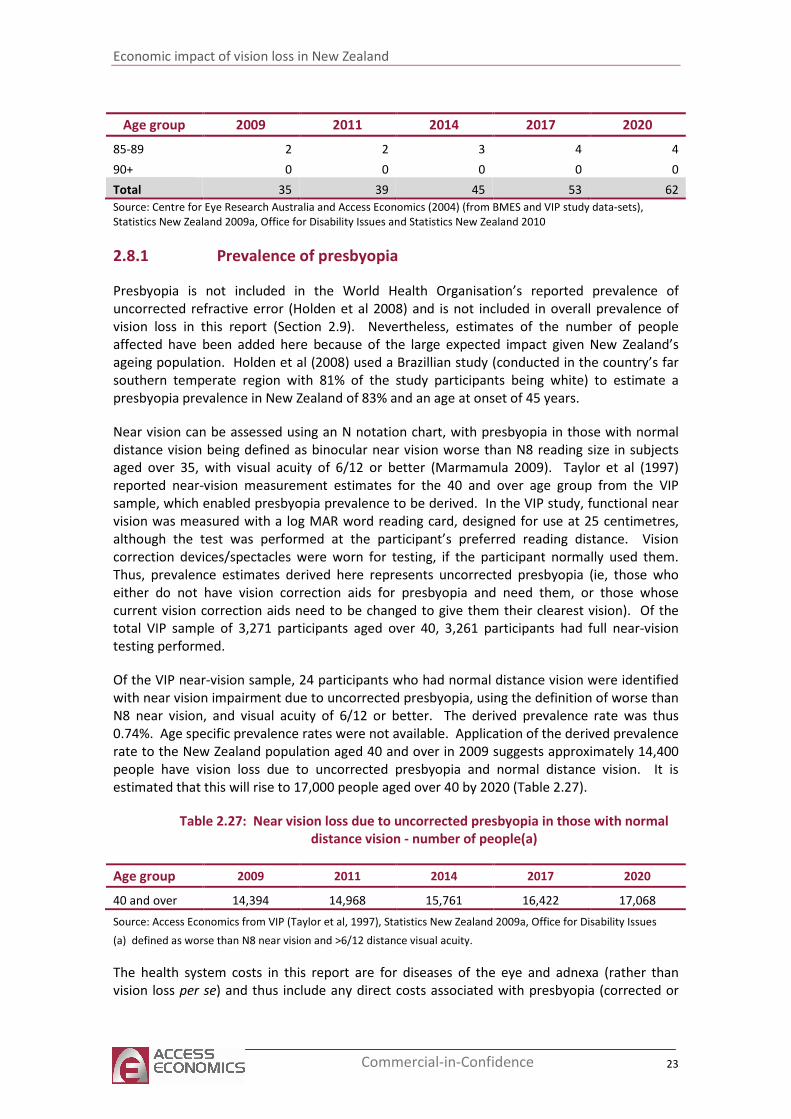
Table 2.26: Blindness from uncorrected refractive error - projected numbers of Māori people
Age group 2009 2011 2014 2017 2020
40-44 - - - - -
45-49 - - - - -
50-54 - - - - -
55-59 - - - - -
60-64 15 17 19 22 25
65-69 12 12 15 17 19
70-74 1 2 2 2 2
75-79 0 0 0 1 1
80-84 5 5 7 8 10
Economic impact of vision loss in New Zealand
23 Commercial-in-Confidence
Age group 2009 2011 2014 2017 2020
85-89 2 2 3 4 4
90+ 0 0 0 0 0
Total 35 39 45 53 62
Source: Centre for Eye Research Australia and Access Economics (2004) (from BMES and VIP study data-sets),
Statistics New Zealand 2009a, Office for Disability Issues and Statistics New Zealand 2010
2.8.1 Prevalence of presbyopia
Presbyopia is not included in the World Health Organisation’s reported prevalence of
uncorrected refractive error (Holden et al 2008) and is not included in overall prevalence of
vision loss in this report (Section 2.9). Nevertheless, estimates of the number of people
affected have been added here because of the large expected impact given New Zealand’s
ageing population. Holden et al (2008) used a Brazillian study (conducted in the country’s far
southern temperate region with 81% of the study participants being white) to estimate a
presbyopia prevalence in New Zealand of 83% and an age at onset of 45 years.
Near vision can be assessed using an N notation chart, with presbyopia in those with normal
distance vision being defined as binocular near vision worse than N8 reading size in subjects
aged over 35, with visual acuity of 6/12 or better (Marmamula 2009). Taylor et al (1997)
reported near-vision measurement estimates for the 40 and over age group from the VIP
sample, which enabled presbyopia prevalence to be derived. In the VIP study, functional near
vision was measured with a log MAR word reading card, designed for use at 25 centimetres,
although the test was performed at the participant’s preferred reading distance. Vision
correction devices/spectacles were worn for testing, if the participant normally used them.
Thus, prevalence estimates derived here represents uncorrected presbyopia (ie, those who
either do not have vision correction aids for presbyopia and need them, or those whose
current vision correction aids need to be changed to give them their clearest vision). Of the
total VIP sample of 3,271 participants aged over 40, 3,261 participants had full near-vision
testing performed.
Of the VIP near-vision sample, 24 participants who had normal distance vision were identified
with near vision impairment due to uncorrected presbyopia, using the definition of worse than
N8 near vision, and visual acuity of 6/12 or better. The derived prevalence rate was thus
0.74%. Age specific prevalence rates were not available. Application of the derived prevalence
rate to the New Zealand population aged 40 and over in 2009 suggests approximately 14,400
people have vision loss due to uncorrected presbyopia and normal distance vision. It is
estimated that this will rise to 17,000 people aged over 40 by 2020 (Table 2.27).
Table 2.27: Near vision loss due to uncorrected presbyopia in those with normal
distance vision - number of people(a)
Age group 2009 2011 2014 2017 2020
40 and over 14,394 14,968 15,761 16,422 17,068
Source: Access Economics from VIP (Taylor et al, 1997), Statistics New Zealand 2009a, Office for Disability Issues
(a) defined as worse than N8 near vision and >6/12 distance visual acuity.
The health system costs in this report are for diseases of the eye and adnexa (rather than
vision loss per se) and thus include any direct costs associated with presbyopia (corrected or
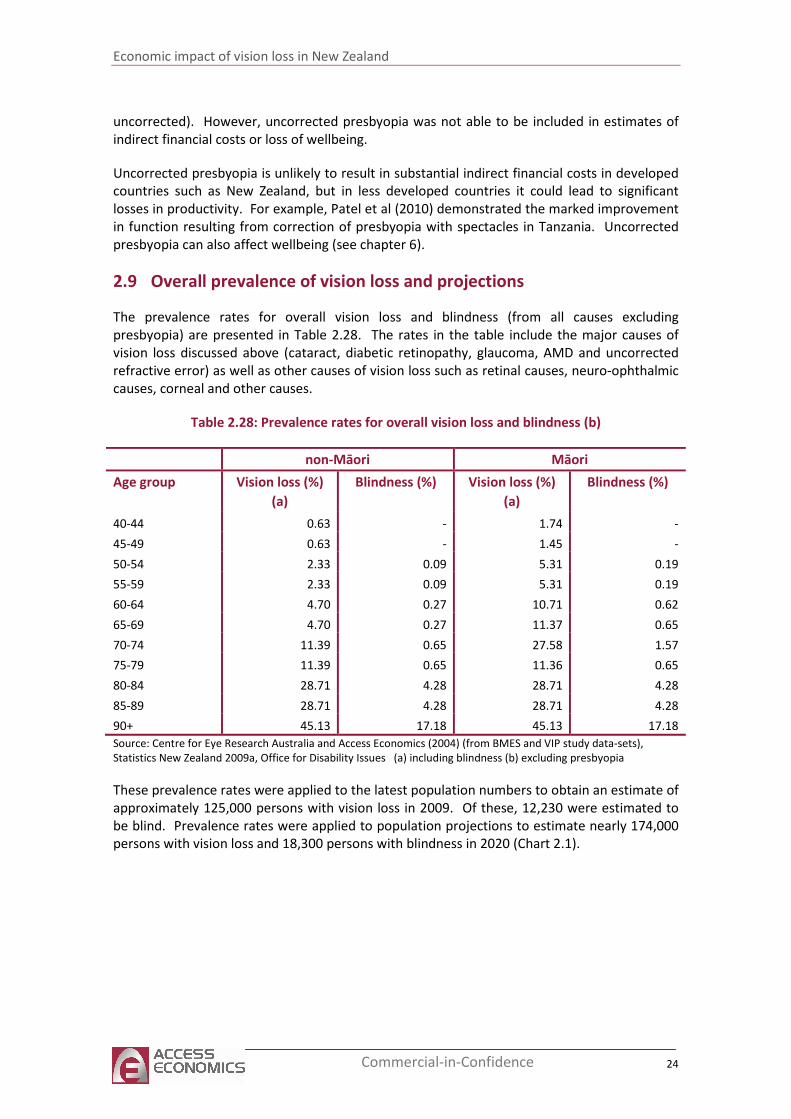
Economic impact of vision loss in New Zealand
24 Commercial-in-Confidence
uncorrected). However, uncorrected presbyopia was not able to be included in estimates of
indirect financial costs or loss of wellbeing.
Uncorrected presbyopia is unlikely to result in substantial indirect financial costs in developed
countries such as New Zealand, but in less developed countries it could lead to significant
losses in productivity. For example, Patel et al (2010) demonstrated the marked improvement
in function resulting from correction of presbyopia with spectacles in Tanzania. Uncorrected
presbyopia can also affect wellbeing (see chapter 6).
2.9 Overall prevalence of vision loss and projections
The prevalence rates for overall vision loss and blindness (from all causes excluding
presbyopia) are presented in Table 2.28. The rates in the table include the major causes of
vision loss discussed above (cataract, diabetic retinopathy, glaucoma, AMD and uncorrected
refractive error) as well as other causes of vision loss such as retinal causes, neuro-ophthalmic
causes, corneal and other causes.
Table 2.28: Prevalence rates for overall vision loss and blindness (b)
non-Māori Māori
Age group Vision loss (%)
(a)
Blindness (%) Vision loss (%)
(a)
Blindness (%)
40-44 0.63 - 1.74 -
45-49 0.63 - 1.45 -
50-54 2.33 0.09 5.31 0.19
55-59 2.33 0.09 5.31 0.19
60-64 4.70 0.27 10.71 0.62
65-69 4.70 0.27 11.37 0.65
70-74 11.39 0.65 27.58 1.57
75-79 11.39 0.65 11.36 0.65
80-84 28.71 4.28 28.71 4.28
85-89 28.71 4.28 28.71 4.28
90+ 45.13 17.18 45.13 17.18
Source: Centre for Eye Research Australia and Access Economics (2004) (from BMES and VIP study data-sets),
Statistics New Zealand 2009a, Office for Disability Issues (a) including blindness (b) excluding presbyopia
These prevalence rates were applied to the latest population numbers to obtain an estimate of
approximately 125,000 persons with vision loss in 2009. Of these, 12,230 were estimated to
be blind. Prevalence rates were applied to population projections to estimate nearly 174,000
persons with vision loss and 18,300 persons with blindness in 2020 (Chart 2.1).
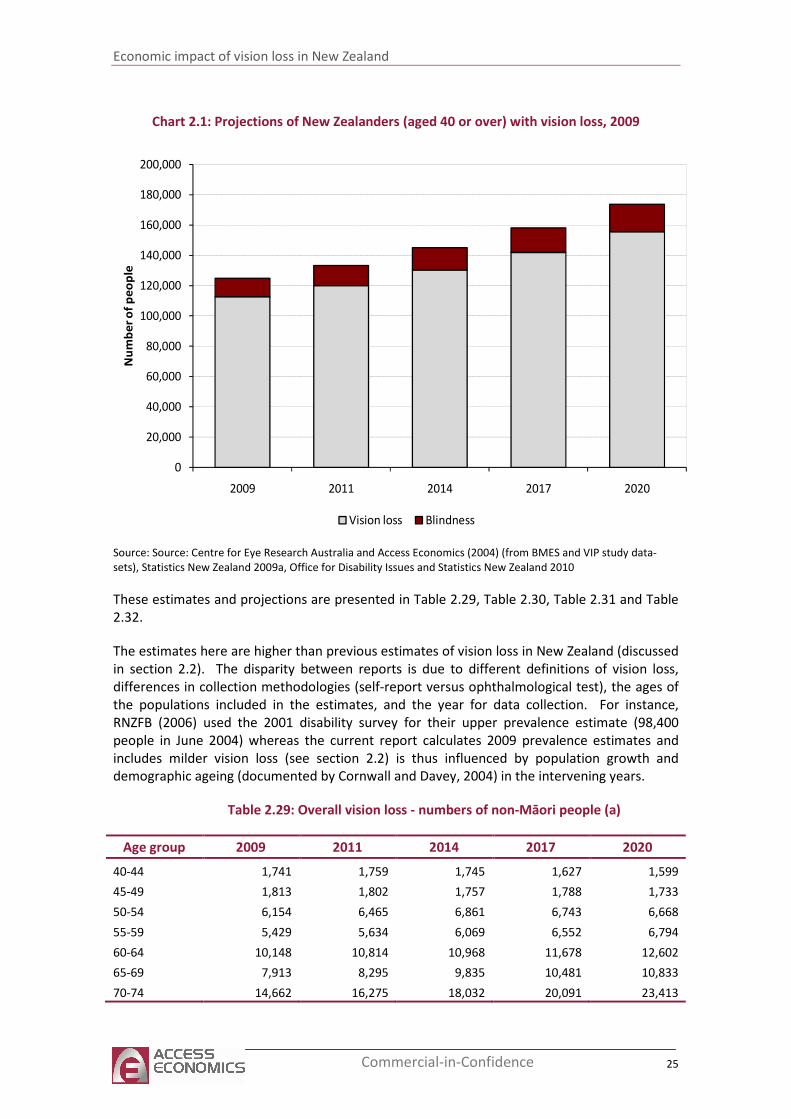
Economic impact of vision loss in New Zealand
25 Commercial-in-Confidence
Chart 2.1: Projections of New Zealanders (aged 40 or over) with vision loss, 2009
0
20,000
40,000
60,000
80,000
100,000
120,000
140,000
160,000
180,000
200,000
2009 2011 2014 2017 2020
Nu
mb
er
of
pe
op
le
Vision loss Blindness
Source: Source: Centre for Eye Research Australia and Access Economics (2004) (from BMES and VIP study data-
sets), Statistics New Zealand 2009a, Office for Disability Issues and Statistics New Zealand 2010
These estimates and projections are presented in Table 2.29, Table 2.30, Table 2.31 and Table
2.32.
The estimates here are higher than previous estimates of vision loss in New Zealand (discussed
in section 2.2). The disparity between reports is due to different definitions of vision loss,
differences in collection methodologies (self-report versus ophthalmological test), the ages of
the populations included in the estimates, and the year for data collection. For instance,
RNZFB (2006) used the 2001 disability survey for their upper prevalence estimate (98,400
people in June 2004) whereas the current report calculates 2009 prevalence estimates and
includes milder vision loss (see section 2.2) is thus influenced by population growth and
demographic ageing (documented by Cornwall and Davey, 2004) in the intervening years.
Table 2.29: Overall vision loss - numbers of non-Māori people (a)
Age group 2009 2011 2014 2017 2020
40-44 1,741 1,759 1,745 1,627 1,599
45-49 1,813 1,802 1,757 1,788 1,733
50-54 6,154 6,465 6,861 6,743 6,668
55-59 5,429 5,634 6,069 6,552 6,794
60-64 10,148 10,814 10,968 11,678 12,602
65-69 7,913 8,295 9,835 10,481 10,833
70-74 14,662 16,275 18,032 20,091 23,413
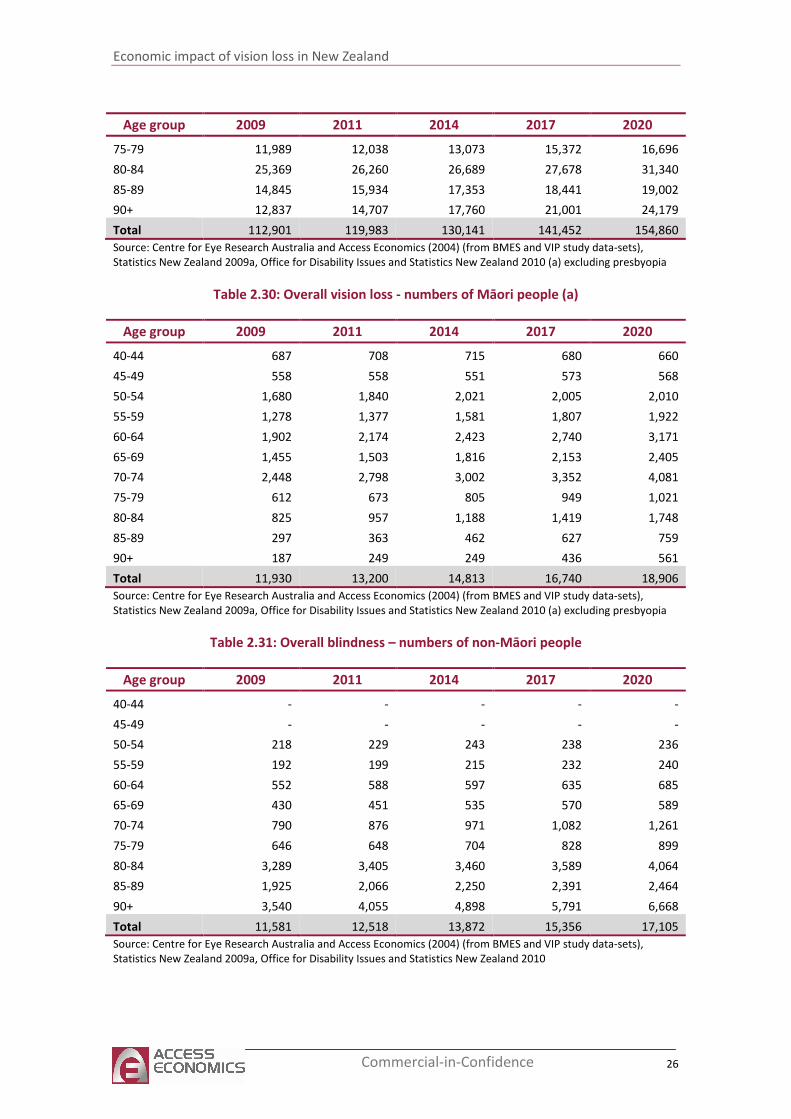
Economic impact of vision loss in New Zealand
26 Commercial-in-Confidence
Age group 2009 2011 2014 2017 2020
75-79 11,989 12,038 13,073 15,372 16,696
80-84 25,369 26,260 26,689 27,678 31,340
85-89 14,845 15,934 17,353 18,441 19,002
90+ 12,837 14,707 17,760 21,001 24,179
Total 112,901 119,983 130,141 141,452 154,860
Source: Centre for Eye Research Australia and Access Economics (2004) (from BMES and VIP study data-sets),
Statistics New Zealand 2009a, Office for Disability Issues and Statistics New Zealand 2010 (a) excluding presbyopia
Table 2.30: Overall vision loss - numbers of Māori people (a)
Age group 2009 2011 2014 2017 2020
40-44 687 708 715 680 660
45-49 558 558 551 573 568
50-54 1,680 1,840 2,021 2,005 2,010
55-59 1,278 1,377 1,581 1,807 1,922
60-64 1,902 2,174 2,423 2,740 3,171
65-69 1,455 1,503 1,816 2,153 2,405
70-74 2,448 2,798 3,002 3,352 4,081
75-79 612 673 805 949 1,021
80-84 825 957 1,188 1,419 1,748
85-89 297 363 462 627 759
90+ 187 249 249 436 561
Total 11,930 13,200 14,813 16,740 18,906
Source: Centre for Eye Research Australia and Access Economics (2004) (from BMES and VIP study data-sets),
Statistics New Zealand 2009a, Office for Disability Issues and Statistics New Zealand 2010 (a) excluding presbyopia
Table 2.31: Overall blindness – numbers of non-Māori people
Age group 2009 2011 2014 2017 2020
40-44 - - - - -
45-49 - - - - -
50-54 218 229 243 238 236
55-59 192 199 215 232 240
60-64 552 588 597 635 685
65-69 430 451 535 570 589
70-74 790 876 971 1,082 1,261
75-79 646 648 704 828 899
80-84 3,289 3,405 3,460 3,589 4,064
85-89 1,925 2,066 2,250 2,391 2,464
90+ 3,540 4,055 4,898 5,791 6,668
Total 11,581 12,518 13,872 15,356 17,105
Source: Centre for Eye Research Australia and Access Economics (2004) (from BMES and VIP study data-sets),
Statistics New Zealand 2009a, Office for Disability Issues and Statistics New Zealand 2010
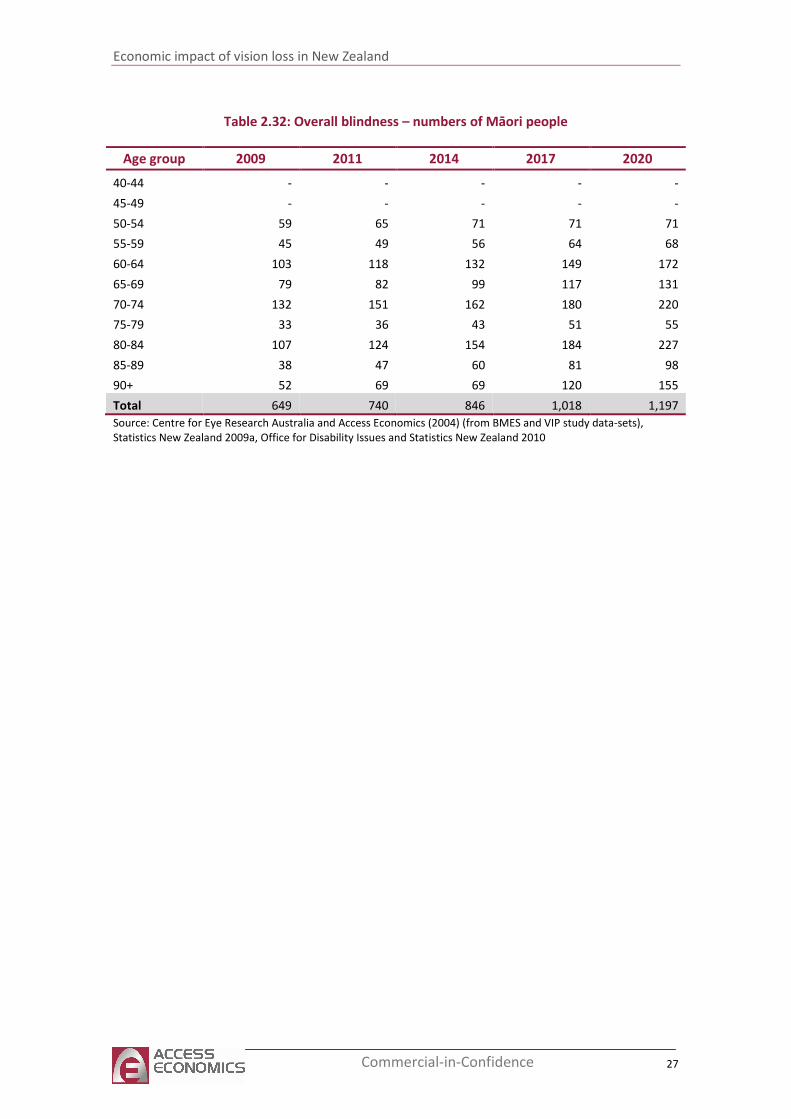
Economic impact of vision loss in New Zealand
27 Commercial-in-Confidence
Table 2.32: Overall blindness – numbers of Māori people
Age group 2009 2011 2014 2017 2020
40-44 - - - - -
45-49 - - - - -
50-54 59 65 71 71 71
55-59 45 49 56 64 68
60-64 103 118 132 149 172
65-69 79 82 99 117 131
70-74 132 151 162 180 220
75-79 33 36 43 51 55
80-84 107 124 154 184 227
85-89 38 47 60 81 98
90+ 52 69 69 120 155
Total 649 740 846 1,018 1,197
Source: Centre for Eye Research Australia and Access Economics (2004) (from BMES and VIP study data-sets),
Statistics New Zealand 2009a, Office for Disability Issues and Statistics New Zealand 2010
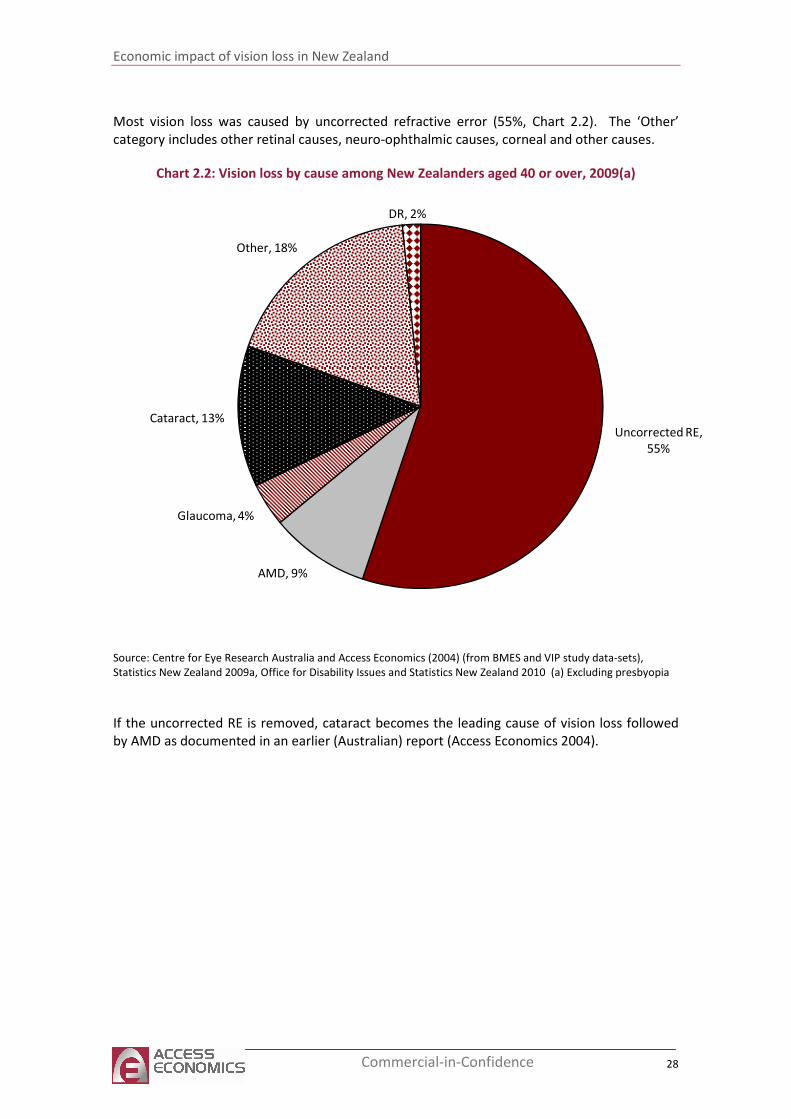
Economic impact of vision loss in New Zealand
28 Commercial-in-Confidence
Most vision loss was caused by uncorrected refractive error (55%, Chart 2.2). The ‘Other’
category includes other retinal causes, neuro-ophthalmic causes, corneal and other causes.
Chart 2.2: Vision loss by cause among New Zealanders aged 40 or over, 2009(a)
Uncorrected RE,
55%
AMD, 9%
Glaucoma, 4%
Cataract, 13%
Other, 18%
DR, 2%
Source: Centre for Eye Research Australia and Access Economics (2004) (from BMES and VIP study data-sets),
Statistics New Zealand 2009a, Office for Disability Issues and Statistics New Zealand 2010 (a) Excluding presbyopia
If the uncorrected RE is removed, cataract becomes the leading cause of vision loss followed
by AMD as documented in an earlier (Australian) report (Access Economics 2004).
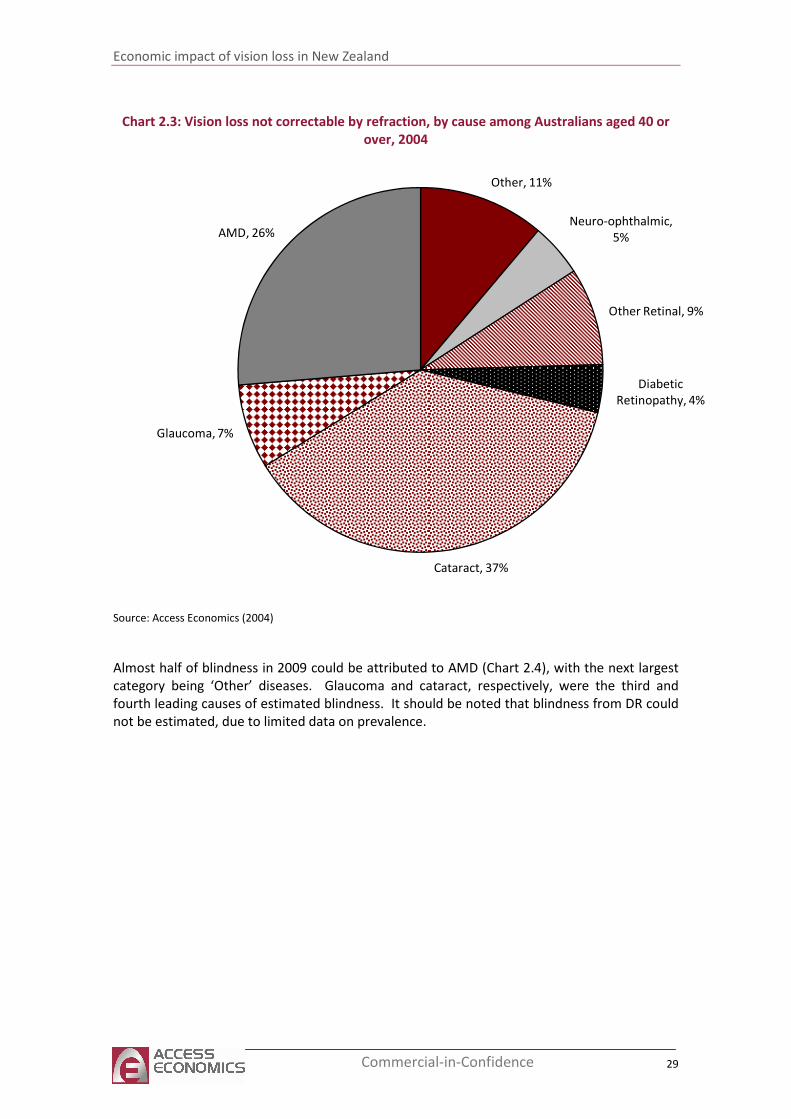
Economic impact of vision loss in New Zealand
29 Commercial-in-Confidence
Chart 2.3: Vision loss not correctable by refraction, by cause among Australians aged 40 or
over, 2004
Other, 11%
Neuro-ophthalmic,
5%
Other Retinal, 9%
Diabetic
Retinopathy, 4%
Cataract, 37%
Glaucoma, 7%
AMD, 26%
Source: Access Economics (2004)
Almost half of blindness in 2009 could be attributed to AMD (Chart 2.4), with the next largest
category being ‘Other’ diseases. Glaucoma and cataract, respectively, were the third and
fourth leading causes of estimated blindness. It should be noted that blindness from DR could
not be estimated, due to limited data on prevalence.
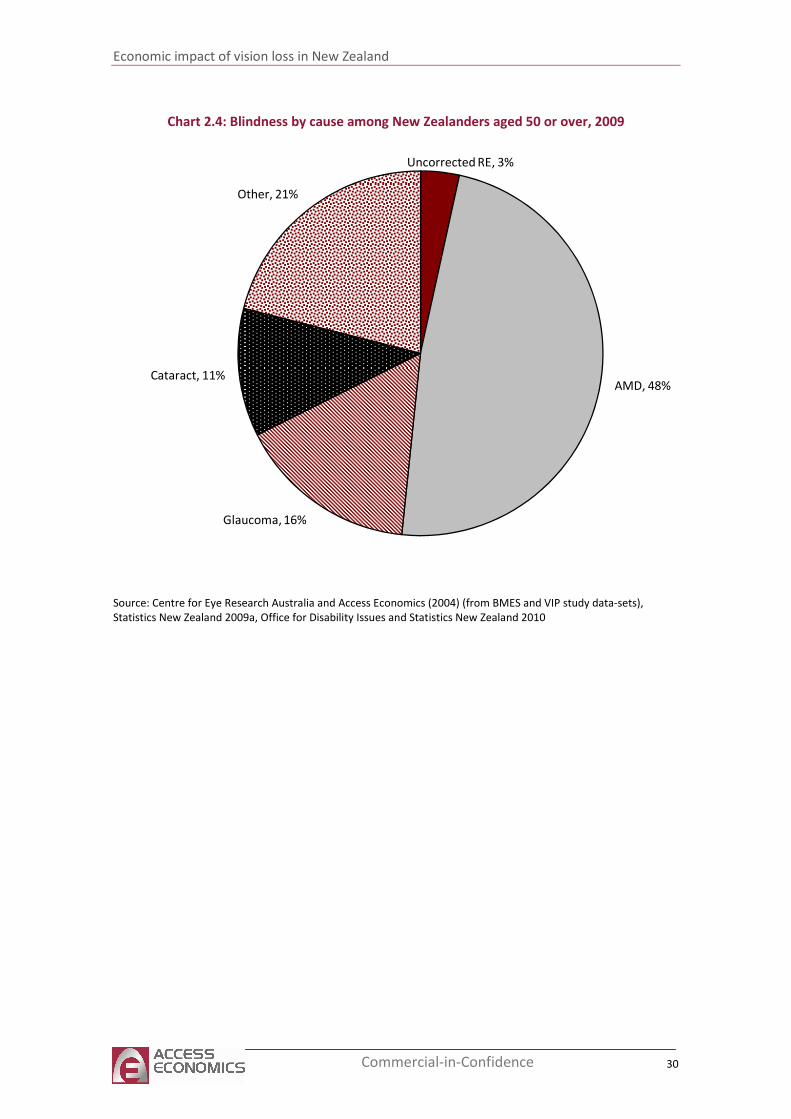
Economic impact of vision loss in New Zealand
30 Commercial-in-Confidence
Chart 2.4: Blindness by cause among New Zealanders aged 50 or over, 2009
Uncorrected RE, 3%
AMD, 48%
Glaucoma, 16%
Cataract, 11%
Other, 21%
Source: Centre for Eye Research Australia and Access Economics (2004) (from BMES and VIP study data-sets),
Statistics New Zealand 2009a, Office for Disability Issues and Statistics New Zealand 2010
Economic impact of vision loss in New Zealand
31 Commercial-in-Confidence
3 Mortality
Vision loss is associated with a higher than average risk of mortality (McCarty et al 2001, Wang
et al 2001, and Klein et al 1995). The vision loss itself does not directly cause death, but it is
correlated with a higher risk of falls, motor vehicle accidents and depression (Centre for Eye
Research Australia and Access Economics 2004).
New Zealand mortality statistics attributed only two deaths (both non-Māori) to diseases of
the eye and adnexa in the five years 2002 to 2006 (Ministry of Health7). However these
estimates are unlikely to reflect deaths associated with vision loss. For this report, the relative
risk of death from vision loss from VIP (McCarty et al 2001) was used, together with the
attributable fraction from Australian mortality data (1.38% from Access Economics 2010).
Based on this methodology, there were four deaths among Māori people, and 111 deaths
among non-Māori people attributable to vision loss in 2009.
3.1 Co-morbidities
3.1.1 Falls and fractures
Vision aids our balance through complex neurological pathways. Several studies have found a
significant link between falls and vision loss, particularly among older people. Evidence
includes:
■ 1.5 to twice the risk of falls in the vision impaired (Ivers et al, 1998, Black et al, 2005);
■ four to eight times the risk of hip fractures for vision impaired individuals (Klein et al,
1998 and Ivers et al, 2003);
■ the risk of recurrent falls related to the degree of visual field loss (Coleman et al, 2004).
Stronger evidence exists for a link between vision loss and fractures than for vision loss and
falls possibly because of the more accurate reporting of fractures which generally require
medical attention (Black et al 2005). Lamoureux et al (2010) suggested visual acuity, contrast
sensitivity, depth perception, visual field, main cause of vision loss, and duration of the
disability are not significantly associated with falls (p>0.05), rather physical inactivity was the
only variable independently associated with falls. Overall, vision impaired people were three
times more likely to fall if they were physically inactive.8
3.1.2 Depression
Vision impaired individuals are more like to suffer from depression in comparison to the
general population, particularly the older population. The relative risk of depression among
those with vision impairment is likely to be in the order of 3.5 times higher (Centre for Eye
7 http://www.moh.govt.nz/moh.nsf/indexmh/mortality-demographic-series accessed May 2010.
8
http://gateway.nlm.nih.gov/gw/Cmd?linkVars=BROWSER_STATE%3DGMResults%26SessionID%3D10050402211205
005406261047%26GM2K_FORM%3DGMResults%26sb_action%3DExpand%2BItem%2B%253A%2B3%26LAST_HIDD
EN_TIMESTAMP%3D1272955713301%26UserSearchText%3Dvision%2Bimpairment%2Band%2Bfalls%26HIDDEN_TI
MESTAMP%3D1272955729180%26ORBagentPort%3D14610
Economic impact of vision loss in New Zealand
32 Commercial-in-Confidence
Research Australia and Access Economics 2006). However, comparisons are difficult because
of differences in the definition of vision impairment and depression, and the nature of the
base population. In addition, some studies have found that the longer the duration of vision
loss, the less it is associated with emotional distress.
A UK GP based study involving 1,742 vision impaired individuals (out of a population of 13,900)
aged 75 years and older investigated the association between visual impairment and
depression and anxiety (Evans et al, 2007). A higher prevalence of depression was observed in
the vision impaired population in comparison to those with visual acuity of 6/6 or better. Of
vision impaired older people, 13.5% were depressed compared with 4.6% of people with good
vision (relative risk of 2.9).
Rees et al (2010) identified vision-specific distress as the strongest unique predictor of
depressive symptoms (alongside physical health and a negative life event) using the Impact of
Vision Impairment (IVI) Questionnaire.
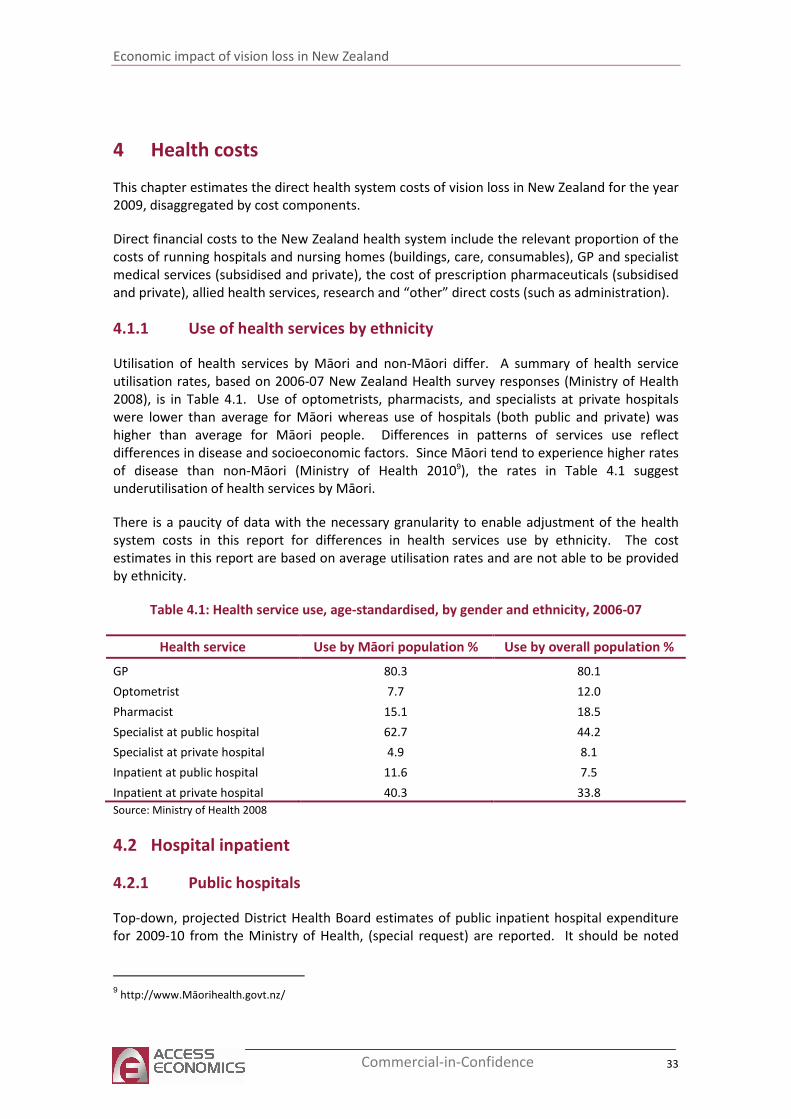
Economic impact of vision loss in New Zealand
33 Commercial-in-Confidence
4 Health costs
This chapter estimates the direct health system costs of vision loss in New Zealand for the year
2009, disaggregated by cost components.
Direct financial costs to the New Zealand health system include the relevant proportion of the
costs of running hospitals and nursing homes (buildings, care, consumables), GP and specialist
medical services (subsidised and private), the cost of prescription pharmaceuticals (subsidised
and private), allied health services, research and “other” direct costs (such as administration).
4.1.1 Use of health services by ethnicity
Utilisation of health services by Māori and non-Māori differ. A summary of health service
utilisation rates, based on 2006-07 New Zealand Health survey responses (Ministry of Health
2008), is in Table 4.1. Use of optometrists, pharmacists, and specialists at private hospitals
were lower than average for Māori whereas use of hospitals (both public and private) was
higher than average for Māori people. Differences in patterns of services use reflect
differences in disease and socioeconomic factors. Since Māori tend to experience higher rates
of disease than non-Māori (Ministry of Health 20109), the rates in Table 4.1 suggest
underutilisation of health services by Māori.
There is a paucity of data with the necessary granularity to enable adjustment of the health
system costs in this report for differences in health services use by ethnicity. The cost
estimates in this report are based on average utilisation rates and are not able to be provided
by ethnicity.
Table 4.1: Health service use, age-standardised, by gender and ethnicity, 2006-07
Health service Use by Māori population % Use by overall population %
GP 80.3 80.1
Optometrist 7.7 12.0
Pharmacist 15.1 18.5
Specialist at public hospital 62.7 44.2
Specialist at private hospital 4.9 8.1
Inpatient at public hospital 11.6 7.5
Inpatient at private hospital 40.3 33.8
Source: Ministry of Health 2008
4.2 Hospital inpatient
4.2.1 Public hospitals
Top-down, projected District Health Board estimates of public inpatient hospital expenditure
for 2009-10 from the Ministry of Health, (special request) are reported. It should be noted
9 http://www.Māorihealth.govt.nz/
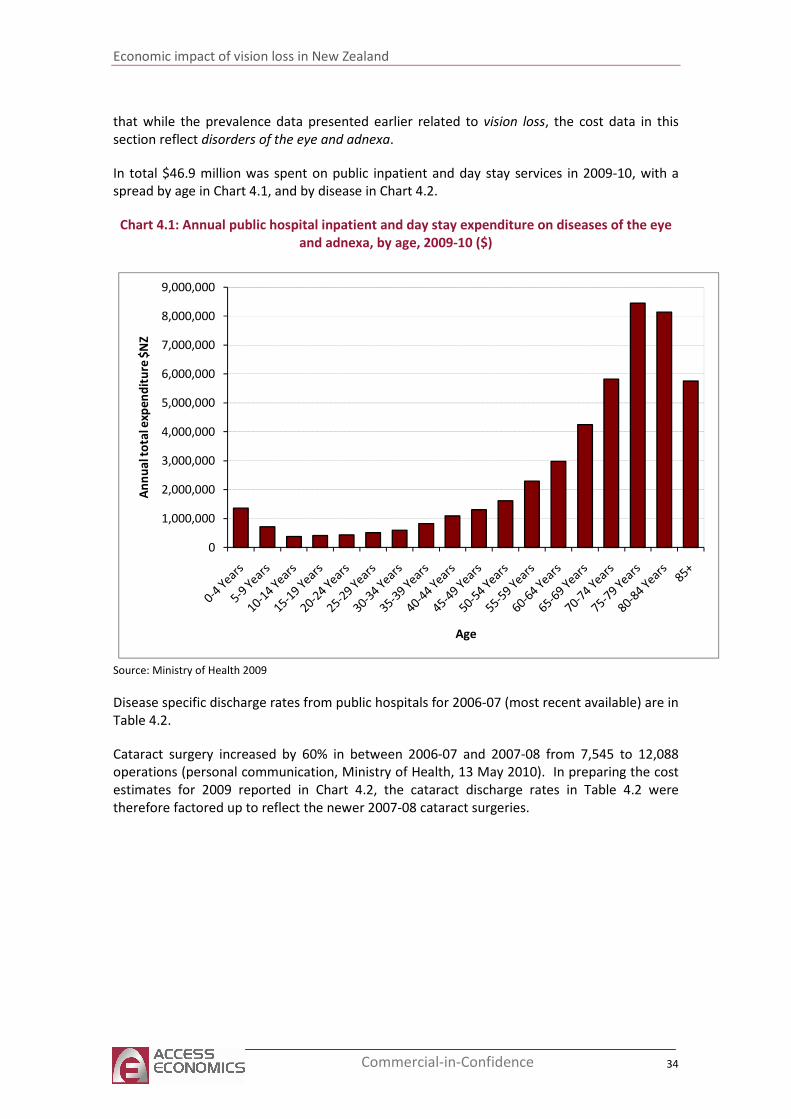
Economic impact of vision loss in New Zealand
34 Commercial-in-Confidence
that while the prevalence data presented earlier related to vision loss, the cost data in this
section reflect disorders of the eye and adnexa.
In total $46.9 million was spent on public inpatient and day stay services in 2009-10, with a
spread by age in Chart 4.1, and by disease in Chart 4.2.
Chart 4.1: Annual public hospital inpatient and day stay expenditure on diseases of the eye
and adnexa, by age, 2009-10 ($)
0
1,000,000
2,000,000
3,000,000
4,000,000
5,000,000
6,000,000
7,000,000
8,000,000
9,000,000
An
nu
al t
ota
l exp
en
dit
ure
$N
Z
Age
Source: Ministry of Health 2009
Disease specific discharge rates from public hospitals for 2006-07 (most recent available) are in
Table 4.2.
Cataract surgery increased by 60% in between 2006-07 and 2007-08 from 7,545 to 12,088
operations (personal communication, Ministry of Health, 13 May 2010). In preparing the cost
estimates for 2009 reported in Chart 4.2, the cataract discharge rates in Table 4.2 were
therefore factored up to reflect the newer 2007-08 cataract surgeries.
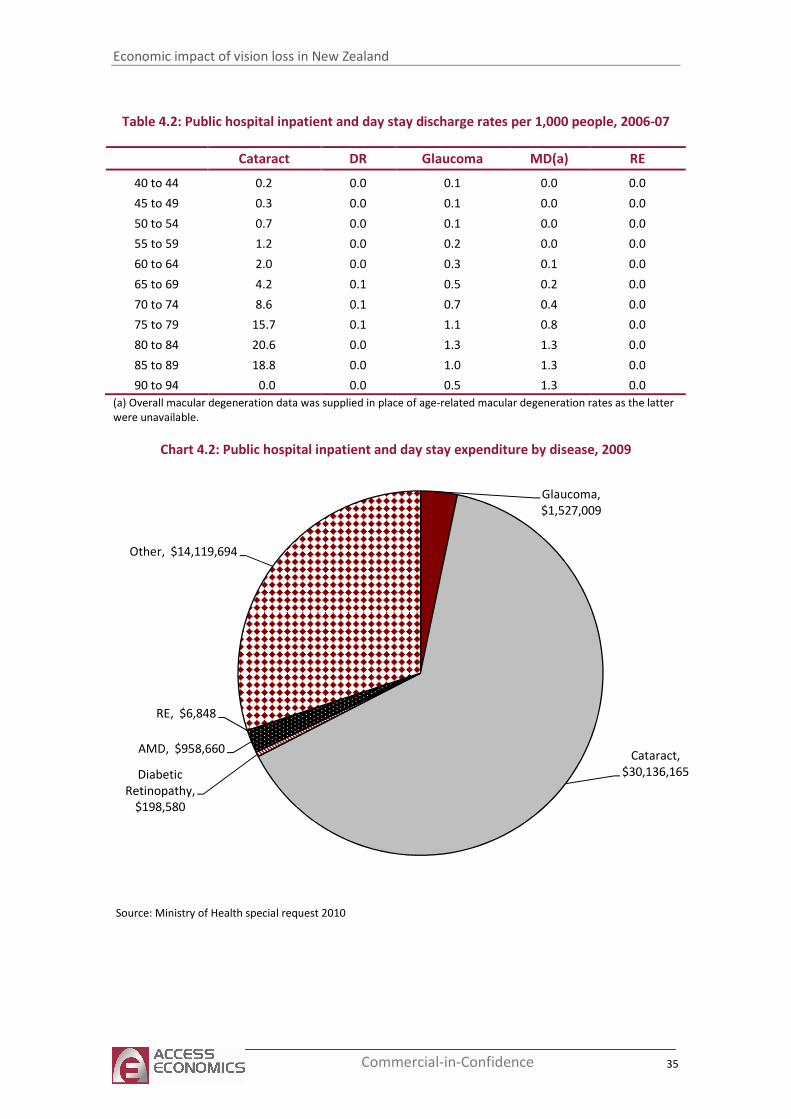
Economic impact of vision loss in New Zealand
35 Commercial-in-Confidence
Table 4.2: Public hospital inpatient and day stay discharge rates per 1,000 people, 2006-07
Cataract DR Glaucoma MD(a) RE
40 to 44 0.2 0.0 0.1 0.0 0.0
45 to 49 0.3 0.0 0.1 0.0 0.0
50 to 54 0.7 0.0 0.1 0.0 0.0
55 to 59 1.2 0.0 0.2 0.0 0.0
60 to 64 2.0 0.0 0.3 0.1 0.0
65 to 69 4.2 0.1 0.5 0.2 0.0
70 to 74 8.6 0.1 0.7 0.4 0.0
75 to 79 15.7 0.1 1.1 0.8 0.0
80 to 84 20.6 0.0 1.3 1.3 0.0
85 to 89 18.8 0.0 1.0 1.3 0.0
90 to 94 0.0 0.0 0.5 1.3 0.0
(a) Overall macular degeneration data was supplied in place of age-related macular degeneration rates as the latter
were unavailable.
Chart 4.2: Public hospital inpatient and day stay expenditure by disease, 2009
Glaucoma,
$1,527,009
Cataract,
$30,136,165 Diabetic
Retinopathy,
$198,580
AMD, $958,660
RE, $6,848
Other, $14,119,694
Source: Ministry of Health special request 2010
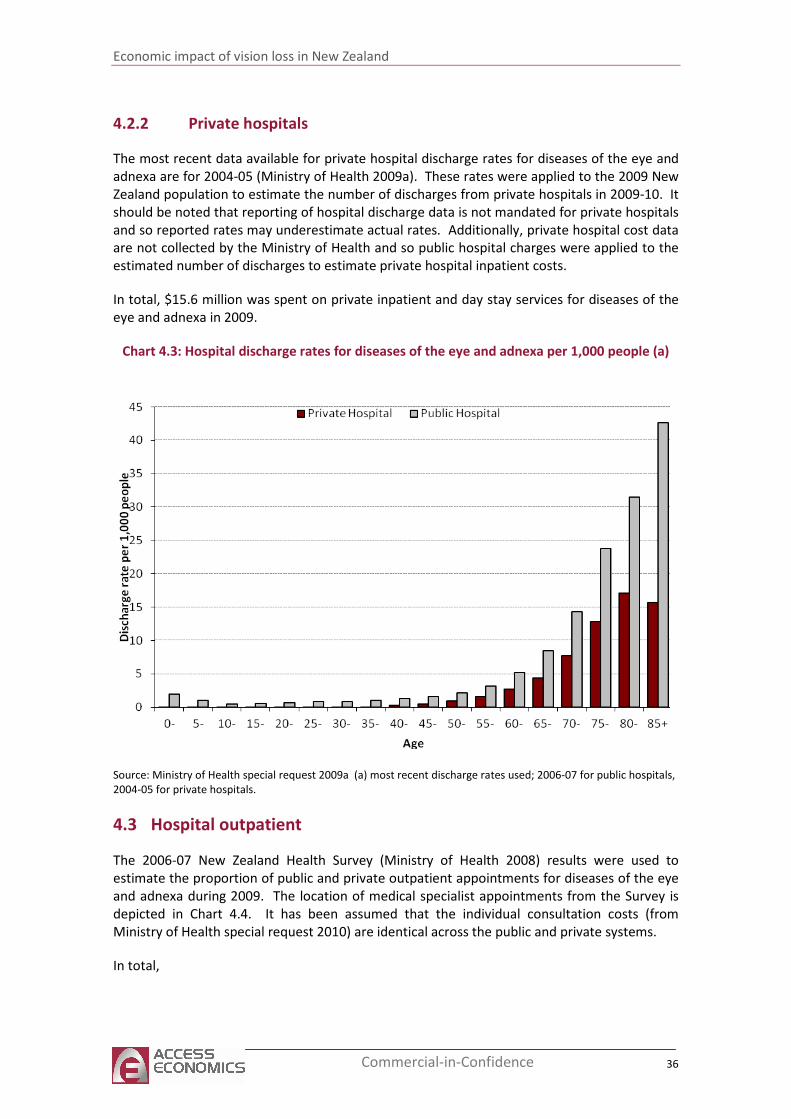
Economic impact of vision loss in New Zealand
36 Commercial-in-Confidence
4.2.2 Private hospitals
The most recent data available for private hospital discharge rates for diseases of the eye and
adnexa are for 2004-05 (Ministry of Health 2009a). These rates were applied to the 2009 New
Zealand population to estimate the number of discharges from private hospitals in 2009-10. It
should be noted that reporting of hospital discharge data is not mandated for private hospitals
and so reported rates may underestimate actual rates. Additionally, private hospital cost data
are not collected by the Ministry of Health and so public hospital charges were applied to the
estimated number of discharges to estimate private hospital inpatient costs.
In total, $15.6 million was spent on private inpatient and day stay services for diseases of the
eye and adnexa in 2009.
Chart 4.3: Hospital discharge rates for diseases of the eye and adnexa per 1,000 people (a)
Source: Ministry of Health special request 2009a (a) most recent discharge rates used; 2006-07 for public hospitals,
2004-05 for private hospitals.
4.3 Hospital outpatient
The 2006-07 New Zealand Health Survey (Ministry of Health 2008) results were used to
estimate the proportion of public and private outpatient appointments for diseases of the eye
and adnexa during 2009. The location of medical specialist appointments from the Survey is
depicted in Chart 4.4. It has been assumed that the individual consultation costs (from
Ministry of Health special request 2010) are identical across the public and private systems.
In total,
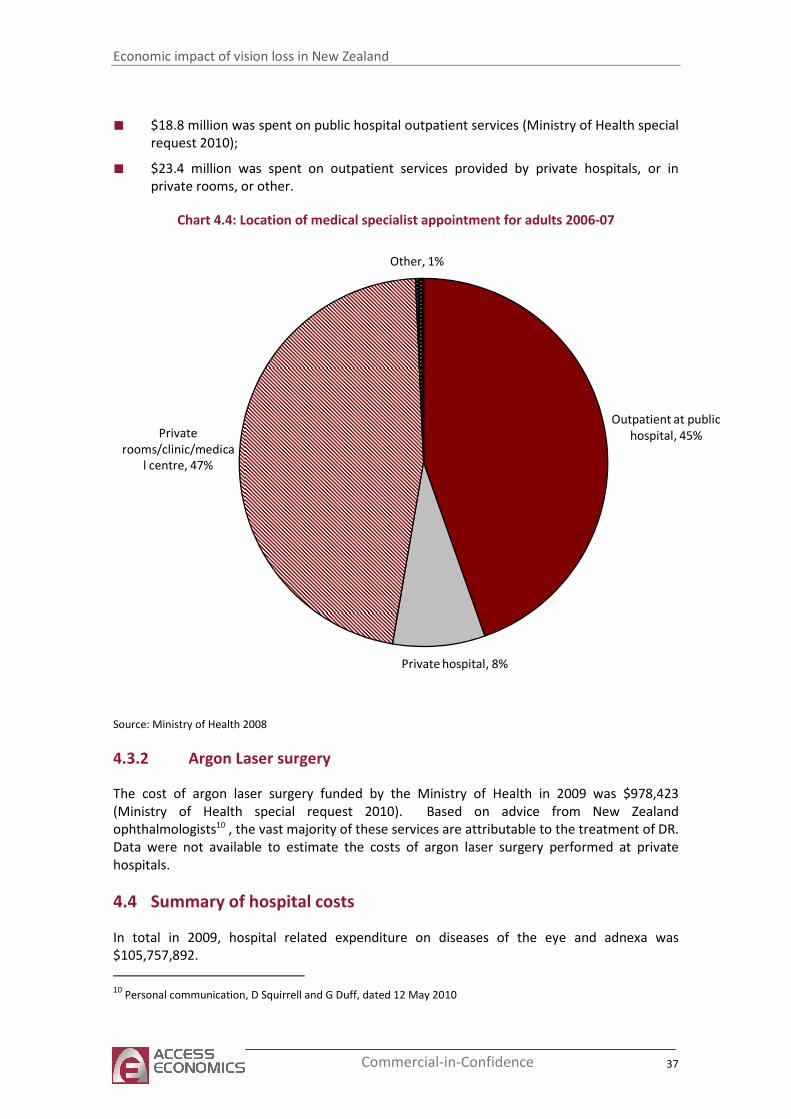
Economic impact of vision loss in New Zealand
37 Commercial-in-Confidence
■ $18.8 million was spent on public hospital outpatient services (Ministry of Health special
request 2010);
■ $23.4 million was spent on outpatient services provided by private hospitals, or in
private rooms, or other.
Chart 4.4: Location of medical specialist appointment for adults 2006-07
Outpatient at public
hospital, 45%
Private hospital, 8%
Private
rooms/clinic/medica
l centre, 47%
Other, 1%
Source: Ministry of Health 2008
4.3.2 Argon Laser surgery
The cost of argon laser surgery funded by the Ministry of Health in 2009 was $978,423
(Ministry of Health special request 2010). Based on advice from New Zealand
ophthalmologists10 , the vast majority of these services are attributable to the treatment of DR.
Data were not available to estimate the costs of argon laser surgery performed at private
hospitals.
4.4 Summary of hospital costs
In total in 2009, hospital related expenditure on diseases of the eye and adnexa was
$105,757,892.
10
Personal communication, D Squirrell and G Duff, dated 12 May 2010
Economic impact of vision loss in New Zealand
38 Commercial-in-Confidence
Table 4.3: Overall hospital costs, 2009
Cost component Estimated cost
Public inpatient and day stay $46,946,955
Public outpatients $18,821,439
Private inpatient and day stay $15,631,978
Private outpatients $23,379,097
Argon Laser surgery $978,423
Total $105,757,892
Source : Ministry of Health 2008, 2009a, special request 2010
4.5 General Practice (GP)
Results from the RNZFB survey (RNZFB 2006) were used to estimate the total number of GP
visits for vision related problems in 2009. The Survey included only those with visual acuity
6/24 or worse (ie moderate to severe vision loss). The number of GP visits per annum by
people with visual acuity 6/24 or worse from the Survey is in Table 4.4.
Table 4.4: Number of vision related GP visits, RNZFB survey population, 2006
Proportion of respondents Number of vision related GP visits per
annum
67% 0
13% 1-2
17% 3-5
3% >6
Source: RNZFB 2006
RNZFB survey respondents who visited a GP for vision related problems spent an average of
$42.11 per appointment (inflated to $NZ 2009 using Statistics New Zealand, 2009).
The government contributed around $527.7 million towards visits to GPs at Primary Health
Organisations11 in 2009 (Ministry of Health special request 2010). The average amount
contributed per visit was calculated using the average number of GP appointments per person
(based on 2006-07 Health Survey results, Ministry of Health 2008) and total New Zealand
population (Statistics New Zealand 2009a). The sum of individual and government
contributions for each GP visit was found to be $80.27. This combined per visit payment and
the frequency of GP visits for vision problems (Table 4.4) was applied to the population aged
50 years and above with visual acuity greater than or equal to 6/24 (Foran et al 2000) to
calculate the total amount spent on GP visits in 2009.
Using this methodology, total expenditure on GP services in 2009 for vision related
consultations was $2.3 million (Table 4.5), or 0.2% of total spend on GP services (Ministry of
11
Per MoH special data request (2010), $576,636,011.92 (excluding GST) was provided to Primary Health
Organisations for services relating to enrolment of the population ('First contact care'), health promotion, and
services to improve access in 2009. According to 2007-08 distribution of GP funds, approximately 71% was
attributed to ‘First Contact’ payments for patient visits (MoH 2010).
Economic impact of vision loss in New Zealand
39 Commercial-in-Confidence
Health special request 2010). Notably, the Survey included only those with moderate and
severe vision loss, so expenditure on GP services by those with mild vision loss is excluded.
Insufficient data was available to estimate expenditure on vision related GP visits for the
population with mild vision loss (visual acuity 6/12 to 6/24).
Table 4.5: Total spend on vision related GP appointments, moderately and severely vision
impaired population (visual acuity ≥ 6/24), 2009
Age
Number of people
with visual acuity ≥
6/24
Number GP visits Expenditure
50-55 636 671 $53,874
55-59 552 582 $46,737
60-65 2,646 2791 $224,066
65-69 2,060 2173 $174,427
70-75 3,298 3480 $279,306
75-79 2,608 2751 $220,837
80-85 8,734 9215 $739,661
85-89 4,861 5128 $411,615
90+ 2,118 2235 $179,383
Total 27,512 29,026 $2,329,905
Source: RNZFB 2006, Statistics New Zealand 2009a, Ministry of Health 2008
4.6 Pharmaceuticals
Subsidised
Expenditure on subsidised pharmaceuticals for glaucoma was $8,238,568 in 2009 according to
Pharmaceutical Management Agency of New Zealand (PHARMAC) (special request, Table 4.6).
Based on ophthalmologists’ advice, other ophthalmic agents listed on the Pharmaceutical
Schedule are not commonly used to treat eye conditions related to vision loss and have not
been included in this report.
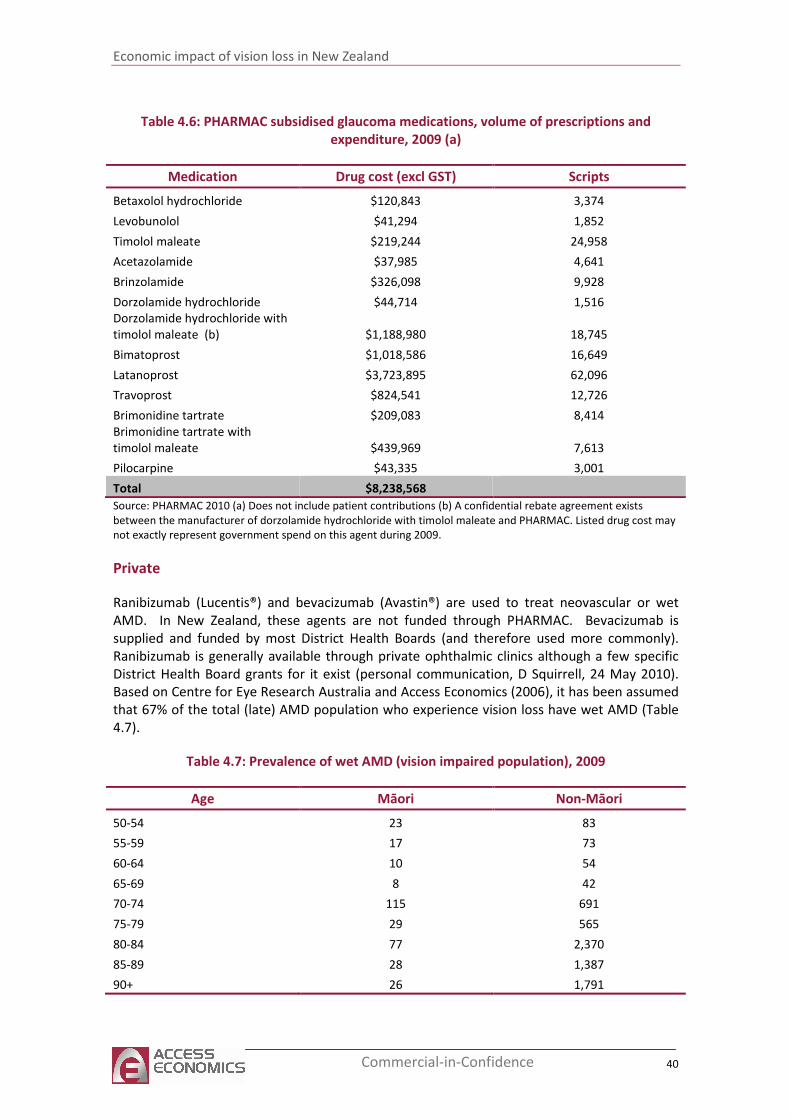
Economic impact of vision loss in New Zealand
40 Commercial-in-Confidence
Table 4.6: PHARMAC subsidised glaucoma medications, volume of prescriptions and
expenditure, 2009 (a)
Medication Drug cost (excl GST) Scripts
Betaxolol hydrochloride $120,843 3,374
Levobunolol $41,294 1,852
Timolol maleate $219,244 24,958
Acetazolamide $37,985 4,641
Brinzolamide $326,098 9,928
Dorzolamide hydrochloride $44,714 1,516
Dorzolamide hydrochloride with
timolol maleate (b) $1,188,980 18,745
Bimatoprost $1,018,586 16,649
Latanoprost $3,723,895 62,096
Travoprost $824,541 12,726
Brimonidine tartrate $209,083 8,414
Brimonidine tartrate with
timolol maleate $439,969 7,613
Pilocarpine $43,335 3,001
Total $8,238,568
Source: PHARMAC 2010 (a) Does not include patient contributions (b) A confidential rebate agreement exists
between the manufacturer of dorzolamide hydrochloride with timolol maleate and PHARMAC. Listed drug cost may
not exactly represent government spend on this agent during 2009.
Private
Ranibizumab (Lucentis®) and bevacizumab (Avastin®) are used to treat neovascular or wet
AMD. In New Zealand, these agents are not funded through PHARMAC. Bevacizumab is
supplied and funded by most District Health Boards (and therefore used more commonly).
Ranibizumab is generally available through private ophthalmic clinics although a few specific
District Health Board grants for it exist (personal communication, D Squirrell, 24 May 2010).
Based on Centre for Eye Research Australia and Access Economics (2006), it has been assumed
that 67% of the total (late) AMD population who experience vision loss have wet AMD (Table
4.7).
Table 4.7: Prevalence of wet AMD (vision impaired population), 2009
Age Māori Non-Māori
50-54 23 83
55-59 17 73
60-64 10 54
65-69 8 42
70-74 115 691
75-79 29 565
80-84 77 2,370
85-89 28 1,387
90+ 26 1,791
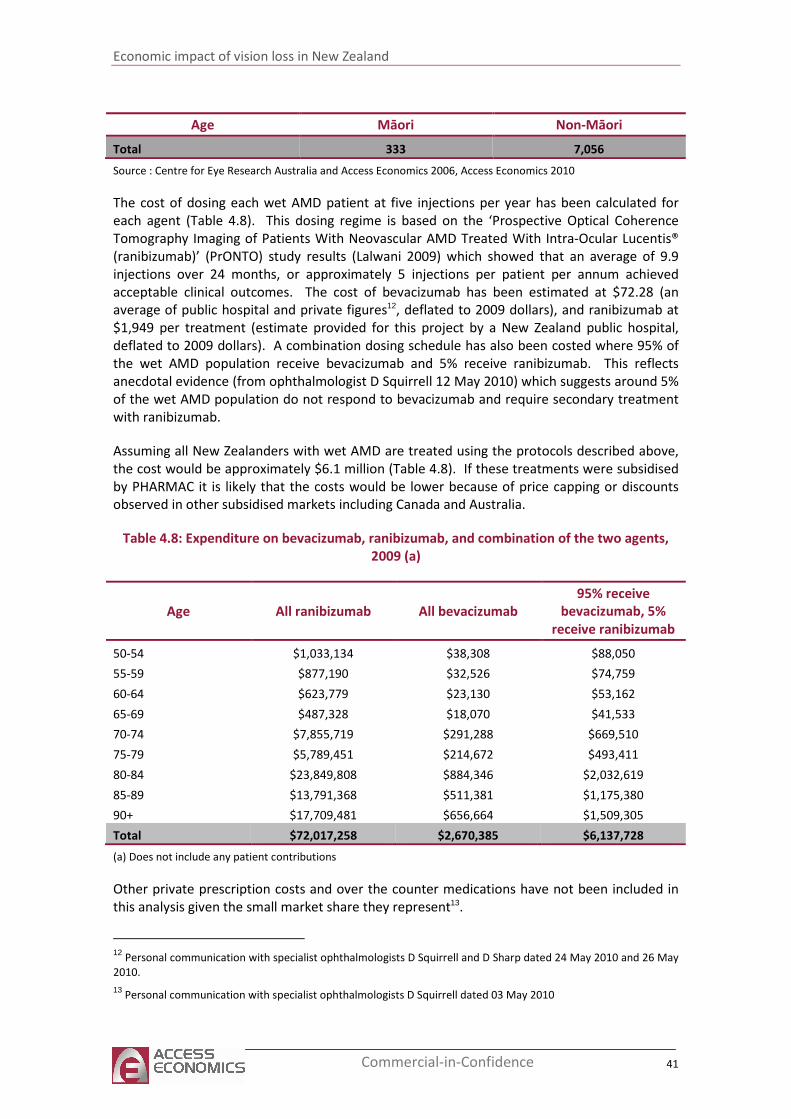
Economic impact of vision loss in New Zealand
41 Commercial-in-Confidence
Age Māori Non-Māori
Total 333 7,056
Source : Centre for Eye Research Australia and Access Economics 2006, Access Economics 2010
The cost of dosing each wet AMD patient at five injections per year has been calculated for
each agent (Table 4.8). This dosing regime is based on the ‘Prospective Optical Coherence
Tomography Imaging of Patients With Neovascular AMD Treated With Intra-Ocular Lucentis®
(ranibizumab)’ (PrONTO) study results (Lalwani 2009) which showed that an average of 9.9
injections over 24 months, or approximately 5 injections per patient per annum achieved
acceptable clinical outcomes. The cost of bevacizumab has been estimated at $72.28 (an
average of public hospital and private figures12, deflated to 2009 dollars), and ranibizumab at
$1,949 per treatment (estimate provided for this project by a New Zealand public hospital,
deflated to 2009 dollars). A combination dosing schedule has also been costed where 95% of
the wet AMD population receive bevacizumab and 5% receive ranibizumab. This reflects
anecdotal evidence (from ophthalmologist D Squirrell 12 May 2010) which suggests around 5%
of the wet AMD population do not respond to bevacizumab and require secondary treatment
with ranibizumab.
Assuming all New Zealanders with wet AMD are treated using the protocols described above,
the cost would be approximately $6.1 million (Table 4.8). If these treatments were subsidised
by PHARMAC it is likely that the costs would be lower because of price capping or discounts
observed in other subsidised markets including Canada and Australia.
Table 4.8: Expenditure on bevacizumab, ranibizumab, and combination of the two agents,
2009 (a)
Age All ranibizumab All bevacizumab
95% receive
bevacizumab, 5%
receive ranibizumab
50-54 $1,033,134 $38,308 $88,050
55-59 $877,190 $32,526 $74,759
60-64 $623,779 $23,130 $53,162
65-69 $487,328 $18,070 $41,533
70-74 $7,855,719 $291,288 $669,510
75-79 $5,789,451 $214,672 $493,411
80-84 $23,849,808 $884,346 $2,032,619
85-89 $13,791,368 $511,381 $1,175,380
90+ $17,709,481 $656,664 $1,509,305
Total $72,017,258 $2,670,385 $6,137,728
(a) Does not include any patient contributions
Other private prescription costs and over the counter medications have not been included in
this analysis given the small market share they represent13.
12
Personal communication with specialist ophthalmologists D Squirrell and D Sharp dated 24 May 2010 and 26 May
2010.
13 Personal communication with specialist ophthalmologists D Squirrell dated 03 May 2010
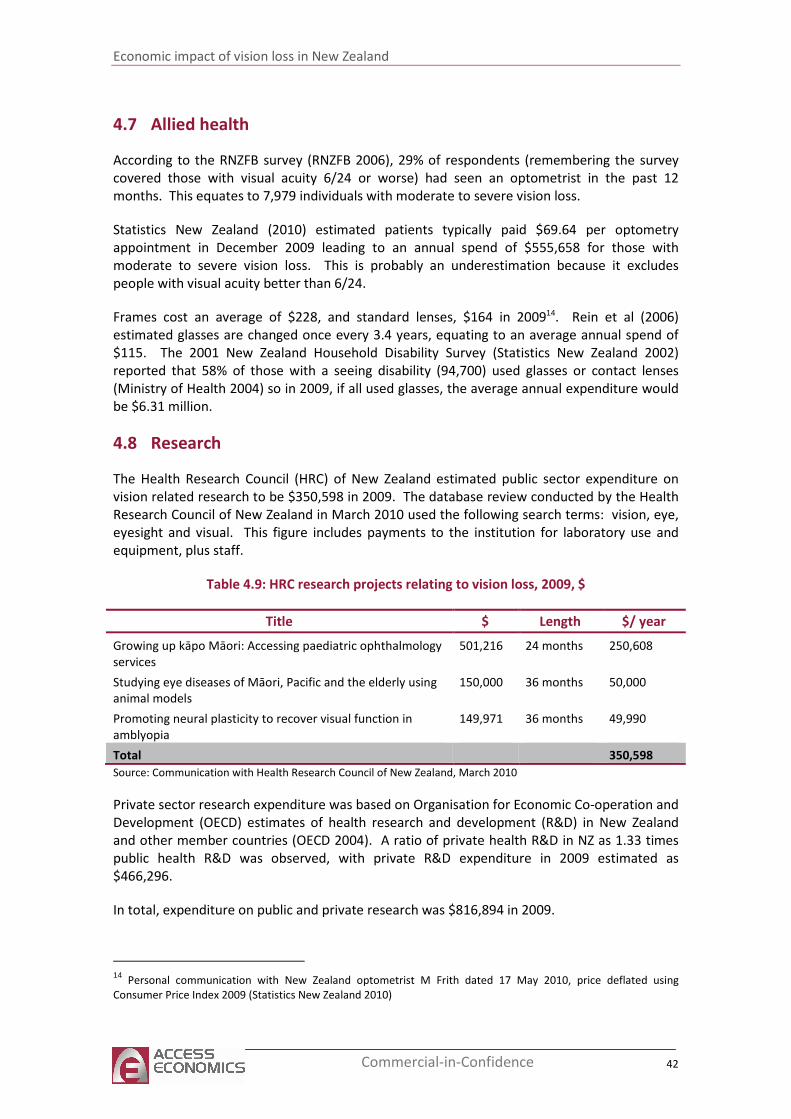
Economic impact of vision loss in New Zealand
42 Commercial-in-Confidence
4.7 Allied health
According to the RNZFB survey (RNZFB 2006), 29% of respondents (remembering the survey
covered those with visual acuity 6/24 or worse) had seen an optometrist in the past 12
months. This equates to 7,979 individuals with moderate to severe vision loss.
Statistics New Zealand (2010) estimated patients typically paid $69.64 per optometry
appointment in December 2009 leading to an annual spend of $555,658 for those with
moderate to severe vision loss. This is probably an underestimation because it excludes
people with visual acuity better than 6/24.
Frames cost an average of $228, and standard lenses, $164 in 200914. Rein et al (2006)
estimated glasses are changed once every 3.4 years, equating to an average annual spend of
$115. The 2001 New Zealand Household Disability Survey (Statistics New Zealand 2002)
reported that 58% of those with a seeing disability (94,700) used glasses or contact lenses
(Ministry of Health 2004) so in 2009, if all used glasses, the average annual expenditure would
be $6.31 million.
4.8 Research
The Health Research Council (HRC) of New Zealand estimated public sector expenditure on
vision related research to be $350,598 in 2009. The database review conducted by the Health
Research Council of New Zealand in March 2010 used the following search terms: vision, eye,
eyesight and visual. This figure includes payments to the institution for laboratory use and
equipment, plus staff.
Table 4.9: HRC research projects relating to vision loss, 2009, $
Title $ Length $/ year
Growing up kāpo Māori: Accessing paediatric ophthalmology
services
501,216 24 months 250,608
Studying eye diseases of Māori, Pacific and the elderly using
animal models
150,000 36 months 50,000
Promoting neural plasticity to recover visual function in
amblyopia
149,971 36 months 49,990
Total 350,598
Source: Communication with Health Research Council of New Zealand, March 2010
Private sector research expenditure was based on Organisation for Economic Co-operation and
Development (OECD) estimates of health research and development (R&D) in New Zealand
and other member countries (OECD 2004). A ratio of private health R&D in NZ as 1.33 times
public health R&D was observed, with private R&D expenditure in 2009 estimated as
$466,296.
In total, expenditure on public and private research was $816,894 in 2009.
14
Personal communication with New Zealand optometrist M Frith dated 17 May 2010, price deflated using
Consumer Price Index 2009 (Statistics New Zealand 2010)
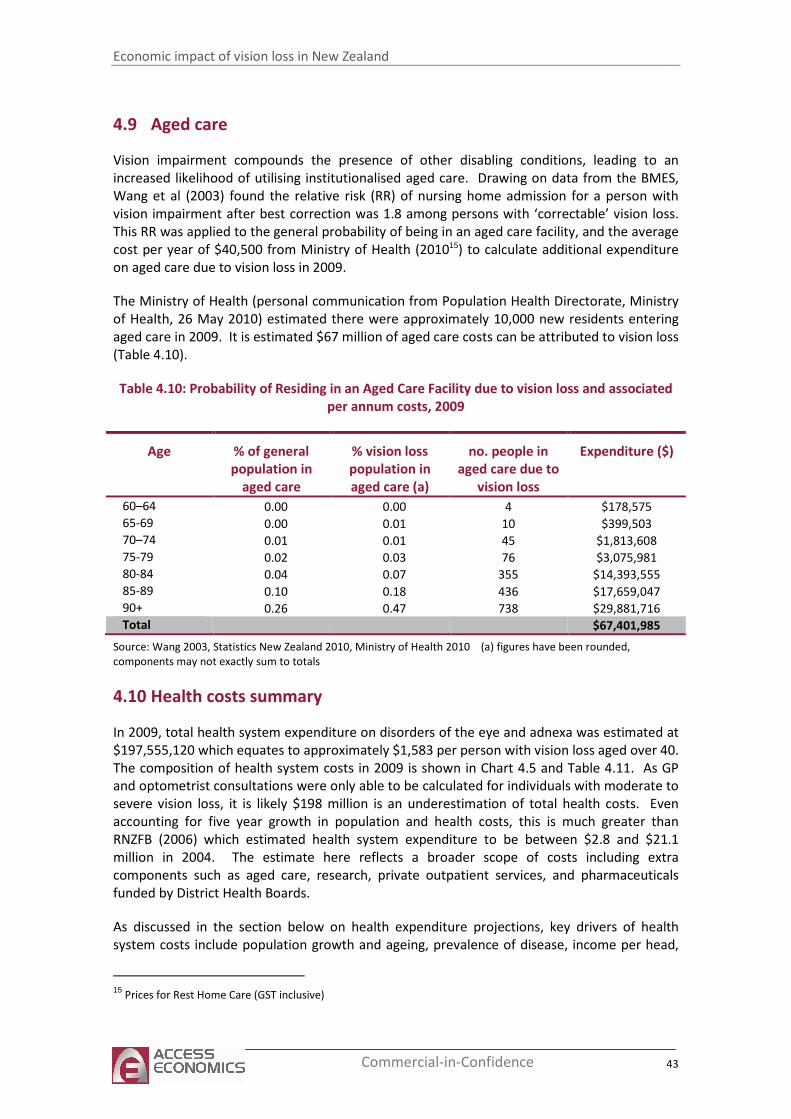
Economic impact of vision loss in New Zealand
43 Commercial-in-Confidence
4.9 Aged care
Vision impairment compounds the presence of other disabling conditions, leading to an
increased likelihood of utilising institutionalised aged care. Drawing on data from the BMES,
Wang et al (2003) found the relative risk (RR) of nursing home admission for a person with
vision impairment after best correction was 1.8 among persons with ‘correctable’ vision loss.
This RR was applied to the general probability of being in an aged care facility, and the average
cost per year of $40,500 from Ministry of Health (201015) to calculate additional expenditure
on aged care due to vision loss in 2009.
The Ministry of Health (personal communication from Population Health Directorate, Ministry
of Health, 26 May 2010) estimated there were approximately 10,000 new residents entering
aged care in 2009. It is estimated $67 million of aged care costs can be attributed to vision loss
(Table 4.10).
Table 4.10: Probability of Residing in an Aged Care Facility due to vision loss and associated
per annum costs, 2009
Age % of general
population in
aged care
% vision loss
population in
aged care (a)
no. people in
aged care due to
vision loss
Expenditure ($)
60–64 0.00 0.00 4 $178,575 65-69 0.00 0.01 10 $399,503 70–74 0.01 0.01 45 $1,813,608 75-79 0.02 0.03 76 $3,075,981 80-84 0.04 0.07 355 $14,393,555 85-89 0.10 0.18 436 $17,659,047 90+ 0.26 0.47 738 $29,881,716 Total $67,401,985
Source: Wang 2003, Statistics New Zealand 2010, Ministry of Health 2010 (a) figures have been rounded,
components may not exactly sum to totals
4.10 Health costs summary
In 2009, total health system expenditure on disorders of the eye and adnexa was estimated at
$197,555,120 which equates to approximately $1,583 per person with vision loss aged over 40.
The composition of health system costs in 2009 is shown in Chart 4.5 and Table 4.11. As GP
and optometrist consultations were only able to be calculated for individuals with moderate to
severe vision loss, it is likely $198 million is an underestimation of total health costs. Even
accounting for five year growth in population and health costs, this is much greater than
RNZFB (2006) which estimated health system expenditure to be between $2.8 and $21.1
million in 2004. The estimate here reflects a broader scope of costs including extra
components such as aged care, research, private outpatient services, and pharmaceuticals
funded by District Health Boards.
As discussed in the section below on health expenditure projections, key drivers of health
system costs include population growth and ageing, prevalence of disease, income per head,
15
Prices for Rest Home Care (GST inclusive)
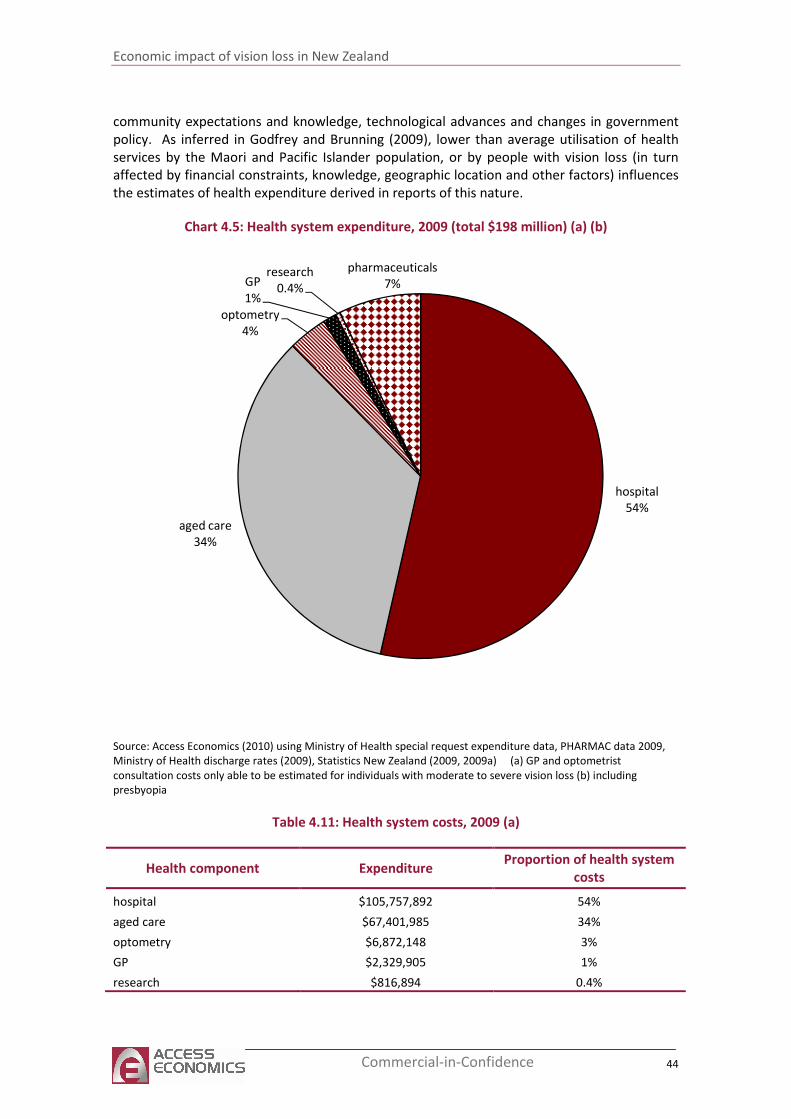
Economic impact of vision loss in New Zealand
44 Commercial-in-Confidence
community expectations and knowledge, technological advances and changes in government
policy. As inferred in Godfrey and Brunning (2009), lower than average utilisation of health
services by the Maori and Pacific Islander population, or by people with vision loss (in turn
affected by financial constraints, knowledge, geographic location and other factors) influences
the estimates of health expenditure derived in reports of this nature.
Chart 4.5: Health system expenditure, 2009 (total $198 million) (a) (b)
hospital
54%
aged care
34%
optometry
4%
GP
1%
research
0.4%
pharmaceuticals
7%
Source: Access Economics (2010) using Ministry of Health special request expenditure data, PHARMAC data 2009,
Ministry of Health discharge rates (2009), Statistics New Zealand (2009, 2009a) (a) GP and optometrist
consultation costs only able to be estimated for individuals with moderate to severe vision loss (b) including
presbyopia
Table 4.11: Health system costs, 2009 (a)
Health component Expenditure Proportion of health system
costs
hospital $105,757,892 54%
aged care $67,401,985 34%
optometry $6,872,148 3%
GP $2,329,905 1%
research $816,894 0.4%
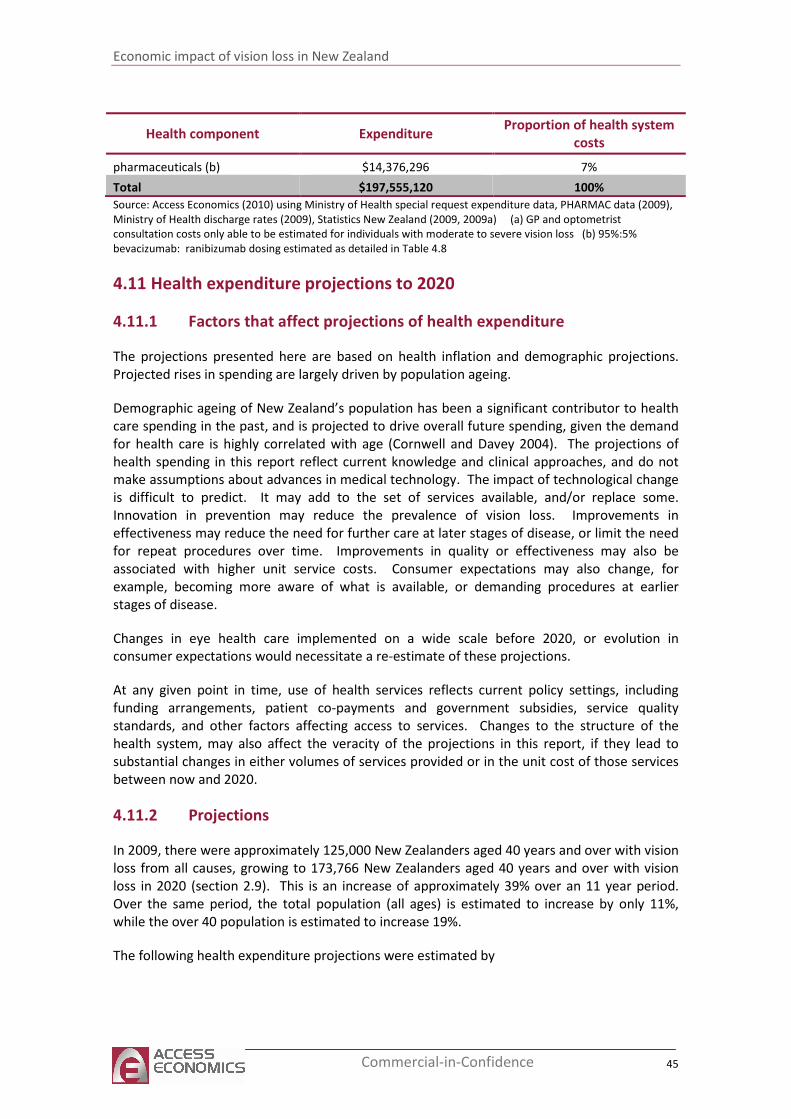
Economic impact of vision loss in New Zealand
45 Commercial-in-Confidence
Health component Expenditure Proportion of health system
costs
pharmaceuticals (b) $14,376,296 7%
Total $197,555,120 100%
Source: Access Economics (2010) using Ministry of Health special request expenditure data, PHARMAC data (2009),
Ministry of Health discharge rates (2009), Statistics New Zealand (2009, 2009a) (a) GP and optometrist
consultation costs only able to be estimated for individuals with moderate to severe vision loss (b) 95%:5%
bevacizumab: ranibizumab dosing estimated as detailed in Table 4.8
4.11 Health expenditure projections to 2020
4.11.1 Factors that affect projections of health expenditure
The projections presented here are based on health inflation and demographic projections.
Projected rises in spending are largely driven by population ageing.
Demographic ageing of New Zealand’s population has been a significant contributor to health
care spending in the past, and is projected to drive overall future spending, given the demand
for health care is highly correlated with age (Cornwell and Davey 2004). The projections of
health spending in this report reflect current knowledge and clinical approaches, and do not
make assumptions about advances in medical technology. The impact of technological change
is difficult to predict. It may add to the set of services available, and/or replace some.
Innovation in prevention may reduce the prevalence of vision loss. Improvements in
effectiveness may reduce the need for further care at later stages of disease, or limit the need
for repeat procedures over time. Improvements in quality or effectiveness may also be
associated with higher unit service costs. Consumer expectations may also change, for
example, becoming more aware of what is available, or demanding procedures at earlier
stages of disease.
Changes in eye health care implemented on a wide scale before 2020, or evolution in
consumer expectations would necessitate a re-estimate of these projections.
At any given point in time, use of health services reflects current policy settings, including
funding arrangements, patient co-payments and government subsidies, service quality
standards, and other factors affecting access to services. Changes to the structure of the
health system, may also affect the veracity of the projections in this report, if they lead to
substantial changes in either volumes of services provided or in the unit cost of those services
between now and 2020.
4.11.2 Projections
In 2009, there were approximately 125,000 New Zealanders aged 40 years and over with vision
loss from all causes, growing to 173,766 New Zealanders aged 40 years and over with vision
loss in 2020 (section 2.9). This is an increase of approximately 39% over an 11 year period.
Over the same period, the total population (all ages) is estimated to increase by only 11%,
while the over 40 population is estimated to increase 19%.
The following health expenditure projections were estimated by
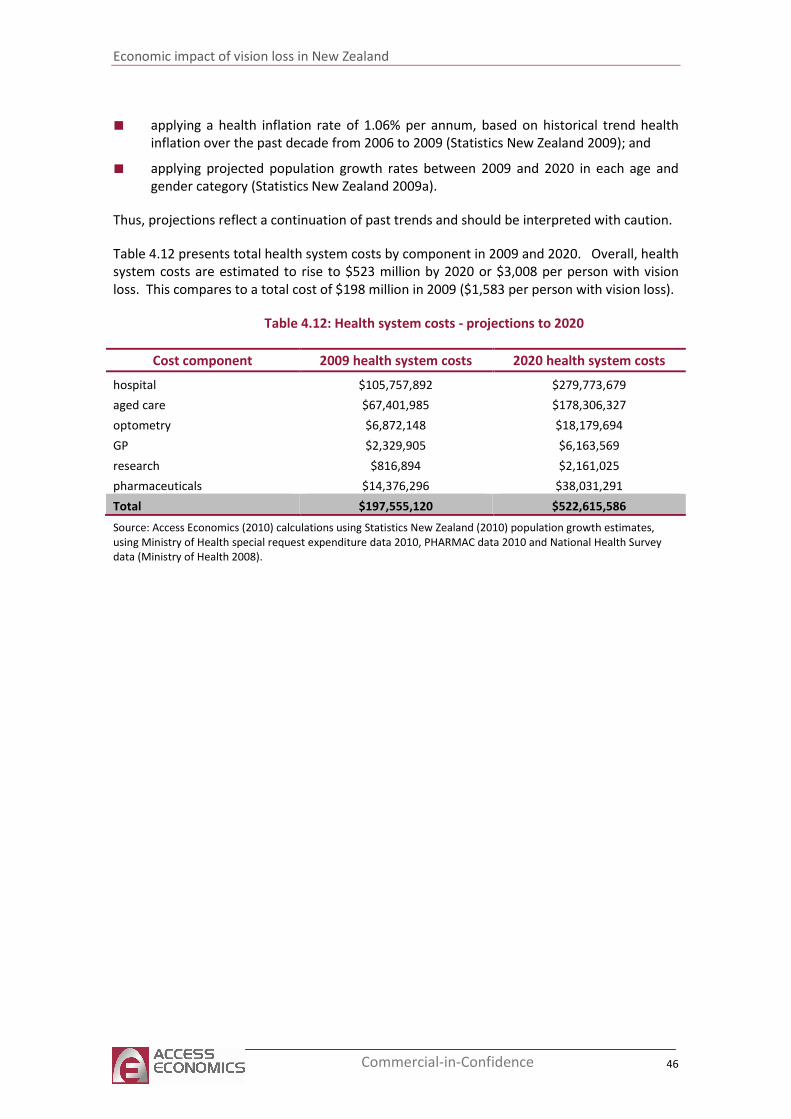
Economic impact of vision loss in New Zealand
46 Commercial-in-Confidence
■ applying a health inflation rate of 1.06% per annum, based on historical trend health
inflation over the past decade from 2006 to 2009 (Statistics New Zealand 2009); and
■ applying projected population growth rates between 2009 and 2020 in each age and
gender category (Statistics New Zealand 2009a).
Thus, projections reflect a continuation of past trends and should be interpreted with caution.
Table 4.12 presents total health system costs by component in 2009 and 2020. Overall, health
system costs are estimated to rise to $523 million by 2020 or $3,008 per person with vision
loss. This compares to a total cost of $198 million in 2009 ($1,583 per person with vision loss).
Table 4.12: Health system costs - projections to 2020
Cost component 2009 health system costs 2020 health system costs
hospital $105,757,892 $279,773,679
aged care $67,401,985 $178,306,327
optometry $6,872,148 $18,179,694
GP $2,329,905 $6,163,569
research $816,894 $2,161,025
pharmaceuticals $14,376,296 $38,031,291
Total $197,555,120 $522,615,586
Source: Access Economics (2010) calculations using Statistics New Zealand (2010) population growth estimates,
using Ministry of Health special request expenditure data 2010, PHARMAC data 2010 and National Health Survey
data (Ministry of Health 2008).
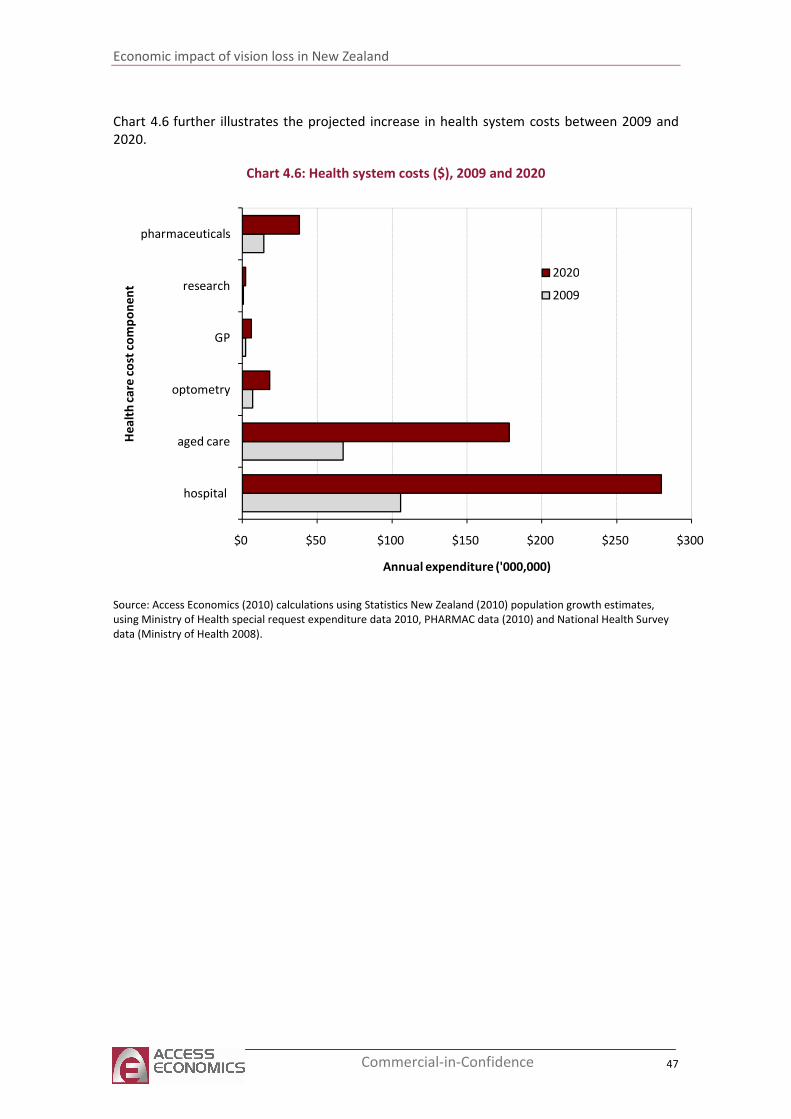
Economic impact of vision loss in New Zealand
47 Commercial-in-Confidence
Chart 4.6 further illustrates the projected increase in health system costs between 2009 and
2020.
Chart 4.6: Health system costs ($), 2009 and 2020
$0 $50 $100 $150 $200 $250 $300
hospital
aged care
optometry
GP
research
pharmaceuticals
Annual expenditure ('000,000)
He
alt
h c
are
co
st c
om
po
ne
nt
2020
2009
Source: Access Economics (2010) calculations using Statistics New Zealand (2010) population growth estimates,
using Ministry of Health special request expenditure data 2010, PHARMAC data (2010) and National Health Survey
data (Ministry of Health 2008).
Economic impact of vision loss in New Zealand
48 Commercial-in-Confidence
5 Other financial costs
5.1 Productivity losses
In this report, productivity losses include those associated with differences in employment
rates for those living with vision loss, and earnings foregone because of premature death
attributable to vision loss. Illness and disease more generally may lead to productivity losses
where they result in higher than average absenteeism, and lower than average productivity at
work (‘presenteeism costs’). These elements of potential productivity losses are typically
difficult to measure and studies with comparative data were not available for this report.
Access Economics adopts a human capital approach to the estimation of productivity losses in
developed countries.
5.1.1 Studies of the impact of vision loss on employment in New Zealand
Disability survey
According to the 2001 Disability Survey (Statistics New Zealand 2002), 8% of people who were
seeing disabled were unemployed (an unemployment rate of 15.4% of the labour force) (Table
5.1). This unemployment rate compares to 5.7% of the general population in June 2001
(Statistics New Zealand 2001).
Table 5.1: Labour force status of adults aged 15–64 with a seeing disability living in
households
Disability type
in adults aged
15-64
In labour force Not in labour force
(%)
Total (%)
Employed (%) Unemployed (%)
Seeing 44 8 48 100
Source: Statistics New Zealand 2002
RNZFB employment survey
La Grow (2003) surveyed 150 randomly selected RNZFB members of working age. (The sample
was drawn from the 12,900 members who had visual acuity of 6/24 or worse.) On average
39.3% of the surveyed RNZFB population were currently in paid employment. Of those with no
usable vision, 26% were in paid employment compared with 35% who had a little usable
vision; and 64% who had a lot of usable vision.
Two thirds of those in paid employment stated that the amount they worked was about right,
with 24% saying they would like to work more hours and 10% stating they would like to work
fewer hours. The unemployment rate was 14% of individuals considered to be in the labour
force, and projected to be 24% if discouraged workers were included.
5.1.2 Employment participation
Lower than average employment rates for people with vision loss represents a real cost to the
economy, through a loss in earnings (and consequently, taxation revenue). To derive
Economic impact of vision loss in New Zealand
49 Commercial-in-Confidence
productivity losses from lower employment, the employment difference parameters outlined
above from disability survey data (owing to a greater sample size than the RNZFB survey) were
applied to estimates of the 2009 population with vision loss in each age group and the latest
age-specific average weekly earnings (AWE) data (Statistics New Zealand, 2010). A maximum
working age of 64 was assumed.
AWE data from 2008 (latest available) was inflated to 2009 dollars, using the consumer price
index between June 2008 and June 2009 (Statistics New Zealand, 2010). AWE estimates for all
workers (full-time and part-time) are presented in Table 5.2
Table 5.2: AWE for full-time and part-time employed in 2009
Age group Māori male
AWE ($)
Māori female
AWE ($)
non-Māori male
AWE ($)
non-Māori
female AWE ($)
40-44 936 668 1146 743
45-49 936 668 1146 743
50-54 936 668 1146 743
55-59 936 668 1146 743
60-64 936 668 1146 743
Source: Access Economics (2010) calculations using Statistics New Zealand data (2010)
Productivity losses reflecting the impact of vision loss on the likelihood of employment
compared with the average in 2009 were approximately $110 million (Table 5.3).
Table 5.3: Productivity loss due to lower employment, 2009
Age group Māori male ($)
Māori female
($)
non-Māori male
($)
non-Māori
female ($)
40-44 1,138,542 784,345 4,371,703 2,632,239
45-49 906,498 675,615 4,573,535 2,842,652
50-54 2,745,755 1,934,359 15,480,961 9,248,472
55-59 2,101,923 1,370,676 13,690,898 7,626,866
60-64 2,751,664 1,641,558 22,580,911 11,433,722
Subtotal 9,644,382 6,406,553 60,698,008 33,783,951
Total 110,532,894
Source: Access Economics calculations using Statistics New Zealand (2001, 2002, 2010)
5.1.3 Premature death
Calculations in section 3 suggest there were 115 deaths attributable to vision loss in 2009.
Based on this case mortality risk, and incorporating employment rates and estimates of
average lifetime earnings for different age-gender groups, the present value of lost earnings
due to premature mortality was estimated to be $1.7 million in 2009 (at a discount rate of 3%
per annum) (Table 5.4).
Economic impact of vision loss in New Zealand
50 Commercial-in-Confidence
Table 5.4: Lost lifetime earnings due to premature death, 2009
Age group Māori ($) non-Māori ($) Total ($)
40-44 9,334 34,041 43,374
45-49 9,453 44,662 54,115
50-54 37,056 195,389 232,445
55-59 33,434 202,286 235,721
60-64 51,615 385,272 436,887
65-69 32,426 227,773 260,199
70-74 48,099 374,854 422,952
Total 221,417 1,464,276 1,685,693
5.1.4 Distribution of productivity losses
Different productivity loss components were imposed on different sections of society, with
employees and employers bearing most of the burden through lost lifetime earnings totalling
almost $75 million.
Reduced earnings from lower employment participation and premature death result in
reduced taxation revenue collected by the Government. As well as forgone income (personal)
taxation, there is also a fall in indirect (consumption) tax, as those with lower incomes spend
less on the consumption of goods and services. Lost taxation revenue to the Government was
estimated by applying an average personal income tax rate and average indirect taxation rate
to lost earnings. Rates in 2009 were 19.1% and 12.5%, respectively (Statistics New Zealand
2009). Lost taxation revenue from vision loss in 2009 was $34.6 million.
The distribution of estimated productivity losses by age group is provided in Table 5.5. Overall,
productivity losses were $110 million.
Table 5.5: Productivity loss due to lower employment, 2009
Age group
Incurred by
employee and
employer ($)
Incurred by
government ($)
40-44 6,139,053 2,831,248
45-49 6,428,480 2,964,727
50-54 18,380,729 8,476,942
55-59 16,050,728 7,402,377
60-64 24,866,248 11,467,975
65-69 1,479,013 682,101
70-74 1,581,227 729,240
Total 74,925,478 34,554,610
5.2 Informal care costs
Informal carers are people who provide informal care to others in need of assistance or
support. Most informal carers are family or friends of the person receiving care. Carers may
Economic impact of vision loss in New Zealand
51 Commercial-in-Confidence
take time off work to accompany people with vision loss to medical appointments, stay with
them in hospital, or care for them at home. Carers may also take time off work to undertake
many of the unpaid tasks that the person with vision loss would do if they did not have vision
loss and were able to do these tasks.
Informal care is distinguished from services provided by people employed in the health and
community sectors (formal care) because the care is generally provided free of charge to the
recipient and is not regulated by the government. While informal care is provided free of
charge, it is not free in an economic sense, as time spent caring is time that cannot be directed
to other activities such as paid work, unpaid work (such as housework or yard work) or leisure.
As such, informal care is a use of economic resources.
There are three potential methodologies that can be used to place a dollar value on the
informal care provided:
■ The opportunity cost method values earnings foregone by the carer, in caring for the
person with vision loss. The time devoted to caring responsibilities is time that cannot
be spent in the paid workforce
■ The replacement valuation method estimates the cost of buying a similar amount of
services from the formal care sector.
■ The self valuation method sums the costs of what carers themselves feel they should be
paid for the care provided to the person with vision loss.
The opportunity cost method has been used for this report because of the nature of data
available.
It is calculated as the number of people with vision loss who require some level of care,
multiplied by the average number of hours of care required, multiplied by an average hourly
rate for the wage forgone by the carer, which is weighted by age, gender and the probability of
alternative employment.
According to the 2006 Disability survey (Statistics New Zealand 2009b), around 23% of adults
with a seeing disability received help from informal carers for everyday activities (one or more
of personal care, meal preparation, shopping, everyday housework, heavy housework, and
personal finances) as outlined in Table 5.6. Of seeing disabled individuals aged 15-64, 13%
needed help from informal carers compared with 38% aged 65 years and above.
Table 5.6: Assistance needed by adults with a seeing disability, 2006
Personal
care
Meal
preparation Shopping
Everyday
housework
Heavy
housework
Personal
finances
Seeing
disability
n/a n/a 3,400 (14%) n/a 3,900
(16%)
2,800 (12%)
Source: Statistics New Zealand 2009b
The RNZFB (2006) also reported on unpaid assistance provided by family members to people
with moderate to severe vision loss (visual acuity worse than 6/24), and results are
summarised in Table 5.7. Approximately 3.5 hours of informal care was provided per survey
respondent.
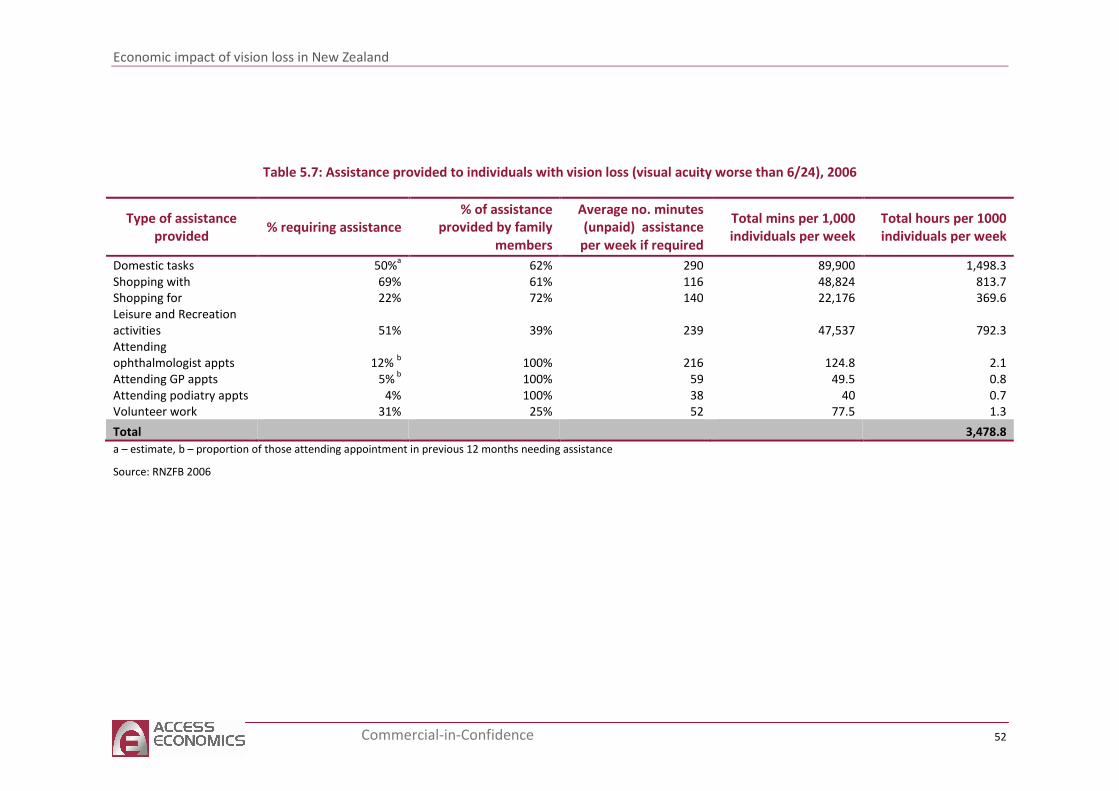
Economic impact of vision loss in New Zealand
52 Commercial-in-Confidence
Table 5.7: Assistance provided to individuals with vision loss (visual acuity worse than 6/24), 2006
Type of assistance
provided % requiring assistance
% of assistance
provided by family
members
Average no. minutes
(unpaid) assistance
per week if required
Total mins per 1,000
individuals per week
Total hours per 1000
individuals per week
Domestic tasks 50%a 62% 290 89,900 1,498.3
Shopping with 69% 61% 116 48,824 813.7
Shopping for 22% 72% 140 22,176 369.6
Leisure and Recreation
activities 51% 39% 239 47,537 792.3
Attending
ophthalmologist appts 12% b 100% 216 124.8 2.1
Attending GP appts 5% b
100% 59 49.5 0.8
Attending podiatry appts 4% 100% 38 40 0.7
Volunteer work 31% 25% 52 77.5 1.3
Total 3,478.8
a – estimate, b – proportion of those attending appointment in previous 12 months needing assistance
Source: RNZFB 2006
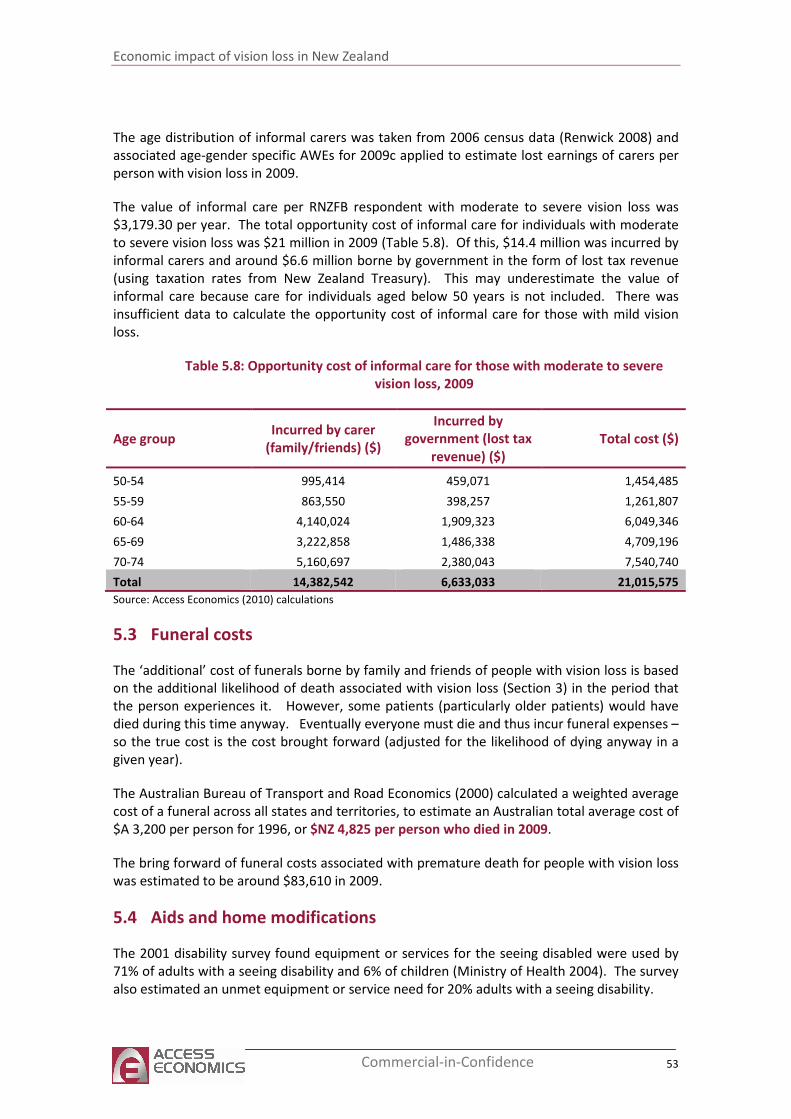
Economic impact of vision loss in New Zealand
53 Commercial-in-Confidence
The age distribution of informal carers was taken from 2006 census data (Renwick 2008) and
associated age-gender specific AWEs for 2009c applied to estimate lost earnings of carers per
person with vision loss in 2009.
The value of informal care per RNZFB respondent with moderate to severe vision loss was
$3,179.30 per year. The total opportunity cost of informal care for individuals with moderate
to severe vision loss was $21 million in 2009 (Table 5.8). Of this, $14.4 million was incurred by
informal carers and around $6.6 million borne by government in the form of lost tax revenue
(using taxation rates from New Zealand Treasury). This may underestimate the value of
informal care because care for individuals aged below 50 years is not included. There was
insufficient data to calculate the opportunity cost of informal care for those with mild vision
loss.
Table 5.8: Opportunity cost of informal care for those with moderate to severe
vision loss, 2009
Age group Incurred by carer
(family/friends) ($)
Incurred by
government (lost tax
revenue) ($)
Total cost ($)
50-54 995,414 459,071 1,454,485
55-59 863,550 398,257 1,261,807
60-64 4,140,024 1,909,323 6,049,346
65-69 3,222,858 1,486,338 4,709,196
70-74 5,160,697 2,380,043 7,540,740
Total 14,382,542 6,633,033 21,015,575
Source: Access Economics (2010) calculations
5.3 Funeral costs
The ‘additional’ cost of funerals borne by family and friends of people with vision loss is based
on the additional likelihood of death associated with vision loss (Section 3) in the period that
the person experiences it. However, some patients (particularly older patients) would have
died during this time anyway. Eventually everyone must die and thus incur funeral expenses –
so the true cost is the cost brought forward (adjusted for the likelihood of dying anyway in a
given year).
The Australian Bureau of Transport and Road Economics (2000) calculated a weighted average
cost of a funeral across all states and territories, to estimate an Australian total average cost of
$A 3,200 per person for 1996, or $NZ 4,825 per person who died in 2009.
The bring forward of funeral costs associated with premature death for people with vision loss
was estimated to be around $83,610 in 2009.
5.4 Aids and home modifications
The 2001 disability survey found equipment or services for the seeing disabled were used by
71% of adults with a seeing disability and 6% of children (Ministry of Health 2004). The survey
also estimated an unmet equipment or service need for 20% adults with a seeing disability.
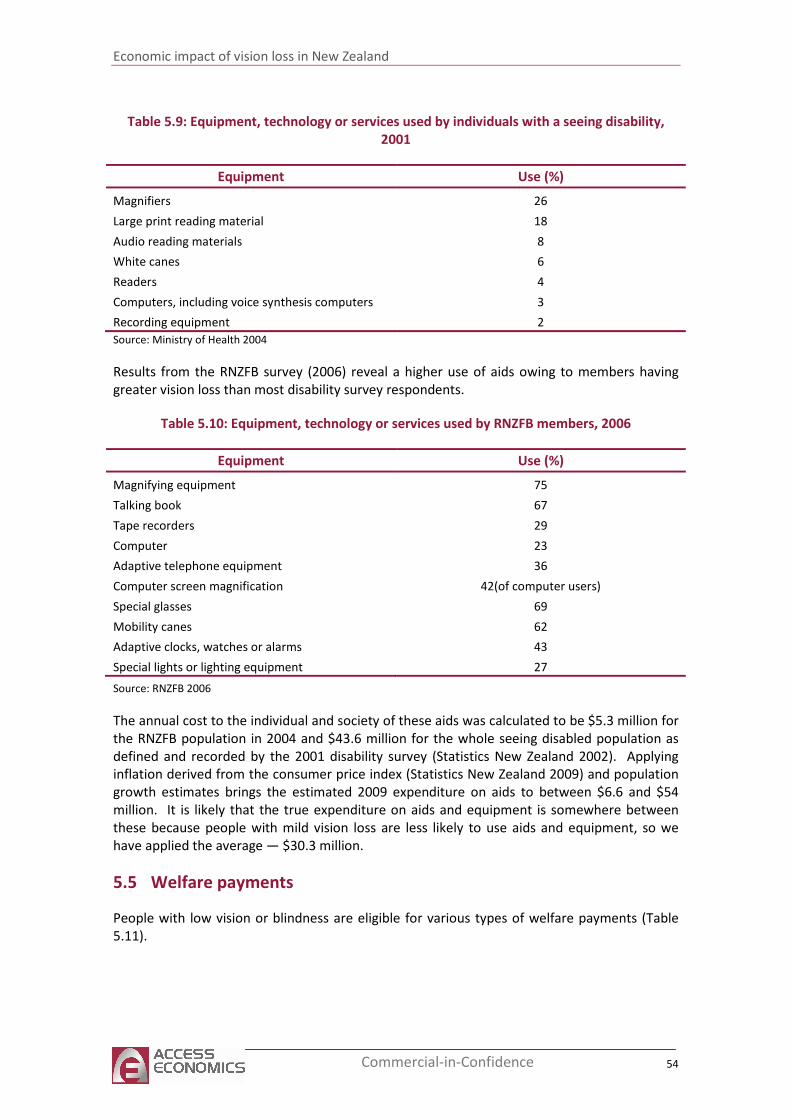
Economic impact of vision loss in New Zealand
54 Commercial-in-Confidence
Table 5.9: Equipment, technology or services used by individuals with a seeing disability,
2001
Equipment Use (%)
Magnifiers 26
Large print reading material 18
Audio reading materials 8
White canes 6
Readers 4
Computers, including voice synthesis computers 3
Recording equipment 2
Source: Ministry of Health 2004
Results from the RNZFB survey (2006) reveal a higher use of aids owing to members having
greater vision loss than most disability survey respondents.
Table 5.10: Equipment, technology or services used by RNZFB members, 2006
Equipment Use (%)
Magnifying equipment 75
Talking book 67
Tape recorders 29
Computer 23
Adaptive telephone equipment 36
Computer screen magnification 42(of computer users)
Special glasses 69
Mobility canes 62
Adaptive clocks, watches or alarms 43
Special lights or lighting equipment 27
Source: RNZFB 2006
The annual cost to the individual and society of these aids was calculated to be $5.3 million for
the RNZFB population in 2004 and $43.6 million for the whole seeing disabled population as
defined and recorded by the 2001 disability survey (Statistics New Zealand 2002). Applying
inflation derived from the consumer price index (Statistics New Zealand 2009) and population
growth estimates brings the estimated 2009 expenditure on aids to between $6.6 and $54
million. It is likely that the true expenditure on aids and equipment is somewhere between
these because people with mild vision loss are less likely to use aids and equipment, so we
have applied the average — $30.3 million.
5.5 Welfare payments
People with low vision or blindness are eligible for various types of welfare payments (Table
5.11).
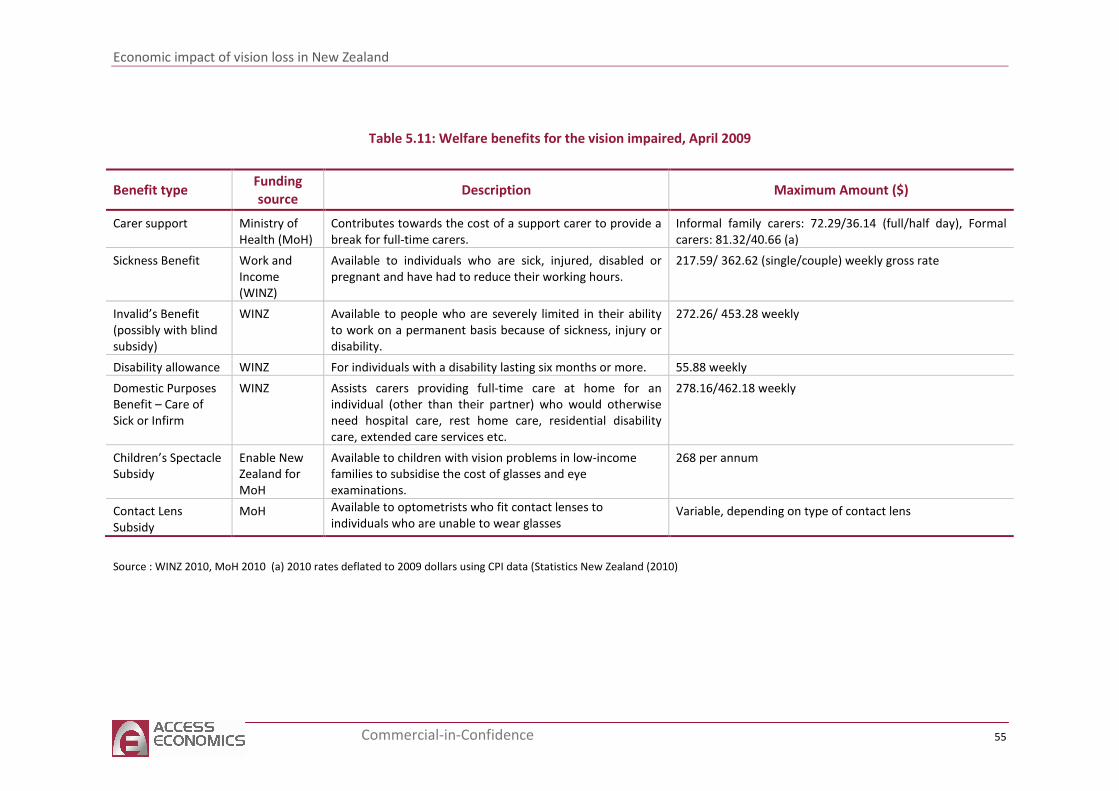
Economic impact of vision loss in New Zealand
55 Commercial-in-Confidence
Table 5.11: Welfare benefits for the vision impaired, April 2009
Source : WINZ 2010, MoH 2010 (a) 2010 rates deflated to 2009 dollars using CPI data (Statistics New Zealand (2010)
Benefit type Funding
source Description Maximum Amount ($)
Carer support Ministry of
Health (MoH)
Contributes towards the cost of a support carer to provide a
break for full-time carers.
Informal family carers: 72.29/36.14 (full/half day), Formal
carers: 81.32/40.66 (a)
Sickness Benefit Work and
Income
(WINZ)
Available to individuals who are sick, injured, disabled or
pregnant and have had to reduce their working hours.
217.59/ 362.62 (single/couple) weekly gross rate
Invalid’s Benefit
(possibly with blind
subsidy)
WINZ Available to people who are severely limited in their ability
to work on a permanent basis because of sickness, injury or
disability.
272.26/ 453.28 weekly
Disability allowance WINZ For individuals with a disability lasting six months or more. 55.88 weekly
Domestic Purposes
Benefit – Care of
Sick or Infirm
WINZ Assists carers providing full-time care at home for an
individual (other than their partner) who would otherwise
need hospital care, rest home care, residential disability
care, extended care services etc.
278.16/462.18 weekly
Children’s Spectacle
Subsidy
Enable New
Zealand for
MoH
Available to children with vision problems in low-income
families to subsidise the cost of glasses and eye
examinations.
268 per annum
Contact Lens
Subsidy
MoH Available to optometrists who fit contact lenses to
individuals who are unable to wear glasses Variable, depending on type of contact lens
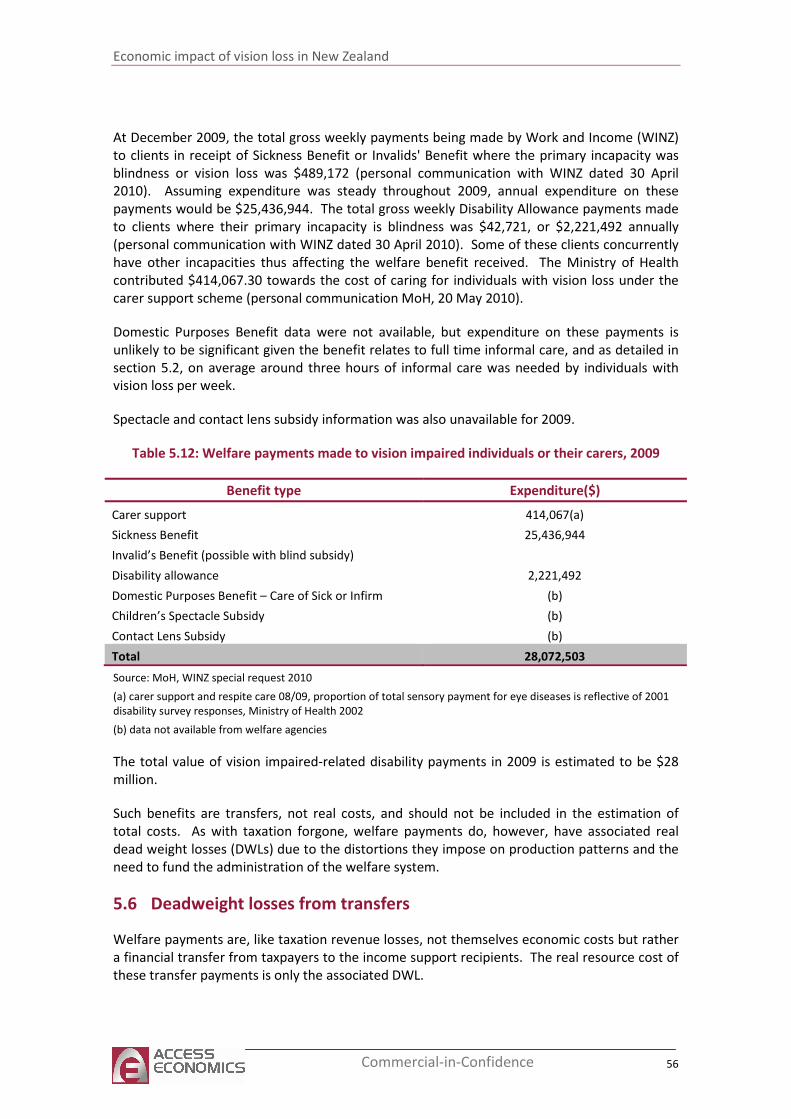
Economic impact of vision loss in New Zealand
56 Commercial-in-Confidence
At December 2009, the total gross weekly payments being made by Work and Income (WINZ)
to clients in receipt of Sickness Benefit or Invalids' Benefit where the primary incapacity was
blindness or vision loss was $489,172 (personal communication with WINZ dated 30 April
2010). Assuming expenditure was steady throughout 2009, annual expenditure on these
payments would be $25,436,944. The total gross weekly Disability Allowance payments made
to clients where their primary incapacity is blindness was $42,721, or $2,221,492 annually
(personal communication with WINZ dated 30 April 2010). Some of these clients concurrently
have other incapacities thus affecting the welfare benefit received. The Ministry of Health
contributed $414,067.30 towards the cost of caring for individuals with vision loss under the
carer support scheme (personal communication MoH, 20 May 2010).
Domestic Purposes Benefit data were not available, but expenditure on these payments is
unlikely to be significant given the benefit relates to full time informal care, and as detailed in
section 5.2, on average around three hours of informal care was needed by individuals with
vision loss per week.
Spectacle and contact lens subsidy information was also unavailable for 2009.
Table 5.12: Welfare payments made to vision impaired individuals or their carers, 2009
Benefit type Expenditure($)
Carer support 414,067(a)
Sickness Benefit 25,436,944
Invalid’s Benefit (possible with blind subsidy)
Disability allowance 2,221,492
Domestic Purposes Benefit – Care of Sick or Infirm (b)
Children’s Spectacle Subsidy (b)
Contact Lens Subsidy (b)
Total 28,072,503
Source: MoH, WINZ special request 2010
(a) carer support and respite care 08/09, proportion of total sensory payment for eye diseases is reflective of 2001
disability survey responses, Ministry of Health 2002
(b) data not available from welfare agencies
The total value of vision impaired-related disability payments in 2009 is estimated to be $28
million.
Such benefits are transfers, not real costs, and should not be included in the estimation of
total costs. As with taxation forgone, welfare payments do, however, have associated real
dead weight losses (DWLs) due to the distortions they impose on production patterns and the
need to fund the administration of the welfare system.
5.6 Deadweight losses from transfers
Welfare payments are, like taxation revenue losses, not themselves economic costs but rather
a financial transfer from taxpayers to the income support recipients. The real resource cost of
these transfer payments is only the associated DWL.
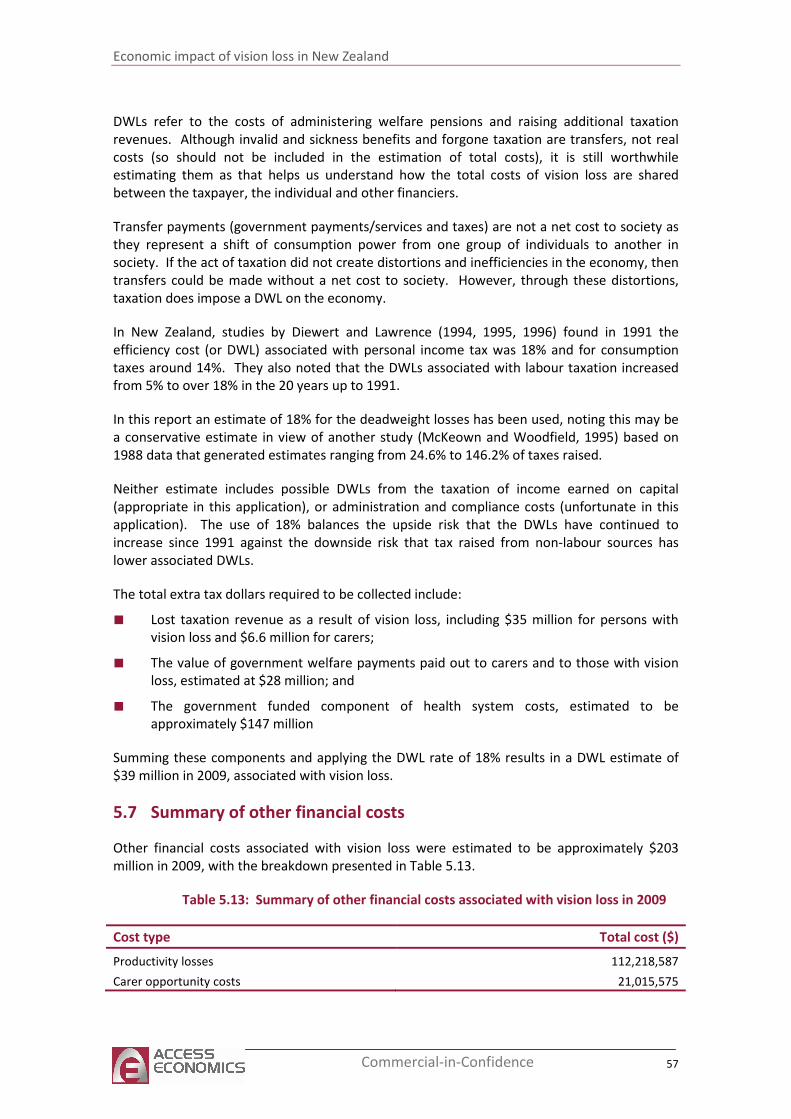
Economic impact of vision loss in New Zealand
57 Commercial-in-Confidence
DWLs refer to the costs of administering welfare pensions and raising additional taxation
revenues. Although invalid and sickness benefits and forgone taxation are transfers, not real
costs (so should not be included in the estimation of total costs), it is still worthwhile
estimating them as that helps us understand how the total costs of vision loss are shared
between the taxpayer, the individual and other financiers.
Transfer payments (government payments/services and taxes) are not a net cost to society as
they represent a shift of consumption power from one group of individuals to another in
society. If the act of taxation did not create distortions and inefficiencies in the economy, then
transfers could be made without a net cost to society. However, through these distortions,
taxation does impose a DWL on the economy.
In New Zealand, studies by Diewert and Lawrence (1994, 1995, 1996) found in 1991 the
efficiency cost (or DWL) associated with personal income tax was 18% and for consumption
taxes around 14%. They also noted that the DWLs associated with labour taxation increased
from 5% to over 18% in the 20 years up to 1991.
In this report an estimate of 18% for the deadweight losses has been used, noting this may be
a conservative estimate in view of another study (McKeown and Woodfield, 1995) based on
1988 data that generated estimates ranging from 24.6% to 146.2% of taxes raised.
Neither estimate includes possible DWLs from the taxation of income earned on capital
(appropriate in this application), or administration and compliance costs (unfortunate in this
application). The use of 18% balances the upside risk that the DWLs have continued to
increase since 1991 against the downside risk that tax raised from non-labour sources has
lower associated DWLs.
The total extra tax dollars required to be collected include:
■ Lost taxation revenue as a result of vision loss, including $35 million for persons with
vision loss and $6.6 million for carers;
■ The value of government welfare payments paid out to carers and to those with vision
loss, estimated at $28 million; and
■ The government funded component of health system costs, estimated to be
approximately $147 million
Summing these components and applying the DWL rate of 18% results in a DWL estimate of
$39 million in 2009, associated with vision loss.
5.7 Summary of other financial costs
Other financial costs associated with vision loss were estimated to be approximately $203
million in 2009, with the breakdown presented in Table 5.13.
Table 5.13: Summary of other financial costs associated with vision loss in 2009
Cost type Total cost ($)
Productivity losses 112,218,587
Carer opportunity costs 21,015,575
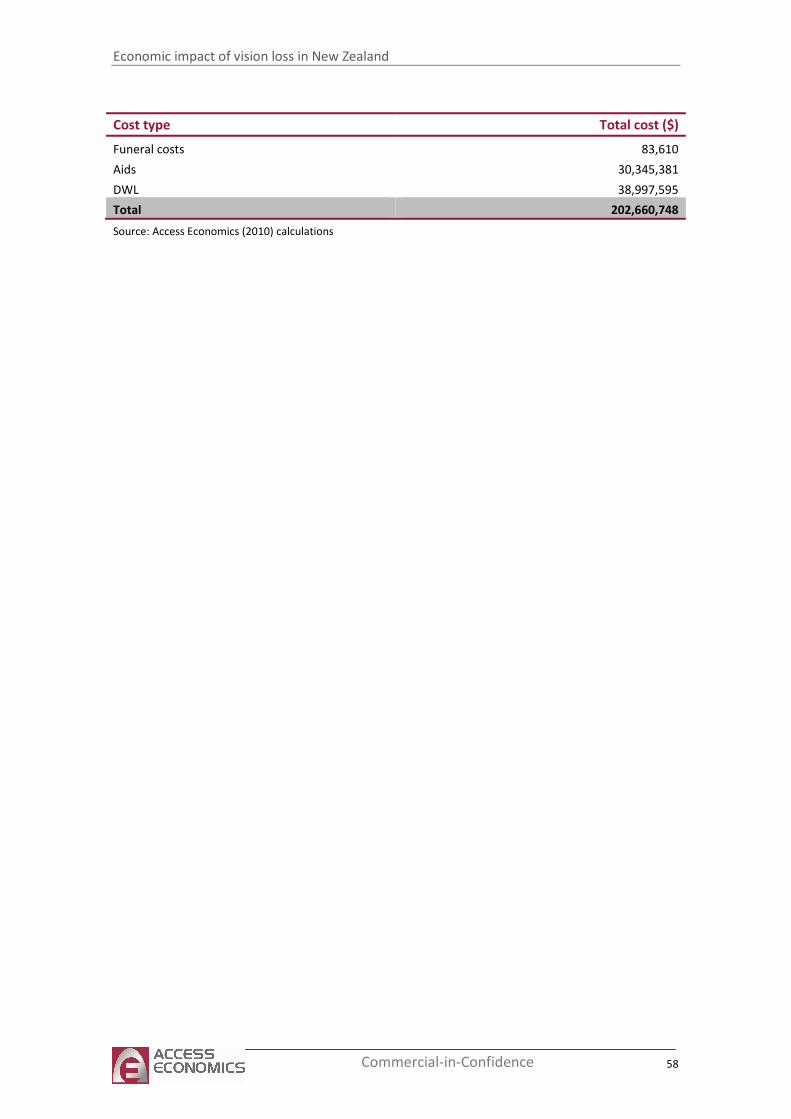
Economic impact of vision loss in New Zealand
58 Commercial-in-Confidence
Cost type Total cost ($)
Funeral costs 83,610
Aids 30,345,381
DWL 38,997,595
Total 202,660,748
Source: Access Economics (2010) calculations
Economic impact of vision loss in New Zealand
59 Commercial-in-Confidence
6 Loss of wellbeing
Loss of wellbeing refers to qualitative and quantitative analysis of the intangible costs of pain
and suffering from a particular condition. These costs of disability, loss of wellbeing and
premature death from vision loss are more difficult to measure. Note – the term ‘loss of well
being’ is used throughout this report instead of the well-defined concept in health economics,
‘burden of disease’ as measured by disability adjusted life years (DALYs). It measures the
suffering and premature death from a disease or injury and does not imply that people
experiencing disease or injury are a burden on society.
This section estimates the loss of wellbeing in 2009 resulting from vision disorders for persons
aged 40 or over. An imputed value of a statistical life year (VSLY) allows us to compare non-
financial costs such as loss of wellbeing with the estimated financial costs of vision loss.
6.1 Methodology
In the last decade, a non-financial approach to valuing human life has been derived, where loss
of wellbeing and premature mortality, are measured in terms of Disability Adjusted Life Years
(DALYs). This approach was developed by the WHO, the World Bank and Harvard University
for a study that provided a comprehensive assessment of mortality and disability from
diseases, injuries and risk factors in 1990, projected to 2020 (Murray and Lopez, 1996).
Methods and data sources are detailed further in Murray et al (2001) and the WHO continues
to revisit the estimates for later years.
A DALY of 0 represents a year of perfect health, while a DALY of 1 represents death. Other
health states are attributed values between 0 and 1 as assessed by experts on the basis of
literature and other evidence of the quality of life in relative health states. For example, the
disability weight of 0.18 for a broken wrist can be interpreted as losing 18% of a person’s
quality of life relative to perfect health, because of the inflicted injury. Total DALYs lost from a
condition are the sum of the mortality and morbidity components – the Year(s) of Life Lost due
to premature death (YLLs) and the Year(s) of healthy life Lost due to Disability (YLDs).
Martin Tobias and the New Zealand Burden of Disease Study (NZBDS) team
utilised the global and Australian studies to estimate the burden of disease for
New Zealand (Ministry of Health, 2001). Estimates of YLL, YLD and DALYs for over
100 conditions in nine age groups for both genders and two major ethnic groups
(Māori and non-Māori) were provided for the year 1996.
The DALY approach has been successful in avoiding the subjectivity of individual valuation and
is capable of overcoming the problem of comparability between individuals and between
nations, although some nations have subsequently adopted variations in weighting systems,
for example age-weighting for older people. This report treats the value of a life year as equal
throughout the lifespan.
As these approaches are not financial, they are not directly comparable with most other cost
and benefit measures. In public policy making, it is often desirable to apply a monetary
conversion to ascertain the cost of an injury, disease or fatality or the value of a preventive
Economic impact of vision loss in New Zealand
60 Commercial-in-Confidence
health intervention, for example, in cost benefit analysis. Such financial conversions tend to
utilise ‘willingness to pay’ or risk-based labour market studies as described in the next section.
6.1.1 Willingness to pay and the value of a statistical life year
The burden of disease as measured in DALYs can be converted into a dollar figure using an
estimate of the Value of a ‘Statistical’ Life (VSL). As the name suggests, the VSL is an estimate
of the value society places on an anonymous life. Since Schelling’s (1968) discussion of the
economics of life saving, the economic literature has focused on willingness to pay (WTP) – or,
conversely, willingness to accept – measures of mortality and morbidity, in order to develop
estimates of the VSL.
Estimates may be derived from observing people’s choices in situations where they rank or
trade off various states of wellbeing (loss or gain) either against each other or for dollar
amounts e.g. stated choice models of people’s WTP for interventions that enhance health or
willingness to accept poorer health outcomes or the risk of such states. Alternatively, risk
studies use evidence of market trade-offs between risk and money, including numerous labour
market and other studies (such as installing smoke detectors, wearing seatbelts or bike
helmets and so on).
The extensive literature in this field mostly uses econometric analysis to value mortality risk
and the ‘hedonic wage’ by estimating compensating differentials for on-the-job risk exposure
in labour markets; in other words, determining what dollar amount would be accepted by an
individual to induce him/her to increase the probability of death or morbidity by a particular
percentage. Viscusi and Aldy (2002), in a summary of mortality studies, found the VSL ranged
between US$4 million and US$9 million with a median of US$7 million (in year 2000
US dollars), similar but marginally higher than the VSL derived from studies of US product and
housing markets. They also reviewed a parallel literature on the implicit value of the risk of
non-fatal injuries.
Weaknesses in the WTP approach, as with human capital approaches to valuing life and
wellbeing, are that there can be substantial variation between individuals. Extraneous
influences in labour markets such as imperfect information, income/wealth or power
asymmetries can cause difficulty in correctly perceiving the risk or in negotiating an acceptably
higher wage in wage-risk trade off studies, for example.
As DALYs are enumerated in years of life rather than in whole lives it is necessary to calculate
the Value of a ‘Statistical’ Life Year (VSLY) based on the VSL. This is done using the formula:16
VSLY = VSL / Σi=0,…,n-1(1+r)i
Where: n = years of remaining life, and
r = discount rate
Clearly there is a need to know n (the years of remaining life), and to determine an appropriate
value for r (the discount rate). There is a substantial body of literature, which often provides
16
The formula is derived from the definition:
VSL = ΣVSLYi/(1+r)^i where i=0,1,2….n
where VSLY is assumed to be constant (ie. no variation with age).
Economic impact of vision loss in New Zealand
61 Commercial-in-Confidence
conflicting advice, on the appropriate mechanism by which costs should be discounted over
time, properly taking into account risks, inflation, positive time preference and expected
productivity gains.
Access Economics (2008) recommended an average VSL of $6.0 million in 2006 Australian
dollars ($A3.7 million to $A8.1 million). This equates to an average VSLY in 2006 of $A252,014
($A155,409 to $A340,219), using a discount rate of 3% over an estimated 40 years remaining
life expectancy. However, from this gross value, Access Economics deducts all costs borne by
the individual, reflecting the source study VSL estimates, to avoid double counting. This
provides a different net VSLY for different conditions (and for different age-gender groups).
Since Access Economics (2008) was published, the Australian Department of Finance and
Deregulation (2009) have also provided an estimate of the VSLY, which appears to represent a
fixed estimate of the net VSLY. This estimate was $A151,000 in 2006, which inflates to
$A161,751 in 2009 or $NZ201,864 (using a purchasing power parity of 1.25 from OECD (2010))
which is used for calculations in modelling here. A webs search for VSLY estimates for NZ was
conducted and the NZ Treasury was contacted. There does not appear to be an ‘official’ VSLY
for New Zealand.
6.1.2 Discount rate
In reviewing the literature, Access Economics (2008) found the most common rate used to
discount healthy life was 3% and this had a strong rationale.
Choosing an appropriate discount rate is a subject of some debate, as it varies depending on
what type of future income or cost stream is being considered. The discount rate needs to
appropriately take into account risks, inflation and positive time preference. The minimum
option that one can adopt in discounting future expected healthy life streams and other costs
is to set future values on the basis of a risk free assessment about the future i.e. assume the
future flows are similar to the certain flows attaching to a long term Government bond. In
2009, the ten year nominal bond rate averaged 5.5% per annum (Reserve Bank of New
Zealand, Statistics17).
If there were no positive time preference, people would be indifferent between having
something now or a long way off in the future, which applies to all goods and services.
The Reserve Bank of New Zealand has a clear mandate to pursue a monetary policy that
delivers 1% to 3% inflation over the course of the economic cycle18. This is a realistic longer
run goal and an inflation rate in this range (2.5%) is used in arriving at the discount rate for
healthy life below. It is important to allow for inflation in order to derive a real rather than
nominal rate.
17
http://www.rbnz.govt.nz/statistics/exandint/b2/data.html?sheet=1 accessed 31 May 2010
18 ibid
Economic impact of vision loss in New Zealand
62 Commercial-in-Confidence
In discounting healthy life and other costs, a real discount rate for New Zealand
of 3% is thus suggested (calculated as 5.5% - 2.5% = 3%).
6.2 Loss of wellbeing from vision disorders in 2009
Disease weights used to calculate YLDs in this report are drawn from Begg et al, (2007). This
study estimated the YLDs and prevalence of the following vision disorders in 2003:
■ glaucoma-related blindness;
■ cataract-related blindness;
■ macular degeneration; and
■ Uncorrected refractive errors.
Additionally, the Australian Institute of Health and Welfare also provided estimates of YLDs
and prevalence in 2003 for diabetes mellitus, with a YLD breakdown for DR. As such, the
burden of disease from DR is also estimated in this report.
Begg et al (2007) did not provide estimates of YLLs, basing their work on an assumption that
no-one dies prematurely from vision disorders. Due to this, YLLs were derived from the
estimates of premature death attributable to vision loss, calculated in Section Table 5.4 of this
report.
Begg et al (2007) also provided a specific age breakdown for YLDs and prevalence, and thus
DALYs could be estimated specifically for the 40 and over age group.
6.2.1 Disability weights and YLDs in 2009
One of the main costs of vision loss is the loss of wellbeing and quality of life that it entails.
This can be estimated by initially allocating disability weights to vision disorders that cause
vision loss. The Burden of Disease and Injury in New Zealand (2001) report used Dutch
(Stouthard et al 1997) disability weights for disorders of vision. For the purpose of this report,
disability weights were derived by dividing estimated DALYs in 2003 by estimated prevalence
(cases) in 2003 for each vision disorder, both of which were taken from Begg et al (2007)
(which also used the Stouthard et a 1997 weights).
Begg et al (2007) provided an estimate of YLDs resulting from DR in 2003, at approximately
1,060 YLDs for all persons aged over 40 in Australia. Centre for Eye Research Australia (CERA)
and Access Economics (2004) estimated that 2.9% of persons with DM had vision-threatening
DR. To estimate prevalence of DR in 2003, the Australian Institute of Health and Welfare
estimated prevalence of DM in Australia in 2003 was multiplied by this fraction of 2.9%.
Estimated disability weights of vision disorders in 2003 are presented in Table 6.1 by age
group. The disability weights reflect adjustments for comorbidities — and the likelihood of
having comorbidities increases with age. A multiplicative model is used to adjust for
comorbidities to ensure that the disability weights do not sum to more than one. For further
information see Begg et al, (2007).
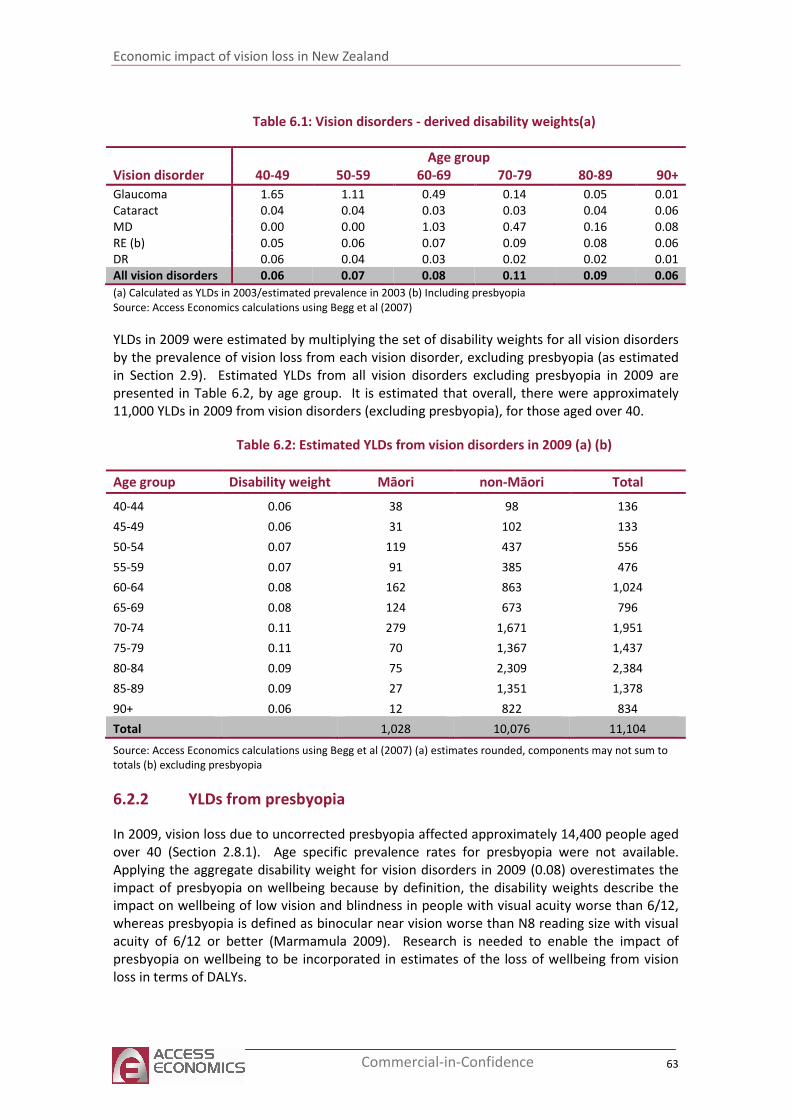
Economic impact of vision loss in New Zealand
63 Commercial-in-Confidence
Table 6.1: Vision disorders - derived disability weights(a)
Age group
Vision disorder 40-49 50-59 60-69 70-79 80-89 90+
Glaucoma 1.65 1.11 0.49 0.14 0.05 0.01
Cataract 0.04 0.04 0.03 0.03 0.04 0.06
MD 0.00 0.00 1.03 0.47 0.16 0.08
RE (b) 0.05 0.06 0.07 0.09 0.08 0.06
DR 0.06 0.04 0.03 0.02 0.02 0.01
All vision disorders 0.06 0.07 0.08 0.11 0.09 0.06
(a) Calculated as YLDs in 2003/estimated prevalence in 2003 (b) Including presbyopia
Source: Access Economics calculations using Begg et al (2007)
YLDs in 2009 were estimated by multiplying the set of disability weights for all vision disorders
by the prevalence of vision loss from each vision disorder, excluding presbyopia (as estimated
in Section 2.9). Estimated YLDs from all vision disorders excluding presbyopia in 2009 are
presented in Table 6.2, by age group. It is estimated that overall, there were approximately
11,000 YLDs in 2009 from vision disorders (excluding presbyopia), for those aged over 40.
Table 6.2: Estimated YLDs from vision disorders in 2009 (a) (b)
Age group Disability weight Māori non-Māori Total
40-44 0.06 38 98 136
45-49 0.06 31 102 133
50-54 0.07 119 437 556
55-59 0.07 91 385 476
60-64 0.08 162 863 1,024
65-69 0.08 124 673 796
70-74 0.11 279 1,671 1,951
75-79 0.11 70 1,367 1,437
80-84 0.09 75 2,309 2,384
85-89 0.09 27 1,351 1,378
90+ 0.06 12 822 834
Total 1,028 10,076 11,104
Source: Access Economics calculations using Begg et al (2007) (a) estimates rounded, components may not sum to
totals (b) excluding presbyopia
6.2.2 YLDs from presbyopia
In 2009, vision loss due to uncorrected presbyopia affected approximately 14,400 people aged
over 40 (Section 2.8.1). Age specific prevalence rates for presbyopia were not available.
Applying the aggregate disability weight for vision disorders in 2009 (0.08) overestimates the
impact of presbyopia on wellbeing because by definition, the disability weights describe the
impact on wellbeing of low vision and blindness in people with visual acuity worse than 6/12,
whereas presbyopia is defined as binocular near vision worse than N8 reading size with visual
acuity of 6/12 or better (Marmamula 2009). Research is needed to enable the impact of
presbyopia on wellbeing to be incorporated in estimates of the loss of wellbeing from vision
loss in terms of DALYs.
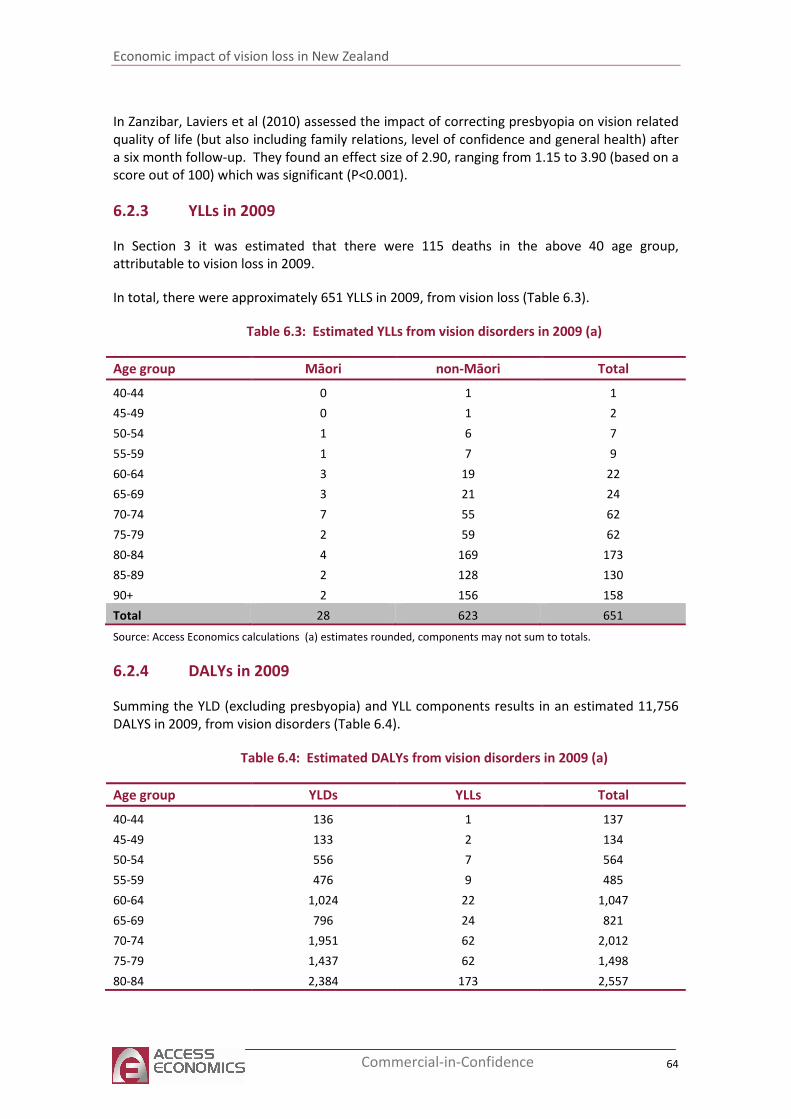
Economic impact of vision loss in New Zealand
64 Commercial-in-Confidence
In Zanzibar, Laviers et al (2010) assessed the impact of correcting presbyopia on vision related
quality of life (but also including family relations, level of confidence and general health) after
a six month follow-up. They found an effect size of 2.90, ranging from 1.15 to 3.90 (based on a
score out of 100) which was significant (P<0.001).
6.2.3 YLLs in 2009
In Section 3 it was estimated that there were 115 deaths in the above 40 age group,
attributable to vision loss in 2009.
In total, there were approximately 651 YLLS in 2009, from vision loss (Table 6.3).
Table 6.3: Estimated YLLs from vision disorders in 2009 (a)
Age group Māori non-Māori Total
40-44 0 1 1
45-49 0 1 2
50-54 1 6 7
55-59 1 7 9
60-64 3 19 22
65-69 3 21 24
70-74 7 55 62
75-79 2 59 62
80-84 4 169 173
85-89 2 128 130
90+ 2 156 158
Total 28 623 651
Source: Access Economics calculations (a) estimates rounded, components may not sum to totals.
6.2.4 DALYs in 2009
Summing the YLD (excluding presbyopia) and YLL components results in an estimated 11,756
DALYS in 2009, from vision disorders (Table 6.4).
Table 6.4: Estimated DALYs from vision disorders in 2009 (a)
Age group YLDs YLLs Total
40-44 136 1 137
45-49 133 2 134
50-54 556 7 564
55-59 476 9 485
60-64 1,024 22 1,047
65-69 796 24 821
70-74 1,951 62 2,012
75-79 1,437 62 1,498
80-84 2,384 173 2,557
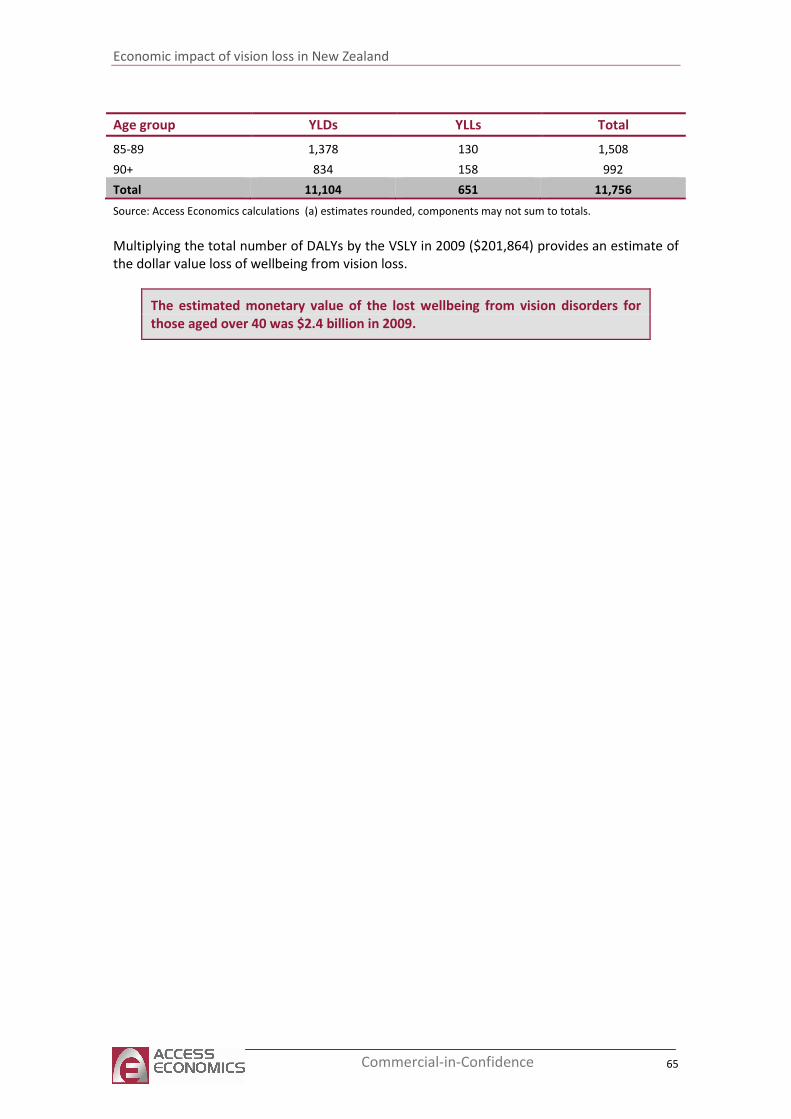
Economic impact of vision loss in New Zealand
65 Commercial-in-Confidence
Age group YLDs YLLs Total
85-89 1,378 130 1,508
90+ 834 158 992
Total 11,104 651 11,756
Source: Access Economics calculations (a) estimates rounded, components may not sum to totals.
Multiplying the total number of DALYs by the VSLY in 2009 ($201,864) provides an estimate of
the dollar value loss of wellbeing from vision loss.
The estimated monetary value of the lost wellbeing from vision disorders for
those aged over 40 was $2.4 billion in 2009.
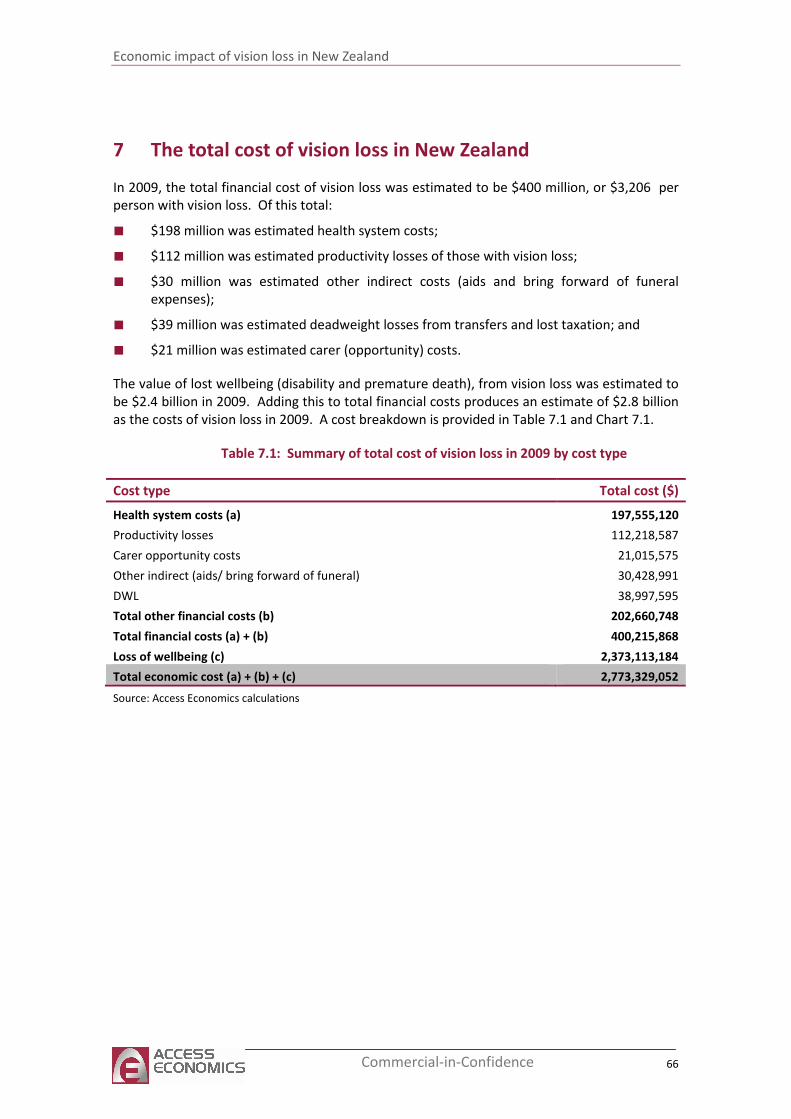
Economic impact of vision loss in New Zealand
66 Commercial-in-Confidence
7 The total cost of vision loss in New Zealand
In 2009, the total financial cost of vision loss was estimated to be $400 million, or $3,206 per
person with vision loss. Of this total:
■ $198 million was estimated health system costs;
■ $112 million was estimated productivity losses of those with vision loss;
■ $30 million was estimated other indirect costs (aids and bring forward of funeral
expenses);
■ $39 million was estimated deadweight losses from transfers and lost taxation; and
■ $21 million was estimated carer (opportunity) costs.
The value of lost wellbeing (disability and premature death), from vision loss was estimated to
be $2.4 billion in 2009. Adding this to total financial costs produces an estimate of $2.8 billion
as the costs of vision loss in 2009. A cost breakdown is provided in Table 7.1 and Chart 7.1.
Table 7.1: Summary of total cost of vision loss in 2009 by cost type
Cost type Total cost ($)
Health system costs (a) 197,555,120
Productivity losses 112,218,587
Carer opportunity costs 21,015,575
Other indirect (aids/ bring forward of funeral) 30,428,991
DWL 38,997,595
Total other financial costs (b) 202,660,748
Total financial costs (a) + (b) 400,215,868
Loss of wellbeing (c) 2,373,113,184
Total economic cost (a) + (b) + (c) 2,773,329,052
Source: Access Economics calculations
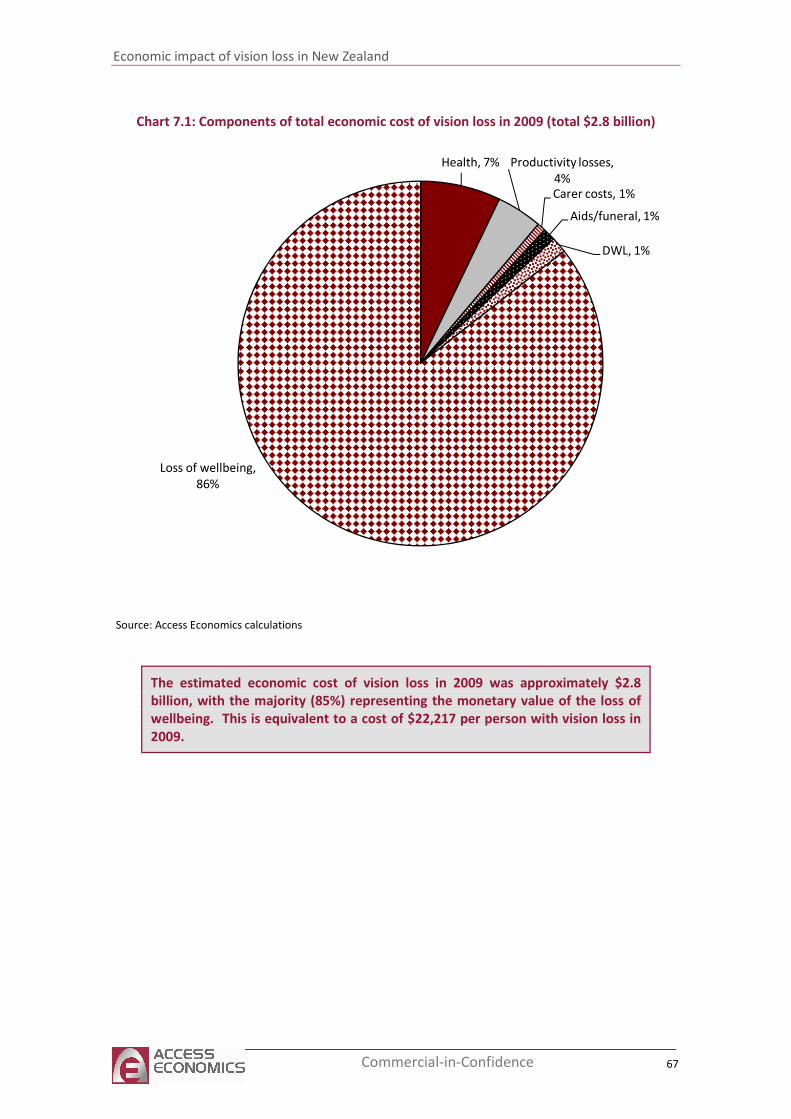
Economic impact of vision loss in New Zealand
67 Commercial-in-Confidence
Chart 7.1: Components of total economic cost of vision loss in 2009 (total $2.8 billion)
Health, 7% Productivity losses,
4%Carer costs, 1%
Aids/funeral, 1%
DWL, 1%
Loss of wellbeing,
86%
Source: Access Economics calculations
The estimated economic cost of vision loss in 2009 was approximately $2.8
billion, with the majority (85%) representing the monetary value of the loss of
wellbeing. This is equivalent to a cost of $22,217 per person with vision loss in
2009.
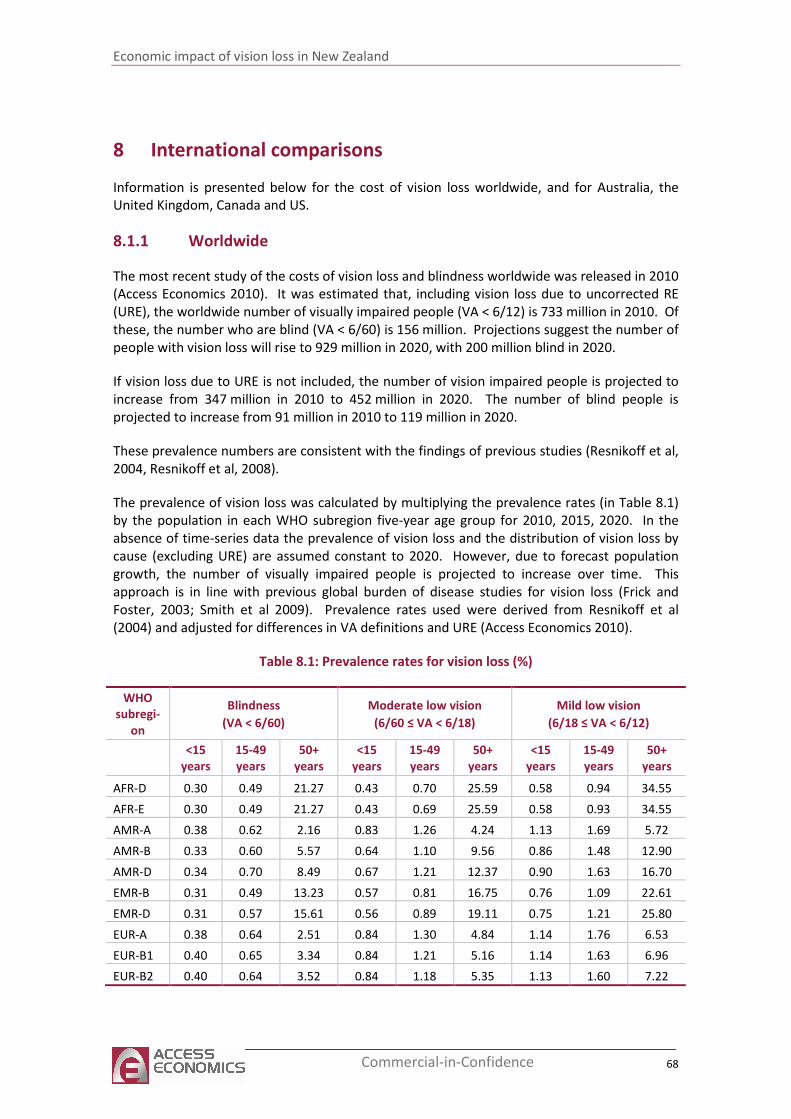
Economic impact of vision loss in New Zealand
68 Commercial-in-Confidence
8 International comparisons
Information is presented below for the cost of vision loss worldwide, and for Australia, the
United Kingdom, Canada and US.
8.1.1 Worldwide
The most recent study of the costs of vision loss and blindness worldwide was released in 2010
(Access Economics 2010). It was estimated that, including vision loss due to uncorrected RE
(URE), the worldwide number of visually impaired people (VA < 6/12) is 733 million in 2010. Of
these, the number who are blind (VA < 6/60) is 156 million. Projections suggest the number of
people with vision loss will rise to 929 million in 2020, with 200 million blind in 2020.
If vision loss due to URE is not included, the number of vision impaired people is projected to
increase from 347 million in 2010 to 452 million in 2020. The number of blind people is
projected to increase from 91 million in 2010 to 119 million in 2020.
These prevalence numbers are consistent with the findings of previous studies (Resnikoff et al,
2004, Resnikoff et al, 2008).
The prevalence of vision loss was calculated by multiplying the prevalence rates (in Table 8.1)
by the population in each WHO subregion five-year age group for 2010, 2015, 2020. In the
absence of time-series data the prevalence of vision loss and the distribution of vision loss by
cause (excluding URE) are assumed constant to 2020. However, due to forecast population
growth, the number of visually impaired people is projected to increase over time. This
approach is in line with previous global burden of disease studies for vision loss (Frick and
Foster, 2003; Smith et al 2009). Prevalence rates used were derived from Resnikoff et al
(2004) and adjusted for differences in VA definitions and URE (Access Economics 2010).
Table 8.1: Prevalence rates for vision loss (%)
WHO
subregi-
on
Blindness
(VA < 6/60)
Moderate low vision
(6/60 ≤ VA < 6/18)
Mild low vision
(6/18 ≤ VA < 6/12)
<15
years
15-49
years
50+
years
<15
years
15-49
years
50+
years
<15
years
15-49
years
50+
years
AFR-D 0.30 0.49 21.27 0.43 0.70 25.59 0.58 0.94 34.55
AFR-E 0.30 0.49 21.27 0.43 0.69 25.59 0.58 0.93 34.55
AMR-A 0.38 0.62 2.16 0.83 1.26 4.24 1.13 1.69 5.72
AMR-B 0.33 0.60 5.57 0.64 1.10 9.56 0.86 1.48 12.90
AMR-D 0.34 0.70 8.49 0.67 1.21 12.37 0.90 1.63 16.70
EMR-B 0.31 0.49 13.23 0.57 0.81 16.75 0.76 1.09 22.61
EMR-D 0.31 0.57 15.61 0.56 0.89 19.11 0.75 1.21 25.80
EUR-A 0.38 0.64 2.51 0.84 1.30 4.84 1.14 1.76 6.53
EUR-B1 0.40 0.65 3.34 0.84 1.21 5.16 1.14 1.63 6.96
EUR-B2 0.40 0.64 3.52 0.84 1.18 5.35 1.13 1.60 7.22
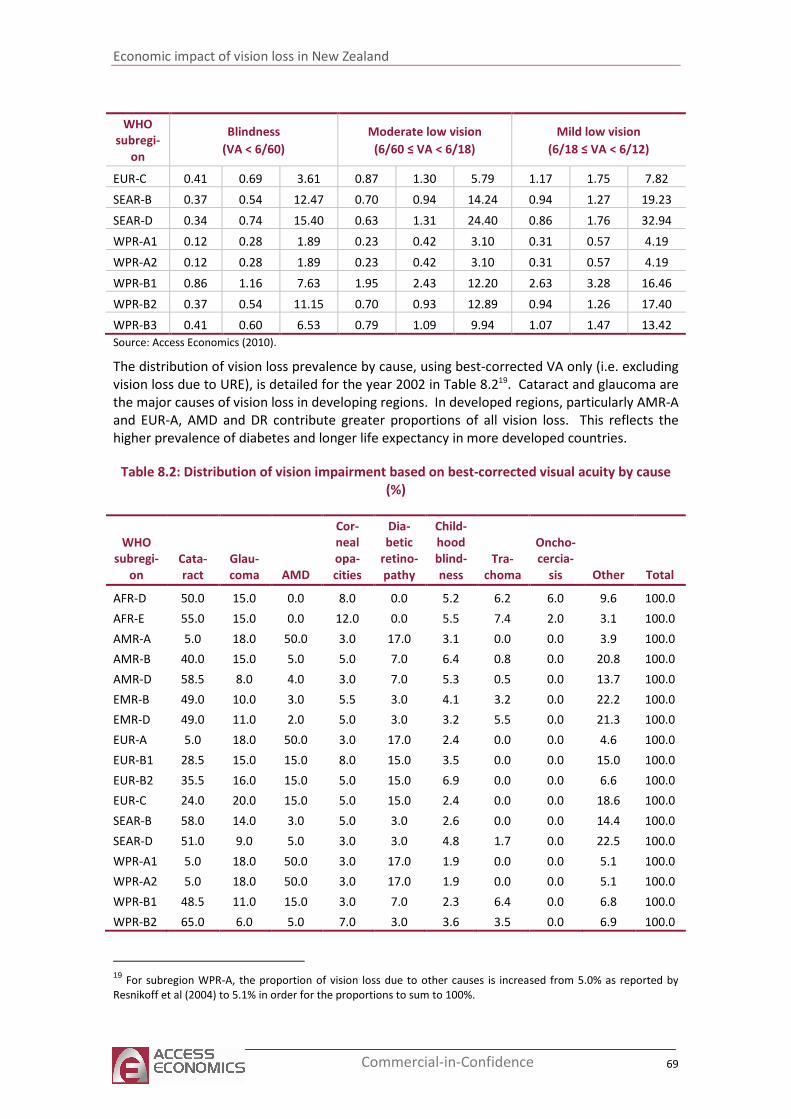
Economic impact of vision loss in New Zealand
69 Commercial-in-Confidence
WHO
subregi-
on
Blindness
(VA < 6/60)
Moderate low vision
(6/60 ≤ VA < 6/18)
Mild low vision
(6/18 ≤ VA < 6/12)
EUR-C 0.41 0.69 3.61 0.87 1.30 5.79 1.17 1.75 7.82
SEAR-B 0.37 0.54 12.47 0.70 0.94 14.24 0.94 1.27 19.23
SEAR-D 0.34 0.74 15.40 0.63 1.31 24.40 0.86 1.76 32.94
WPR-A1 0.12 0.28 1.89 0.23 0.42 3.10 0.31 0.57 4.19
WPR-A2 0.12 0.28 1.89 0.23 0.42 3.10 0.31 0.57 4.19
WPR-B1 0.86 1.16 7.63 1.95 2.43 12.20 2.63 3.28 16.46
WPR-B2 0.37 0.54 11.15 0.70 0.93 12.89 0.94 1.26 17.40
WPR-B3 0.41 0.60 6.53 0.79 1.09 9.94 1.07 1.47 13.42
Source: Access Economics (2010).
The distribution of vision loss prevalence by cause, using best-corrected VA only (i.e. excluding
vision loss due to URE), is detailed for the year 2002 in Table 8.219. Cataract and glaucoma are
the major causes of vision loss in developing regions. In developed regions, particularly AMR-A
and EUR-A, AMD and DR contribute greater proportions of all vision loss. This reflects the
higher prevalence of diabetes and longer life expectancy in more developed countries.
Table 8.2: Distribution of vision impairment based on best-corrected visual acuity by cause
(%)
WHO
subregi-
on
Cata-
ract
Glau-
coma AMD
Cor-
neal
opa-
cities
Dia-
betic
retino-
pathy
Child-
hood
blind-
ness
Tra-
choma
Oncho-
cercia-
sis Other Total
AFR-D 50.0 15.0 0.0 8.0 0.0 5.2 6.2 6.0 9.6 100.0
AFR-E 55.0 15.0 0.0 12.0 0.0 5.5 7.4 2.0 3.1 100.0
AMR-A 5.0 18.0 50.0 3.0 17.0 3.1 0.0 0.0 3.9 100.0
AMR-B 40.0 15.0 5.0 5.0 7.0 6.4 0.8 0.0 20.8 100.0
AMR-D 58.5 8.0 4.0 3.0 7.0 5.3 0.5 0.0 13.7 100.0
EMR-B 49.0 10.0 3.0 5.5 3.0 4.1 3.2 0.0 22.2 100.0
EMR-D 49.0 11.0 2.0 5.0 3.0 3.2 5.5 0.0 21.3 100.0
EUR-A 5.0 18.0 50.0 3.0 17.0 2.4 0.0 0.0 4.6 100.0
EUR-B1 28.5 15.0 15.0 8.0 15.0 3.5 0.0 0.0 15.0 100.0
EUR-B2 35.5 16.0 15.0 5.0 15.0 6.9 0.0 0.0 6.6 100.0
EUR-C 24.0 20.0 15.0 5.0 15.0 2.4 0.0 0.0 18.6 100.0
SEAR-B 58.0 14.0 3.0 5.0 3.0 2.6 0.0 0.0 14.4 100.0
SEAR-D 51.0 9.0 5.0 3.0 3.0 4.8 1.7 0.0 22.5 100.0
WPR-A1 5.0 18.0 50.0 3.0 17.0 1.9 0.0 0.0 5.1 100.0
WPR-A2 5.0 18.0 50.0 3.0 17.0 1.9 0.0 0.0 5.1 100.0
WPR-B1 48.5 11.0 15.0 3.0 7.0 2.3 6.4 0.0 6.8 100.0
WPR-B2 65.0 6.0 5.0 7.0 3.0 3.6 3.5 0.0 6.9 100.0
19
For subregion WPR-A, the proportion of vision loss due to other causes is increased from 5.0% as reported by
Resnikoff et al (2004) to 5.1% in order for the proportions to sum to 100%.
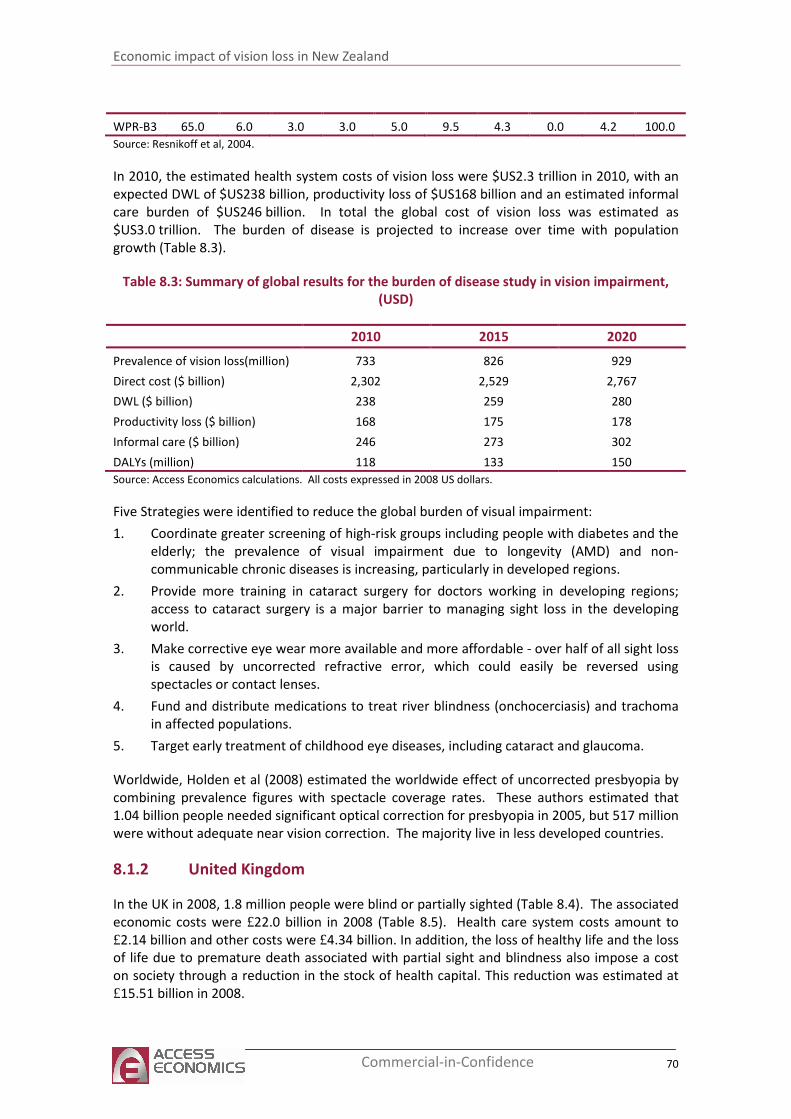
Economic impact of vision loss in New Zealand
70 Commercial-in-Confidence
WPR-B3 65.0 6.0 3.0 3.0 5.0 9.5 4.3 0.0 4.2 100.0
Source: Resnikoff et al, 2004.
In 2010, the estimated health system costs of vision loss were $US2.3 trillion in 2010, with an
expected DWL of $US238 billion, productivity loss of $US168 billion and an estimated informal
care burden of $US246 billion. In total the global cost of vision loss was estimated as
$US3.0 trillion. The burden of disease is projected to increase over time with population
growth (Table 8.3).
Table 8.3: Summary of global results for the burden of disease study in vision impairment,
(USD)
2010 2015 2020
Prevalence of vision loss(million) 733 826 929
Direct cost ($ billion) 2,302 2,529 2,767
DWL ($ billion) 238 259 280
Productivity loss ($ billion) 168 175 178
Informal care ($ billion) 246 273 302
DALYs (million) 118 133 150
Source: Access Economics calculations. All costs expressed in 2008 US dollars.
Five Strategies were identified to reduce the global burden of visual impairment:
1. Coordinate greater screening of high-risk groups including people with diabetes and the
elderly; the prevalence of visual impairment due to longevity (AMD) and non-
communicable chronic diseases is increasing, particularly in developed regions.
2. Provide more training in cataract surgery for doctors working in developing regions;
access to cataract surgery is a major barrier to managing sight loss in the developing
world.
3. Make corrective eye wear more available and more affordable - over half of all sight loss
is caused by uncorrected refractive error, which could easily be reversed using
spectacles or contact lenses.
4. Fund and distribute medications to treat river blindness (onchocerciasis) and trachoma
in affected populations.
5. Target early treatment of childhood eye diseases, including cataract and glaucoma.
Worldwide, Holden et al (2008) estimated the worldwide effect of uncorrected presbyopia by
combining prevalence figures with spectacle coverage rates. These authors estimated that
1.04 billion people needed significant optical correction for presbyopia in 2005, but 517 million
were without adequate near vision correction. The majority live in less developed countries.
8.1.2 United Kingdom
In the UK in 2008, 1.8 million people were blind or partially sighted (Table 8.4). The associated
economic costs were £22.0 billion in 2008 (Table 8.5). Health care system costs amount to
£2.14 billion and other costs were £4.34 billion. In addition, the loss of healthy life and the loss
of life due to premature death associated with partial sight and blindness also impose a cost
on society through a reduction in the stock of health capital. This reduction was estimated at
£15.51 billion in 2008.
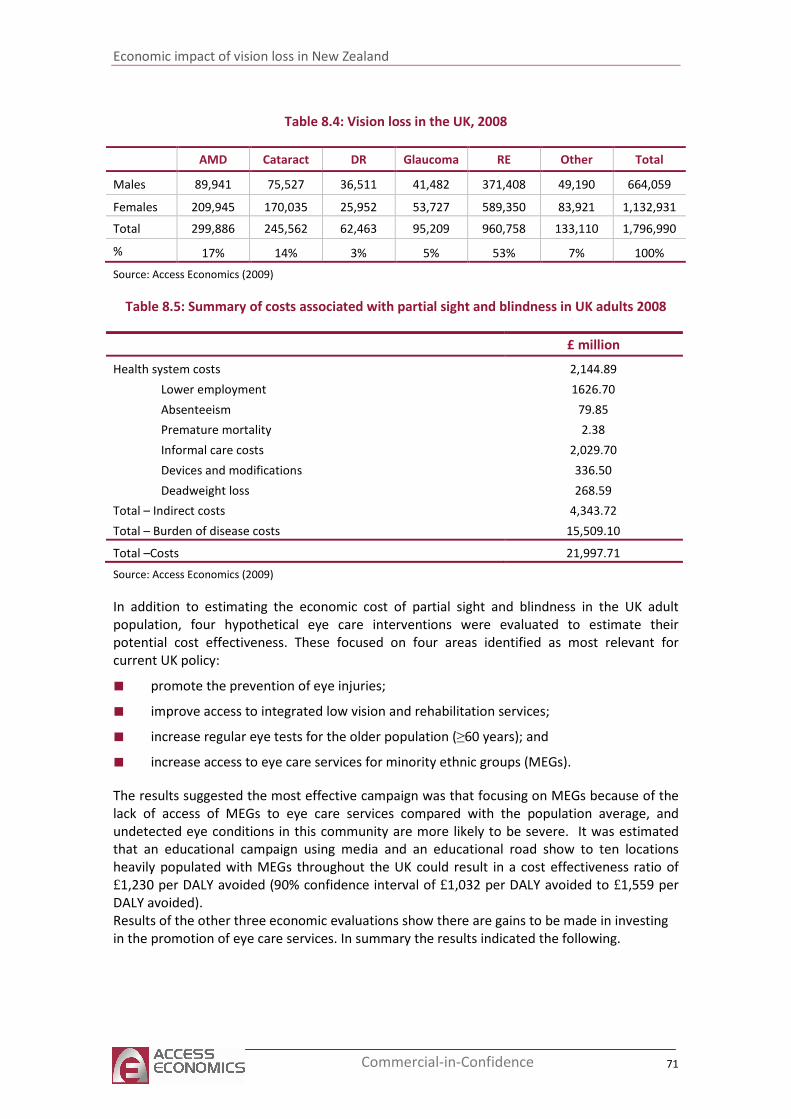
Economic impact of vision loss in New Zealand
71 Commercial-in-Confidence
Table 8.4: Vision loss in the UK, 2008
AMD Cataract DR Glaucoma RE Other Total
Males 89,941 75,527 36,511 41,482 371,408 49,190 664,059
Females 209,945 170,035 25,952 53,727 589,350 83,921 1,132,931
Total 299,886 245,562 62,463 95,209 960,758 133,110 1,796,990
% 17% 14% 3% 5% 53% 7% 100%
Source: Access Economics (2009)
Table 8.5: Summary of costs associated with partial sight and blindness in UK adults 2008
£ million
Health system costs 2,144.89
Lower employment 1626.70
Absenteeism 79.85
Premature mortality 2.38
Informal care costs 2,029.70
Devices and modifications 336.50
Deadweight loss 268.59
Total – Indirect costs 4,343.72
Total – Burden of disease costs 15,509.10
Total –Costs 21,997.71
Source: Access Economics (2009)
In addition to estimating the economic cost of partial sight and blindness in the UK adult
population, four hypothetical eye care interventions were evaluated to estimate their
potential cost effectiveness. These focused on four areas identified as most relevant for
current UK policy:
■ promote the prevention of eye injuries;
■ improve access to integrated low vision and rehabilitation services;
■ increase regular eye tests for the older population (≥60 years); and
■ increase access to eye care services for minority ethnic groups (MEGs).
The results suggested the most effective campaign was that focusing on MEGs because of the
lack of access of MEGs to eye care services compared with the population average, and
undetected eye conditions in this community are more likely to be severe. It was estimated
that an educational campaign using media and an educational road show to ten locations
heavily populated with MEGs throughout the UK could result in a cost effectiveness ratio of
£1,230 per DALY avoided (90% confidence interval of £1,032 per DALY avoided to £1,559 per
DALY avoided).
Results of the other three economic evaluations show there are gains to be made in investing
in the promotion of eye care services. In summary the results indicated the following.
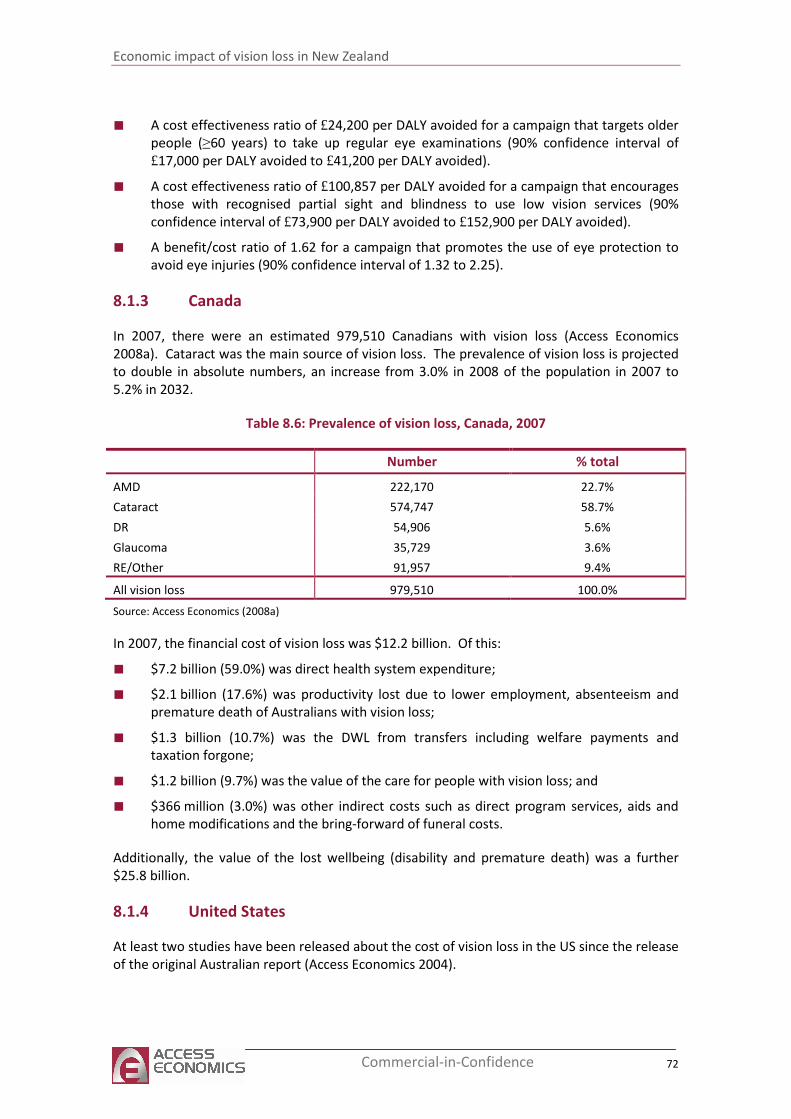
Economic impact of vision loss in New Zealand
72 Commercial-in-Confidence
■ A cost effectiveness ratio of £24,200 per DALY avoided for a campaign that targets older
people (≥60 years) to take up regular eye examinations (90% confidence interval of
£17,000 per DALY avoided to £41,200 per DALY avoided).
■ A cost effectiveness ratio of £100,857 per DALY avoided for a campaign that encourages
those with recognised partial sight and blindness to use low vision services (90%
confidence interval of £73,900 per DALY avoided to £152,900 per DALY avoided).
■ A benefit/cost ratio of 1.62 for a campaign that promotes the use of eye protection to
avoid eye injuries (90% confidence interval of 1.32 to 2.25).
8.1.3 Canada
In 2007, there were an estimated 979,510 Canadians with vision loss (Access Economics
2008a). Cataract was the main source of vision loss. The prevalence of vision loss is projected
to double in absolute numbers, an increase from 3.0% in 2008 of the population in 2007 to
5.2% in 2032.
Table 8.6: Prevalence of vision loss, Canada, 2007
Number % total
AMD 222,170 22.7%
Cataract 574,747 58.7%
DR 54,906 5.6%
Glaucoma 35,729 3.6%
RE/Other 91,957 9.4%
All vision loss 979,510 100.0%
Source: Access Economics (2008a)
In 2007, the financial cost of vision loss was $12.2 billion. Of this:
■ $7.2 billion (59.0%) was direct health system expenditure;
■ $2.1 billion (17.6%) was productivity lost due to lower employment, absenteeism and
premature death of Australians with vision loss;
■ $1.3 billion (10.7%) was the DWL from transfers including welfare payments and
taxation forgone;
■ $1.2 billion (9.7%) was the value of the care for people with vision loss; and
■ $366 million (3.0%) was other indirect costs such as direct program services, aids and
home modifications and the bring-forward of funeral costs.
Additionally, the value of the lost wellbeing (disability and premature death) was a further
$25.8 billion.
8.1.4 United States
At least two studies have been released about the cost of vision loss in the US since the release
of the original Australian report (Access Economics 2004).
Economic impact of vision loss in New Zealand
73 Commercial-in-Confidence
Rein et al (2006) estimated the societal economic burden, and the governmental budgetary
impact of visual impairment, blindness, refractive error, age related macular degeneration,
cataracts, diabetic retinopathy, and primary open-angle glaucoma among US adults aged 40
years and older. The scope of costs included medical care, the costs of nursing home care
attributable to vision loss, government purchase programs, and guide dogs for the blind, and
productivity losses.
For 2004, the total financial cost of major visual disorders among US residents aged 40 years or
older was $US35.4 billion: $US16.2 billion in direct medical costs, $US11.1 billion in other
direct costs, and $US8 billion in productivity losses.
Outpatient and pharmaceutical services comprised the majority of direct medical costs, with
inpatient costs accounting for virtually no costs. The direct medical costs for each condition
were roughly $US6.8 billion for cataracts, $US5.5 billion for refractive error, $US2.9 billion for
glaucoma, $US575 million for AMD, and $US493 million for diabetic retinopathy. For people
with vision loss aged 40 or over, 75.6% of direct medical costs were attributable to cataracts
and refractive error, with another 17.8% attributable to glaucoma.
Among Americans aged 65 years or older, 16% of those who are vision impaired and 40% of
those who are blind resided in nursing homes, compared with only 4.3% of those in the
general population. Around 424,801 more visually impaired and blind Americans reside in
nursing homes than would be expected if these same individuals had normal vision. Nursing
homes costs were $US11 billion, government purchase programs cost $US94 million and guide
dogs cost $US62 million.
Lost productivity annually was $US6.3 billion reflecting an estimated 115,583 vision impaired
and 74,133 blind people who did not work and who would have worked if fully sighted. Rein
et al (2006) also estimated that 125,882 visually impaired and 40,671 blind people participated
in the labour force but earned less than people with normal vision, with a wage differential of
$US9,851 for the vision impaired and $US12,121 for the blind. Productivity losses due to
decreased earnings were $US1.7 billion. This element of productivity losses is not commonly
included in estimates of the cost of vision loss.
In 2004, the total governmental budgetary impact of adult visual disorders was $US13.7 billion
(Rein et al 2006).
A study by Frick et al (2007) added value by estimating the value of home care provided by
agencies that was not covered by insurers, personal care services paid for by the individual
with visual impairment or his or her family, and informal care. Medical Expenditure Panel
Survey data from 1996 to 2002 were pooled to estimate the relationship of visual impairment
and blindness with total medical expenditures, components of expenditures, days of informal
care received, and health utility. Statistical analysis accounted for confounders such as
comorbidities and demographics. Blindness and visual impairment were significantly
associated with higher medical care expenditures, a greater number of informal care days, and
a decrease in health utility (measured in terms of QALYs — although the sample for health
utility estimates was relatively small).
Individuals with blindness had significantly higher odds of positive home health care
expenditures (OR, 2.1; 95% confidence interval, 1.6-2.8). Individuals with blindness who used
home health agencies had expenditures that were $4900 more than those for individuals
Economic impact of vision loss in New Zealand
74 Commercial-in-Confidence
without visual impairment who had home health agency expenditures (P=.005). Individuals
with blindness who used private home health providers had expenditures that were $1200
more than those for individuals without visual impairment who used private home health
providers (although not statistically significantly [P=.60]).
Interestingly, individuals with blindness who were admitted for inpatient care had lower
expenditures than individuals without visual impairment who were admitted for inpatient
care. Frick et al (2007) suggested this reflected that individuals with blindness may be admitted
for less serious conditions for which they do not have sufficient care to remain in the home,
resulting in a lower average expenditure per admission. Frick et al (2007) concluded that
excess expenditures (including medical and home care) for those who were vision impaired or
blind were $US5.1 billion, primarily owing to home care. The total value of informal care
(based on an additional 5.2 days per year for a blind person and 1.2 days for a vision impaired
person) was $0.4 billion. The total monetary cost was therefore $5.5 billion. While the impact
on QALYs lost (0.07 per blind person and 0.05 per person with vision loss) were lower than for
other studies, Frick et al (2007) cited potential differences in short and long term impacts of
losing vision as those affected adapt over time, and suggested the need for further research.
8.1.5 Australia
In Australia in 2009, there were almost 575,000 Australians aged 40 or over with vision loss in
2009, 5.8% of the Australian population in that age group (Access Economics 201020). Around
66,500 people were blind. The largest proportion were aged 70 or over (nearly 70%).
Most vision loss was caused by uncorrected refractive error (over 341,000 people). Cataract
caused 15% of vision loss, AMD 10%, glaucoma 5% and DR 2%. The most common causes of
blindness were AMD (50%), glaucoma (16%) and cataract (12%).
Vision loss is associated with a higher than average risk of mortality because it is correlated
with a higher risk of falls, motor vehicle accidents and depression (Centre for Eye Research
Australia and Access Economics 2004). Over 1,000 deaths were attributable to vision loss in
2009.
It is projected that the number of people aged 40 or over with vision loss will rise to almost
801,000 by 2020 and those who are blind will rise to 102,750. The projected rise in prevalence
reflects demographic ageing, and assumes a policy-neutral environment. The rise in the
number of Australians is depicted in Table 8.1.
20
Subsequent estimations also sourced from Access Economics 2010 unless otherwise stated
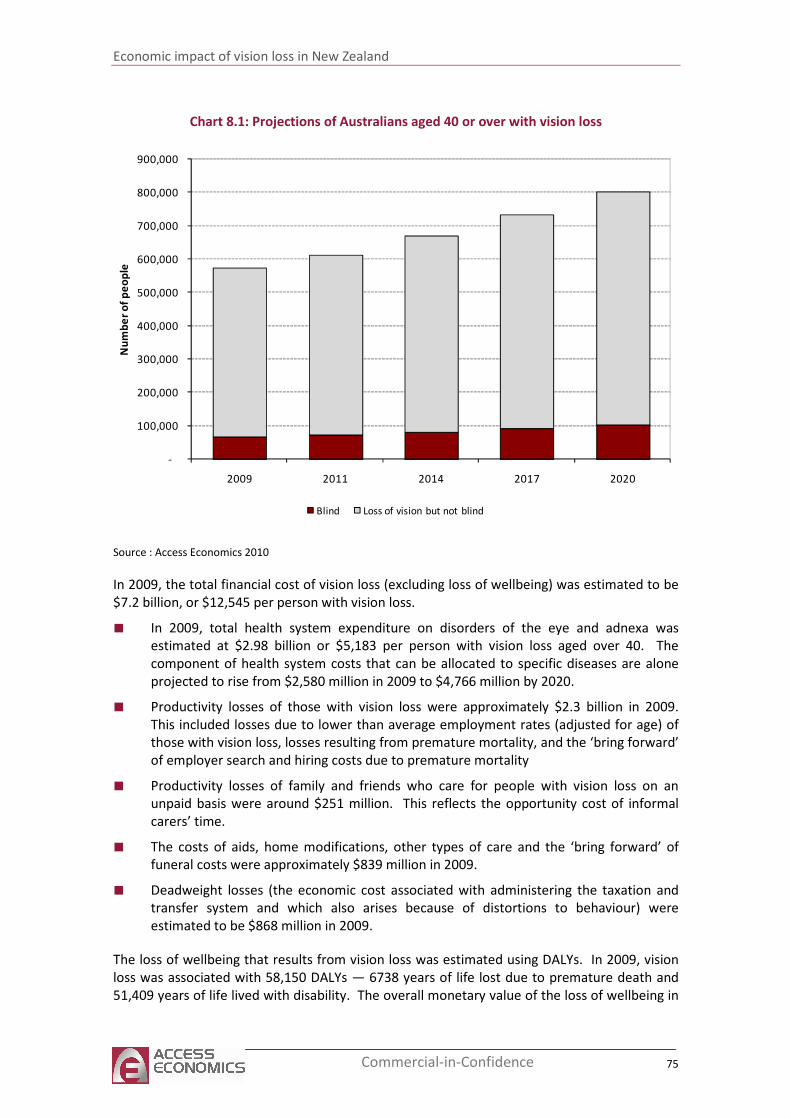
Economic impact of vision loss in New Zealand
75 Commercial-in-Confidence
Chart 8.1: Projections of Australians aged 40 or over with vision loss
-
100,000
200,000
300,000
400,000
500,000
600,000
700,000
800,000
900,000
2009 2011 2014 2017 2020
Nu
mb
er
of
pe
op
le
Blind Loss of vision but not blind
Source : Access Economics 2010
In 2009, the total financial cost of vision loss (excluding loss of wellbeing) was estimated to be
$7.2 billion, or $12,545 per person with vision loss.
■ In 2009, total health system expenditure on disorders of the eye and adnexa was
estimated at $2.98 billion or $5,183 per person with vision loss aged over 40. The
component of health system costs that can be allocated to specific diseases are alone
projected to rise from $2,580 million in 2009 to $4,766 million by 2020.
■ Productivity losses of those with vision loss were approximately $2.3 billion in 2009.
This included losses due to lower than average employment rates (adjusted for age) of
those with vision loss, losses resulting from premature mortality, and the ‘bring forward’
of employer search and hiring costs due to premature mortality
■ Productivity losses of family and friends who care for people with vision loss on an
unpaid basis were around $251 million. This reflects the opportunity cost of informal
carers’ time.
■ The costs of aids, home modifications, other types of care and the ‘bring forward’ of
funeral costs were approximately $839 million in 2009.
■ Deadweight losses (the economic cost associated with administering the taxation and
transfer system and which also arises because of distortions to behaviour) were
estimated to be $868 million in 2009.
The loss of wellbeing that results from vision loss was estimated using DALYs. In 2009, vision
loss was associated with 58,150 DALYs — 6738 years of life lost due to premature death and
51,409 years of life lived with disability. The overall monetary value of the loss of wellbeing in
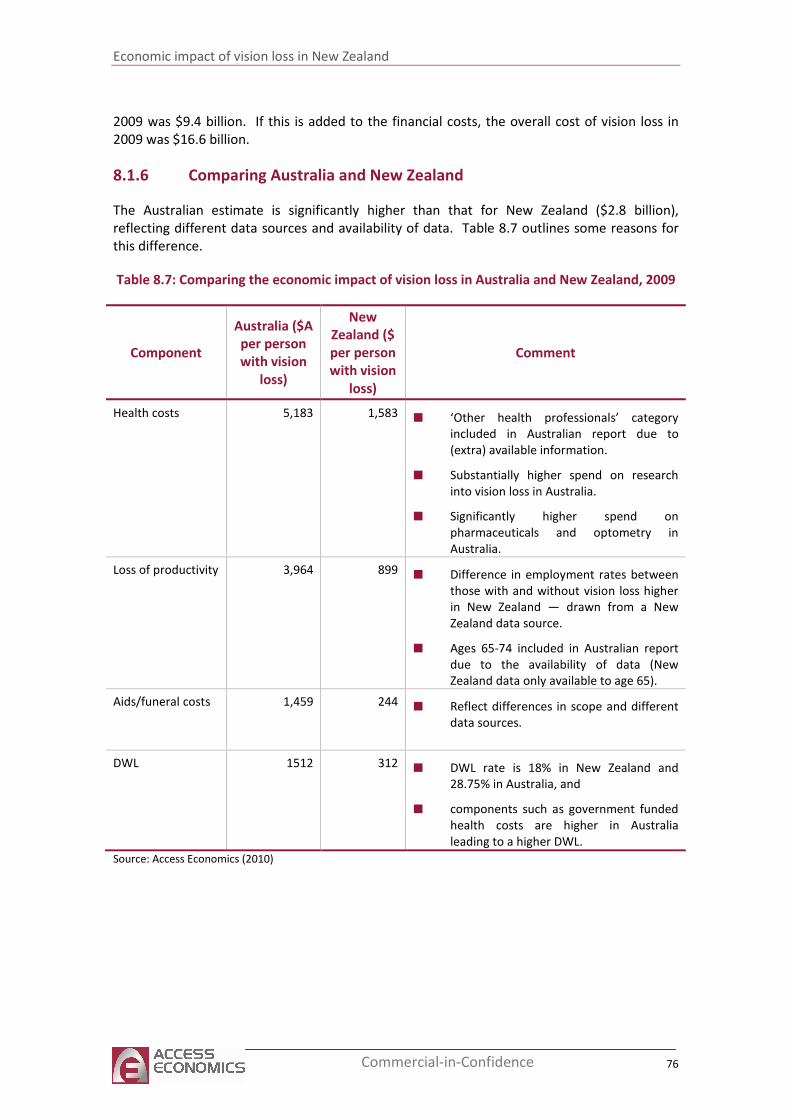
Economic impact of vision loss in New Zealand
76 Commercial-in-Confidence
2009 was $9.4 billion. If this is added to the financial costs, the overall cost of vision loss in
2009 was $16.6 billion.
8.1.6 Comparing Australia and New Zealand
The Australian estimate is significantly higher than that for New Zealand ($2.8 billion),
reflecting different data sources and availability of data. Table 8.7 outlines some reasons for
this difference.
Table 8.7: Comparing the economic impact of vision loss in Australia and New Zealand, 2009
Component
Australia ($A
per person
with vision
loss)
New
Zealand ($
per person
with vision
loss)
Comment
Health costs 5,183 1,583
■ ‘Other health professionals’ category
included in Australian report due to
(extra) available information.
■ Substantially higher spend on research
into vision loss in Australia.
■ Significantly higher spend on
pharmaceuticals and optometry in
Australia.
Loss of productivity 3,964
899
■ Difference in employment rates between
those with and without vision loss higher
in New Zealand — drawn from a New
Zealand data source.
■ Ages 65-74 included in Australian report
due to the availability of data (New
Zealand data only available to age 65).
Aids/funeral costs 1,459
244
■ Reflect differences in scope and different
data sources.
DWL 1512 312 ■ DWL rate is 18% in New Zealand and
28.75% in Australia, and
■ components such as government funded
health costs are higher in Australia
leading to a higher DWL.
Source: Access Economics (2010)
Economic impact of vision loss in New Zealand
77 Commercial-in-Confidence
9 New Zealand health policy in context
This report highlights the substantial economic impact of vision loss in New Zealand. In 2009
there were almost 125,000 New Zealanders aged 40 years or over with vision loss — 67% aged
70 or over. Around 12,000 of these people were blind. Based on these prevalence estimates,
the costs of vision loss in 2009 were $400 million — around $198 million in health expenditure
and the rest due to productivity losses of those with vision loss and their unpaid carers, aids
and equipment and deadweight losses resulting from transfer payments. Moreover, there are
the substantial effects on wellbeing — estimated in this report as having a monetary value of
around $2.4 billion.
Most cases of vision loss and blindness are avoidable, through evidence based, effective
interventions across the spectrum from prevention, early intervention, and treatment.
■ Cataract surgery has been found to be a very cost effective way to restore sight (Busbee
2002, Busbee 2003, Kobelt et al, 2002, Baltussen et al, 2004, and Lansingh 2006).
■ Pharmaceuticals and/or laser therapy can slow the progress of primary open angle
glaucoma. The Ocular Hypertension Treatment Study and the Early Manifest Glaucoma
Trial showed that the rate of progression of primary open angle glaucoma can be
delayed by half with these interventions. Detection and early intervention is important
because once vision has been lost it cannot be restored.
■ Diabetic retinopathy can be prevented through prevention or control of diabetes. In
particular, control of blood lipids (Keech et al, 2007), blood pressure (Mohamed et al,
2007) and glycaemic control (Diabetes Control and Complications Trial 1993; United
Kingdom Prospective Diabetes Study 2004 and 1998) are effective in reducing the risk of
DR among people with diabetes.
■ Regular eye examinations for people with diabetes to detect early diabetic retinopathy,
and appropriately timed laser treatment can prevent 90% of severe vision loss (Ferris
1993).
■ Age related macular degeneration of the wet form can be treated to preserve vision.
Tobacco smoking is a risk factor for AMD, and a further reason to reduce New Zealand
smoking rates. The pharmaceuticals such as Lucentis and anti-VEGF treatments slow the
progress of wet AMD and in a number of cases restore some vision.
Moreover, quality of life and independence can be improved through rehabilitation, aids and
equipment which enhance vision and improve functionality of those with low vision.
Many New Zealanders are needlessly experiencing vision loss. Improving awareness about
how to avoid vision loss, and ensuring access to eye care services, including prevention,
treatment and rehabilitation services, are important.
9.1.1 New Zealand health policy in context
Prevention of vision loss, its early detection, treatment, education and rehabilitation are
comparatively low cost interventions that depend on integration into existing health policies
and priorities. Their effective delivery in the public sector, eye health and vision care
Economic impact of vision loss in New Zealand
78 Commercial-in-Confidence
programmes must rely on Ministry of health guidelines and need the backing of 21 District
Health Boards for their delivery in specific districts.
VISION 2020 New Zealand is committed to:
■ eliminating avoidable vision loss within existing health priorities;
■ developing an evidence base to support progressive eye health policy, service delivery
and monitoring mechanisms; and
■ to collaborate with public, private and NGO elements of the eye health and vision care
sector to gain these ends.
Eye health could be embedded within New Zealand health policy through inclusion in the
annual targets set by the Ministry. For example, the 2010-11 targets for District Health Boards
include shorter stays in emergency departments, improved access to elective surgery, shorter
waits for cancer treatment, increased immunisation, better help for smokers to quit and better
diabetes and cardiovascular services.21 Eye health could be included in the justification for
selection of targets (such as reducing tobacco smoking or prevention and better care of
diabetes) or inclusion as a target in its own right. What is needed is a greater awareness of
vision loss as a core determinant of overall health, acknowledgement of the economic and
social costs of vision loss, and the active integration of vision care into existing programmes.
9.1.2 VISION 2020 initiatives
2009 health spending on disorders of the eye for those over 40 was estimated at $198 million
or $1,583 per person. This spending has gone some way to limiting vision loss. However,
there are huge gains yet to be made through a comprehensive cross-sectoral “National Eye
Health Plan” to further reduce the incidence of avoidable blindness. Actions needed are:
■ a political commitment to eliminating avoidable blindness;
■ preparation of evidence-based standards and guidelines for cost-effective interventions;
■ the sharing of best practice lessons; and
■ the strengthening of partnerships and coordination among all stakeholders.
In 2002 the Minister of Health, the Hon Annette King, signed New Zealand up to the WHO
global initiative, VISION 2020, aimed at eliminating avoidable blindness and vision loss by year
2020. Since then, New Zealand Governments have all voted at successive World Health
Assemblies to affirm the objects of VISION 2020 and have subscribed to action plans that set
targets for member states ensuring that avoidable vision impairment and blindness is
addressed. These action plans urge all member states to develop a National VISION 2020 plan
in collaboration with non-governmental organisations and the private sector.
Implementing action and monitoring progress in the elimination of avoidable blindness at
national, regional and global levels call for the gathering of robust population-based evidence
on interventions, and raising the awareness and understanding of eye health among the public
— especially those caring for children, the elderly, smokers, the obese and those exposed to
outdoor ultraviolet radiation.
21
New Zealand Ministry of Health website http://www.moh.govt.nz/moh.nsf/indexmh/healthtargets-
targets accessed September 2010.
Economic impact of vision loss in New Zealand
79 Commercial-in-Confidence
The key actions sought are: risk reduction; enhanced early detection; workforce development
and coordination; equity of access to eye health and vision care services; improved systems for
the delivery of eye care; and the gathering and dissemination of quality evidence.
9.1.3 Eye health and vision care policy
The report highlights a number of actions warranting urgent attention as we work towards the
goal of eliminating avoidable blindness by 2020.
VISION 2020 New Zealand makes the following recommendations and pledges to work with all
Governments to help achieve the World Health Assembly objectives set out above.
In line with World Health Assembly and VISION 2020 commitments on eye health, there is
need for a comprehensive National Eye Health Plan with measurable targets. With regard to
eye health, there is need for inter-sectoral and intra-sectoral collaboration around health,
disability, aged care and chronic disease policies and funding, particularly for those
programmes targeting vulnerable groups. At risk are Māori, Pacific, and high needs
populations, children, the elderly, smokers, the obese and people with low vision and
blindness. Eye health and vision care are key determinants of health and wellbeing. As such,
funding prevention of blindness will return improvements to the wellbeing and productivity of
New Zealanders.
9.1.4 Establishing population oriented evidence and monitoring
The literature review conducted for this study revealed the dearth of data on vision loss in
New Zealand based on large scale, ophthalmologically based epidemiological surveys. It was
therefore necessary for this report to use two large, high quality, internationally renowned
studies of the prevalence of vision loss in Australia to derive estimates of the prevalence of
vision loss in New Zealand. While New Zealand and Australia are often grouped together for
the purposes of global epidemiological estimates, and several (non clinical) New Zealand
surveys of vision loss were used to inform the Australian epidemiological estimates, the lack of
New Zealand specific data mean the prevalence estimates here need to be viewed with care.
More broadly, the paucity of epidemiological surveys of vision loss in New Zealand represents
a significant gap in knowledge which needs to be addressed. The non clinical New Zealand
surveys suggest there are considerable disparities in eye health between the Māori and Pacific
populations and others, with evidence of worse eye health particularly among Māori. These
need to be explored more fully to identify the extent of the problem and possible reasons to
inform strategies to improve eye health among disadvantaged and high prevalence groups in
the community. In 2006, self-reported rates of vision loss among Māori were more than twice
those of non-Māori for people aged younger than 75 years (Office for Disability Issues and
Statistics New Zealand 2010). More understanding is needed about the complexities that lie
behind high prevalence rates of vision loss among Māori and barriers to early detection and
treatment in such groups.
Further, mechanisms are needed to gauge New Zealand's success in reducing avoidable
blindness. Ongoing quality research into the clinical, economic, population and service
delivery aspects of eye care is strongly recommended. Given current data, it is not possible to
Economic impact of vision loss in New Zealand
80 Commercial-in-Confidence
assess the effectiveness of prevention measures. Equity of access for ethnic and remote
communities deserves special attention in this regard.
The projections of health system costs to the year 2020, are alarming. Assuming a policy
neutral environment, health system costs are projected to rise from $198 million in 2009
($1,583 per person with vision loss) to $523 million by 2020 ($3,008 per person with vision
loss). These estimates warrant close monitoring in the light of rapid changes in the
management of eye conditions.
9.1.5 Public health
Given the functional significance of sight as a determinant of health and wellbeing, eye health
and vision care become public health issues on a par with smoking and obesity. The socio-
economic consequences of blindness and vision loss outlined in this report justify active
monitoring and refinement of Interventions.
The majority of international vision loss is avoidable or treatable. The WHO estimated that
75% of world blindness was avoidable with cost effective intervention strategies (WHO 2005).
In 2000, of 45 million people who were blind, 60% were blind due to cataract and refractive
error (treatable), 15% of blindness was due to trachoma, vitamin A deficiency and
onchocerciasis (preventable); another 15% of blindness was due to DR and glaucoma (partly
preventable although difficult, or treatment can slow progress of disease) and the other 10%
was attributable to AMD and other diseases (progress can be slowed in some cases but more
research needed) (WHO 2005). The newer estimates by Access Economics (2010) drawing on
more recent data from Resnikoff et al, (2004) and Resnikoff et al, (2008) suggest close to 75%
of world blindness in 2010 was due to cataract and URE alone implying an even higher
proportion of avoidable blindness.
This report estimates that in New Zealand, 68% of vision loss and 14% of blindness are due to
cataract and uncorrected refractive error — avoidable through cost effective treatment.
Benefits should flow from eye health messages being included in general prevention and
health promotion campaigns targeted at high risk populations. There appears to be a low level
of public awareness regarding the simple measures people can take to conserve and enhance
sight. New Zealanders are entitled to the information that enables them to take charge of
their own eye health and vision care. Public awareness campaigns promoting simple measures
that preserve sight such as five yearly checks for the over 50's would pay dividends. Such
checks are required for early detection of refractive error and eye disease and would reduce
vision loss from cataract, age related macular degeneration, diabetic retinopathy and
glaucoma. Integrated primary health care and chronic disease management, along with sound
information transfer between eye-care professionals is needed, particularly for those with
diabetes-related eye conditions. Education of general medical practitioners, nurses and allied
health-care professionals would aid detection of vision loss and speed appropriate referral.
Delivering community-based eye-care in a convenient and appropriate manner should reduce
costs and enhance equity of access to service.
Fairness, equity and efficiency should result from better integration of eye health and vision
care across the spectrum. Patients benefit from evidence-based practice guidelines,
continuous shared learning, consistent documentation, information transfer and referral.
Economic impact of vision loss in New Zealand
81 Commercial-in-Confidence
Ongoing research into service delivery systems and the mitigation of the major causes of vision
loss is essential, given the report's findings.
9.1.6 Eye health workforce
Few previous economic or prevalence studies on vision loss have been undertaken in New
Zealand. Evidence from this report points to the fact that the most effective interventions
possible are needed to limit avoidable blindness. Despite the heroic efforts of clinicians and
technical advances in eye care, we have a long way to go to improve overall eye health and to
stem the growing vision loss problem in New Zealand. There is a strong case for critical
planning of workforce development, coordination and distribution of eye health and vision
care professionals.
Equity of access to services and distribution of trained personnel in rural communities remain
a significant challenge. Appropriateness and adequacy of professional training and access to
facilities in a rapidly changing technological age deserve regular review.
This Report raises concerns about equity of access to ophthalmic, optometric, low vision and
rehabilitation services with particular reference to the needs of Māori, Pacific, and other high
needs populations.
With 55% of vision loss being caused by uncorrected refractive error, access to publicly funded
optometric services could enhance early detection, aid monitoring of eye-related conditions
and extend low vision services.
9.1.7 Joint sector-government eye health and vision care directorate
A ten year comprehensive eye health and vision care strategy is needed for New Zealand,
headed by a national eye health directorate. The WHO Action Plan is now in its mid phase,
2008 to 2013, en route to the objective of eliminating avoidable blindness by the year 2020.
To keep pace with comparable countries, New Zealand must give voice to its own eye health
plan. Global and regional goals to limit avoidable blindness need translation into national
relevance.
This report, Clear Focus - The Economic Impact of Vision Loss in New Zealand, 2009,
demonstrates the benefits in terms of personal wellbeing and the national economy that
would flow from investing in sight.
9.1.8 Counting down to 2020
Projections here suggest that the number of New Zealanders with vision loss will rise from
125,000 in 2009 to almost 174,000 by 2020 (assuming a policy-neutral environment). The
number who are blind will rise from 12,000 in 2009 to more than 18,000 in 2020. The
projected increases reflect demographic ageing, as most people with vision loss are aged 70 or
over. In addition to the 125,000 people with vision loss, approximately 14,400 people had
vision loss due to uncorrected presbyopia in 2009.
Most vision loss is correctable — 55% was caused by uncorrected refractive error (excluding
presbyopia) and 13% by cataract. Other vision loss is preventable or treatable — age-related
Economic impact of vision loss in New Zealand
82 Commercial-in-Confidence
macular degeneration 9% of vision loss, glaucoma 4% and diabetic retinopathy 2%. AMD
(48%) and glaucoma (16%) are the most common causes of blindness.
Vision loss and blindness are associated with substantial economic and social costs. In 2009,
the total financial cost of vision loss (excluding loss of wellbeing) was estimated to be $400
million, or $3,206 per person with vision loss aged over 40 years. The loss of wellbeing that
results from vision loss was estimated to add $2.4 billion to the financial costs, resulting in an
overall cost of vision loss in 2009 of $2.8 billion, or $22,217 per person with vision loss aged
over 40.
Together with other countries, New Zealand has pledged to eliminate avoidable blindness by
2020 through the global initiative, VISION 2020: the Right to Sight. Since 2002, New Zealand
has been committed to VISION 2020 ideals. In 2009 New Zealand was a member of the WHO
Executive Board that voted to further advance VISION 2020 in member countries. With only
ten years remaining for this collaborative effort, the Government and the sector need to
increase their work rate, build on existing services and work in partnership to ensure avoidable
blindness is eliminated by the target date. An action plan to minimise avoidable blindness and
vision loss is needed, together with strategies to remove the barriers to full participation in the
community of people with little or no sight.
VISION 2020 New Zealand recommends that the public and private sectors collaborate and
take strong and immediate action on the serious matters raised in this report. It is time to turn
humane precept into practice.
Economic impact of vision loss in New Zealand
83 Commercial-in-Confidence
References
Access Economics (2004), Clear Insight: The Economic Impact and Cost of Vision Loss in
Australia, report for the Centre for Eye Research Australia.
Access Economics (2006), Centrally Focussed: The Impact of Age-Related Macular
Degeneration, report for the Centre for Eye Research Australia.
Access Economics (2008), The Health of Nations: The Value of a Statistical Life, report for the
Office of the Australian Safety and Compensation Council (OASCC), January, Canberra.
Access Economics (2008a), The cost of visual impairment in Canada, report prepared for the
Canadian National Institute for the Blind and the Canadian Ophthalmological Society
Access Economics (2009), Future sight loss UK: The economic impact of partial sight and
blindness in the UK adult population, Full report, report prepared for Royal National
Institute of Blind People, July
Access Economics (2010), The Global Economic Cost of Visual Impairment, report prepared for
AMD Alliance International
Access Economics (2010b), Clear Focus - The economic impact of vision loss in Australia in
2009, report prepared for VISION 2020 Australia.
AREDS (2001), ‘A randomized, placebo-controlled clinical trial of high-dose supplementation
with Vitamins C and E, beta carotene, and zinc for age-related macular degeneration and
vision loss, Report No. 8, Archives of Ophthalmology, 119: 1417-1436
AusDiab (2001), Diabesity and associated disorders in Australia, 2000: the Accelerating
Epidemic, Australian Diabetes, Obesity and Lifestyle Report, International Diabetes
Institute, Melbourne
Australian Bureau of Statistics (ABS) 2009, National Health Survey: summary of results, 2007-08
(reissue), Cat. No. 4364.0, Canberra.
Baltussen R, Sylla M, Mariotti SP 2004, ‘Cost-effectiveness analysis of cataract surgery: a global
and regional analysis’. Bull World Health Organ, 82:338–45.
Begg S, Vos T, Barker B, Stevenson C, Stanley L, Lopez AD (2007), The burden of disease and
injury in Australia 2003, Australian Institute of Health and Welfare, PHE 82, April,
Canberra
Black A, Wood J (2005) ‘Vision and Falls: Review, Clinical experimental’, Optometry, 2005
88(4):212-222.
Bureau of Transport Economics (2000), Road Crash Costs in Australia, Bureau of Transport
Economics, Report 102, Canberra.
Burr JM, Mowatt G, Hernández R, Siddiqui MA, Cook J, Lourenco T, Ramsay C, Vale L, Fraser C,
Azuara-Blanco A, Deeks J, Cairns J, Wormald R, McPherson S, Rabindranath K, Grant A.
Economic impact of vision loss in New Zealand
84 Commercial-in-Confidence
‘The clinical effectiveness and cost-effectiveness of screening for open angle glaucoma:
a systematic review and economic evaluation’, Health Technol Assess. 2007
Oct;11(41):iii-iv, ix-x, 1-190.
Busbee B, Brown M, Brown G, Sharma S 2002, ‘Incremental cost effectiveness of initial cataract
surgery’, Ophthalmology, 109:606-613.
Busbee BG, Brown MM, Brown GC, Sharma S 2003, ‘Cost-utility analysis of cataract surgery in
the second eye’, Ophthalmology, 110:2310 –7.
Centre for Eye Research Australia (CERA) and Access Economics (2004), ‘Clear Insight: the
economic impact and cost of vision loss in Australia’,
http://www.cera.org.au/uploads/CERA_clearinsight.pdf, accessed 20 April 2010.
Centre for Eye Research Australia and Access Economics (2006), ‘Centrally Focussed’,
http://www.cera.org.au/uploads/CERA_access_amd.pdf, accessed 20 April 2010.
Centre for Eye Research Australia and Access Economics (2008), ‘Tunnel Vision: the economic
impact of primary open angle glaucoma, a dynamic economic model’,
http://www.cera.org.au/uploads/CERA_tunnelvision.pdf, accessed 03 May 2010.
Coleman AL, Stone K, Ewing S et al (2004) ‘Higher risk of multiple falls among elderly women
who lose visual acuity’, Ophthalmology 2004;111: 857 - 862.
Cornwell J, Davey J (2004) ‘Impact of Population Ageing in New Zealand on the Demand for
Health and Disability Support Services, and Workforce Implications, report for Ministry
of Health, Wellington.
Diewert WE, Lawrence DA (1994) The Marginal Costs of Taxation in New Zealand, Report
prepared by Swan Consultants (Canberra) Pty Ltd for the New Zealand Business Round
Table.
Diewert WE, Lawrence DA (1995) ‘The Excess Burden of Taxation in New Zealand’, Agenda
2(1):27-34.
Diewert WE, Lawrence DA (1996) ‘The Deadweight Costs of Taxation’, Canadian Journal of
Economics 29:S658-S673.
Evans J, Fletcher AE, Wormald RPL (2007) ‘Depression and Anxiety in Visually Impaired Older
People’, Ophthalmology 114: 283 – 288.
Ferris F, 1993, ‘How effective are treatments for diabetic retinopathy?’, JAMA, March, 269(10):
1290-1291.
Foran S, Wang J, Rochtchina E, Mitchell P (2000) ‘Projected number of Australians with visual
impairment in 2000 and 2030’, Clinical and Experimental Ophthalmology, 28 : 143 – 145.
Frick K, Gower EW, Kempen JH, Wolff JL, 2007, ‘Economic Impact of Visual Impairment and
Blindness in the United States’, Arch Ophthalmol., 125: 544 - 550
Economic impact of vision loss in New Zealand
85 Commercial-in-Confidence
Frick KD, Foster A (2003) ‘The magnitude and cost of global blindness: an increasing problem
that can be alleviated’, American Journal of Ophthalmology, 135: 471 - 476.
Frisch J (2001), Towards a Disability Allowance: Offsetting the Costs of Disability - An Analysis,
prepared for the Physical Disability Council of Australia, June
Godfrey J, Brunning D (2009) ‘Reconciling true and incurred costs of blindness in New Zealand’,
Social Policy Journal of New Zealand, 36: 208-216.
Good G, La Grow S, Alpass F (2008) ‘An age cohort study of older adults with and without
impaired vision: Activity, independence and life satisfaction’, Journal of Visual
Impairment and Blindness, 102 : 517 - 527.
Hayman K, Kerse N, La Grow S, Wouldes T, Robertson M, Campbell A (2007) ‘Depression in
older people: Low vision and subjective ratings of Health’, Optometry and Vision Science,
84 : 1024 – 1030.
Higgins N, Phillips H, Cowan C, Tikao K (2008), Supplementary report: Relevant policy and
demographics for growing up kāpo Māori, prepared for the Health Research Council.
Holden B, Fricke T, Ho SM, Wong R, Schlenther G, Cronje S, Burnett A, Papas E, Naidoo K, Frick
(2008), ‘Global vision impairment due to uncorrected presbyopia’ Archives of
Ophthalmology, 126(12): 1731-1739.
Ivers RQ, Cumming RG, Mitchell P (1998) ‘Visual impairment and falls in older adults: the Blue
Mountains Eye Study’ J Am Geriatr Soc, 46: 58 - 64.
Ivers RQ, Cumming RG, Mitchell P, Simpson JM, Peduto AJ (2003) ‘Visual risk factors for hip
fracture in older people’, J Am Geriatr Soc., 51(3): 356 - 63.
Joshy G, Simmons D (2006), ‘Epidemiology of diabetes in New Zealand: revisit to a changing
landscape’, The New Zealand Medical Journal, 119(1235).
Keech A, Mitchell P, Summanen P, O’Day J, Davis T, Moffitt M, Taskinen M, Simes R,
Williamson E, Merrifield A, Laatikainen L, Emden M, Crimet D, O’Connell R, Colman P, for
the FIELD study investigators (2007) ‘Effect of fenofibrate on the need for laser
treatment for diabetic retinopathy (FIELD study); a randomised controlled trial’,
www.thelancet.com, Published Online, November 6, 2007, DOI:10.1016/S0140-
6736(07)61607-9.
Kempen JH, Mitchell P, Lee KE, Tielsch JM, Broman AT, Taylor HR, Ikram MK, Congdon NG,
O’Colmain BJ, Friedman DS (2004), ‘The Prevalence of Refractive Errors Among Adults in
the United States, Western Europe and Australia’, Archives of Ophthalmology, 122: 495 -
505
Klein BEK, Klein R, Lee KE, Cruikshanks KJ (1998), ‘Performance-based and self-assessed
measures of visual function as related to history of falls, hip fractures and measured gait
time’, The Beaver Dam Eye Study, Ophthalmology, 105: 160 - 164
Economic impact of vision loss in New Zealand
86 Commercial-in-Confidence
Klein R, Klein B, Moss S, Cruickshanks K (1995) ‘The Wisconsin Epidemiologic Study of Diabetic
Retinopathy XV, the long term incidence of macular oedema’, Ophthalmology, 102:7 –
16.
Kobelt G, Lundstrom M, Stenevi U 2002, ‘Cost-effectiveness of cataract surgery: Method to
assess cost-effectiveness using registry data’, Journal of Cataract refractive Surgery,
28(10):1742:1749.
La Grow S, Daye P (2005) Barriers to Employment Identified by Blind and Vision-Impaired
Persons in New Zealand, report prepared for Ministry of Social Development,
Wellington.
La Grow, S (2003) ‘Employment among working-age members of the Royal New Zealand
Foundation of the Blind’, Journal of Visual Impairment and Blindness, 97(7: 429 – 433.
La Grow S, Alpass F, Stephen C (2009) ‘Economic Standing, Health Status and Social Isolation
among Visually Impaired Persons Aged 55 to 70 in New Zealand’, J Optom, 2: 155 - 158
Lalwani GA, Rosenfeld PJ, Fung AE, Dubovy SR, Michels S, Feuer W, Davis JL, Flynn HW Jr,
Esquiabro M (2009) ‘A variable-dosing regimen with intravitreal ranibizumab for
neovascular age-related macular degeneration: year 2 of the PrONTO Study’, Am J
Ophthalmol, 148(1): 43 - 58.
Lamoureux E, Gadgil S, Pesudovs K, Keeffe J, Fenwick E, Dirani M, Salonen S, Rees G (2010)
‘The relationship between visual function, duration and main causes of vision loss and
falls in older people with low vision’, Graefes Arch Clin Exp Ophthalmol.. 248(4): 527 –
33.
Lansingh V, Carter MJ, Martens M 2007, ‘Global cost-effectiveness of cataract surgery’,
Evidence- Based Ophthalmology, 9(1):54-55.
Lattimore R (1997), Research and Development Fiscal Incentives in Australia: Impacts and
Policy Lessons, Paper Presented to the OECD Conference on Policy Evaluation in
Innovation, Paris, 26 27 June, 81: 574-577
Laviers H, Omar F, Jecha H, Kassim G, Gilbert C, 2010, Presbyopic spectacle coverage,
willingness to pay near correction and the impact of correcting uncorrected presbyopia
in adults in Zanzibar, East Africa, Investigative Ophthalmology and Visual Science,
51(2):1234-1241.
Marmamula S and Keefe J and Rao Gullapalli N (2009), ‘Uncorrected refractive errors,
presbyopia and spectacle coverage: results from a rapid assessment of refractive error
surgery’, Ophthalmic Epidemiology, 16(5): 269-274.
Mathers C, Vos T and Stevenson C (1999), The burden of disease and injury in Australia, AIHW
Cat No PHE-17, Australian Institute of Health and Welfare, Canberra
McCarty CA, Mukesh BN, Taylor HR (2001) ‘Vision Impairment predicts 5-year mortality’, Br J
Ophthalmol , 85: 322 - 326.
Economic impact of vision loss in New Zealand
87 Commercial-in-Confidence
McKeown PC, Woodfield AE (1995) ‘The welfare cost of taxation in New Zealand following
major welfare reforms’ New Zealand Economic Papers, 29(1): 41 - 62.
Ministry of Health (2001) The burden of disease and injury in New Zealand, Public Health
Occasional Bulletin No 1, Wellington.
Ministry of Health (2004) Living with Disability in New Zealand, report prepared for Ministry of
Health/Intersectoral Advisory Group, Wellington.
Ministry of Health (2007) ‘Diabetes Surveillance : Population-based estimates and projections
for New Zealand, 2001–2011’ Public Health Intelligence Occasional Bulletin No. 46,
Wellington.
Ministry of Health (2008) ‘A Portrait of Health - Key results of the 2006/07 New Zealand Health
Survey’, http://www.moh.govt.nz/moh.nsf/indexmh/portrait-of-health, accessed 15
April 2010.
Ministry of Health (2009) ‘Publicly Funded Hospital Casemix Events 1 July 2006 to 30 June
2007’, http://www.moh.govt.nz/moh.nsf/indexmh/publicly-funded-hospital-casemix-
events-1july2006-to-30June2007, accessed 22 April 2010.
Ministry of Health (2009a) ‘Discharges from Privately Funded Hospitals - 1 July 2004 to 30 June
2005’, http://www.moh.govt.nz/moh.nsf/indexmh/discharges-privately-funded-
hospitals-0405-nov09, accessed 22 April 2010.
Mohamed Q, Gillies M, Wong T (2007) ‘Management of diabetic retinopathy, A systematic
review’, JAMA, 298(8):902-916.
Murray C, Lopez A (1996), The Global Burden of Disease: a comprehensive assessment of
mortality and disability from diseases, injuries and risk factors in 1990 and projected to
2020, Volume 1, Global Burden of Disease and Injury Series, Harvard: Harvard School of
Public Health.
Murray C, Lopez A, Mathers C, Stein C (2001), The Global Burden of Disease 2000 Project: aims,
methods & data sources, Discussion Policy Paper No 36, World Health Organization,
November.
Newbold (1987), Costs of blindness, a study for the Royal New Zealand Foundation for the
Blind.
Organization for Economic Cooperation and Development (2004) OECD Health Data 2004 3rd
edition, September, Online version is downloadable from
http://www.oecd.org/document/16/0,2340,en_2649_34629_2085200_1_1_1_1,00.htm
l
Organization for Economic Cooperation and Development (2010) OECD Stat Extracts – PPPs
and exchange rates, http://stats.oecd.org/Index.aspx?DataSetCode=SNA_TABLE4,
accessed 22 April 2010.
Economic impact of vision loss in New Zealand
88 Commercial-in-Confidence
Office for Disability Issues and Statistics New Zealand (2009) Disability and informal care in
New Zealand in 2006: Results from the New Zealand Disability Survey, report for
Statistics New Zealand, Wellington.
Office for Disability Issues and Statistics New Zealand (2010) Disability and Mäori in New
Zealand in 2006: Results from the New Zealand Disability Survey, report for Statistics
New Zealand, Wellington.
Office of Best Practice Regulation (2008), Best Practice Regulation Guidance Note: Value of
statistical life, Department of Finance and Deregulation,
http://www.finance.gov.au/obpr/docs/ValuingStatisticalLife.pdf, accessed 21 April 2010
Patel I, Munoz B, Mkocha H, Schwarzwalder A, Mchiwa W, West S, 2010, Change in function
and spectacle use 2 months after providing presbyopic spectacles in rural Tanzania, Br J
Ophthalmology, 94:685-689
Quigley H 1996 “Number of people with glaucoma worldwide” Br J Ophthalmol, 80: 389-93.
Rees G, Tee H, Marella M, Fenwick E, Dirani M, Lamoureux E (2010) ‘Vision-specific distress
and depressive symptoms in people with vision impairment’, Investigative
Ophthalmology and Visual Science, 51: 2891 - 2896.
Rein DB, Ping Z, Wirth K, Lee P, Hoerger T, McCall N, Klein R, Tielsch J, Vijan S, Saaddine J
(2006), ‘The Economic Burden of Major Adult Visual Disorders in the United States’, Arch
Ophthalmol., 124:1754 - 1760
Renwick T (2008) Analysis of Carers Census Data, report for Carers New Zealand.
Resnikoff S, Pascolini D, Etya’ale D, Kocur I, Mariotti SP, Pokharel GP, Pararajasegaram R,
Mariotti SP (2004) ‘Global data on visual impairment in the year 2002’, Bulletin of the
World Health Organization, 82(11):844-851.
Resnikoff S, Pascolini D, Mariotti SP, Pokharel GP (2008) ‘Global data of visual impairment
caused by uncorrected refractive errors in 2004’, Bulletin of the World Health
Organization, 86(1):63-70.
Royal New Zealand Foundation of the Blind (2006) The cost of blindness in New Zealand : final
report, report prepared by Gravitas Research and Strategy Ltd and Market Economics
Ltd.
Schelling (1968), ‘The life you save may be your own’ , Problems in public expenditure and
analysis, Brookings Institution, Washington DC, 127-162
Simmons D, Clover G, Hope C (2007) ‘Ethnic differences in diabetic retinopathy’, Diabetic
Medicine, 24: 1093–1098.
Smith TST, Frick KD, Holden BA, Fricke TR, Naidoo KS (2009) ‘Potential lost productivity
resulting from the global burden of uncorrected refractive error’, Bulletin of the World
Health Organization, 87: 431 - 437.
Economic impact of vision loss in New Zealand
89 Commercial-in-Confidence
Smith W, Assink J, Klein R et al (2001) ‘Risk factors for age-related macular degeneration:
pooled findings from three continents’, Ophthalmology, 108: 697-704
Smith W, Mitchell P and Seeder SR (1996) ‘Smoking and age-related maculopathy’, Archives of
Opthalmology, 114: 1518 - 1523.
Statistics New Zealand (2001), ‘Earnings and Employment Survey’,
http://www.stats.govt.nz/infoshare/SelectVariables.aspx?pxID=34b52fa0-9b76-4df3-
8128-155bbbbbf721, accessed 01 June 2010.
Statistics New Zealand (2002), ‘New Zealand Disability Survey Snapshot 6 - Sensory
Disabilities’,
http://www2.stats.govt.nz/domino/external/pasfull/pasfull.nsf/web/Media+Release+20
01+New+Zealand+Disability+Survey+Snapshot+6+Sensory+Disabilities, accessed 22 April
2010.
Statistics New Zealand (2007), ‘2006 Disability Survey’,
http://search.stats.govt.nz/search?af=&w=disability+survey+2006&date=, accessed 20
April 2010.
Statistics New Zealand (2009) ‘Consumers Price Index: June 2009 quarter’,
http://www.stats.govt.nz/browse_for_stats/economic_indicators/cpi_inflation/consum
erspriceindex_hotpjun09qtr.aspx, accessed 22 April 2010
Statistics New Zealand (2009a) ‘National Population Projections: 2009 (base)–2061’,
http://www.stats.govt.nz/browse_for_stats/population/estimates_and_projections/Nat
ionalPopulationProjections_HOTP09base-61.aspx, accessed 15 April 2010.
Statistics New Zealand (2009b) ‘Disability and Informal Care in New Zealand in 2006’,
http://www.stats.govt.nz/publications/socialconditions/disability-and-informal-care-in-
nz-in-2006.aspx, accessed 22 April 2010.
Statistics New Zealand (2009c) ‘Earnings by ethnicity, sex and age groups’,
http://www.stats.govt.nz/methods_and_services/access-data/TableBuilder/income-
tables.aspx, accessed 20 April 2010.
Statistics New Zealand (2009) ‘Household Income and Outlay Account (1987-2009), November
2009’,
http://www.stats.govt.nz/browse_for_stats/economic_indicators/NationalAccounts/Nat
ionalAccounts_HOTPyemar09/Tables.aspx, accessed 20 April 2010.
Statistics New Zealand (2010) ‘Consumers Price Index: December 2009 quarter’,
http://www.stats.govt.nz/browse_for_stats/economic_indicators/cpi_inflation/consum
erspriceindex_hotpdec09qtr.aspx, accessed 03 May 2010.
Stouthard M, Essink-Bot M, Bonsel G (1997) Disability weights for diseases in The Netherlands,
report for the Department of Public Health, Erasmus University, Rotterdam.
Tan, J, Wang, J, Flood, V, Rochtchina, E, Smith, W, Mitchell, P 2008, 'Dietary antioxidants and
the long-term incidence of age-related macular degeneration: The Blue Mountains Eye
Study', Ophthalmology, 115(2): 334-341.
Economic impact of vision loss in New Zealand
90 Commercial-in-Confidence
Tapp RJ, Shaw JE, Harper CA, de Courten MP, Balkau B, McCarty DJ, Taylor HR, Welborn TA and
Zimmet PZ (2003), ‘The Prevalence of and Factors Associated With Diabetic Retinopathy
in the Australian Population’, Diabetes Care, 26: 1731-1737, on behalf of the AusDiab
Study Group
Taylor HR, Livingston P, Stanislavsky Y, McCarty C (1997), ‘Visual impairment in Australia:
distance visual acuity, near vision, and visual field findings of the Melbourne Visual
Impairment Project’, American Journal of Ophthalmology, 123(3): 328-337.
Taylor HR, McCarty CA, Nanjan MB (2000), ‘Vision loss predicts five-year mortality’,
Transactions of the American Ophthalmological Society , 98: 91-96
The Diabetes Control and Complications Trial Research Group (DCCT) (1993) “The Effect of
Intensive Treatment of Diabetes on the Development and Progression of Long-Term
Complications in Insulin-Dependent Diabetes Mellitus”, NEJM, Volume 329(14):977-986,
September.
Tomany, S, Wang, J, Van Leeuwen, R, Klein, R, Mitchell, P, Vingerling, JR, Klein, BE, Smith, W,
De Jong, PR 2004, ‘Risk factors for incident age-related macular degeneration: pooled
findings from 3 continents’, Ophthalmology, 111(7): 1280-7.
Treasury (2007), 2007 Intergenerational Report, Department of the Treasury, Australian
Government, Canberra, 2007
UK Prospective Diabetes Study Group (UKPDS) (1998) “Intensive blood-glucose control with
sulphonylureas or insulin compared with conventional treatment and risk of
complications in patients with type 2 diabetes (UKPDS 33)”, The Lancet,
352(12):837-853.
UKPDS (2004) “Risks of Progression of Retinopathy and Vision Loss Related to Tight Blood
Pressure Control in type 2 Diabetes Mellitus UKPDS 69”, Arch Ophthalmol,
122:1631-1640.
Viscusi WK, Aldy JE (2002), The value of a statistical life: a critical review of market estimates
throughout the world, Discussion Paper No 392, Harvard Law School, Cambridge MA.
November www.law.harvard.edu/programs /olin_center/
Wang JJ, Mitchell P, Cumming R, Smith W (2003) ‘Visual impairment and nursing home
placement in older Australians: the Blue Mountains Eye Study’, Ophthalmic
Epidemiology, 10(1):3-13.
Wang JJ, Mitchell P, Smith W, Cumming RG, Leeder SR (2001) ‘Incidence of nursing home
placement in a defined community’, Medical Journal of Australia, 2001;174:271-275.
Wensor M, McCarty C, Stanislavsky Y, Livingston P, Taylor H (1998) “The prevalence of
glaucoma in the Melbourne Visual Impairment Project” Ophthalmology, 105: 733-9.
Wong E, Keeffe J, Rait J, Vu H, Le A, McCarty C, Taylor H (2004) ‘Detection of undiagnosed
glaucoma by eye health professionals’, Ophthalmology, 111 (8) : 1508 – 1514.
Economic impact of vision loss in New Zealand
91 Commercial-in-Confidence
World Health Organisation 2005, State of the World’s Sight, Vision 2020: the right to sight,
1999-2005, International Agency for the prevention of blindness.
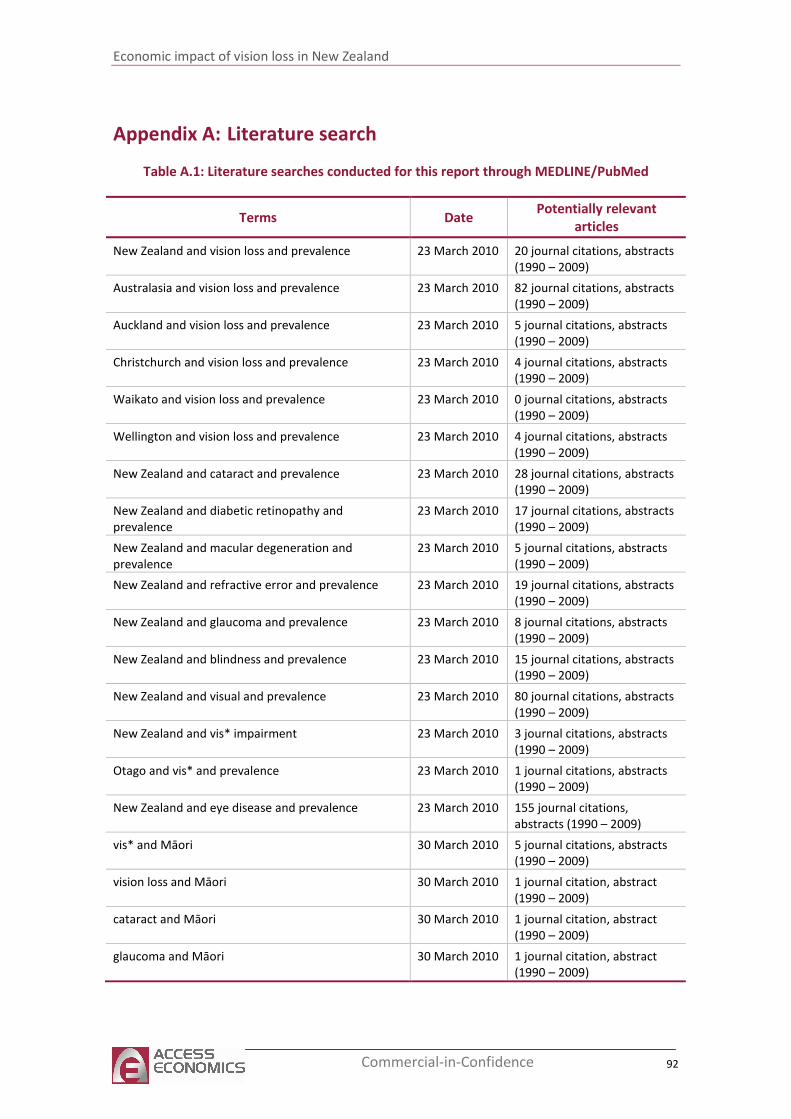
Economic impact of vision loss in New Zealand
92 Commercial-in-Confidence
Appendix A: Literature search
Table A.1: Literature searches conducted for this report through MEDLINE/PubMed
Terms Date Potentially relevant
articles
New Zealand and vision loss and prevalence 23 March 2010 20 journal citations, abstracts
(1990 – 2009)
Australasia and vision loss and prevalence 23 March 2010 82 journal citations, abstracts
(1990 – 2009)
Auckland and vision loss and prevalence 23 March 2010 5 journal citations, abstracts
(1990 – 2009)
Christchurch and vision loss and prevalence 23 March 2010 4 journal citations, abstracts
(1990 – 2009)
Waikato and vision loss and prevalence 23 March 2010 0 journal citations, abstracts
(1990 – 2009)
Wellington and vision loss and prevalence 23 March 2010 4 journal citations, abstracts
(1990 – 2009)
New Zealand and cataract and prevalence 23 March 2010 28 journal citations, abstracts
(1990 – 2009)
New Zealand and diabetic retinopathy and
prevalence
23 March 2010 17 journal citations, abstracts
(1990 – 2009)
New Zealand and macular degeneration and
prevalence
23 March 2010 5 journal citations, abstracts
(1990 – 2009)
New Zealand and refractive error and prevalence 23 March 2010 19 journal citations, abstracts
(1990 – 2009)
New Zealand and glaucoma and prevalence 23 March 2010 8 journal citations, abstracts
(1990 – 2009)
New Zealand and blindness and prevalence 23 March 2010 15 journal citations, abstracts
(1990 – 2009)
New Zealand and visual and prevalence 23 March 2010 80 journal citations, abstracts
(1990 – 2009)
New Zealand and vis* impairment 23 March 2010 3 journal citations, abstracts
(1990 – 2009)
Otago and vis* and prevalence 23 March 2010 1 journal citations, abstracts
(1990 – 2009)
New Zealand and eye disease and prevalence 23 March 2010 155 journal citations,
abstracts (1990 – 2009)
vis* and Māori 30 March 2010 5 journal citations, abstracts
(1990 – 2009)
vision loss and Māori 30 March 2010 1 journal citation, abstract
(1990 – 2009)
cataract and Māori 30 March 2010 1 journal citation, abstract
(1990 – 2009)
glaucoma and Māori 30 March 2010 1 journal citation, abstract
(1990 – 2009)
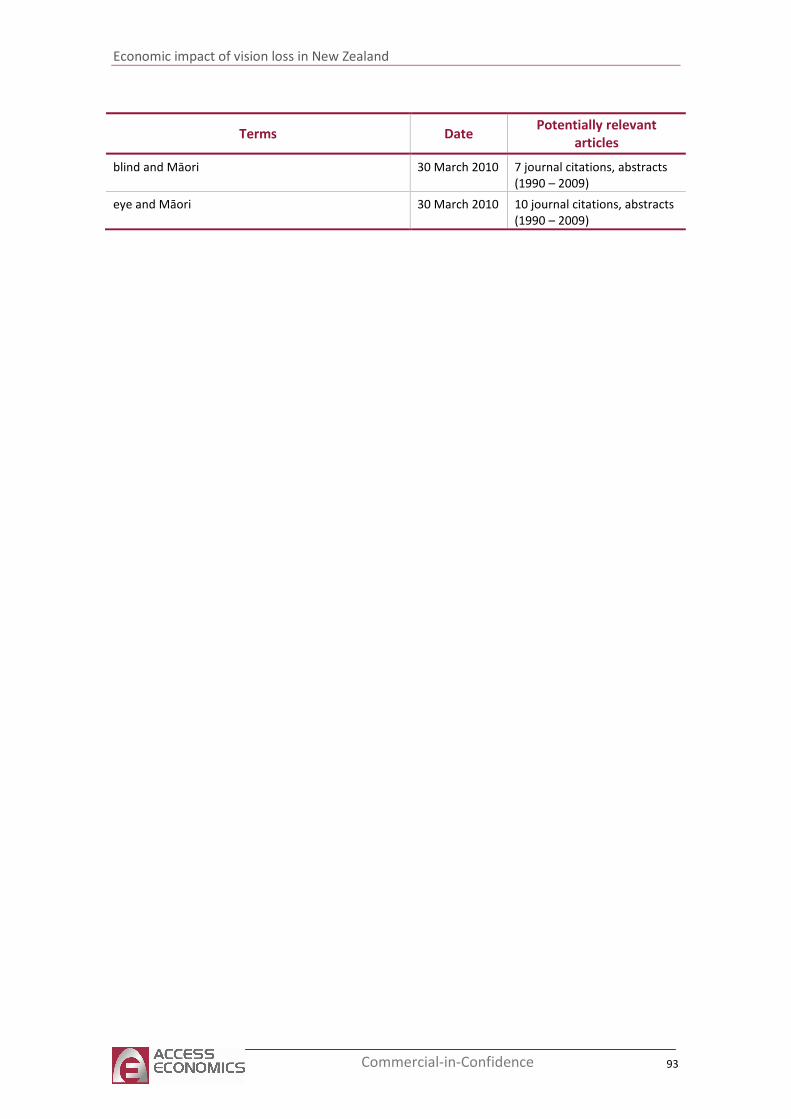
Economic impact of vision loss in New Zealand
93 Commercial-in-Confidence
Terms Date Potentially relevant
articles
blind and Māori 30 March 2010 7 journal citations, abstracts
(1990 – 2009)
eye and Māori 30 March 2010 10 journal citations, abstracts
(1990 – 2009)