Embed Size (px)
Citation preview

JPMorgan European Smaller Companies Trust plcHalf Year Report & Accounts for the six months ended 30th September 2014
Half Year Report2014/15

Features
Contents
About the Company
1 Half Year Performance 2 Chairman’s Statement 4 Investment Managers’ Report
Investment Review
6 List of Investments 8 Portfolio Analyses
Accounts
10 Income Statement 11 Reconciliation of Movements inShareholders’ Funds
12 Balance Sheet 13 Cash Flow Statement 14 Notes to the Accounts 16 Interim Management Report
Shareholder Information
17 Glossary of Terms and Definitions21 Information about the Company
Objective
Capital growth from smaller European companies (excluding the United Kingdom).
Investment Policies
– To invest in a diversified portfolio of smaller companies in Europe, excluding theUnited Kingdom.
– To manage liquidity and borrowings to increase potential returns to shareholders.The Board’s current policy is to be between 20% net cash and 20% geared.
– To emphasise capital growth rather than income. Therefore shareholders shouldexpect the dividend to vary from year to year.
– To invest no more than 15% of gross assets in other UK listed investment companies(including investment trusts).
Risk
It should be noted that the Company invests in the shares of smaller companies,which tend to be more volatile than those of larger companies. The Company alsoemploys gearing to generate greater returns. The Company’s shares should thereforebe regarded as carrying greater than average risk.
Benchmark
Euromoney Smaller European Companies (ex UK) Total Return Index in sterlingterms, formerly known as the HSBC Smaller European Companies (ex UK) TotalReturn Index in sterling terms.
Capital Structure
At 30th September 2014, the Company’s share capital comprised 160,147,885ordinary shares of 5p each. There were no shares held in Treasury.
Management Company
The Company employs JPMorgan Funds Limited (‘JPMF’ or the ‘Manager’) as itsAlternative Investment Fund Manager. JPMF delegates the management of theCompany’s portfolio to JPMorgan Asset Management (UK) Limited (‘JPMAM’).
FCA regulation of ‘non-mainstream pooled investments’
The Company currently conducts its affairs so that the shares it issues can berecommended by Independent Financial Advisers to ordinary retail investors inaccordance with the rules of the Financial Conduct Authority (‘FCA’) in relation tonon-mainstream investment products and intends to continue to do so for theforeseeable future.
The shares are excluded from the FCA’s restrictions which apply to non-mainstreaminvestment products because they are shares in an investment trust.

JPMorgan European Smaller Companies Trust plc. Half Year Report & Accounts 2014 1
–17.9%Return to shareholders1
–16.6%Return on net assets2
Financial Data30th September 31st March %
2014 2014 change
Shareholders’ funds (£’000) 359,410 433,493 –17.1
Number of shares in issue 160,147,885 160,147,8854 —
Net asset value per share 224.4p 270.7p4 –17.1
Share price 195.5p 240.0p4 –18.5
Share price discount to net asset value per share 12.9% 11.3%
Ongoing Charges5 1.33% 1.31%
A glossary of terms and definitions is provided on page 17.1Source: Morningstar.2Source: J.P. Morgan.3Source: Morningstar. The Company’s benchmark is Euromoney Smaller European Companies (ex UK) Total Return Indexin sterling terms (formerly the HSBC Smaller European Companies (ex UK) Total Return Index in sterling terms).4Comparative figures for the year ended 31st March 2014 have been restated following the stock split of each existingordinary share of 25 pence into five ordinary shares of 5 pence each, effective 23rd July 2014.
5Estimated annualisedmanagement fee and all other operating expenses, excluding finance costs, expressed as apercentage of the average of the daily net assets during the period. Ongoing charges are calculated in accordance withguidance issued by the Association of Investment Companies in May 2012.
–9.5%Benchmark return3
Half Year Performancefor the six months ended 30th September 2014
Total returns (includes dividends reinvested)

JPMorgan European Smaller Companies Trust plc. Half Year Report & Accounts 20142
Chairman’s Statement
Performance
The past six months were a difficult period for European markets and also yourCompany. For the six months ended 30th September 2014, the Company produced atotal return on net assets of –16.6%, underperforming the benchmark index, theEuromoney Smaller European Companies (ex UK) Index in sterling terms by 7.1%.The discount on the Company’s shares widened from 11.3% to 12.9% over thisreporting period. The total return to shareholders was –17.9%.
Longer term performance remains very positive, with a total return on net assetsof +262.5% against the benchmark total return of +172.1% over the ten years ended30th September 2014 (+43.2% versus +36.2% over five years). In their report, theInvestment Managers provide details of the key factors driving performance duringthe first six months of the Company’s financial year.
Revenue and Dividend
As detailed in my Chairman’s Statement for the year ended 31st March 2014, theBoard’s dividend policy is to pay out the vast majority of revenue available each year.However, shareholders are reminded that the Company’s objective is to achieve capitalgrowth and management of the portfolio is not constrained to deliver income in anyone period. Gross revenue return for the six months to 30th September 2014 wasslightly higher than the corresponding period in 2013 at £7.6million (2013: £7.5 million).
The Board has decided to pay an interim dividend of 1.2 pence per share(2013: 6.0 pence; or 1.2 pence adjusted for the stock split), which will be paid on14th January 2015 to shareholders on the register as at 19th December 2014(ex-dividend date 18th December 2014). The reduction in the level of interim dividendcompared with last year is due to the stock split detailed below.
Stock Split
Following shareholder approval at the Annual General Meeting held on 8th July 2014,each of the Company’s ordinary shares of 25 pence each were sub-divided into fiveordinary shares of 5 pence each, effective 23rd July 2014.
Management Fees
The Board has agreed a reduction in the Company’s management fees from 1.3%of market capitalisation to 1.0% of net assets. This change will be effective from1st April 2015.
Alternative Investment Fund Managers Directive (‘AIFMD’)
As required under AIFMD, with effect from 1st July 2014, the Company appointedJPMorgan Funds Limited as its Alternative Investment Fund Manager under a newinvestment management agreement. Portfolio management is delegated byJPMorgan Funds Limited to JPMorgan Asset Management (UK) Limited, thus retainingprevious portfolio management arrangements. The management fee and noticeperiod arrangements remain unchanged. The Company appointed BNY Mellon Trust

JPMorgan European Smaller Companies Trust plc. Half Year Report & Accounts 2014 3
& Depositary (UK) Limited to act as the Company’s Depositary, a new requirementunder AIFMD. JPMorgan Chase Bank, NA remains the Company’s Custodian, but as adelegate of the Depositary. JPMorgan Funds Limited was also appointed as CompanySecretary to the Company on 1st July 2014.
Outlook
Despite the recent disappointing economic news from Europe, company results aremeeting expectations and our Investment Managers report that companymanagement remain positive about their companies’ future profit prospects.
Carolan DobsonChairman 25th November 2014

JPMorgan European Smaller Companies Trust plc. Half Year Report & Accounts 20144
Investment Managers’ Report
Review
The first six months of the Company’s 2014/15 year proved a frustrating time forinvestors in European equities as the nascent economic recovery began to stall andthere was a sharp reversal of the previous twelve months’ positive flows into theasset class. There was no shortage of headlines to stoke investor fears: deflation,collapsing oil price, the outbreak of Ebola, turmoil in the Middle East and economicsanctions against Russia. However, it is the last of these which has had the mostimmediate impact, driving a drop in both exports and industrial production inGermany in August. This prompted the German government to cut its GDP growthoutlook for this year from 1.8% to 1.2% and for next year from 2.0% to 1.3%.In response, German bond yields continued to collapse to a new record low, endingthe period at just 0.95%. Over the six months to 30th September 2014, the largecompany MSCI Europe (ex UK) Index declined by 2.3% in sterling terms. Smallercompanies suffered most from the market sell-off and the benchmark EuromoneySmaller European Companies (ex UK) Index fell by 9.5%.
Portfolio
Following exceptionally strong absolute and relative returns in the fiscal year to31st March 2014, the first half of the new year was challenging for the portfolio onboth fronts with a decline in the net asset value of 16.6%, 7.1% behind the return ofthe benchmark index. Whilst there was a small negative contribution from both assetallocation – being underweight defensive sectors, and holding gearing in a fallingmarket, stock selection was the principal detractor. The re-emergent initial publicoffering market in Europe proved particularly disappointing with new holdings inonline travel businesses Edreams Odigeo in Spain and Bravofly Rumbo in Switzerlandboth issuing significant profit warnings with their debut quarterly results. Italian autocomponents business Sogefi suffered from its exposure to the slowing Brazilianeconomy and Dutch construction group Royal Bam experienced cost over-runs on anumber of projects.
The major shift in portfolio positioning was a reduction in gearing from 12.6% at theend of March to net cash of 2.5% at the end of September as economic uncertaintyand the set-back in markets in Europe offset the benign messages we have beenreceiving from corporate management. Sectorally, the biggest shift has been areduction in the large overweight in engineering following a significant re-rating andwith earnings momentum slowing; disposals included Lindab, Nibe and Trelleborgin Sweden and Jungheinrich and Wacker Neuson in Germany and Bucher Industriesin Switzerland. Geographically, Sweden has offered some of the most attractiveopportunities and new purchases included online gaming businesses Betsson, NetEntertainment and Unibet, credit management services supplier Intrum Justitia,cash management specialist Loomis and outdoor maintenance equipment producerHusqvarna. The weak oil price has led us to move further underweight in Norway.
Francesco Conte
Jim Campbell
JPMorgan European Smaller Companies Trust plc. Half Year Report & Accounts 2014 5
Outlook
The good news is that the financial performance of corporate Europe continues tooutpace significantly that of sovereign Europe. October Purchasing Managers Indicesfor the Euro area were encouragingly ahead of expectations, for both services andmanufacturing, and the third quarter reporting season has produced the highestshare of companies exceeding forecasts in four years, according to Deutsche Bank.Even on reduced expectations, Euro area gross domestic product is forecast to growby close to 1.0% this year and next whilst in the US growth is expected to acceleratefrom around 2.0% this year to 3.0% in 2015. Moreover, the October Bank LendingSurvey showed that overall credit conditions (supply and demand) for the Euro areaare easing at the fastest pace since 2006. The greatest risk, perhaps, is that thenegative news headlines become a self-fulfilling prophecy in Europe and thatfinancially flush corporates, and somewhat less flush consumers, hold off investingand spending; with a Euro area interest rate of just 0.05%, the European CentralBank’s options for stimulus are becoming more limited.
In spite of the macro background, European earnings have been recovering since thefirst quarter of 2013 and smaller company earnings have been growing fastest. Wecontinue to find well managed businesses with strong franchises, sound balancesheets, positive operating momentum and attractive valuations in which to invest.
Jim CampbellFrancesco ConteInvestment Managers 25th November 2014

JPMorgan European Smaller Companies Trust plc. Half Year Report & Accounts 20146
ValuationCompany Country £’000 %
Jazztel Spain 9,359 2.3Huhtamaki Finland 8,502 2.1Topdanmark Denmark 8,312 2.1Sopra France 8,245 2.1Intrum Justitia Sweden 8,095 2.0Haulotte France 7,771 1.9Trigano France 7,742 1.9Drillisch Germany 7,704 1.9Saft France 7,636 1.9Temenos Switzerland 7,633 1.9Geox Italy 7,518 1.9AMS Switzerland 7,402 1.9Helvetia Switzerland 7,379 1.9Altran Technologies France 7,365 1.8TKH Netherlands 7,327 1.8Banco Popolare Italy 7,314 1.8Aareal Bank Germany 7,270 1.8Ubisoft France 7,156 1.8Straumann Switzerland 7,102 1.8Gamesa Spain 6,967 1.7GAM Switzerland 6,914 1.7Husqvarna Sweden 6,900 1.7Flughafen Zürich Switzerland 6,793 1.7Fastighets Balder Sweden 6,581 1.7Hexpol Sweden 6,428 1.6NKT Denmark 6,419 1.6Teleperformance France 6,256 1.6JM Sweden 6,132 1.5SIAS Italy 6,020 1.5Royal Unibrew Denmark 5,888 1.5Loomis Sweden 5,881 1.5BillerudKorsnäs Sweden 5,838 1.5Gagfah Germany 5,821 1.5CFE Belgium 5,818 1.5IMCD Netherlands 5,512 1.4De’Longhi Italy 5,457 1.4Alten France 5,416 1.4Aalberts Industries Netherlands 5,413 1.4
List of Investmentsat 30th September 2014

JPMorgan European Smaller Companies Trust plc. Half Year Report & Accounts 2014 7
ValuationCompany Country £’000 %
Credito Emiliano Italy 5,405 1.4Bechtle Germany 5,390 1.4Datalogic Italy 4,959 1.2KUKA Germany 4,906 1.2Eurofins Scientific France 4,840 1.2Betsson Sweden 4,825 1.2Unibet Sweden 4,776 1.2Bolsas Y Mercados Espanoles Spain 4,750 1.2Haldex Sweden 4,672 1.2CTS Eventim Germany 4,598 1.2SFS Switzerland 4,301 1.1Faiveley Transport France 4,137 1.0Arseus Belgium 4,004 1.0Archer Norway 3,885 1.0Burckhardt Compression Switzerland 3,709 0.9Nutreco Netherlands 3,520 0.9Sogefi Italy 3,183 0.8Net Entertainment Sweden 2,738 0.7Fourlis Greece 2,520 0.6TUBACEX Spain 2,423 0.6ID Logistics France 1,906 0.5Jumbo Greece 856 0.2Indutrade Sweden 707 0.2USG People Netherlands 390 0.1
Total investments 350,686 88.0
JPM Euro Liquidity Fund Liquidity fund 31,356 7.9Net current assets 16,329 4.1
Total assets less current liabilities 398,371 100.0

at 30th September 2014 at 31st March 2014Portfolio Benchmark Portfolio Benchmark
Geographical % % % %
France 17.1 13.1 14.9 12.9Sweden 16.0 11.5 6.0 10.7Switzerland 12.9 10.6 9.5 10.0Italy 10.0 11.1 19.8 12.3Germany 9.0 14.1 14.8 12.9Spain 5.8 8.0 7.5 7.7Netherlands 5.6 4.0 9.7 4.6Denmark 5.2 3.5 2.9 3.6Belgium 2.5 4.7 3.3 4.3Finland 2.1 4.3 2.8 4.9Norway 1.0 5.5 — 6.0Greece 0.8 1.8 4.5 2.5Austria — 4.3 2.1 3.6Portugal — 2.0 3.8 2.3Ireland — 1.4 1.0 1.2Luxembourg — 0.1 — 0.1United States1 — — — 0.4
Total equities 88.0 100.0 102.6 100.0Liquidity Fund 7.9 — 2.1 —Net current assets/(liabilities) 4.1 — (4.7) —
Total 100.0 100.0 100.0 100.0
Based on total assets less current liabilities of £398.4m (31st March 2014: £474.8m).1European companies listed in the United States.
Portfolio Analyses
JPMorgan European Smaller Companies Trust plc. Half Year Report & Accounts 20148

JPMorgan European Smaller Companies Trust plc. Half Year Report & Accounts 2014 9
at 30th September 2014 at 31st March 2014Portfolio Benchmark Portfolio Benchmark
Sector % % % %
Industrials 26.3 24.3 38.1 24.1Financials 15.0 20.3 11.2 19.8Information Technology 14.1 7.0 12.6 8.2Consumer Discretionary 13.7 14.5 21.0 14.8Materials 7.2 7.4 7.0 7.6Telecommunication Services 4.3 2.1 5.1 2.3Health Care 4.0 9.9 3.1 9.1Consumer Staples 2.4 6.5 4.5 6.1Energy 1.0 4.4 — 4.3
Utilities — 3.6 — 3.7
Total equities 88.0 100.0 102.6 100.0Liquidity fund 7.9 — 2.1 —Net current assets/(liabilities) 4.1 — (4.7) —
Total 100.0 100.0 100.0 100.0
Based on total assets less current liabilities of £398.4m (31st March 2014: £474.8m).

(Unaudited) (Unaudited) (Audited)Six months ended Six months ended Year ended
30th September 2014 30th September 2013 31st March 2014Revenue Capital Total Revenue Capital Total Revenue Capital Total£’000 £’000 £’000 £’000 £’000 £’000 £’000 £’000 £’000
(Losses)/gains on investments held at fair value through profit or loss — (78,193) (78,193) — 54,137 54,137 — 126,985 126,985
Net foreign currency gains/(losses) — 3,200 3,200 — (148) (148) — 1,261 1,261Income from investments 7,478 — 7,478 7,450 — 7,450 7,986 — 7,986Other interest receivable and similar income 133 — 133 25 — 25 30 — 30
Gross return/(loss) 7,611 (74,993) (67,382) 7,475 53,989 61,464 8,016 128,246 136,262Management fee (697) (1,625) (2,322) (601) (1,403) (2,004) (1,314) (3,067) (4,381)Other administrative expenses (306) — (306) (306) — (306) (762) — (762)
Net return/(loss) on ordinaryactivities before finance costsand taxation 6,608 (76,618) (70,010) 6,568 52,586 59,154 5,940 125,179 131,119
Finance costs (175) (408) (583) (115) (268) (383) (267) (623) (890)
Net return/(loss) on ordinaryactivities before taxation 6,433 (77,026) (70,593) 6,453 52,318 58,771 5,673 124,556 130,229
Taxation (751) — (751) (384) — (384) (626) — (626)
Net return/(loss) on ordinaryactivities after taxation 5,682 (77,026) (71,344) 6,069 52,318 58,387 5,047 124,556 129,603
Return/(loss) per share (note 4) 3.55p (48.10)p (44.55)p 3.47p 29.90p 33.37p 2.99p 73.76p 76.75p
All revenue and capital items in the above statement derive from continuing operations. No operations were acquired ordiscontinued in the period.
The ‘Total’ column of this statement is the profit and loss account of the Company and the ‘Revenue’ and ‘Capital’ columnsrepresent supplementary information prepared under guidance issued by The Association of Investment Companies. The Totalcolumn represents all the information that is required to be disclosed in a Statement of Total Recognised Gains and Losses(‘STRGL’). For this reason a STRGL has not been presented.
Income Statementfor the six months ended 30th September 2014
JPMorgan European Smaller Companies Trust plc. Half Year Report & Accounts 201410

JPMorgan European Smaller Companies Trust plc. Half Year Report & Accounts 2014 11
Called up CapitalSix months ended share Share redemption Capital Revenue30th September 2014 capital premium reserve reserves reserve Total(Unaudited) £’000 £’000 £’000 £’000 £’000 £’000
At 31st March 2014 8,008 1,312 7,628 411,139 5,406 433,493Expenses incurred due to stock split — — — (16) — (16)Net (loss)/return on ordinary activities — — — (77,026) 5,682 (71,344)Dividends appropriated in the period — — — — (2,723) (2,723)
At 30th September 2014 8,008 1,312 7,628 334,097 8,365 359,410
Called up CapitalSix months ended share Share redemption Capital Revenue30th September 2013 capital premium reserve reserves reserve Total(Unaudited) £’000 £’000 £’000 £’000 £’000 £’000
At 31st March 2013 8,946 1,312 6,690 326,476 5,683 349,107Repurchase and cancellation of the Company’sown shares (588) — 588 (24,420) — (24,420)
Net return on ordinary activities — — — 52,318 6,069 58,387 Dividends appropriated in the period — — — — (3,378) (3,378)
At 30th September 2013 8,358 1,312 7,278 354,374 8,374 379,696
Called up CapitalYear ended share Share redemption Capital Revenue31st March 2014 capital premium reserve reserves reserve Total(Audited) £’000 £’000 £’000 £’000 £’000 £’000
At 31st March 2013 8,946 1,312 6,690 326,476 5,683 349,107Repurchase and cancellation of the Company’sown shares (938) — 938 (39,893) — (39,893)
Net return on ordinary activities — — — 124,556 5,047 129,603Dividends appropriated in the year — — — — (5,324) (5,324)
At 31st March 2014 8,008 1,312 7,628 411,139 5,406 433,493
Reconciliation of Movements inShareholders’ Funds

(Unaudited) (Unaudited) (Audited)30th September 2014 30th September 2013 31st March 2014
£’000 £’000 £’000
Fixed assetsInvestments held at fair value through profit or loss 350,686 382,789 487,344Investments in liquidity funds held at fair value through profit or loss 31,356 37,657 10,003
Total investments 382,042 420,446 497,347
Current assetsDerivative financial instruments — 2 3Debtors 9,095 16,423 19,179Cash and short term deposits 8,792 1,419 5,434
17,887 17,844 24,616Creditors: amounts falling due within one year (1,540) (33,515) (47,134)Derivative financial instruments (18) (2) —
Net current assets/(liabilities) 16,329 (15,673) (22,518)
Total assets less current liabilities 398,371 404,773 474,829
Creditors: amounts falling due after more thanone year (38,961) (25,077) (41,336)
Net assets 359,410 379,696 433,493
Capital and reservesCalled up share capital 8,008 8,358 8,008Share premium 1,312 1,312 1,312Capital redemption reserve 7,628 7,278 7,628Capital reserves 334,097 354,374 411,139Revenue reserve 8,365 8,374 5,406
Equity shareholders’ funds 359,410 379,696 433,493
Net asset value per share (note5) 224.4p 227.2p 270.7p
Company registration number: 2431143
Balance Sheetat 30th September 2014
JPMorgan European Smaller Companies Trust plc. Half Year Report & Accounts 201412

JPMorgan European Smaller Companies Trust plc. Half Year Report & Accounts 2014 13
(Unaudited) (Unaudited) (Audited)Six months ended Six months ended Year ended
30th September 2014 30th September 2013 31st March 2014£’000 £’000 £’000
Net cash inflow from operating activities (note6) 3,798 4,024 1,491Net cash outflow from returns on investments and servicing of finance (580) (382) (879)
Overseas tax recovered 223 297 389Net cash inflow from capital expenditure and financial investment 30,745 34,125 36,957
Dividend paid (2,723) (3,378) (5,324)Net cash outflow from financing (27,836) (32,743) (27,212)
Increase in cash in the period 3,627 1,943 5,422
Reconciliation of net cash flow to movement in net debt
Net cash movement 3,627 1,943 5,422Net loans drawn down/(repaid) in the period 27,820 8,322 (12,682)Exchange movements 3,221 (150) 1,273
Movement in net funds in the period 34,668 10,115 (5,987)Net debt at the beginning of the period (64,837) (58,850) (58,850)
Net debt at the end of the period (30,169) (48,735) (64,837)
Represented by:Cash and short term deposits and bank overdrafts 8,792 1,419 5,434Debt falling due within one year — (25,077) (28,935)Debt falling due in more than two years but not more than five years (38,961) (25,077) (41,336)
Net debt at the end of the period (30,169) (48,735) (64,837)
Cash Flow Statementfor the six months ended 30th September 2014

1. Financial statements
The information contained within the financial statements in this half year report has not been audited or reviewed by theCompany’s auditors. The figures and financial information for the year ended 31st March 2014 are extracted from the latestpublished accounts of the Company and do not constitute statutory accounts for that year. Those accounts have beendelivered to the Registrar of Companies and included the report of the auditors which was unqualified and did not contain astatement under either Section 498(2) or 498(3) of the Companies Act 2006.
2. Accounting policies
The accounts have been prepared in accordance with United Kingdom Generally Accepted Accounting Practice (‘UK GAAP’)and with the Statement of Recommended Practice ‘Financial Statements of Investment Trust Companies and Venture CapitalTrusts’ issued by the Association of Investment Companies in January 2009.
All of the Company’s operations are of a continuing nature.
The accounting policies applied to these half year accounts are consistent with those applied in the accounts for the yearended 31st March 2014.
3. Dividends
(Unaudited) (Unaudited) (Audited)Six months ended Six months ended Year ended
30th September 2014 30th September 2013 31st March 2014£’000 £’000 £’000
Final dividend in respect of the year ended 31st March 2014 of 8.5p (2013: 10.0p) 2,723 3,378 3,378
Interim dividend in respect of the year ended31st March 2013 of 6.0p — — 1,946
Total dividends paid in the year 2,723 3,378 5,324
An interim dividend of 1.2p (2013: 6.0p) has been declared in respect of the six months ended 30th September 2014,amounting to £1,922,000.
Notes to the Accountsfor the six months ended 30th September 2014
JPMorgan European Smaller Companies Trust plc. Half Year Report & Accounts 201414
JPMorgan European Smaller Companies Trust plc. Half Year Report & Accounts 2014 15
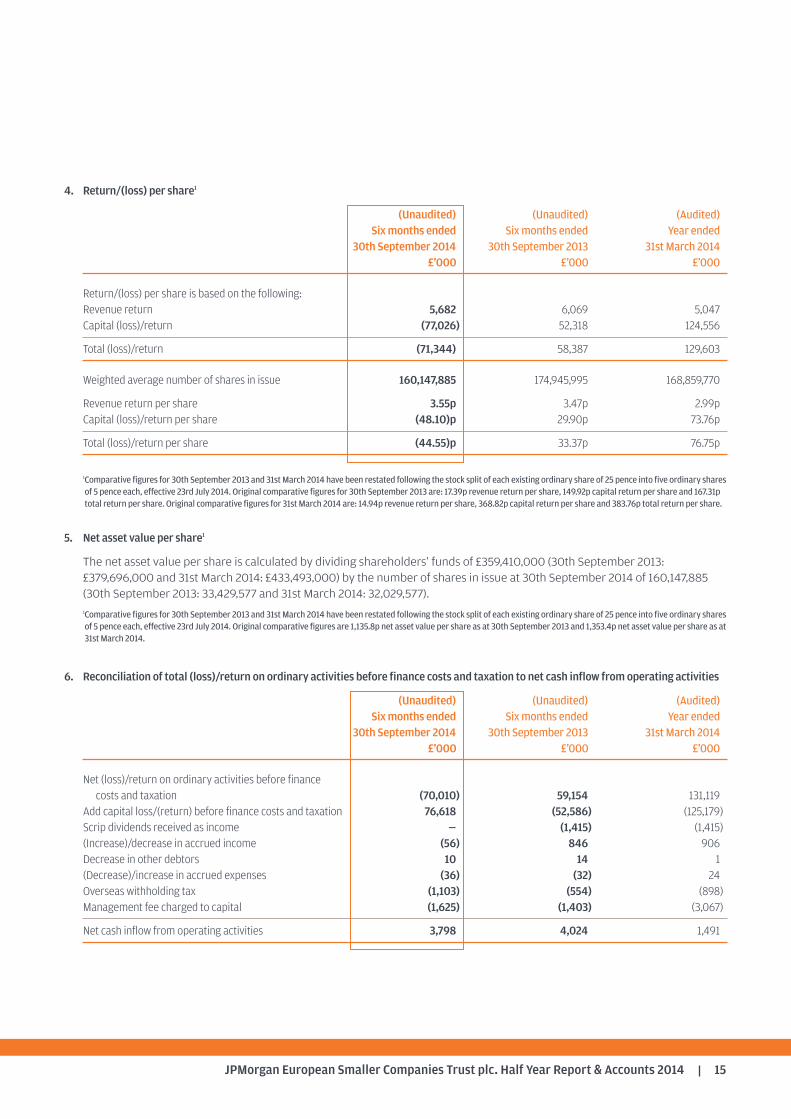
4. Return/(loss) per share1
(Unaudited) (Unaudited) (Audited)Six months ended Six months ended Year ended
30th September 2014 30th September 2013 31st March 2014£’000 £’000 £’000
Return/(loss) per share is based on the following:Revenue return 5,682 6,069 5,047Capital (loss)/return (77,026) 52,318 124,556
Total (loss)/return (71,344) 58,387 129,603
Weighted average number of shares in issue 160,147,885 174,945,995 168,859,770
Revenue return per share 3.55p 3.47p 2.99pCapital (loss)/return per share (48.10)p 29.90p 73.76p
Total (loss)/return per share (44.55)p 33.37p 76.75p
1Comparative figures for 30th September 2013 and 31st March 2014 have been restated following the stock split of each existing ordinary share of 25 pence into five ordinary sharesof 5 pence each, effective 23rd July 2014. Original comparative figures for 30th September 2013 are: 17.39p revenue return per share, 149.92p capital return per share and 167.31ptotal return per share. Original comparative figures for 31st March 2014 are: 14.94p revenue return per share, 368.82p capital return per share and 383.76p total return per share.
5. Net asset value per share1
The net asset value per share is calculated by dividing shareholders’ funds of £359,410,000 (30th September 2013:£379,696,000 and 31st March 2014: £433,493,000) by the number of shares in issue at 30th September 2014 of 160,147,885(30th September 2013: 33,429,577 and 31st March 2014: 32,029,577). 1Comparative figures for 30th September 2013 and 31st March 2014 have been restated following the stock split of each existing ordinary share of 25 pence into five ordinary sharesof 5 pence each, effective 23rd July 2014. Original comparative figures are 1,135.8p net asset value per share as at 30th September 2013 and 1,353.4p net asset value per share as at31st March 2014.
6. Reconciliation of total (loss)/return on ordinary activities before finance costs and taxation to net cash inflow from operating activities
(Unaudited) (Unaudited) (Audited)Six months ended Six months ended Year ended
30th September 2014 30th September 2013 31st March 2014£’000 £’000 £’000
Net (loss)/return on ordinary activities before finance costs and taxation (70,010) 59,154 131,119
Add capital loss/(return) before finance costs and taxation 76,618 (52,586) (125,179)Scrip dividends received as income — (1,415) (1,415)(Increase)/decrease in accrued income (56) 846 906Decrease in other debtors 10 14 1(Decrease)/increase in accrued expenses (36) (32) 24Overseas withholding tax (1,103) (554) (898)Management fee charged to capital (1,625) (1,403) (3,067)
Net cash inflow from operating activities 3,798 4,024 1,491

The Company is required to make the following disclosures inits half year report:
Principal Risks andUncertainties
The principal risks and uncertainties faced by the Companyhave not changed and fall into the following broad categories:investment and strategy; market; accounting, legal andregulatory; corporate governance and shareholder relations;operational going concern and financial. Information on each ofthese areas is given in the Business Review within the AnnualReport and Accounts for the year ended 31st March 2014.
RelatedParty Transactions
During the first six months of the current financial year, notransactions with related parties have taken place which havematerially affected the financial position or the performance ofthe Company.
Going Concern
The Directors believe, having considered the Company’sinvestment objectives, risk management policies, capitalmanagement policies and procedures, nature of the portfolioand expenditure projections, that the Company has adequateresources, an appropriate financial structure and suitablemanagement arrangements in place to continue in operationalexistence for the foreseeable future. For these reasons, theyconsider there is reasonable evidence to continue to adopt thegoing concern basis in preparing the accounts.
Directors’ Responsibilities
The Board of Directors confirms that, to the best of itsknowledge:
(i) the condensed set of financial statements containedwithin the half yearly financial report has beenprepared in accordance with the Accounting StandardsBoard’s Statement ‘Half Yearly Financial Reports’ andgives a true and fair view of the state of affairs of theCompany and of the assets, liabilities, financial positionand net return of the Company, as at 30th September2014, as required by the UK Listing Authority Disclosureand Transparency Rules 4.2.4R; and
(ii) the interim management report includes a fair review ofthe information required by 4.2.7R and 4.2.8R of the UKListing Authority Disclosure and Transparency Rules.
In order to provide these confirmations, and in preparing thesefinancial statements, the Directors are required to:
• select suitable accounting policies and then apply themconsistently;
• make judgements and accounting estimates that arereasonable and prudent;
• state whether applicable UK Accounting Standards havebeen followed, subject to any material departures disclosedand explained in the financial statements; and
• prepare the financial statements on the going concern basisunless it is inappropriate to presume that the Company willcontinue in business;
and the Directors confirm that they have done so.
For and on behalf of the BoardCarolan DobsonChairman 25th November 2014
Interim Management Report
JPMorgan European Smaller Companies Trust plc. Half Year Report & Accounts 201416

JPMorgan European Smaller Companies Trust plc. Half Year Report & Accounts 2014 17
Glossary of Terms and Definitions
Return to Shareholders
Total return to the investor on a mid-market price tomid-market price basis, assuming that all dividends receivedwere reinvested, without transaction costs, into the shares ofthe Company at the time the shares were quoted ex-dividend.
Return on Net Assets
Total return on net asset value (‘NAV’) per share, on a bid valueto bid value basis, assuming that all dividends paid out by theCompany were reinvested, without transaction costs, into theshares of the Company at the NAV per share at the time theshares were quoted ex-dividend.
In accordance with industry practice, dividends payable whichhave been declared but which are unpaid at the balance sheetdate are deducted from the NAV when calculating the totalreturn on net assets.
BenchmarkReturn
Total return on the benchmark, on a mid-market value tomid-market value basis, assuming that all dividends receivedwere reinvested, without transaction costs, into the shares ofthe underlying companies at the time the shares were quotedex-dividend.
The benchmark is a recognised index of stocks which shouldnot be taken as wholly representative of the Company’sinvestment universe. The Company’s investment strategy does
not ‘track’ this index and consequently, there may be somedivergence between the Company’s performance and that ofthe benchmark.
Gearing/(Net Cash)
Gearing represents the excess amount above shareholders’funds of total assets expressed as a percentage of theshareholders’ funds. Total assets include total investments andnet current assets/liabilities less cash/cash equivalents andexcluding bank loans of less than one year. If the amountcalculated is negative, this is shown as a ‘net cash’ position.
SharePriceDiscount/Premium toNet Asset Value (‘NAV’) Per Share
If the share price of an investment trust is lower than theNAV per share, the shares are said to be trading at a discount.The discount is shown as a percentage of the NAV per share.The opposite of a discount is a premium. It is more commonfor an investment trust’s shares to trade at a discount than ata premium.
Ongoing Charges
Estimated annualised management fee and all other operatingexpenses, excluding finance costs, expressed as a percentageof the average of the daily net assets during the period.Ongoing Charges are calculated in accordance with guidanceissued by the Association of Investment Companies in May2012.
Fraudsters use persuasive and high-pressure tactics to lure investors into scams. They may offer to sell shares that turn out to beworthless or non-existent, or to buy shares at an inflated price in return for an upfront payment. While high profits are promised, ifyou buy or sell shares in this way you will probably lose your money.
Keep in mind that firms authorised by the FCAare unlikely to contact you out of the blue withan offer to buy or sell shares.
Do not get into a conversation, note the nameof the person and firm contacting you and thenend the call.
Check the Financial Services Register fromwww.fca.org.uk to see if the person and firmcontacting you is authorised by the FCA.
Beware of fraudsters claiming to be from anauthorised firm, copying its website or givingyou false contact details.
Use the firm’s contact details listed on theRegister if you want to call it back.
Call the FCA on 0800 111 6768 if the firm doesnot have contact details on the Register or youare told they are out of date.
Search the list of unauthorised firms to avoid atwww.fca.org.uk/scams.
Consider that if you buy or sell shares from anunauthorised firm you will not have access to theFinancial Ombudsman Service or FinancialServices Compensation Scheme.
Think about getting independent financial andprofessional advice before you hand over anymoney.
Remember: if it sounds too good to be true, itprobably is!
If you are approached by fraudsters please tell theFCA using the share fraud reporting form atwww.fca.org.uk/scams, where you can find outmore about investment scams.
You can also call the FCA Consumer Helpline on0800 111 6768.
If you have already paid money to share fraudstersyou should contact Action Fraud on 0300 123 2040.
5,000 people contact the Financial ConductAuthority about share fraud each year,with victims losing an average of £20,000
1 6
7
8
9
10
2
3
4
5
Beware of share fraud
How to avoid share fraud
Report a scam
In association with:
Financial Conduct Authority

JPMorgan European Smaller Companies Trust plc. Half Year Report & Accounts 201418
Notes

JPMorgan European Smaller Companies Trust plc. Half Year Report & Accounts 2014 19
Notes

JPMorgan European Smaller Companies Trust plc. Half Year Report & Accounts 201420
Notes

HistoryOn 24th April 1990, the Company acquired the undertaking and assetsof Fleming European Fledgeling Fund Limited (the ‘Fund’) in exchangefor the issue of its shares and warrants. The Fund was an open-ended,unquoted investment company based in Jersey and formed in June1987 with the same objectives and investment policies as theCompany.
The Company adopted its present name in July 2010.
DirectorsCarolan Dobson (Chairman) Anthony Davidson Ashok GuptaFederico Marescotti Stephen White
Company NumbersCompany registration number: 2431143 London Stock Exchange number: 0341969 ISIN: GB00BMTS0Z37Bloomberg code: JESC LN
Market InformationThe Company’s net asset value (‘NAV’) per share is published daily, viathe London Stock Exchange. The Company’s shares are listed on theLondon Stock Exchange. The market price is shown daily in the FinancialTimes, The Times, The Daily Telegraph, The Scotsman and on theCompany’s website at www.jpmeuropeansmallercompanies.co.uk,where the share price is updated every fifteen minutes during tradinghours.
Share TransactionsThe Company’s shares may be dealt in directly through a stockbroker orprofessional adviser acting on an investor’s behalf. They may also bepurchased and held through the J.P. Morgan Investment Account, J.P.Morgan ISA and J.P. Morgan SIPP. These products are all available on theonline wealth manager service, J.P. Morgan WealthManager+ available atwww.jpmorganwealthmanagerplus.co.uk
Manager and Company SecretaryJPMorgan Funds Limited
Company’s Registered Office60 Victoria EmbankmentLondon EC4Y 0JPTelephone: 020 7742 4000
For company secretarial issues and administrative matters, pleasecontact Rebecca Burtonwood.
Depositary BNY Mellon Trust and Depositary (UK) LimitedBNY Mellon Centre160 Queen Victoria StreetLondon EC4V 4LA
The Depositary employs JPMorgan Chase Bank, N.A. as the Company’scustodian.
RegistrarsEquiniti LimitedReference 1083Aspect HouseSpencer RoadLancingWest Sussex BN99 6DATelephone number: 0871 384 2325
Calls to this number cost 8p per minute from a BT landline plusnetwork charges. Lines open 8.30am to 5.30pm Monday to Friday.The overseas helpline number is +44 (0)121 415 7047.
Notifications of changes of address and enquiries regarding sharecertificates or dividend cheques should be made in writing to theRegistrar quoting reference 1083.
Registered shareholders can obtain further details on their holdings onthe internet by visiting www.shareview.co.uk
Independent AuditorsPricewaterhouseCoopers LLP Chartered Accountants and Statutory Auditors7 More London RiversideLondon SE1 2RT
BrokersCenkos Securities plc 6.7.8 Tokenhouse Yard London EC2R 7AS
Savings Product AdministratorsFor queries on the J.P. Morgan Investment Account, J.P. Morgan ISA andJ.P. Morgan SIPP, see contact details on the back cover of this report.
Information about the Company
Financial CalendarFinancial year end 31st March Final results announced May/June Half year end 30th September Half year results announced November Annual General Meeting 10th July 2015Dividend July
A member of the AIC
JPMorgan European Smaller Companies Trust plc. Half Year Report & Accounts 2014 21

J.P. Morgan HelplineFreephone 0800 20 40 20 or +44 (0)20 7742 9995
Your telephone call may be recorded for your security
www.jpmeuropeansmallercompanies.co.uk