Embed Size (px)
Citation preview

8/6/2019 Clean Energy Standard: Potential Qualifying Energy Sources
http://slidepdf.com/reader/full/clean-energy-standard-potential-qualifying-energy-sources 1/27
CRS Report for CongressPrepared for Members and Committees of Congress
Clean Energy Standard: Potential QualifyingEnergy Sources
Kelsi Bracmort, CoordinatorAnalyst in Agricultural Conservation and Natural Resources Policy
Phillip BrownAnalyst in Energy Policy
Peter FolgerSpecialist in Energy and Natural Resources Policy
Mark HoltSpecialist in Energy Policy
Michael RatnerAnalyst in Energy Policy
Fred SissineSpecialist in Energy Policy
May 3, 2011
Congressional Research Service
7-5700www.crs.gov
R41797

8/6/2019 Clean Energy Standard: Potential Qualifying Energy Sources
http://slidepdf.com/reader/full/clean-energy-standard-potential-qualifying-energy-sources 2/27
Clean Energy Standard: Potential Qualifying Energy Sources
Congressional Research Service
SummaryA clean energy standard (CES) has been identified as one possible legislative option to encouragea more diverse domestic electricity portfolio. A CES could require certain electricity providers to
obtain a portion of their electricity from qualifying clean energy sources. A CES is broader than arenewable energy standard (RES), including “clean” energy sources along with renewable energysources. The RES has been a topic of legislative attention since at least the 105 th Congress. Someassert that a CES could lead to economic growth, reduce greenhouse gas emissions, and secureU.S. leadership in clean energy technology. Others argue that a CES could lead to higherelectricity prices, necessitate additional financial investment in grid infrastructure, and—in somecases—depend on energy technologies that are not yet established for widespread commercial-scale use.
Without a CES, some clean energy sources—mostly the renewables—may face barriers topenetrate and gain traction in the electricity market. Renewable sources (including conventionalhydroelectric) constituted roughly 10% of total electric power net generation in 2010. Analysis
from the Energy Information Administration (EIA) suggests that without a CES or RES,electricity-generating capacity for renewable sources will grow 0.9% from 2009 to 2035, withrenewables comprising approximately 13.6% of total electricity-generating capacity in 2035,compared with 12.5% in 2010. EIA analysis indicates that most of the growth in renewableelectricity generation in the power sector from 2009 to 2035 will consist of generation from windand biomass facilities.
Policy, economic, and technical considerations arise when evaluating CES options. A primaryquestion in the CES legislative discussion is which energy sources would be eligible toparticipate. Congress could take into account the following clean energy source selection criteria:geographic location of the energy source, energy source supply levels, job creation associatedwith the energy source, the implementation time frame, environmental regulations (existing andforthcoming), and cost. Each potential qualifying energy source has advantages anddisadvantages, and has different natural resource, economic, and technical challenges. Forinstance, the cost to build, operate, and maintain clean energy power plants varies widely, from$63 (natural gas advanced combined-cycle) to $312 (solar thermal) per megawatt-hour.Moreover, some of the sources proposed have encountered public opposition (e.g., nuclearenergy). Many proposed sources (e.g., solar) have received government support in the form of research and development assistance or favorable tax treatment. In some cases, the technologythat might allow certain sources to qualify for a CES is not yet at commercial scale (e.g., coal-fired plants equipped with carbon capture and sequestration). Cross-cutting issues includingelectricity transmission, variability, and material cost and supply are associated with large-scaleelectricity production for many of the commonly discussed clean energy sources.
Many questions will need to be answered if a CES is established. How much clean electricity canbe generated from each qualifying energy source, given the proposed CES time frame? Should acarbon accounting parameter be assigned to each source? Will a time come when some resources(e.g., wind, solar) used to generate clean electricity cease to be considered a “free” resource?Should energy efficiency be included in a CES, and if so, how should it be included? How woulda CES interact with state renewable electricity requirements? Who would assume the costs of newtransmission capacity?
8/6/2019 Clean Energy Standard: Potential Qualifying Energy Sources
http://slidepdf.com/reader/full/clean-energy-standard-potential-qualifying-energy-sources 3/27
Clean Energy Standard: Potential Qualifying Energy Sources
Congressional Research Service
ContentsIntroduction ........................ ........................... ........................... .......................... ........................ 1 Clean, Renewable, Alternative—What Is the Difference? ........................ ........................... ......... 5 Possible Selection Criteria for CES Energy Resources.............. ............................ ....................... 6 Potential Supply-Side CES Qualifying Energy Resources...... .......................... ........................... .6
Issues Applicable to All Clean Energy Resources ........................ ............................ .............. 7 Biomass ......................... ........................... .......................... ........................... ....................... 7 Fossil Fuels Qualifying as Clean Energy ........................ ............................ ........................... 9
Natural Gas Combined-Cycle..........................................................................................9 Clean Coal ........................... ........................... ............................ ........................... ....... 11
Geothermal Resources ......................... .......................... ......................... .......................... .. 12 Nuclear ......................... ........................... ........................... .......................... ...................... 14 Solar ........................ ........................... .......................... ........................... ........................... 16 Water ........................ ........................... .......................... ........................... .......................... 18
Wind...................................................................................................................................19 Potential Demand-Side Source: Energy Efficiency ......................... .......................... ................. 21 Unresolved Issues ........................ ........................... ........................... .......................... ............. 24
FiguresFigure 1. 2010 Electric Power Net Generation by Energy Source.................................................2 Figure 2. Electricity Generating Capacity, 2008 to 2035 .......................... .......................... .......... 3 Figure 3. Renewable Energy Generating Capacity, 2010 to 2035 .......................... ....................... 4
Figure 4. Renewable Energy Generation, 2010 to 2035....................... ........................... .............. 4
TablesTable 1. Estimated Levelized Cost of Selected New Generation Resources, 2016 ..... ..... ..... ..... .... 5
ContactsAuthor Contact Information ....................... .......................... ......................... .......................... .. 24

8/6/2019 Clean Energy Standard: Potential Qualifying Energy Sources
http://slidepdf.com/reader/full/clean-energy-standard-potential-qualifying-energy-sources 4/27
Clean Energy Standard: Potential Qualifying Energy Sources
Congressional Research Service 1
IntroductionA clean energy standard (CES) has been proposed as a tool to provide a more sustainabledomestic energy supply, reduce greenhouse gas emissions, and secure the United States as aleader in clean energy technology. Some assert that a CES could contribute to economic growth.Opponents of a CES contend that a CES could raise electricity prices, introduce grid reliabilityconcerns, require significant investment in additional transmission lines, and depend on adoptingsome technologies not yet established for widespread commercial-scale use. A CES could requirecertain electricity providers to obtain a portion of their electricity from qualifying clean energysources. In his 2011 State of the Union address, President Obama challenged the country toproduce 80% of its electricity from clean energy sources by 2035. A CES could be one approachif Congress chooses to act. On March 21, 2011, Senators Bingaman and Murkowski issued awhite paper on a clean energy standard that laid out some of the key questions and potentialdesign elements of a CES, in order to solicit input from a broad range of interested parties, tofacilitate discussion, and to ascertain whether or not consensus can be achieved. 1
The CES expands on the concept of a national renewable energy standard (RES), an idea that hasreceived significant congressional attention. An RES would encourage the production of electricity from renewable resources. 2 RES legislative discussions date back to at least the 105 th Congress. A CES expands qualifying energy sources to include other “clean” energy sources(e.g., nuclear, natural gas, clean coal) along with renewable energy sources (e.g., wind, solar).Any CES would need to define which energy sources would qualify as “clean.”
The bulk of electricity generation in 2010 was from coal, natural gas, and nuclear (see Figure 1 ).Renewable sources constituted roughly 10% of total electric power net generation in 2010(including conventional hydroelectric). Analysis from the Energy Information Administration(EIA) that does not include the addition of a federal RES or CES suggests that electricity-generating capacity for renewable sources will grow 0.9% from 2009 to 2035, with renewablescomprising approximately 13.6% of total electricity generating capacity in 2035, compared with12.5% in 2010 (see Figure 2 ).3 EIA projections of renewable energy-generating capacity andgeneration are provided in Figure 3 and Figure 4 . EIA analysis indicates that most of the growthin renewable electricity generation in the power sector from 2009 to 2035 will consist of generation from wind and biomass facilities.
Multiple features of a CES may require congressional action. 4 Eligible energy sources wouldlikely be among the topics at the forefront of a CES debate; at stake is what resources could and
1 Paper available at http://energy.senate.gov/public/index.cfm?FuseAction=IssueItems.View&IssueItem_ID=7b61e406-3e17-4927-b3f4-d909394d46de.2 Renewable resources are those generally not depleted by human use, such as the sun, wind, and movement of water.3 Energy Information Administration, Annual Energy Outlook 2011 , April 2011, http://www.eia.doe.gov/forecasts/aeo/ index.cfm. Energy Information Administration, Annual Energy Outlook 2011, April 2011, http://www.eia.doe.gov/ forecasts/aeo/chapter_executive_summary.cfm. EIA reports that the growth in generation from wind plants is drivenprimarily by state renewable portfolio standard (RPS) requirements and federal tax credits. Generation from biomasscomes from both dedicated biomass plants and co-firing in coal plants. Its growth is driven by state RPS programs, theavailability of low-cost feedstocks, and the federal renewable fuels standard, which results in significant cogenerationof electricity at plants producing biofuels.4 For more information on clean energy standards, see CRS Report R41720, Clean Energy Standard: Design Elements,State Baseline Compliance and Policy Considerations , by Phillip Brown. For more information on a federal RES, seeCRS Report R41493, Options for a Federal Renewable Electricity Standard , by Richard J. Campbell.

8/6/2019 Clean Energy Standard: Potential Qualifying Energy Sources
http://slidepdf.com/reader/full/clean-energy-standard-potential-qualifying-energy-sources 5/27
Clean Energy Standard: Potential Qualifying Energy Sources
Congressional Research Service 2
could not participate in a CES. Each energy source has advantages and disadvantages, and eachbrings different natural resource, economic, and technical challenges. For example, the cost tobuild clean energy projects and operate and maintain them is expected to vary (see Table 1 ).Additionally, sources for supply-side energy options are dependent on regional resources; energyefficiency is a demand-side source that is available everywhere because it is derived from power
consumption locations—not from natural resource geography. Congress might consider thesefactors, among others such as how a federal CES would interact with state power provisions, indetermining which energy sources would be eligible for a CES.
This report begins with a brief examination of clean energy, renewable energy, and alternativeenergy. It then presents possible selection criteria Congress could use to determine which sourcescould be eligible for a CES depending on the goal(s) of the CES. The report provides an overviewof the energy sources most commonly discussed as potential CES qualifying sources: biomass,fossil fuels (natural gas combined-cycle and coal-fired power plants with carbon capture andsequestration), geothermal resources, nuclear, solar, water, and wind. The report describes whereeach source can be found in the United States, the estimated quantity available for electricitygeneration, technologies used to create electricity from the source, advantages and disadvantages
of using the source for electricity generation, and policy implications should the source beincluded in a CES. 5 The report also contains a section on energy efficiency and its potentialinclusion in a CES.
Figure 1. 2010 Electric Power Net Generation by Energy Source(4,120,028 thousands of megawatt-hours total)
Source: U.S. Energy Information Administration, Electric Power Monthly , April 2011, http://www.eia.doe.gov/cneaf/electricity/epm/epm_sum.html. Adapted by CRS.
Notes: Coal includes anthracite, bituminous, subbituminous, lignite, waste coal, and coal synfuel. Petroleumliquids include distillate fuel oil, residual fuel oil, jet fuel, kerosene, and waste oil. Other gases include blast
furnace gas, propane gas, and other manufactured and waste gases derived from fossil fuels. Other includes non-biogenic municipal solid waste, batteries, chemicals, hydrogen, pitch, purchased steam, sulfur, tire-derived fuel,and miscellaneous technologies. Wood and wood-derived fuels include wood/wood waste solids (including paperpellets, railroad ties, utility poles, wood chips, bark, and wood waste solids), wood waste liquids (red liquor,sludge wood, spent sulfite liquor, and other wood-based liquids), and black liquor. Other biomass includes
5 This report will generally identify electric supply (megawatt-hours). In a few instances (e.g., geothermal resources)only capacity (megawatt) estimates are available.
8/6/2019 Clean Energy Standard: Potential Qualifying Energy Sources
http://slidepdf.com/reader/full/clean-energy-standard-potential-qualifying-energy-sources 6/27
Clean Energy Standard: Potential Qualifying Energy Sources
Congressional Research Service 3
biogenic municipal solid waste, landfill gas, sludge waste, agricultural byproducts, other biomass solids, otherbiomass liquids, and other biomass gases (including digester gases, methane, and other biomass gases).
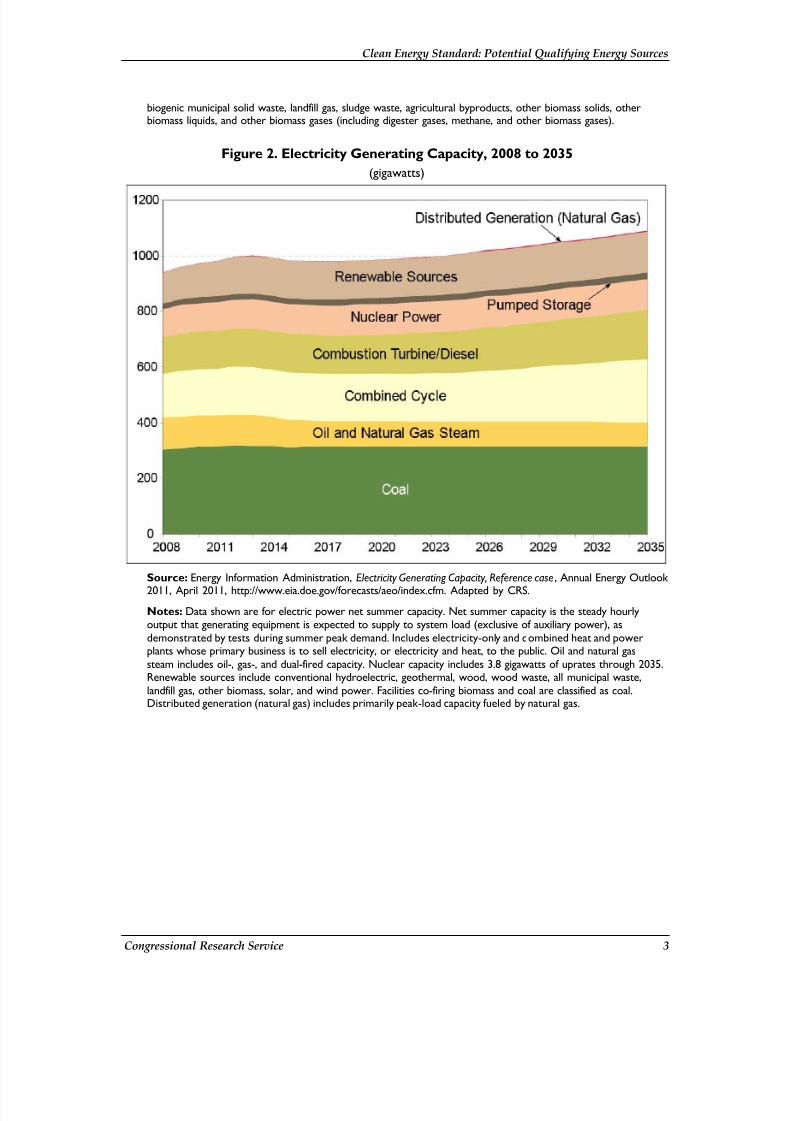
Figure 2. Electricity Generating Capacity, 2008 to 2035(gigawatts)
Source: Energy Information Administration, Electricity Generating Capacity, Reference case, Annual Energy Outlook 2011, April 2011, http://www.eia.doe.gov/forecasts/aeo/index.cfm. Adapted by CRS.
Notes: Data shown are for electric power net summer capacity. Net summer capacity is the steady hourlyoutput that generating equipment is expected to supply to system load (exclusive of auxiliary power), asdemonstrated by tests during summer peak demand. Includes electricity-only and combined heat and powerplants whose primary business is to sell electricity, or electricity and heat, to the public. Oil and natural gassteam includes oil-, gas-, and dual-fired capacity. Nuclear capacity includes 3.8 gigawatts of uprates through 2035.Renewable sources include conventional hydroelectric, geothermal, wood, wood waste, all municipal waste,landfill gas, other biomass, solar, and wind power. Facilities co-firing biomass and coal are classified as coal.Distributed generation (natural gas) includes primarily peak-load capacity fueled by natural gas.

8/6/2019 Clean Energy Standard: Potential Qualifying Energy Sources
http://slidepdf.com/reader/full/clean-energy-standard-potential-qualifying-energy-sources 7/27
Clean Energy Standard: Potential Qualifying Energy Sources
Congressional Research Service 4
Figure 3. Renewable Energy Generating Capacity, 2010 to 2035(gigawatts)
Source: Energy Information Administration, Renewable Energy Generating Capacity and Generation, Reference case ,Annual Energy Outlook 2011, April 2011, http://www.eia.doe.gov/forecasts/aeo/index.cfm. Adapted by CRS.
Notes: Electric power sector net summer capacity includes electricity-only and combined heat and power plantswhose primary business is to sell electricity, or electricity and heat, to the public. Geothermal includes bothhydrothermal resources (hot water and steam) and near-field enhanced geothermal systems (EGS). Near-field EGSpotential occurs on known hydrothermal sites, however this potential requires the addition of external fluids forelectricity generation and is only available after 2025. Municipal waste includes municipal waste, landfill gas, andmunicipal sewage sludge. Incremental growth is assumed to be for landfill gas facilities. All municipal waste is included,although a portion of the municipal waste stream contains petroleum-derived plastics and other non-renewablesources. For wood and other biomass, facilities co-firing biomass and coal are classified as coal. Solar photovoltaicdoes not include off-grid photovoltaics (PV).
Figure 4. Renewable Energy Generation, 2010 to 2035(billion kilowatt-hours)
Source: Energy Information Administration, Renewable Energy Generating Capacity and Generation, Reference case ,Annual Energy Outlook 2011, April 2011, http://www.eia.doe.gov/forecasts/aeo/index.cfm. Adapted by CRS.
8/6/2019 Clean Energy Standard: Potential Qualifying Energy Sources
http://slidepdf.com/reader/full/clean-energy-standard-potential-qualifying-energy-sources 8/27
Clean Energy Standard: Potential Qualifying Energy Sources
Congressional Research Service 5
Notes: Geothermal includes both hydrothermal resources (hot water and steam) and near-field enhancedgeothermal systems (EGS). Near-field EGS potential occurs on known hydrothermal sites, however this potentialrequires the addition of external fluids for electricity generation and is only available after 2025. Biogenic municipalwaste includes biogenic municipal waste, landfill gas, and municipal sewage sludge. Solar photovoltaic does not includeoff-grid photovoltaics (PV).
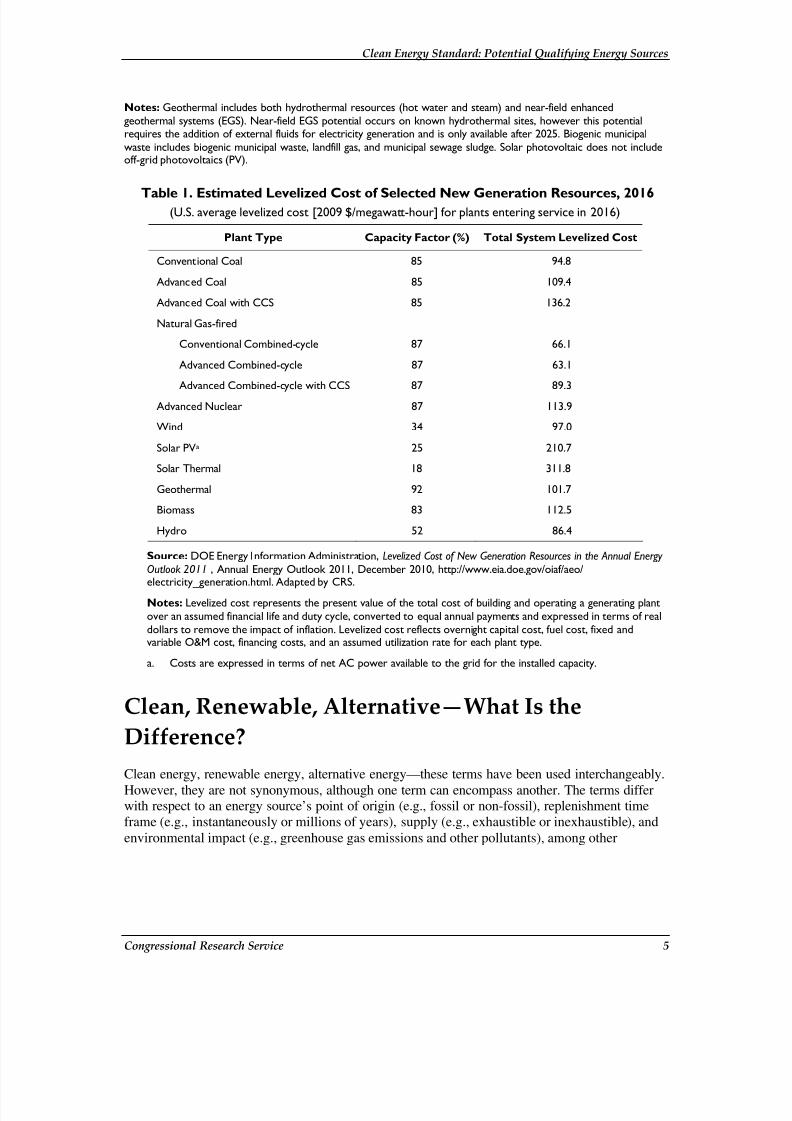
Table 1. Estimated Levelized Cost of Selected New Generation Resources, 2016(U.S. average levelized cost [2009 $/megawatt-hour] for plants entering service in 2016)
Plant Type Capacity Factor (%) Total System Levelized Cost
Conventional Coal 85 94.8
Advanced Coal 85 109.4
Advanced Coal with CCS 85 136.2
Natural Gas-fired
Conventional Combined-cycle 87 66.1
Advanced Combined-cycle 87 63.1
Advanced Combined-cycle with CCS 87 89.3Advanced Nuclear 87 113.9
Wind 34 97.0
Solar PV a 25 210.7
Solar Thermal 18 311.8
Geothermal 92 101.7
Biomass 83 112.5
Hydro 52 86.4
Source: DOE Energy Information Administration, Levelized Cost of New Generation Resources in the Annual Energy Outlook 2011 , Annual Energy Outlook 2011, December 2010, http://www.eia.doe.gov/oiaf/aeo/electricity_generation.html. Adapted by CRS.
Notes: Levelized cost represents the present value of the total cost of building and operating a generating plantover an assumed financial life and duty cycle, converted to equal annual payments and expressed in terms of realdollars to remove the impact of inflation. Levelized cost reflects overnight capital cost, fuel cost, fixed andvariable O&M cost, financing costs, and an assumed utilization rate for each plant type.
a. Costs are expressed in terms of net AC power available to the grid for the installed capacity.
Clean, Renewable, Alternative—What Is theDifference?Clean energy, renewable energy, alternative energy—these terms have been used interchangeably.However, they are not synonymous, although one term can encompass another. The terms differwith respect to an energy source’s point of origin (e.g., fossil or non-fossil), replenishment timeframe (e.g., instantaneously or millions of years), supply (e.g., exhaustible or inexhaustible), andenvironmental impact (e.g., greenhouse gas emissions and other pollutants), among other

8/6/2019 Clean Energy Standard: Potential Qualifying Energy Sources
http://slidepdf.com/reader/full/clean-energy-standard-potential-qualifying-energy-sources 9/27
Clean Energy Standard: Potential Qualifying Energy Sources
Congressional Research Service 6
qualities. In general, a renewable energy source is naturally replenishing but flow-limited. 6 Aclean energy source is typically a source that produces little to no air pollution. The term“alternative” usually describes a non-conventional energy source. Most but not all renewableenergy sources qualify as clean energy, depending on how electricity is produced from the source.Some clean energy sources (e.g., nuclear) are not generally considered renewable.
Possible Selection Criteria for CES EnergyResourcesPotential CES energy source selection criteria could depend on the goal of a CES. While a CESgenerally would have the basic goal of producing a significant portion of electricity from cleanenergy sources, the reasoning behind this goal could influence which sources are selected. Inevaluating individual energy sources for possible inclusion, Congress might consider thefollowing criteria: 7 geographic location of the energy source, energy source supply levels, jobcreation associated with the energy source, implementation time frame, EPA regulations (existing
and forthcoming), environmental issues (air quality, water quality, water quantity, wildlife),greenhouse gas emissions, baseload versus non-baseload, energy balance, 8 energy content, 9 landuse change, scalability, and cost.
Potential Supply-Side CES Qualifying EnergyResourcesThis section discusses selected energy resources that are commonly identified as potentialqualifying sources for a CES. 10 Each overview describes where the source can be found in theUnited States, how much is estimated to be available for electricity generation, the technologiesused to create electricity from the identified source, advantages and disadvantages of using thesource for electricity generation, and policy implications. Potential resources are renewable (e.g.,wind) or technology-aided (e.g., fossil fuels). The energy resources may include biomass, cleanenergy fossil fuels, geothermal resources, nuclear, solar, water, and wind. 11
6 The Energy Information Administration states that renewable energy resources are virtually inexhaustible in durationbut limited in the amount of energy that is available per unit of time.7 The criteria are not presented in any order of priority. The criteria presented are not a complete list, but are providedto give an indication of the range of policy options.8
Energy balance is the difference between the total incoming and total outgoing energy of a clean energy productionsystem.9 Energy content is the amount of energy contained in a given mass of a source.10 An explanation of every proposed clean energy source is beyond the scope of this report.11 Overviews for landfill gas, coal-mine methane, and waste-to-energy—three other potential qualifying CES energysources—are not provided in this report. The captured gas from landfills and coal mines can be used to generateelectricity. For more information on this process, see CRS Report R40813, Methane Capture: Options for GreenhouseGas Emission Reduction , by Kelsi Bracmort et al. Waste-to-energy is the combustion of municipal solid waste forelectricity production.

8/6/2019 Clean Energy Standard: Potential Qualifying Energy Sources
http://slidepdf.com/reader/full/clean-energy-standard-potential-qualifying-energy-sources 10/27
Clean Energy Standard: Potential Qualifying Energy Sources
Congressional Research Service 7
Issues Applicable to All Clean Energy ResourcesA number of cross-cutting issues are associated with large-scale electricity production for manyor all of the clean energy sources: 12
•
Technology. For certain energy sources, technology to capture the resource andgenerate electric power is likely to require significant upgrading and financialinvestment.
• Electricity Transmission. In some cases, the energy source is located aconsiderable distance from where the electricity is needed. Transmission linesmay have to be constructed to transmit the electricity from its point of origin toits point of use. This raises concerns not only for capital investment, but alsositing issues.
• Variability. Electricity generated from certain sources (e.g., wind, solar) isvariable; it is subject to acts of nature, and is not always available. This mayaffect grid stability if sufficient back-up generation is not available.
• Project economics. It may be cost-prohibitive to embark on certain cleanelectricity investments if the rate-of-return on the investment is not favorable.The rate-of-return is likely to vary across the United States, depending on sourceavailability and regional market prices among other things.
• Material cost and supply. Certain clean electricity projects may requireexpensive or scarce amounts of raw materials. Use of these materials forelectricity generation may have an impact on other markets that rely on the samematerials.
Biomass 13
Biomass is organic matter that can be converted to energy. Common types of biomass are wood,wood residues (e.g., branches), agricultural biomass (e.g., corn stover), aquatic biomass (e.g.,algae), animal manure, and industrial biomass wastes. Relative to other locations in the UnitedStates, large quantities of biomass have been identified east of the Rocky Mountains, and in theNorthwest, Alaska, and Hawaii. 14 Biomass can be converted to electricity (biopower) by either athermochemical or a biochemical conversion process. Biopower conversion processes includecombustion, co-firing, gasification, pyrolysis, and anaerobic digestion. The technologies are atvarying stages of maturity. 15
12 The issues are not presented in any order of priority.13 This section was written by Kelsi Bracmort.14 For a map of biomass resources available throughout the United States, see Figure 1 in CRS Report R41106, Meetingthe Renewable Fuel Standard (RFS) Mandate for Cellulosic Biofuels: Questions and Answers , by Kelsi Bracmort. Foran estimate of how much biomass (tons/year) is available for biopower production at the county level, see the NationalRenewable Energy Laboratory BioEnergy Atlas for Biopower http://maps.nrel.gov/bioenergyatlas.15 For more information on biopower conversion technologies, see CRS Report R41440, Biomass Feedstocks for
Biopower: Background and Selected Issues , by Kelsi Bracmort.

8/6/2019 Clean Energy Standard: Potential Qualifying Energy Sources
http://slidepdf.com/reader/full/clean-energy-standard-potential-qualifying-energy-sources 11/27
Clean Energy Standard: Potential Qualifying Energy Sources
Congressional Research Service 8
Approximately 1.4% of electricity generation in 2010 originated from biomass. 16 Biopower wasthe third-largest renewable energy source for electricity generation (following conventionalhydroelectric power and wind). 17 The EIA estimates that electricity generation for all sectors frombiomass will grow 5.6% from 2009 to 2035, and its contribution to the total U.S. electric powercapacity will be 0.5% in 2035. 18
There are advantages and disadvantages to pursuing biomass for electricity generation under aCES.19 Proponents of using biomass point out that various types of biomass are available in morethan 35 states for electricity generation. In addition, they suggest that a CES would establishanother market for biomass producers to sell their product, 20 and that it would serve as aneconomic incentive to remove and use pest-infested woody biomass for electricity generation.Also, some biomass feedstocks can be used for baseload power production (minimum amount of electric power delivered or required over a given period of time at a steady rate), unlike wind orsolar, which are variable resources. Some suggest that biomass use may be unsustainable, or thatbiomass combustion could increase carbon emissions. 21 If it is economically advantageous to usebiomass for electricity generation, some contend, less biomass will be available for traditionalpurposes. In particular, some are concerned there may not be enough biomass to meet both liquid
transportation fuels and electricity needs under a CES.22
The natural resource implications of using biomass will depend on management of the sourcesfrom which it originates. For example, woody residues are more likely to remain available if woodlands are sustainably managed. The following policy questions might arise whenconsidering biomass as a qualifying CES energy source:
• Will agricultural producers continue to receive support from the federalgovernment to grow certain crops if a CES is established? Some agriculturalproducers receive financial assistance from the federal government to grow selectcrops (e.g., corn). In certain cases, these same producers could sell the residues of these crops for electricity generation to meet a CES mandate.
16 U.S. Energy Information Administration, Electric Power Monthly , April 2011, http://www.eia.doe.gov/cneaf/ electricity/epm/epm_sum.html.17 Biopower includes electricity generated from wood and wood-derived fuels and biogenic municipal solid waste,landfill gas, sludge waste, agricultural byproducts, other biomass solids, other biomass liquids, and other biomass gases(including digester gases, methane, and other biomass gases). U.S. Energy Information Administration, Electric Power
Monthly , April 2011, http://www.eia.doe.gov/cneaf/electricity/epm/epm_sum.html.18 Energy Information Administration, Annual Energy Outlook 2011 , April 2011, http://www.eia.doe.gov/forecasts/aeo/ index.cfm.19 For more information on the advantages and disadvantages of using biomass for electricity generation, see CRSReport R41440, Biomass Feedstocks for Biopower: Background and Selected Issues , by Kelsi Bracmort and CRS
Report R40565, Biomass Resources: The Southeastern United States and the Renewable Electricity Standard Debate ,by Richard J. Campbell.20 For example, forestry residues from timber cuttings for sawmill and paper operations currently remain in the forest oron wooded lots. It is argued that these residues could be used as a biopower feedstock.21 For more information on the carbon neutrality of biopower, see CRS Report R41603, Is Biopower Carbon Neutral? ,by Kelsi Bracmort.22 For more information on biomass used to meet the Renewable Fuel Standard, a mandate whereby a minimumvolume of biofuels is to be used in the national transportation fuel supply each year, see CRS Report R40155,
Renewable Fuel Standard (RFS): Overview and Issues , by Randy Schnepf and Brent D. Yacobucci.

8/6/2019 Clean Energy Standard: Potential Qualifying Energy Sources
http://slidepdf.com/reader/full/clean-energy-standard-potential-qualifying-energy-sources 12/27
Clean Energy Standard: Potential Qualifying Energy Sources
Congressional Research Service 9
• Will the inclusion of biomass as a qualifying CES source conflict with otherenergy mandates? The Renewable Fuel Standard (RFS) is a liquidtransportation fuels mandate that drives demand for some of the same biomassfeedstocks used for electricity generation.
• Will the CES be economically competitive for those entities that requirefeedstock collection and transportation? Some biomass is located in areas thatare difficult to reach. Would-be participants may demand that a CES offer a pricethat will compensate them for feedstock collection and transportation efforts.
• Will the CES include biomass-to-thermal applications? While discussionsabout a CES have focused on energy in the form of electricity, some assert thatthe standard could be broadened to include other non-electric energy applicationssuch as space and domestic water heating, process heat, and the thermal portionof combined heat and power.
Fossil Fuels Qualifying as Clean Energy
Natural Gas Combined-Cycle 23
Natural gas, predominantly methane, is present throughout all 50 states in various forms, and iscommercially produced in 33 states. 24 The recent development of large shale-gas resources hasincreased U.S. reserves and production, and has contributed to a steep drop in natural gas prices.Possible changes in government regulations regarding hydraulic fracturing—in part due to localopposition—raise uncertainty about future development of the resource. All 50 states consumenatural gas, as vast pipeline networks transport the fuel around the country and within states. 25
Natural gas is used for electric power generation in 48 states (all but Hawaii and Vermont), 26 andnatural gas combined-cycle (NGCC) facilities—among the most efficient combustion
technologies for natural gas—are in 40 states.27
This highlights the role of natural gas in electricgeneration throughout the United States. Natural gas ranked second behind coal as the largest fuelsource for U.S. electricity generation in 2009, accounting for almost 24% of U.S. generation. 28 Natural gas has the most electric generation capacity in the United States, approximately 41%,with NGCC facilities accounting for about half. 29 However, many natural gas power plants are
23 This section was written by Michael Ratner.24 The United States has the sixth-largest natural gas reserves globally and was first in production worldwide in 2009.The United States was the largest consumer of natural gas in 2009, with domestic sources supplying over 90% of thisusage. BP Statistical Review of World Energy 2010, http://www.bp.com/subsection.do?categoryId=9023762&contentId=7044550.25 The United States uses over 300,000 miles of transmission pipeline to move natural gas to markets in all 50 states.Natural gas is distributed to customers by pipeline as well, but these pipelines are in addition to the transmissionpipelines.26 Vermont does use landfill gas to produce electricity.27 Combined-cycle electric generation burns fuel, most commonly natural gas, in a natural gas turbine, which turns agenerator to produce electricity. The exhaust heat from this process is then used to turn a steam turbine, which turns agenerator to produce additional electricity. The alternative to combined cycle is simple cycle, which only uses oneturbine to produce electricity and the exhaust heat is not captured to produce electricity..28 U.S. Energy Information Administration. http://www.eia.doe.gov/cneaf/electricity/epm/table1_1.html.29 U.S. Energy Information Administration. http://www.eia.doe.gov/cneaf/electricity/epa/epat1p2.html.
8/6/2019 Clean Energy Standard: Potential Qualifying Energy Sources
http://slidepdf.com/reader/full/clean-energy-standard-potential-qualifying-energy-sources 13/27
Clean Energy Standard: Potential Qualifying Energy Sources
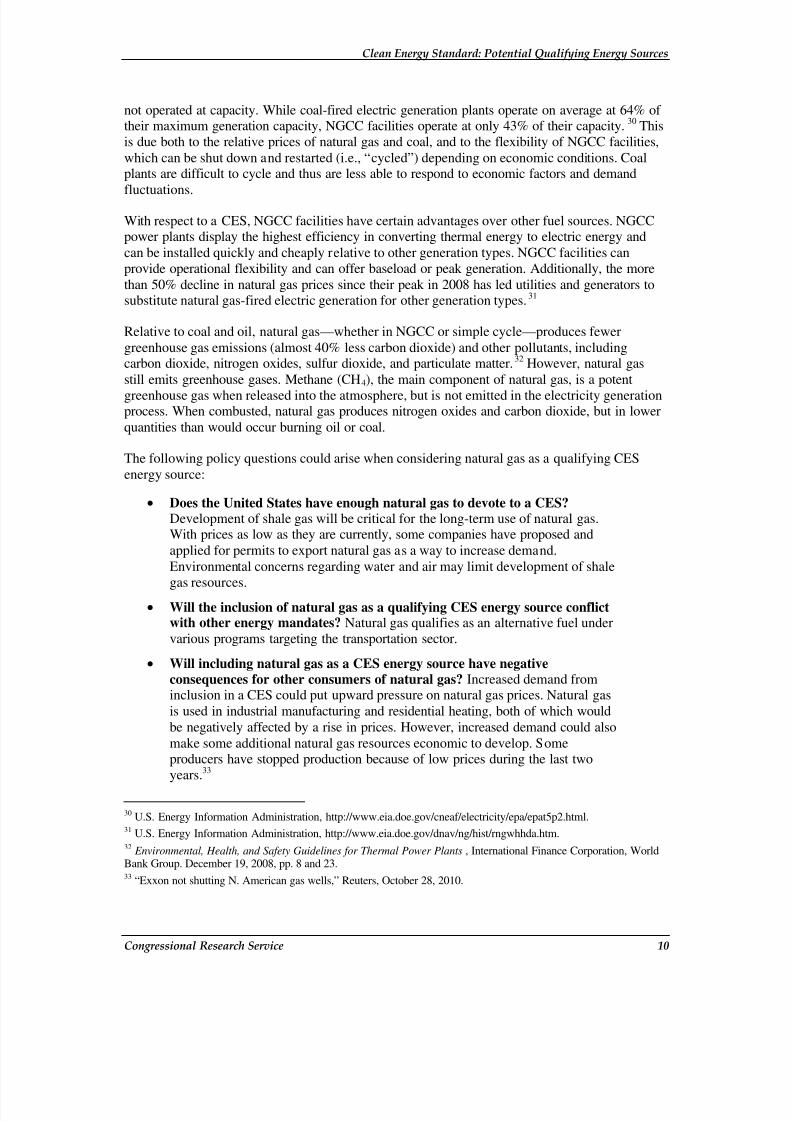
Congressional Research Service 10
not operated at capacity. While coal-fired electric generation plants operate on average at 64% of their maximum generation capacity, NGCC facilities operate at only 43% of their capacity. 30 Thisis due both to the relative prices of natural gas and coal, and to the flexibility of NGCC facilities,which can be shut down and restarted (i.e., “cycled”) depending on economic conditions. Coalplants are difficult to cycle and thus are less able to respond to economic factors and demand
fluctuations.
With respect to a CES, NGCC facilities have certain advantages over other fuel sources. NGCCpower plants display the highest efficiency in converting thermal energy to electric energy andcan be installed quickly and cheaply relative to other generation types. NGCC facilities canprovide operational flexibility and can offer baseload or peak generation. Additionally, the morethan 50% decline in natural gas prices since their peak in 2008 has led utilities and generators tosubstitute natural gas-fired electric generation for other generation types. 31
Relative to coal and oil, natural gas—whether in NGCC or simple cycle—produces fewergreenhouse gas emissions (almost 40% less carbon dioxide) and other pollutants, includingcarbon dioxide, nitrogen oxides, sulfur dioxide, and particulate matter. 32 However, natural gas
still emits greenhouse gases. Methane (CH 4), the main component of natural gas, is a potentgreenhouse gas when released into the atmosphere, but is not emitted in the electricity generationprocess. When combusted, natural gas produces nitrogen oxides and carbon dioxide, but in lowerquantities than would occur burning oil or coal.
The following policy questions could arise when considering natural gas as a qualifying CESenergy source:
• Does the United States have enough natural gas to devote to a CES? Development of shale gas will be critical for the long-term use of natural gas.With prices as low as they are currently, some companies have proposed andapplied for permits to export natural gas as a way to increase demand.Environmental concerns regarding water and air may limit development of shalegas resources.
• Will the inclusion of natural gas as a qualifying CES energy source conflictwith other energy mandates? Natural gas qualifies as an alternative fuel undervarious programs targeting the transportation sector.
• Will including natural gas as a CES energy source have negativeconsequences for other consumers of natural gas? Increased demand frominclusion in a CES could put upward pressure on natural gas prices. Natural gasis used in industrial manufacturing and residential heating, both of which wouldbe negatively affected by a rise in prices. However, increased demand could alsomake some additional natural gas resources economic to develop. Someproducers have stopped production because of low prices during the last twoyears. 33
30 U.S. Energy Information Administration, http://www.eia.doe.gov/cneaf/electricity/epa/epat5p2.html.31 U.S. Energy Information Administration, http://www.eia.doe.gov/dnav/ng/hist/rngwhhda.htm.32 Environmental, Health, and Safety Guidelines for Thermal Power Plants , International Finance Corporation, WorldBank Group. December 19, 2008, pp. 8 and 23.33 “Exxon not shutting N. American gas wells,” Reuters, October 28, 2010.

8/6/2019 Clean Energy Standard: Potential Qualifying Energy Sources
http://slidepdf.com/reader/full/clean-energy-standard-potential-qualifying-energy-sources 14/27
Clean Energy Standard: Potential Qualifying Energy Sources
Congressional Research Service 11
Clean Coal 34
There has been considerable discussion about including clean coal (coal-fired power plantsequipped with carbon capture and sequestration) as a qualifying energy source for a CES. 35 Coalwas the largest fuel source for electricity generation in 2009, accounting for nearly 45% of U.S.
generation.36
U.S. coal deposits are mainly in three large regions: the Appalachian Coal Region,the Interior Coal Region, and Western Coal Region. 37 Coal is mined in 25 states. The top coal-producing states are Wyoming, West Virginia, Kentucky, Pennsylvania, and Montana. In 2009,about 5.5% of coal produced in the United States was exported, over half to Canada, Brazil,Netherlands, the United Kingdom, and France. At the same time, 2.3% of coal consumed in theUnited States (mainly barged to the Gulf and east coast states) is imported, primarily fromColombia.
Carbon capture and sequestration (or storage)—known as CCS—involves capturing carbon at itssource, transporting and storing it to prevent or minimize its release to the atmosphere. Currently,three main approaches are available to capture CO 2 from large-scale industrial facilities or powerplants: post-combustion capture, pre-combustion capture, and oxy-fuel combustion capture. After
capture, the next step is transportation. Most CO 2 transport in the United States is throughpipelines. The last step is sequestration in geological reservoirs. Three main types of geologicalformations are being considered for carbon sequestration: depleted oil and gas reservoirs, deepsaline reservoirs, and unmineable coal seams.
Coal-fired electricity-generating plants are strong initial candidates for CCS or reuse of CO 2 because they are usually large, stationary, single-point sources of emissions. 38 According to theEnvironmental Protection Agency, the United States produces over 5.1 billion metric tons of CO 2 each year from fossil fuel combustion, and 42%, or 2.15 billion metric tons, of that is fromgenerating electricity. 39 The United States can potentially store CO 2 for decades or longer atcurrent emission rates from power plants and other stationary sources. According to theDepartment of Energy (DOE), storage estimates range from 1.65 trillion to 20.2 trillion metric
tons for deep saline reservoirs, the geological formation with the highest potential for long-termCO2 storage. 40 If these estimates are correct, then the United States has the capacity to store all of its emissions from electricity generation for the next 770 to 9,400 years in saline reservoirs attoday’s emission rates.
34 This section was written by Peter Folger.35 For more information, see CRS Report RL34621, Capturing CO2 from Coal-Fired Power Plants: Challenges for aComprehensive Strategy , by Larry Parker and Peter Folger.36 U.S. Energy Information Administration, Net Generation by Energy Source: Total (All Sectors) , Electric PowerMonthly, March 2011, http://www.eia.doe.gov/cneaf/electricity/epm/table1_1.html.37
U.S. Energy Information Administration, Annual Coal Report 2009 , DOE/EIA-0584 , October 2010,http://www.eia.doe.gov/cneaf/coal/page/acr/acr_sum.html.38 Large industrial facilities, such as cement-manufacturing, ethanol, or hydrogen production plants, that produce largequantities of CO 2 as part of the industrial process are also good candidates for CO 2 capture and storage.Intergovernmental Panel on Climate Change (IPCC) Special Report, Carbon Dioxide Capture and Storage , 2005.39 U.S. Environmental Protection Agency (EPA), Draft Inventory of U.S. Greenhouse Emissions and Sinks: 1990-2009 ,Table ES-3; February 2011, http://epa.gov/climatechange/emissions/downloads11/US-GHG-Inventory-2011-Executive-Summary.pdf.40 Department of Energy, Carbon Sequestration Atlas of the United States and Canada , 3rd edition, 2010.

8/6/2019 Clean Energy Standard: Potential Qualifying Energy Sources
http://slidepdf.com/reader/full/clean-energy-standard-potential-qualifying-energy-sources 15/27
Clean Energy Standard: Potential Qualifying Energy Sources
Congressional Research Service 12
Questions to consider about CCS as a qualifying source for a clean energy standard include thefollowing:
• Can CCS be a long-term component of a CES portfolio? Using CCS to limitCO2 emissions to the atmosphere is widely perceived as a medium-term option,
allowing continued use of coal to generate electricity until less carbon-intensivetechnologies can substitute at an equivalent cost. Adding CCS to coal-firedgeneration, however, reduces the efficiency of the plants and increases the cost toproduce electricity, especially during the capture step. 41
• Will inclusion of CCS as a qualifying CES source spur the adoption anddeployment of CCS in the energy sector? Without an economic incentive or aregulatory requirement to install CCS at existing power plants or to build newplants with CCS, it is unlikely that CCS would be deployed commercially, unlessits costs decrease dramatically. In addition to the cost of capture, the legal andregulatory framework for storing CO 2 underground is under development.
• At what stage of research, development, and deployment is CCS? Many
experts call for a series of industrial-scale CCS projects to demonstrate how CO 2 can be captured, transported, and stored safely and efficiently in a variety of environments throughout the United States and how costs, decreases inefficiency, and transportation issues might be managed.
Geothermal Resources 42 Geothermal resources are found where circulating groundwater contacts the heated rocks near theEarth’s surface, and where the resulting hot fluid can potentially be exploited for heat orelectricity. To generate electricity, wells are drilled into the geothermal resource to extract the hotwater or steam, which is then used to drive a turbine. In general, geothermal resources above150oC (300 oF) are used for electricity generation. 43 Resources below 150 oC are typically used for
direct heating.
The United States is the largest producer of electricity from geothermal resources, with 2,256megawatts (MW) of installed capacity in 2008 (0.2% of total summer electric generating capacityin 2008). 44 The size of individual geothermal power plants ranges from small (less than 5 MW) tolarge (greater than 30 MW). Most of the installed capacity is in California and Nevada, withadditional capacity in Hawaii, Utah, Idaho, and Alaska. The Geysers, comprising 45 square milesin northern California, contains a large geothermal complex with multiple power plants and over300 steam wells; these facilities account for most of the electricity generated from geothermalresources in California, and a large share of the U.S. installed capacity.
41 For detailed CCS cost estimates, see CRS Report R41325, Carbon Capture: A Technology Assessment , by PeterFolger.42 This section was written by Peter Folger.43 Lund, John W., “Characteristics, Development and Utilization of Geothermal Resources,” Geo-Heat CenterQuarterly Bulletin, vol. 28, no. 2 (2007), p. 1.44 U.S. Department of Energy, Energy Information Administration, http://www.eia.gov/cneaf/solar.renewables/page/ trends/table1_12.pdf. The U.S. Geological Survey cites a slightly higher number: 2,500 MW of installed and utilizedpower production capacity; USGS Fact Sheet 2008-3082, http://pubs.usgs.gov/fs/2008/3082/pdf/fs2008-3082.pdf.

8/6/2019 Clean Energy Standard: Potential Qualifying Energy Sources
http://slidepdf.com/reader/full/clean-energy-standard-potential-qualifying-energy-sources 16/27
Clean Energy Standard: Potential Qualifying Energy Sources
Congressional Research Service 13
In a 2008 assessment of U.S. geothermal resources, the U.S. Geological Survey estimated that themean electric power generation potential from identified geothermal systems is slightly over9,000 MW, distributed over 13 states. 45 California has nearly 60% of the identified geothermalresource base, followed by Nevada (15%) and Alaska (7.5%). The USGS also indicated thatundiscovered geothermal resources could add over 30,000 MW of potential production capacity
from public and private lands.46
A different category of geothermal resource, called enhanced geothermal systems (EGS), furtheradds to the nation’s potential geothermal resource base. EGS require some form of engineering todrill down to high temperature zones to access the hot water or steam and recover the heat togenerate electricity. Conventional geothermal systems take advantage of naturally circulating hotwater and steam. Enhanced geothermal systems require elevated temperatures at drillable depths,which expands the potential resource base outside the boundaries of conventional geothermalresources but also increases the technical difficulty to harness the resource. Assuming that EGStechnology is feasible, the USGS estimated that the mean electric power-generating capacity fromEGS could be over 517,000 MW. 47
Future exploitation of these resources depends in part on their nature compared to other sourcesof energy. A potential advantage of geothermal resources is that, in contrast to fossil fuel energyresources, the heat from geothermal fluids may be used without combustion, thus avoidingreleases of carbon dioxide and other waste gases. A possible disadvantage involves theaccessibility of geothermal resources. Geothermal plants must be built at the resource site, and arethus limited to locations where geothermal resources occur in the United States. By contrast,while proximity to the fuel source is considered in determining the economic viability of a fossil-fuel power plant, fossil fuels like coal and natural gas can be transported to the plant site; thusconventional plants may be built almost anywhere in the United States.
Other policy questions in considering geothermal resources for a CES include the following:
• If geothermal is included in a CES portfolio, what other factors may affectits expansion and deployment as a source of energy for electricitygeneration? Similar to mineral and energy resource development, geothermalresources need to be discovered and characterized, and the reservoir itself engineered and managed to most efficiently extract its energy. That process canrequire significant investment and long lead times before any electricity isactually produced. Factors such as accessibility, distance to electricity consumers,the presence of adequate supplies of cooling water, and other site-specific factorsaffect the economic and regulatory (e.g., transmission siting) viability of theresource.
• At what stage of research, development, and deployment are enhancedgeothermal systems? Enhanced geothermal systems (EGS) could expand the
potential geothermal resource geographically, but require large engineering and
45 USGS Fact Sheet 2008-3082.46 Ibid.47 The USGS cautions that this estimate should be considered provisional, as EGS technology is in an early stage of development. The total electric generating capacity for the electric power sector (power only) in 2010 wasapproximately 973,400 MW. EIA, Energy Information Administration, Annual Energy Outlook 2011 , April 2011,http://www.eia.doe.gov/forecasts/aeo/index.cfm.

8/6/2019 Clean Energy Standard: Potential Qualifying Energy Sources
http://slidepdf.com/reader/full/clean-energy-standard-potential-qualifying-energy-sources 17/27
Clean Energy Standard: Potential Qualifying Energy Sources
Congressional Research Service 14
infrastructure investments that so far constitute an unproven technology. Keytechnical challenges must be met for EGS to succeed, such as creating anefficient closed-loop system and limiting the amount of fluid loss. 48 In addition,water resources for EGS may be constrained in the more arid portions of thecountry. The role of the federal government in advancing EGS technology is an
ongoing question.
Nuclear 49 Nuclear energy results from the fission (splitting) of the nuclei of heavy isotopes, such asuranium-235 and plutonium-239, in a nuclear reactor. 50 The United States has 104 commercialnuclear reactors that generated about 20% of U.S. electricity in 2010. 51 Nuclear power plants arethe largest U.S. source of non-carbon-emitting electricity generation, although some carbon isemitted during the production of nuclear fuel.
U.S. nuclear reactors are fueled by enriched uranium (uranium with an increased proportion of uranium-235). About 15% of the uranium purchased by U.S. reactor operators in 2009 came fromdomestic sources, with most foreign supplies coming from Australia, Canada, and Russia. 52 Usingthe classification system of the International Atomic Energy Agency, worldwide reasonablyassured uranium resources are estimated to equal about 80 years of current annual consumption. 53 Some countries, particularly France, are reprocessing and recycling spent fuel from nuclearreactors to modestly extend uranium supplies. Research on technologies that could extenduranium supplies much further is being conducted by DOE and in several other countries. Amajor concern about such technology is that it may encourage the production of material thatcould be used in nuclear weapons.
Growth in U.S. nuclear power generation is expected to be small without favorable federalpolicies, such as carbon controls or a CES that includes nuclear energy. EIA projects that undercurrent policies, U.S. nuclear power generating capacity will rise from 101 gigawatts in 2009 to
111 gigawatts in 2035, with the increase coming from five new reactors and increased capacity atexisting reactors. 54 One new power reactor is currently under construction in the United States,the Watts Bar 2 reactor owned by the Tennessee Valley Authority. Construction of Watts Bar 2began in the 1970s but had been suspended until recently. License applications to build 18additional reactors have been submitted to the Nuclear Regulatory Commission (NRC), 55 but
48 MIT, The Future of Geothermal Energy: Impact of Enhanced Geothermal Systems (EGS) on the United States in the21 st Century , 2006, http://geothermal.inel.gov/publications/future_of_geothermal_energy.pdf.49 This section was written by Mark Holt.50 For more information on nuclear energy policy, see CRS Report RL33558, Nuclear Energy Policy , by Mark Holt.51 U.S. Energy Information Administration (EIA), “Net Generation by Energy Source: Total (All Sectors),”http://www.eia.doe.gov/cneaf/electricity/epm/table1_1.html.52
EIA, “Uranium Purchased by Owners and Operators of U.S. Civilian Nuclear Power Reactors by Origin Country andDelivery Year,” http://www.eia.gov/cneaf/nuclear/umar/table3.html.53 World Nuclear Association, “Supply of Uranium,” December 2010, http://www.world-nuclear.org/info/inf75.html.International Atomic Energy Agency, Classification of uranium reserves/resources , 1998, http://www-pub.iaea.org/ MTCD/publications/PDF/te_1035_prn.pdf.54 Energy Information Administration, Annual Energy Outlook 2011 , “Electricity Generation,” April 2011,http://www.eia.doe.gov/forecasts/aeo/index.cfm.55 U.S. Nuclear Regulatory Commission, “Expected New Nuclear Power Plant Applications,” March 21, 2011,http://www.nrc.gov/reactors/new-reactors/new-licensing-files/expected-new-rx-applications.pdf.

8/6/2019 Clean Energy Standard: Potential Qualifying Energy Sources
http://slidepdf.com/reader/full/clean-energy-standard-potential-qualifying-energy-sources 18/27
Clean Energy Standard: Potential Qualifying Energy Sources
Congressional Research Service 15
some of those have since been suspended or delayed, and the number of projects that will actuallyproceed to construction is unknown.
Along with low carbon and other emissions, a major advantage of nuclear power is its lack of vulnerability to volatile fuel prices. The cost of uranium is a small fraction of the total cost of
nuclear generation, unlike coal- and gas-fired plants, in which fuel is a major cost driver.However, the cost of building nuclear power plants is higher than that of fossil-fuel plants,placing new nuclear plants at an overall economic disadvantage, especially if natural gas pricesremain relatively low. EIA estimates that a new two-unit nuclear plant would cost $5,335 perkilowatt of capacity (in 2010 dollars without interest), compared with $978 for a combined-cyclenatural gas plant and $2,844 for a two-unit advanced pulverized coal plant. 56 Nuclear power isalso facing renewed scrutiny over safety in the wake of the recent accident at the FukushimaDaiichi nuclear plant in Japan, and continued concern over storage and disposal of highlyradioactive spent fuel.
Following are some policy questions that arise when considering the expansion of nuclear powerin the context of a CES:
• Would inclusion of existing nuclear power capacity in a CES encourage lifeextension of existing reactors? Concerns have been raised about the safety of older reactor designs, including those that are similar to the damaged Fukushimareactors. NRC contends that no U.S. reactor would be permitted to keepoperating if it did not meet U.S. safety standards, regardless of any economicincentives for continued operation.
• How would an expansion of nuclear power affect the management of highlyradioactive waste? The Obama Administration has moved to halt furtherdevelopment of the proposed national nuclear waste repository at YuccaMountain, Nevada. The Administration established the Blue-Ribbon Commissionon America’s Nuclear Future to develop an alternative strategy for nuclear waste
management. Until such a strategy can be implemented or barriers to YuccaMountain can be eliminated, spent nuclear fuel will continue to be stored atnuclear plant sites.
• Could new nuclear fuel technology lead to the proliferation of nuclearweapons? Advanced spent fuel reprocessing and reactor technologies couldgreatly increase the amount of energy extracted from uranium supplies andreduce the long-term radioactivity of nuclear waste. Such technologies are oftenviewed as crucial for long-term expansion of nuclear power. However, suchtechnologies also raise concerns about the separation of weapons-useableplutonium from spent fuel. A major goal of DOE nuclear research is to minimizethat problem. The spread of uranium enrichment technology also posesproliferation concerns.
56 EIA, “Updated Capital Cost Estimates for Electricity Generation Plants,” November 2010, http://www.eia.gov/oiaf/ beck_plantcosts/.

8/6/2019 Clean Energy Standard: Potential Qualifying Energy Sources
http://slidepdf.com/reader/full/clean-energy-standard-potential-qualifying-energy-sources 19/27
Clean Energy Standard: Potential Qualifying Energy Sources
Congressional Research Service 16
Solar 57 Solar energy, in the context of electricity generation potential, might be defined as radiation fromthe sun that reaches the earth’s surface. Energy from the sun can be used for heat and electricity.Converting solar energy into electricity is generally accomplished by capturing and converting
solar photons (photovoltaic), or capturing and converting heat from the sun (solar thermal).
Photovoltaic conversion typically uses semiconductor material (i.e., silicon) that absorbs photonsof a certain wavelength. Absorbed photons create electricity by dislodging electrons from thesemiconductor material. Electricity from this conversion process can be used at the generationsource or transmitted on the electrical grid to the areas of demand. 58
Solar thermal electricity conversion (also known as concentrating solar power) typically uses heatfrom the sun to generate electricity. Technologies used for solar thermal electricity generationinclude parabolic trough, power tower, linear fresnel, and dish stirling technologies. Trough,tower, and fresnel technologies typically use thermal energy from the sun to heat water and makesteam. The steam then powers a turbine generator, which in turn produces electricity. Dish stirling
technology typically does not require water for electricity production and instead relies onthermal expansion properties of gases, usually hydrogen or helium, to mechanically power astirling engine. 59
At the end of 2009, total solar electricity installations in the United States were approximately2,100 megawatts, up from 494 megawatts in 2000. 60 U.S. electricity generation in 2009 fromphotovoltaic and solar thermal technologies was 891,179 megawatt-hours, which represented0.02% of total electricity generation. 61 The majority of this electricity generation came fromphotovoltaic solar systems. 62 California, New Jersey, Pennsylvania, Hawaii, and Massachusettsare the top five states for installed photovoltaic systems. 63 Concentrated solar power (CSP), amuch less mature solar market segment, is typically better suited for high solar insolation areas indesert regions. Most CSP existing capacity and planned projects are located in southwestern
states such as California, Arizona, and Nevada.64
Some argue that solar electricity provides a number of benefits to the United States, such as zero-emission electricity generation, electricity that can be consumed at the point of generation, andpeak power production. 65 Critics of solar electricity point out several limitations to widespread
57 This section was written by Phillip Brown.58 For more information about photovoltaic technology, see National Renewable Energy Laboratory photovoltaicinformation available at http://www.nrel.gov/learning/re_photovoltaics.html.59 For more information about solar thermal technologies, see National Renewable Energy Laboratory solar thermalinformation available at http://www.nrel.gov/learning/re_csp.html60 Solar Energy Industries Association, U.S. Solar Industry: Year in Review 2009 , April 15, 2010. 61 Energy Information Administration, “Electric Power Annual 2009—Data Tables: 1990-2009 Net Generation by Stateby Type of Producer by Energy Source”, available at http://www.eia.doe.gov/cneaf/electricity/epa/epa_sprdshts.html. 62 For more information about solar markets, see Department of Energy, Energy Efficiency and Renewable Energy, 2008 Solar Technologies Market Report , January 2010.63 National Renewable Energy Laboratory, The Open PV Project , 2011, http://openpv.nrel.gov/rankings.64 Solar Electric Power Association, Solar Data & Mapping Tool , http://www.solarelectricpower.org/solar-tools/solar-data-and-mapping-tool.aspx.65 Solar electricity generation may sometimes align with peak power demands in various load centers and distributedgeneration opportunities.

8/6/2019 Clean Energy Standard: Potential Qualifying Energy Sources
http://slidepdf.com/reader/full/clean-energy-standard-potential-qualifying-energy-sources 20/27
Clean Energy Standard: Potential Qualifying Energy Sources
Congressional Research Service 17
solar electricity deployment. Possible limitations may include the cost of electricity generation, 66 intermittent operation, 67 and that some solar thermal technologies may require abundant watersupplies in areas that are typically water constrained. 68 Among other possible disadvantages arethat large-scale solar projects typically require large swaths of land that are not co-located withresidential or commercial demand, and transmitting large volumes of solar electricity may be
challenged by limited infrastructure.
Policy questions for solar as a qualifying CES energy source could include the following:
• How will the electricity grid compensate for the intermittent nature of solarelectricity? Grid operators are challenged with maintaining the grid integrity andkeeping electricity supply balanced with electricity demand. Stable sources of supply are necessary for reliable grid operations. Electricity generated from solartechnologies is, by its nature, variable and can fluctuate based on weatherpatterns. If solar electricity installations become a large source of electricity, gridoperations and reliability might be impacted.
• Should the federal government fund additional research and development
efforts that might reduce the cost of solar electricity production? In order toreduce the cost of solar electricity, research and development initiatives may benecessary. As a result, solar technology companies may seek additionalgovernment assistance to pay for cost reduction R&D activities. 69
• Will off-grid solar electricity projects be included in a CES? Opportunitiesexist for businesses and homeowners to generate solar electricity that may becompletely consumed on-site. These types of projects will be generatingelectricity, but the electricity may not be sent to the electric grid for sale to otherconsumers. Determining if off-grid solar generation will receive CES credits andaccounting for the role of state metering laws may be policy considerations aslegislation is formulated.
• How might a CES policy interact with natural resource policy? Solar projects(photovoltaic and thermal) generally require relatively large land areas for utilityscale generation. Some solar thermal technologies may also require largevolumes of water. Balancing electricity generation with natural resourcerequirements may be a topic of interest as CES policy is formulated. 70
66 Solar is generally considered the most expensive form of electricity with estimates ranging from $0.16 to $0.34 perkilowatt-hour: estimated natural gas electricity costs are $0.06 - $0.07 per kilowatt-hour. Annual Energy Outlook 2011,Levelized Cost of New Generation Resources in the Annual Energy Outlook 2011, Energy Information Administration,available at http://www.eia.doe.gov/oiaf/aeo/electricity_generation.html67 Solar electricity is produced when the sun is shining and weather patterns can impact production.68
For more information, see CRS Report R41507, Energy’s Water Demand: Trends, Vulnerabilities, and Management ,by Nicole T. Carter.69 DOE’s Sunshot Initiative aims to reduce the total system installation cost for solar to $1/watt, with an estimated costof energy of $0.06/kWhr. On April 8, 2011 DOE awarded $170 million towards solar efficiency improvements and costreductions. Additional information available at http://www1.eere.energy.gov/solar/sunshot/news_detail.html?news_id=1688270 For instance, concentrating solar power technologies can use more water to produce electricity than coal or naturalgas. For more information, see CRS Report R40631, Water Issues of Concentrating Solar Power (CSP) Electricity inthe U.S. Southwest , by Nicole T. Carter and Richard J. Campbell.

8/6/2019 Clean Energy Standard: Potential Qualifying Energy Sources
http://slidepdf.com/reader/full/clean-energy-standard-potential-qualifying-energy-sources 21/27
Clean Energy Standard: Potential Qualifying Energy Sources
Congressional Research Service 18
Water 71 Water can be used in various ways to generate electricity. Some water energy technologiesinclude conventional hydropower, small hydropower, low-head hydropower, hydrokinetic, tidalturbines, and ocean thermal energy. Hydropower is the generation of electricity from flowing or
falling water. Hydrokinetic electricity is generated by river currents that drive turbines anchoredto a river bottom or attached to an existing structure such as a bridge foundation. Tidal turbinescapture energy from tidal waves. Ocean thermal energy conversion uses the heat energy stored inthe earth’s oceans to generate electricity.
The most established form of water energy is conventional hydropower. Conventionalhydropower technologies include using turbines at storage facilities, pumped storage, and run-of-river plants. 72 Larger potential for increased hydropower generation lies primarily in the westernUnited States (California, Oregon, and Washington) and Alaska. 73 However, DOE reports thatroughly 33 states could increase their hydropower generation by 100% or more, assuming theydevelop as low-power (less than 1 average megawatt or MWa) projects or small hydro (between 1and 30 MWa) projects. 74 Moreover, the Bureau of Reclamation identified 70 sites on federal land
that could prove economically feasible for development of hydropower based on available dataand study assumptions. 75
The United States has used hydropower for more than 100 years, and at one point hydropowersupplied roughly 40% of all electricity generated. Hydropower was the largest renewable energysource for electricity generation in 2010. 76 Approximately 6% of total electricity net generation in2010 originated from conventional hydropower. 77 The EIA projects that conventional hydropowergeneration will have an annual growth rate of 0.5% from 2009 to 2035, but is not expected toexceed 7% of total U.S. electricity generating capacity in 2035. 78
Depending on the technology and site location, there are benefits and drawbacks to expandinghydropower. Some advantages include the generation of electricity as needed to meet demand
during peak periods, potentially lower capital costs to upgrade an existing facility or power a non- 71 This section was written by Kelsi Bracmort.72 For more information on hydropower technologies, see CRS Report R41089, Small Hydro and Low-Head HydroPower Technologies and Prospects , by Richard J. Campbell.73 For an estimate of natural stream water energy resources available anywhere in the United States for hydropower, seethe Idaho National Laboratory (INL) Virtual Hydropower Prospector (VHP) http://hydropower.inl.gov/prospector/ index.shtml.74 Douglas G. Hall, Kelly S. Reeves, and Julie Brizzee, et al., Feasibility Assessment of the Water Energy Resources of the United States for New Low Power and Small Hydro Classes of Hydroelectric Plants, Department of Energy Officeof Energy Efficiency and Renewable Energy, DOE-ID-11263, January 2006, http://www1.eere.energy.gov/ windandhydro/pdfs/doewater-11263.pdf.75
U.S. Department of the Interior Bureau of Reclamation, Hydropower Resource Assessments at Existing ReclamationFacilities , Denver, CO, March 2011, http://www.usbr.gov/power/AssessmentReport/ USBRHydroAssessmentFinalReportMarch2011.pdf.76 U.S. Energy Information Administration, Electric Power Monthly , April 2011, http://www.eia.doe.gov/cneaf/ electricity/epm/epm_sum.html.77 U.S. Energy Information Administration, Electric Power Monthly , April 2011, http://www.eia.doe.gov/cneaf/ electricity/epm/epm_sum.html.78 Energy Information Administration, Annual Energy Outlook 2011 , “Electricity Generation,” April 2011,http://www.eia.doe.gov/forecasts/aeo/index.cfm.

8/6/2019 Clean Energy Standard: Potential Qualifying Energy Sources
http://slidepdf.com/reader/full/clean-energy-standard-potential-qualifying-energy-sources 22/27
8/6/2019 Clean Energy Standard: Potential Qualifying Energy Sources
http://slidepdf.com/reader/full/clean-energy-standard-potential-qualifying-energy-sources 23/27
Clean Energy Standard: Potential Qualifying Energy Sources
Congressional Research Service 20
mechanical and electrical energy through a conversion technology. 83 Typically, a turbine andgenerator are used to capture wind energy and convert it to usable electricity.
Other than hydropower, wind is the largest developed renewable source of electricity in theUnited States. In 2010, 2.3% of U.S. electricity was generated from wind energy. 84 Wind
electricity generation facilities produced more than 70,000 million kilowatt-hours of electricity in2009. 85 To date, wind electricity generation has come from onshore assets, although abundantoffshore wind resources have not been developed and are close to coastal demand loads.
The United States was the largest wind market in the world in 2009, with installed U.S. windcapacity of approximately 35 gigawatts. 86 However, in 2010 China took the lead for the mostinstalled wind capacity, with approximately 44 gigawatts. 87 Total installed wind capacity in theUnited States at the end of 2010 was approximately 40 gigawatts. U.S. wind capacity is expectedto grow by 2.1% from 2009 to 2035, but is not expected to exceed 5% of total U.S. electricitygenerating capacity in 2035. 88
Wind is currently one of the lowest-cost renewable electricity options. According to the EIA, the
total levelized cost of energy (LCOE) for onshore wind electricity is $97 per megawatt-hour(MWhr) (see Table 1 ).89 For reference, EIA estimates that solar photovoltaic and solar thermalLCOEs are $210/MWhr and $311/MWhr, respectively. 90
Proponents for fostering wind development in the United States argue that wind power is cleanand emission-free, and that it does not deplete finite resources. In addition, proponents assert thatfuel for wind power is essentially free, thus providing a hedge against relatively volatile fossilenergy costs. Other suggested advantages are that wind energy may create jobs if the U.S. windmarket is expanded and may establish the United States as a global renewable energy leader.Opponents of wind energy development argue that wind energy is an intermittent resource andthus large-scale wind development may result in electricity grid disruptions. They also contendthat the best U.S. resources are located in somewhat remote areas with inadequate transmissionaccess to connect the resource with load centers; that wind projects have environmentalconsequences, including noise and threats to avian species; and that the total system cost of energy for wind is generally higher than for conventional fossil generation, and thus large-scaledevelopment of wind projects will ultimately result in higher consumer costs.
83 Bureau of Land Management, Wind Energy Guide , http://windeis.anl.gov/guide/index.cfm.84 U.S. Energy Information Administration, Electric Power Monthly , April 2011, http://www.eia.doe.gov/cneaf/ electricity/epm/epm_sum.html.85 2009 Renewable Energy Data Book , U.S. Department of Energy, Energy Efficiency and Renewable energy, August2010.86 American Wind Energy Association, U.S. Wind Industry Market Report , year ending 2009.87 Wind Energy Report 2010, World Wind Energy Association, April 8, 2011, available at http://www.wwindea.org/
home/images/stories/pdfs/worldwindenergyreport2010_s.pdf.88 Energy Information Administration, Annual Energy Outlook 2011 , “Electricity Generation,” April 2011,http://www.eia.doe.gov/forecasts/aeo/index.cfm.89 EIA’s LCOE calculations do not include tax credit and other subsidies available for wind projects. Factoring in thesesubsidies will reduce the cost of energy estimates. Energy Information Administration, “Levelized Cost of NewGeneration Resources in the Annual Energy Outlook 2011,” http://www.eia.doe.gov/oiaf/aeo/ electricity_generation.html.90 Energy Information Administration, “Levelized Cost of New Generation Resources in the Annual Energy Outlook 2011,” http://www.eia.doe.gov/oiaf/aeo/electricity_generation.html.

8/6/2019 Clean Energy Standard: Potential Qualifying Energy Sources
http://slidepdf.com/reader/full/clean-energy-standard-potential-qualifying-energy-sources 24/27
Clean Energy Standard: Potential Qualifying Energy Sources
Congressional Research Service 21
Policy questions for wind as a qualifying CES energy source could include the following:
• Could project location and wildlife concerns escalate to a level that mightimpede large-scale development of wind power projects? Some opponents of wind argue that rotating wind turbines are a threat to avian species, and some
opponents charge that noise from wind turbine operations is considered anuisance. Others are concerned with radar interference. If wind developmentcontinues to increase, these concerns could impact widespread development of wind projects in optimal locations.
• How will the electric grid compensate for the intermittent nature of windelectricity? Electricity generated from wind is, by its nature, intermittent andsomewhat unpredictable. With grid operators having responsibility for balancingthe grid by adjusting supply to accommodate demand, it may be important tohave stable and reliable sources of power. Given the intermittent nature of windelectricity generation, grid operators may experience challenges as wind capacityincreases. 91
Potential Demand-Side Source: Energy Efficiency 92 Energy efficiency is a demand-side resource that could contribute to a CES if reducing futureneeds for electric energy and power plant capacity is a goal. This section describes the concept of energy efficiency, opportunities for energy efficiency measures, and policy design issuesconcerning efficiency use in a CES. The section ends with possible policy implications shouldenergy efficiency be included in a CES.
An energy efficiency measure reduces the amount of energy required by specific end-use devicesand systems, without reducing the services provided. Energy efficiency is increased when anenergy conversion device, such as a household appliance, central air conditioner, or electricmotor, undergoes a technical change that enables it to provide the same service (lighting, cooling,motor drive) while using less energy. Energy efficiency involves all aspects of energy production,distribution, and end-use. The energy-saving result of the efficiency improvement is often called“energy conservation.” 93
For an electric utility company, energy efficiency measures are usually packaged into an outreachprogram that targets demand reductions on the customer’s side of the meter. The collective effectof efficiency improvements to a variety of end-use equipment (e.g., lights, refrigerators, airconditioners) provides demand-side power reductions that are equivalent in many ways to supply-side production from new power plants. As a result, energy efficiency can provide power serviceneeds while actually reducing resource use and environmental impacts.
91 Bonneville Power Administration (BPA) announced in February 2011 that they were planning to require windprojects in Washington and Oregon to cease operating in order to compensate for “overproduction” expected fromBPA’s hydropower assets. Wind project owners are appealing BPA’s proposed plan. More information is available athttp://www.sustainablebusinessoregon.com/articles/2011/04/bpa-pulls-back-on-plan-to-shut-off-wind.html.92 This section was written by Fred Sissine.93 These ideas of “efficiency” and “conservation” contrast with “curtailment,” which decreases output (e.g., turningdown the thermostat) or services (e.g., driving less) to curb energy use. That is, energy curtailment occurs when savingenergy causes a reduction in services or sacrifice of comfort. Curtailment is often employed as an emergency measure.

8/6/2019 Clean Energy Standard: Potential Qualifying Energy Sources
http://slidepdf.com/reader/full/clean-energy-standard-potential-qualifying-energy-sources 25/27
Clean Energy Standard: Potential Qualifying Energy Sources
Congressional Research Service 22
There has been considerable debate about the possible role of energy efficiency in a CES. Thereare at least three key advantages to the use of energy efficiency measures: it is availableeverywhere that power demand is located; because it cuts energy use, it may reduceenvironmental impacts; and when it helps avoid growth in power plant capacity, it also reducesthe need for additional reserve capacity and may reduce the need for additional transmission
infrastructure.
On the other hand, there are at least three disadvantages and/or barriers to the use of energyefficiency measures. First, utility profits generally follow in direct proportion to volume of powersales: the utility has an incentive to increase power sales and a disincentive to reduce power sales.Second, the analytic difficulty of estimating the potential cost savings from energy efficiencymeasures can deter utility customers (especially residential customers) from using cost-effectiveefficiency measures. 94 Third, the time requirement and statistical nature of evaluating the impactsof utility energy efficiency programs tends to cause a time delay for the results, and some degreeof uncertainty about the magnitude of actual energy savings.
The three main sectors that present opportunities for improving demand-side efficiency in electric
energy use are buildings, industry, and transportation. Buildings in the residential, commercial,and industrial sectors present the largest available opportunity. 95 In existing buildings, efficiencyimprovements can reduce power demanded by hundreds of types of electrical end-use equipment(e.g., lights, refrigerators, air conditioners). 96 Savings may also be available through increasedinsulation, more efficient windows, and other measures. For new buildings, additional designmeasures can be incorporated, such as passive heating and cooling features and buildingintegrated solar photovoltaics.
For industry, on-site power generation is another means to reduce demand for electricitygeneration. 97 Industrial process use of electricity is the next largest opportunity for efficiency. Forexample, large amounts of electricity are needed to process bauxite into final alloy products in thealuminum industry.
Due to heavy dependence on liquid fuels, the transportation sector currently provides a smalleropportunity for efficiency to reduce electric power use. Currently, most electric power use in thissector supports public transit systems. However, the recent policy focus on increasing the use of electric vehicles and hybrid-electric vehicles could cause the share of power use in this sector toclimb significantly.
94 “Smart” electronic meters for utility customers are a key part of efforts to transform the national power deliverysystem into a “smart grid.” To the extent that smart meters allow customers to see the potential cost-effectiveness (billreductions) of energy efficiency measures, increased use of smart meters may help increase use of energy efficiencymeasures offered through utility programs.95 For more about barriers to energy efficiency in buildings, see CRS Report R40670, Energy Efficiency in Buildings:
Critical Barriers and Congressional Policy , by Paul W. Parfomak, Fred Sissine, and Eric A. Fischer.96 Appliance efficiency standards direct manufacturers to improve efficiency, and green labeling programs, such as theEnergy Star Program, encourage consumers to use more efficient equipment. As new forms of equipment (e.g.,computers, power adapters, cell phones) are introduced into markets, standards may be established to make theequipment more efficient. Also, as technology (e.g., compressors for refrigerators) becomes more efficient, newopportunities arise to increase efficiency levels even further.97 The largest amount of on-site power generation is derived from industrial cogeneration power plants. Lesser impactsare derived in the residential and commercial sectors through on-site power generation from renewable energy andcombined heat-and-power (CHP) facilities.

8/6/2019 Clean Energy Standard: Potential Qualifying Energy Sources
http://slidepdf.com/reader/full/clean-energy-standard-potential-qualifying-energy-sources 26/27
Clean Energy Standard: Potential Qualifying Energy Sources
Congressional Research Service 23
There is at least one key issue that would influence the potential contribution from energyefficiency resources. Decoupling of electric utility profits from sales volume is a long-standingissue for the development of energy efficiency resources in power markets. Most utilities haverate structures that encourage greater electricity use by offering lower rates for larger purchases.This practice deters utility use of efficiency because it would reduce profits. Some states (e.g.,
California) have experimented with innovative rate-making policies that make efficiencyprofitable. Historically, utilities were designed to make profits in proportion to power salesvolume. In the face of growing power demands, that design factor has driven utilities to seek additional supply-side sources and deterred them from seeking demand-side energy efficiencysources that curb sales. Recognition of this key barrier has led to some state regulatory efforts to“decouple” utility profits from sales volume. California, for example, had such an electricity rate-adjustment mechanism in the early 1990s, dropped it during the industry restructuring trend of themid-to-late 1990s, and re-instated it after the state power shortages of 2001. The mechanismallows rates to increase slightly, to compensate for reduced sales, with the goal of reducing theoverall consumer bill.
The role of energy efficiency in a CES depends on potentially conflicting policy goals: use of
new, more expensive clean energy technologies or reducing overall demand for electricity. Onealternative that has been proposed is to establish a fixed percentage carve-out or “cap” for energyefficiency resources. This was an issue for recent efforts in the debate on renewable energyportfolio standard (RES) legislation. There are at least two purposes of such a cap. One purpose isto provide flexibility to regulated entities that may have a limited amount of clean energyresources. Another purpose is to limit the amount of efficiency resources that could have lowercosts in order to avoid diluting the main CES focus on developing new higher-cost forms of power supply.
Policy questions for energy efficiency as a qualifying CES energy source could includethe following:
• Do potential benefits of energy efficiency, such as lower power costs andreduced pollution, justify its inclusion as an eligible resource under a CES? Many energy efficiency measures are capable of rapid implementation and areavailable at costs well below those for supply-side resources. In this regard,efficiency may be seen to have less need for new incentives and regulatorypolicies, such as the CES.
• If energy efficiency measures were included in a CES, would the relativelylow costs inhibit the development and implementation of some clean energyand other supply-side power generation options? Could a cap on themaximum contribution from efficiency measures help avoid such a concern?Some previous proposals for an RES (i.e., §101 of H.R. 2454 in the 111 th Congress) included energy efficiency as a qualified source, but with a cap that set
a maximum for its contribution. A key purpose for including efficiency was toincrease flexibility for those states or regions that had limited renewable energyresources.
• If energy efficiency measures were included in a CES, would additionalfederal funding and regulatory policies (e.g., to help realign utility incentivesfor profitability) still be needed to help overcome barriers to broader use of energy efficiency measures to defer or displace power plants? The NAPEEstudy suggests that efficiency could make a major contribution, effectively
8/6/2019 Clean Energy Standard: Potential Qualifying Energy Sources
http://slidepdf.com/reader/full/clean-energy-standard-potential-qualifying-energy-sources 27/27
Clean Energy Standard: Potential Qualifying Energy Sources
providing the equivalent of up to 20,000 mw of new generating capacity over 10to 15 years, conditioned on a major increase in efficiency program funding andalignment of the utility profitability incentive.
Unresolved IssuesLegislative examination of a CES could raise multiple questions, including similar questionsposed during the renewable fuel standard (RFS) debate. 98 Which sources should be included?Should legislation account for other sources and technologies that are not yet developed? Howmuch clean electricity can be generated in the time frame specified from each qualifying energysource? Should a carbon accounting factor be assigned to each qualifying energy source? Will atime come when some resources (e.g., wind, solar) used to generate clean electricity cease to beconsidered a “free” resource? If so, what impact might this have on using that resource to meetthe CES mandate? Will certain clean energy sources (e.g., natural gas) force out or significantly
lower electricity generation from renewable resources? Should energy efficiency be included in aCES, and if so, how should it be included? How would a CES interact with state renewableelectricity requirements? Who would assume the costs of new transmission capacity? Thesequestions and other concerns require further exploration to ensure that, if established, a CESwould work as intended.
Author Contact Information
Kelsi Bracmort, CoordinatorAnalyst in Agricultural Conservation and NaturalResources [email protected], 7-7283
Mark HoltSpecialist in Energy [email protected], 7-1704
Phillip BrownAnalyst in Energy [email protected], 7-7386
Michael RatnerAnalyst in Energy [email protected], 7-9529
Peter FolgerSpecialist in Energy and Natural Resources [email protected], 7-1517
Fred SissineSpecialist in Energy [email protected], 7-7039
98 For more information on the RFS, see CRS Report R40155, Renewable Fuel Standard (RFS): Overview and Issues ,by Randy Schnepf and Brent D. Yacobucci.