Embed Size (px)
Citation preview

Clean Air Ontario | 1
CLEAN AIRONTARIO
Recognizing Nuclear’s Role in SupportingCoal Phase-Out to Achieve
Long-term Climate Change Goals
UPDATE

In 2005, the Greater Toronto Area suffered from 53 smog days. Through coal phase-out and clean air initatives, the province
had zero smog days in 2015.
2005 smog days = 53 2015 smog days = 0
TABLE OF CONTENTSExecutive Summary . . . . . . . . . . . . . . . . . . . . . . . . . . . . . . . . . . . . . . . . . . . . . . . . . . 1
Message from Michael W . Rencheck . . . . . . . . . . . . . . . . . . . . . . . . . . . . . . . . . . 2
Message from Vanessa Foran . . . . . . . . . . . . . . . . . . . . . . . . . . . . . . . . . . . . . . . . 3
Global Climate Change Challenge . . . . . . . . . . . . . . . . . . . . . . . . . . . . . . . . . . . . 4
Importance of an Emissions-free, Balanced Supply Mix . . . . . . . . . . . . . . . . 8
The 1990s: Ontario’s Growth in Coal Use . . . . . . . . . . . . . . . . . . . . . . . . . . . . . 10
Climate Change, Allergies and Asthma . . . . . . . . . . . . . . . . . . . . . . . . . . . . . . 11
Health Costs of Poor Air Quality . . . . . . . . . . . . . . . . . . . . . . . . . . . . . . . . . . . . . 12
How did Ontario Phase Out Coal? . . . . . . . . . . . . . . . . . . . . . . . . . . . . . . . . . . . 14
Role of Bruce Power Nuclear . . . . . . . . . . . . . . . . . . . . . . . . . . . . . . . . . . . . . . . . 15
Meeting Ontario’s Long-term Climate Change Goals . . . . . . . . . . . . . . . . 16
Electricity Price Stability & Economic Considerations . . . . . . . . . . . . . . . . . 18
References . . . . . . . . . . . . . . . . . . . . . . . . . . . . . . . . . . . . . . . . . . . . . . . . . . . . . . . . . 25

Asthma Society of Canada
The Asthma Society of Canada is the only national, volunteer-driven charity, solely devoted to enhancing the quality of life for people living with asthma and respiratory allergies . For more than 40 years, the Asthma Society of Canada has proudly served as the national voice for Canadians living with asthma; investing in asthma research in Canada and empowering patients with evidence-based information, education programs and support services .
Bruce Power
Bruce Power is Canada’s only private sector nuclear generator, operating the world’s largest operating nuclear facility . Bruce Power is a Canadian-owned partnership of TransCanada Corp ., Borealis Infrastructure (a trust established by the Ontario Municipal Employees Retire System), the Power Workers’ Union and The Society of Energy Professionals . Bruce Power is a leading clean energy company committed to providing approximately a third of Ontario’s electricity annually, while producing no carbon emissions and keeping prices stable and affordable for Ontario’s families, schools, hospitals and businesses .
Working Together
Bruce Power and the Asthma Society have a common desire to ensure people understand the relationship between electricity demand, human health and the climate . Ontario continues to be a leader in reducing electricity sector air emissions, and improving air quality . It is imperative we meet the growing global demand for electricity in a way that improves human life and protects the environment .
Clean Air Ontario | 1
EXECUTIVE SUMMARYEnergy is so intricately weaved into the everyday life of advanced economies that it takes a full power outage for people to even think about it .
The constant availability and reliability of power has allowed it to become a convenience – when it is dark, electricity is there at the flick of a switch; with the click of a button on your smartphone you’re connected to family on the other side of the world; and if you or a loved one is sick, you can seek medical attention in a fully equipped hospital, all thanks to energy . It is this improved quality of life that 2 .6 billion people around the world without access to electricity are also seeking .
Continued emissions of greenhouse gases will cause further warming and changes in all components of the climate system. Limiting climate change will require substantial and sustained reductions of greenhouse gas emissions.
Intergovernmental Panel on Climate Change 2013
As the world’s population continues to grow, and developing economies seek to improve their quality of life, so will the demand for energy . At the present time, as energy demand increases, so does the level of harmful greenhouse gas (GHGs) emissions into the atmosphere . This increase in GHGs is mainly from the burning of fossil fuels during the production of energy . These emissions are the major reason for the extreme changes we are seeing in the climate, as well as impacts to human health because of poor air quality . It is our duty, as global citizens, to meet the world’s growing energy needs without sacrificing the climate or human health . Growing energy demand must be met with clean and affordable electricity options that drive down harmful emissions and improve air quality .
The world is truly at a pivotal decision-making point . Scientific evidence indicates that, if we do not start decreasing our global GHG emissions, the earth will continue to warm and the quality of air will continue to deteriorate . In 2012 alone, seven million premature deaths were attributed to poor air quality, mainly caused by harmful emissions released during the burning of fossil fuels for energy production .
Meeting energy demands in a clean and affordable way is possible, and Ontario is a perfect example of how . In the early-2000s the provincial government committed to phasing out coal from its energy mix portfolio – a goal met in April 2014 . The phase out of coal saw a significant reduction in the province’s level of harmful GHG emissions, and the number of smog days plummeted from 53 in 2005 to zero in 2014 . The people of Ontario now have cleaner air from cleaner energy . A major part of this commitment was made possible through the refurbishment of previously laid-up nuclear reactor units, including four of the units at the Bruce Power site . From a full life-cycle analysis, nuclear power and wind are similar in magnitude when it comes to GHG emissions – the lowest of all energy options . Bringing Bruce Power’s four units back online replaced 70 per cent of the electricity that was lost by the closure of coal plants, while the other 30 per cent was mainly found through conservation and the expansion of renewables .
Coal phase-out also realized economic benefits for Ontarians through health care cost avoidance – in 2005 the Ontario Ministry of Energy indicated the benefits of coal phase-out would amount to about $70 billion through 2040 . Global energy demands can be met with a combination of nuclear and renewables, which would sharply decrease GHG emissions, improve air quality, boost quality of life, and benefit economies – just as Ontario has shown .

2 | Asthma Society of Canada and Bruce Power
Message from Michael W . Rencheck President and Chief Executive Officer, Bruce Power
Clean air is something we take for granted today in Ontario .
It hasn’t always been this way though . In the 1990s, after the former Ontario Hydro closed four nuclear units on what is now the Bruce Power site, the use of coal-fired electricity jumped drastically, from 12 per cent of Ontario’s energy supply to 29 per cent . Rising in unison was the number of smog days the province – specifically in the Greater Toronto Area – experienced during the hot summer months .
This had a significant impact on the quality of life for Ontario residents, especially those who live with asthma and other respiratory diseases, while also negatively impacting our health care system through increased hospital visits and rising medical costs .
Fortunately, since Bruce Power returned the four dormant nuclear units to service between 2003 and ’15 through a $10 billion private investment program, Ontario’s air quality has improved dramatically . The refurbishment of the four Bruce Power reactors added 3,000 megawatts of carbon-free electricity to Ontario’s grid, replacing 70 per cent of the power needed to shut down coal stations once and for all – a goal that was accomplished in 2014 when the Thunder Bay Generating Station burned its final piece of coal .
The result has been a drastic improvement to Ontario’s air quality, to the point where there were no smog advisories in the province in 2015, its first full year off coal . It was also the third consecutive year Bruce Power had supplied 30 per cent of Ontario’s energy at 30 per cent less than the average cost of power, all while being a zero-carbon energy source .
Bruce Power is poised to continue meeting 30 per cent of Ontario’s electricity needs for decades to come through the long-term agreement it signed with the Independent Electricity System Operator in late-2015, which will see a $13 billion private investment program in six of its units over 20 years, extending their life another 40 years . This asset management and life-extension program will help Ontario and Canada meet their carbon-reduction goals, as their focus shifts to a clean energy system and the increased electrification of transportation in Ontario and across Canada .
Ontario is serious about tackling climate change, which is why the province is also serious about securing the important role nuclear power plays in meeting our electricity needs for today and tomorrow, as outlined in the Long-Term Energy Plan .
By providing 30 per cent of Ontario’s power for the next 40 years, Bruce Power is ready to play a key role in keeping the province’s air clean .

Clean Air Ontario | 3
Message from Vanessa Foran President and CEO, Asthma Society of Canada
At the Asthma Society of Canada, we’re always looking for partners who are actively improving the quality of life for people who live with asthma, allergies and other respiratory illnesses .
By co-authoring, and now updating, this report with Bruce Power – a nuclear generator that supplies nearly one-third of Ontario’s energy – we continue to demonstrate how the province’s air quality has improved drastically over the past decade thanks to investment in Bruce Power’s eight nuclear reactors, which allowed for the closing of Ontario’s coal plants .
Reducing the amount of coal-fired generation over the past decade – which led to the closing of the final coal plant in early-2014 – breathed new life into the quality of the province’s air . Today, we are seeing practically no summer smog days in the Greater Toronto Area, which directly correlates with the province’s increased reliance on carbon-free nuclear energy and the phasing out of coal .
Every step we take toward a cleaner electricity supply mix and a reduced reliance on fossil fuels for energy and transportation, the better the air quality in the province . As we reduce carbon emissions, we increase the quality of life for our residents, especially those with asthma and allergies .
The Asthma Society of Canada is proud to partner with Bruce Power on this emissions report, and cannot emphasize enough the role clean, safe and carbon-free nuclear energy plays in improving the lives of Ontario residents .

4 | Asthma Society of Canada and Bruce Power
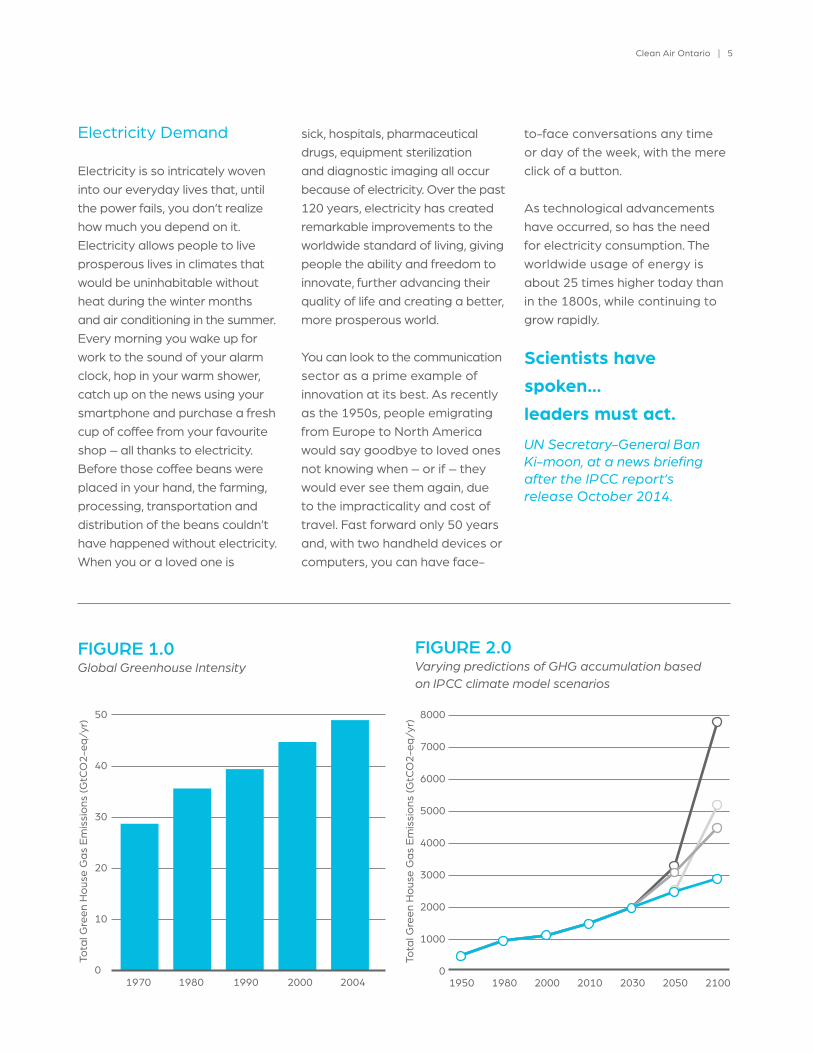
There is no doubt the world’s climate is changing . Although changes to the climate have occurred throughout history, the advances in technology over the past 50 years have allowed us to understand, predict and educate the world about them . Climate change is one of the most important issues facing the world today . We are at a critical juncture in human history – the Earth is warming due to increasing concentrations of greenhouse gas (GHG) emissions, specifically carbon dioxide (CO2) resulting from human activities, mainly the increased burning of fossil fuels (Figure 1 .0) . Energy production and supply is the major factor, increasing air emissions which are harmful to the climate and human health . Yet there are still 2 .6 billion people in the world who do not have access to electricity . As economies in the developing world grow, creating access and delivering energy to the ‘electricity poor’ must be part of the critical decision-making process . Various climate models predict that GHG emissions will continue to rise if critical decisions to reduce are not made (Figure 2 .0) .
Energy allows people opportunities to meet basic human needs such as shelter,
heat, nutrition and education, improving human life and allowing for opportunities to visit family and friends, further education or even invent new technologies .
The existing global energy demand, as well as future energy needs, must be met with clean and affordable electricity options to drive down GHG emissions and improve the world’s climate conditions . Meeting this growing energy demand must also be done in a way that does not jeopardize human health through poor air quality . In 2012, seven million premature deaths occurred globally because of air pollution . Reductions in air pollution from the energy sector could save millions of lives annually .
Ending Coal for Clean Air Act
In 2015, Ontario passed legislation to permanently ban coal-fired electricity generation in the province - a first in North America and a significant step in the fight against climate change .
The Ending Coal for Cleaner Air Act prevents new and existing facilities from burning coal for the sole purpose of generating electricity . It sets maximum fines for anyone who violates the ban
and enshrines the health and environmental benefits of making coal-fired electricity illegal in law .
This landmark legislation builds on Ontario’s leadership on climate change .
Closing coal-fired power plants represents one of the largest greenhouse gas reduction initiatives in North America . The closure has eliminated more than 30 megatonnes of annual GHG emissions, equivalent to taking seven-million vehicles off our roads . Closing coal has helped reduce the number of smog days in Ontario from 53 in 2005 to zero in 2015 .
Few risks have a greater impact on global health today than air pollution; the evidence signals the need for concerted action to clean up the air we all breathe.Dr Maria Neira, Director, World Health Organization, March 2014
GLOBAL CLIMATE CHANGE CHALLENGE
Clean Air Ontario | 5
Electricity Demand
Electricity is so intricately woven into our everyday lives that, until the power fails, you don’t realize how much you depend on it . Electricity allows people to live prosperous lives in climates that would be uninhabitable without heat during the winter months and air conditioning in the summer . Every morning you wake up for work to the sound of your alarm clock, hop in your warm shower, catch up on the news using your smartphone and purchase a fresh cup of coffee from your favourite shop – all thanks to electricity . Before those coffee beans were placed in your hand, the farming, processing, transportation and distribution of the beans couldn’t have happened without electricity . When you or a loved one is
sick, hospitals, pharmaceutical drugs, equipment sterilization and diagnostic imaging all occur because of electricity . Over the past 120 years, electricity has created remarkable improvements to the worldwide standard of living, giving people the ability and freedom to innovate, further advancing their quality of life and creating a better, more prosperous world .
You can look to the communication sector as a prime example of innovation at its best . As recently as the 1950s, people emigrating from Europe to North America would say goodbye to loved ones not knowing when – or if – they would ever see them again, due to the impracticality and cost of travel . Fast forward only 50 years and, with two handheld devices or computers, you can have face-
to-face conversations any time or day of the week, with the mere click of a button .
As technological advancements have occurred, so has the need for electricity consumption . The worldwide usage of energy is about 25 times higher today than in the 1800s, while continuing to grow rapidly .
Scientists have spoken… leaders must act.UN Secretary-General Ban Ki-moon, at a news briefing after the IPCC report’s release October 2014.
FIGURE 1.0Global Greenhouse Intensity
0
10
20
30
40
50
20042000199019801970
Tota
l Gre
en H
ouse
Gas
Em
issi
ons
(GtC
O2-
eq/y
r)
FIGURE 2.0Varying predictions of GHG accumulation based on IPCC climate model scenarios
0
1000
2000
3000
4000
5000
6000
7000
8000
2100205020302010200019801950
Tota
l Gre
en H
ouse
Gas
Em
issi
ons
(GtC
O2-
eq/y
r)
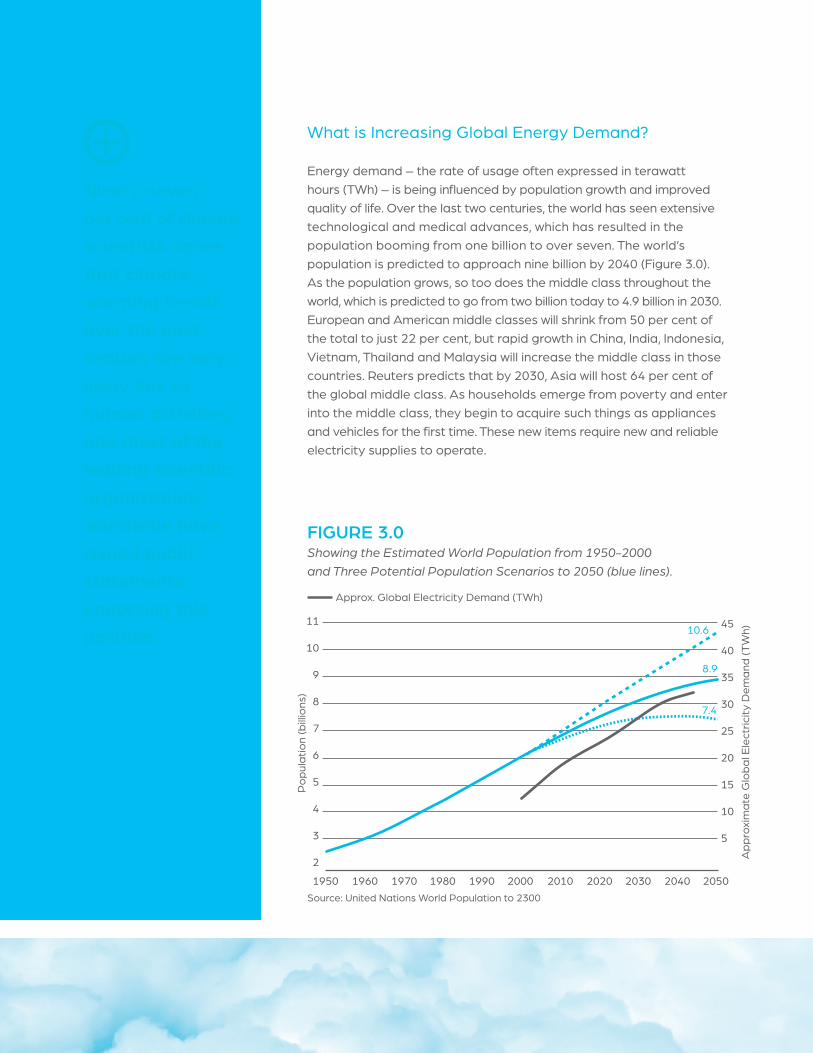
What is Increasing Global Energy Demand?
Energy demand – the rate of usage often expressed in terawatt hours (TWh) – is being influenced by population growth and improved quality of life . Over the last two centuries, the world has seen extensive technological and medical advances, which has resulted in the population booming from one billion to over seven . The world’s population is predicted to approach nine billion by 2040 (Figure 3 .0) . As the population grows, so too does the middle class throughout the world, which is predicted to go from two billion today to 4 .9 billion in 2030 . European and American middle classes will shrink from 50 per cent of the total to just 22 per cent, but rapid growth in China, India, Indonesia, Vietnam, Thailand and Malaysia will increase the middle class in those countries . Reuters predicts that by 2030, Asia will host 64 per cent of the global middle class . As households emerge from poverty and enter into the middle class, they begin to acquire such things as appliances and vehicles for the first time . These new items require new and reliable electricity supplies to operate .
Ninety-seven per cent of climate scientists agree that climate-warming trends over the past century are very likely due to human activities, and most of the leading scientific organizations worldwide have issued public statements endorsing this position.
Source: United Nations World Population to 2300
FIGURE 3.0Showing the Estimated World Population from 1950-2000 and Three Potential Population Scenarios to 2050 (blue lines).
1950 1960 1970 1980 1990 2000 2010 2020 2030 2040 2050
11
10
9
8
7
6
5
4
3
2
45
40
35
30
25
20
15
10
5
10.6
8.9
7.4
Pop
ulat
ion
(bill
ions
)
App
roxi
mat
e G
loba
l Ele
ctric
ity D
eman
d (T
Wh)
Approx . Global Electricity Demand (TWh)
Clean Air Ontario | 7
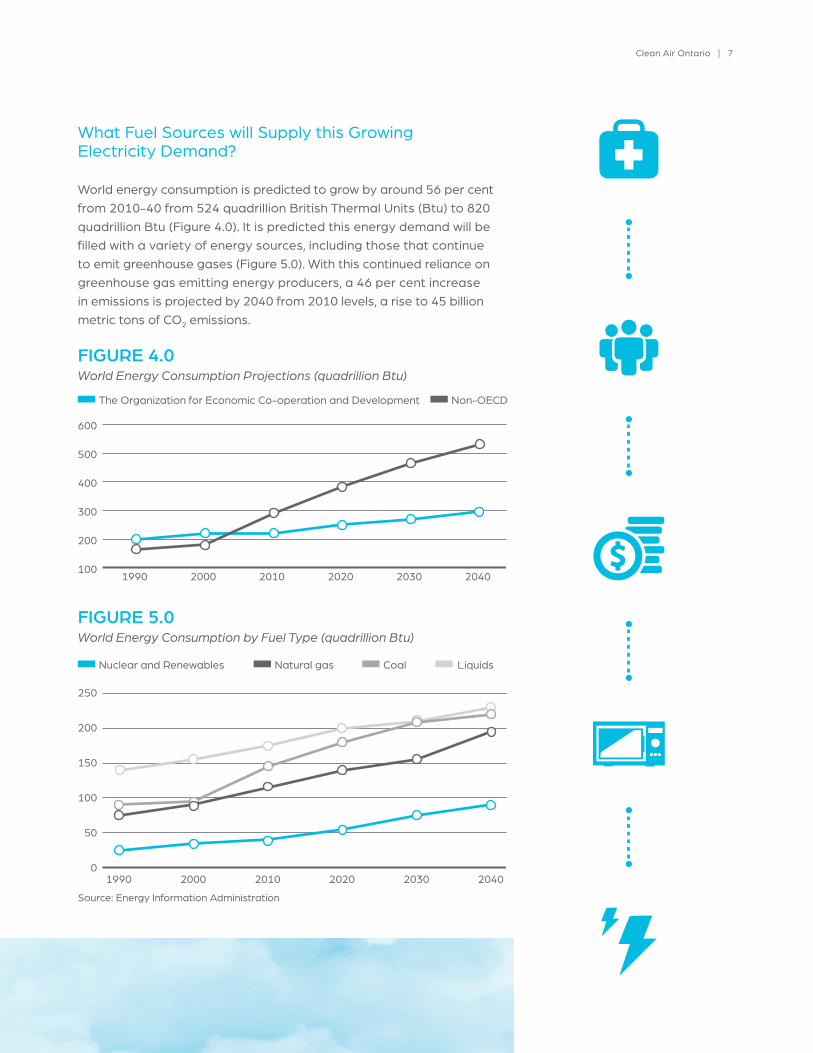
What Fuel Sources will Supply this Growing Electricity Demand?
World energy consumption is predicted to grow by around 56 per cent from 2010-40 from 524 quadrillion British Thermal Units (Btu) to 820 quadrillion Btu (Figure 4 .0) . It is predicted this energy demand will be filled with a variety of energy sources, including those that continue to emit greenhouse gases (Figure 5 .0) . With this continued reliance on greenhouse gas emitting energy producers, a 46 per cent increase in emissions is projected by 2040 from 2010 levels, a rise to 45 billion metric tons of CO2 emissions .
FIGURE 5.0World Energy Consumption by Fuel Type (quadrillion Btu)
Source: Energy Information Administration
0
50
100
150
200
250
204020302020201020001990
Nuclear and Renewables Natural gas Coal Liquids
FIGURE 4.0World Energy Consumption Projections (quadrillion Btu)
100
200
300
400
500
600
204020302020201020001990
The Organization for Economic Co-operation and Development Non-OECD
8 | Asthma Society of Canada and Bruce Power
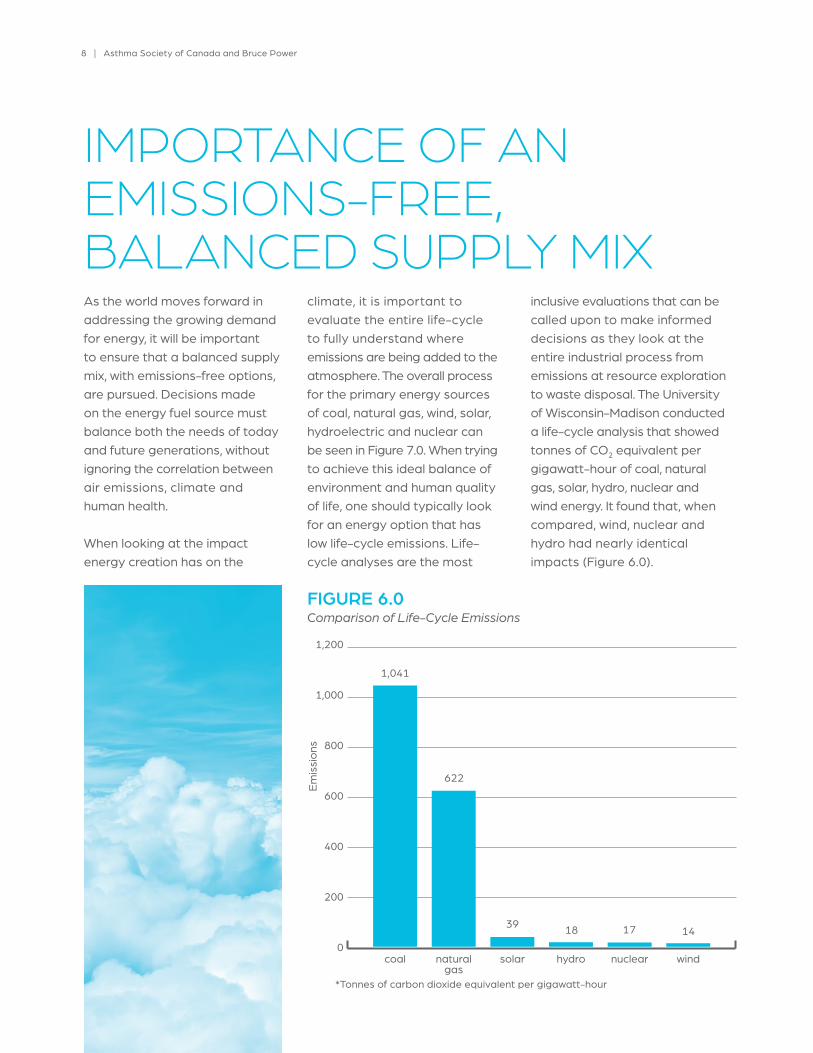
FIGURE 6.0Comparison of Life-Cycle Emissions
coal solar nuclearnaturalgas
Em
issi
ons
hydro wind
*Tonnes of carbon dioxide equivalent per gigawatt-hour
1,041
622
39 18 17 14
1,200
1,000
800
600
400
200
0
IMPORTANCE OF AN EMISSIONS-FREE, BALANCED SUPPLY MIXAs the world moves forward in addressing the growing demand for energy, it will be important to ensure that a balanced supply mix, with emissions-free options, are pursued . Decisions made on the energy fuel source must balance both the needs of today and future generations, without ignoring the correlation between air emissions, climate and human health .
When looking at the impact energy creation has on the
climate, it is important to evaluate the entire life-cycle to fully understand where emissions are being added to the atmosphere . The overall process for the primary energy sources of coal, natural gas, wind, solar, hydroelectric and nuclear can be seen in Figure 7 .0 . When trying to achieve this ideal balance of environment and human quality of life, one should typically look for an energy option that has low life-cycle emissions . Life-cycle analyses are the most
inclusive evaluations that can be called upon to make informed decisions as they look at the entire industrial process from emissions at resource exploration to waste disposal . The University of Wisconsin-Madison conducted a life-cycle analysis that showed tonnes of CO2 equivalent per gigawatt-hour of coal, natural gas, solar, hydro, nuclear and wind energy . It found that, when compared, wind, nuclear and hydro had nearly identical impacts (Figure 6 .0) .

Clean Air Ontario | 9
FIGURE 7.0Life-Cycle Flow of Energy and Driving Demand
Ontario’s Leadership Role: Coal Phase-out
Ontario serves as an example of the impacts of phasing out coal . Ontario was the first jurisdiction in North America to end its use of coal-fired electricity, when it closed the Thunder Bay Generating Station in April 2014 . This was a multi-year effort that not only decreased the average Ontarian’s environmental footprint, but also resulted in a financial benefit to the province . According to a 2005 Ministry of Energy report, phasing out coal could avoid 25,000 emergency room visits, 20,000 hospital admissions and 8 .1 minor illness cases, resulting in a financial benefit of $2 .6 billion annually .
Much of this success was made possible by Ontario’s nuclear industry – without it, phasing out coal would have been much more difficult . Moving forward, it is important for nuclear to continue to work with
renewables to maintain these emission-reduction efforts . In 2014, a life-cycle analysis by Hatch Ltd . looked at emissions of nuclear, wind and natural gas power generation . The study took a realistic approach to how a typical electricity market functions based on existing technology . In today’s world, wind generation does not supply electrical grids by itself, because of intermittent wind patterns and low reliability . Therefore, wind is typically backed up by another power source – currently natural gas . This creates emission challenges, but a better combination of nuclear and renewables, such as wind, would result in minimal full life-cycle emissions .
Having a balanced supply mix that allows for the continued advancement of renewable technology, while ensuring clean air, can occur with the continued operation of Ontario’s nuclear fleet . This continued operation would allow Ontario to maintain, build from, and realize its success of shutting down coal .
Primary energy sources
Energy carriers
Wholesale and retail energy markets
Demand for energy services
Prospecting Exploration Extraction Refining Distribution
$/litre $/kWh $/GJ $/tonne
SolarWindHydroUraniumGasCoal
DistributionStorage
Heat Solid fuels Liquidfuels
Gaseousfuels
Directelectricity
Primarysector
Transportsector
Buildingsector
Industrysector
Traditionalcooking water &
space heating
10 | Asthma Society of Canada and Bruce Power
THE 1990s: ONTARIO’S GROWTH IN COAL USECoal has a long history in Canada, dating back as far at the 1630s when the first mine opened in Grand Lake, NB . Until the 1950s, coal was used for heating, industrial energy and transportation, later being replaced by petroleum products and natural gas . However, growth of the international steel markets, increased crude oil pricing and oil supply disruptions in the 1970s brought focus back to coal as an alternate source of energy in Canada, resulting in the expansion of the industry . Coal continues to meet about one-eighth of Canada’s primary energy needs, mainly as the fuel source for electricity generation . However, the production and use of coal can create environmental problems, specifically with air emissions . Coal results in sulphur dioxide, nitrogen oxide and carbon dioxide emissions, which all contribute to poor air quality and result in climate change .
Until the 1950s, Ontario’s electricity system was quite simple, as almost all the province’s power came from hydroelectric sources, and the system demand was relatively small . However, the post-war economic boom challenged the energy system as demand grew . With accessible water power options already having been exhausted, the limitations of the distribution system were exposed . To resolve these limitations, the province began building coal-fired electricity plants near areas of demand, and also began plans to build nuclear power plants across the province . Between the 1980s and early-’90s, 20 CANDU power reactors were brought into service, with eight reactors in both Tiverton (at the Bruce site) and Pickering, ON, and four at Darlington . A report published in 1989 by Ontario Hydro predicted a supply
demand gap of 9,700 megawatts (MW) by 2005 and 21,300 MW by 2014 . To address this, Ontario Hydro proposed more nuclear and coal generation be built . However, for a variety of reasons including recession and economic restructuring, no additional generating facilities were ever built .
In the early-’90s, Ontario’s nuclear fleet was assessed based on age and it was determined that, in order to optimize the province’s nuclear assets, seven of the oldest plants would be shut down for refurbishment . This included the layup of Bruce A’s Unit 2 in 1995, Unit 1 in 1997 and Units 3 and 4 in 1998 – a loss of over 3,000 MW of generation from the Bruce site alone . In order to replace the lost generation capacity, Ontario Hydro relied heavily on its five coal-fired generation facilities, resulting in a doubling of greenhouse gas emissions, smog and acid rain precursors from 1997 to 2001 . In 2001, coal plants released as much air pollution as 6 .2 million cars, and were listed as Canada’s Number 1 and 2 air polluters .
Increased air emissions was a growing public concern and during the 2003 provincial election campaign, Ontarians saw all parties include coal phase-out in their platforms . By 2014, coal use was no longer a part of Ontario’s energy supply mix .

Clean Air Ontario | 11
CLIMATE CHANGE, ALLERGIES AND ASTHMA
Regardless of where one lives, people with respiratory challenges will feel the effects of climate change . The rates of people with severe forms of asthma are climbing with estimated 150,000 - 250,000 patients . Climate change will exacerbate symptoms in many of these individuals, placing an added burden on the already stretched health care system, in addition to an increased personal burden on individuals .
The most vulnerable Canadians, including children and seniors, families on low incomes and many Aboriginal people (those who are more likely to live closer to industrial areas, highways or forests that could be swept by wildfire) are already feeling the effects the most . And it will get worse .
A paper published in the respected medical journal Chest, in 2013, declared that climate change is, “A health threat no less consequential than cigarette smoking .” Meanwhile the World Health Organization (WHO) estimates that indoor and outdoor air pollution produces around 7 million early deaths each year . Not only will patients with asthma, chronic obstructive pulmonary disease and other lung problems die earlier and be in worse health because of air pollution, they will
also be at greater risk due to more severe and prolonged heat waves, variations in temperature, forest fires, droughts and floods .
But the issue is not only air pollution . Climate change and increased levels of CO₂, including ground-level ozone with its attendant smog, also lead to negative consequences in the so-called natural environment . Scientists have shown that climate change will bring about an increase in aeroallergens, making those with allergies suffer for longer periods of time and more acutely .
How Can this Happen?
Climate change will bring about longer growing seasons with longer periods of active pollen production; longer dry periods and droughts leading to more forest fires and wood smoke, as well as more dust and dust mites; more extreme weather conditions leading to flooding and increased mould; and a plant world under stress acting on its “instinct” to survive and a greater production of plant pollen, leading to more problems for people suffering with ragweed, hay fever and other respiratory allergies .
Ontario has become the first regional jurisdiction in all of North America to take these steps on the burning of coal. We can solve (climate change), but we need to get busy and follow Ontario’s lead. Former U.S. Vice-President Al Gore to the Toronto Star
12 | Asthma Society of Canada and Bruce Power
HEALTH COSTS OF POOR AIR QUALITYAir is a basic necessity for life, and the protection of its quality is vital . Various studies from around the world have concluded that combustion-related emissions, such as those produced in a variety of electricity generation processes, can cause substantial impacts to human health and environment . Health risks associated with air pollutants vary from minor illness to premature death, and are largely associated with exposure to ozone and particulate matter . Energy supply options differ in their overall environmental and health impacts, and, as stated earlier, it’s important to look at full life-cycle when completing an evaluation, while also looking at the economic
side of the equation . A rise in air emissions from energy production will also result in an increased burden on health care systems .
A study conducted by the Canadian Medical Association indicated that, in 2008, the economic costs of air pollution topped $8 billion, an annual cost expected to accumulate to over $250 billion by 2031 . These associated costs include premature death, hospital admission, emergency department visits, minor illnesses and doctor’s office visits .
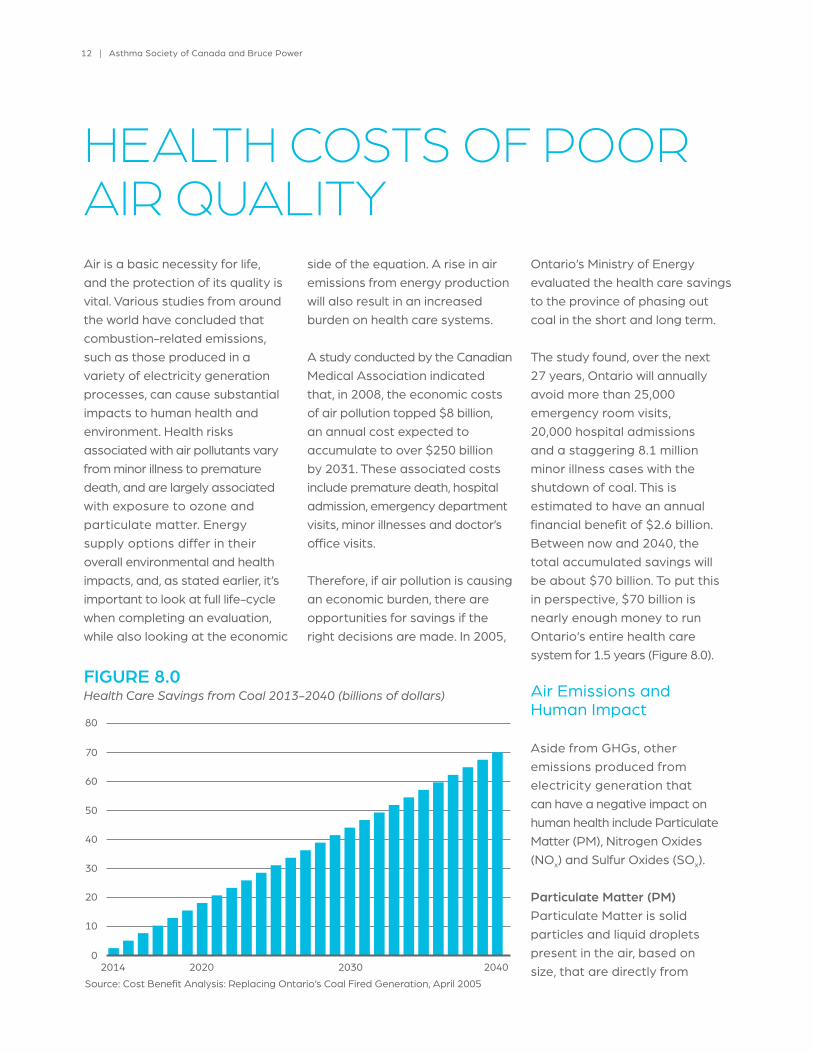
Therefore, if air pollution is causing an economic burden, there are opportunities for savings if the right decisions are made . In 2005,
Ontario’s Ministry of Energy evaluated the health care savings to the province of phasing out coal in the short and long term .
The study found, over the next 27 years, Ontario will annually avoid more than 25,000 emergency room visits, 20,000 hospital admissions and a staggering 8 .1 million minor illness cases with the shutdown of coal . This is estimated to have an annual financial benefit of $2 .6 billion . Between now and 2040, the total accumulated savings will be about $70 billion . To put this in perspective, $70 billion is nearly enough money to run Ontario’s entire health care system for 1 .5 years (Figure 8 .0) .
Air Emissions and Human Impact
Aside from GHGs, other emissions produced from electricity generation that can have a negative impact on human health include Particulate Matter (PM), Nitrogen Oxides (NOx) and Sulfur Oxides (SOx) .
Particulate Matter (PM) Particulate Matter is solid particles and liquid droplets present in the air, based on size, that are directly from
Source: Cost Benefit Analysis: Replacing Ontario’s Coal Fired Generation, April 2005
80
70
60
50
40
30
20
10
02040203020202014
FIGURE 8.0Health Care Savings from Coal 2013-2040 (billions of dollars)
Clean Air Ontario | 13
combustion sources or indirectly from emissions of SOx and NOx reacting with ammonia . Health impacts related to PM will vary with season and size, and it has the ability to deposit within the lungs . PM has been associated with asthma exacerbation, inflammation and changed heart rate . Exposure to PM has also been associated with increased incidence of respiratory diseases, including chronic obstructive pulmonary disease, cancer and pneumonia .
Nitrogen Oxides (NOx) Nitrogen Oxides are typically found in the form of nitric oxide (NO) and nitrogen dioxide (NO2) . Typically this pollutant affects people with pre-existing respiratory problems . NO2 is a known lung irritant and can
increase respiratory illnesses by lowering resistance to infection . In high levels, NOx will make breathing difficult for people who already suffer from asthma or bronchitis .
Sulphur Oxides (SOx) Sulphur Oxides, as an air pollutant, are often found in the form of sulphur dioxides (SO2), typically a colourless gas . Relatively high levels of exposure to SOx are known to cause bronchoconstriction and worsened asthma symptoms, as it can react with other substances in the air to create PM .
What does this Mean in Ontario?
Air pollution does not see boundaries of provinces or countries, and it is up to each
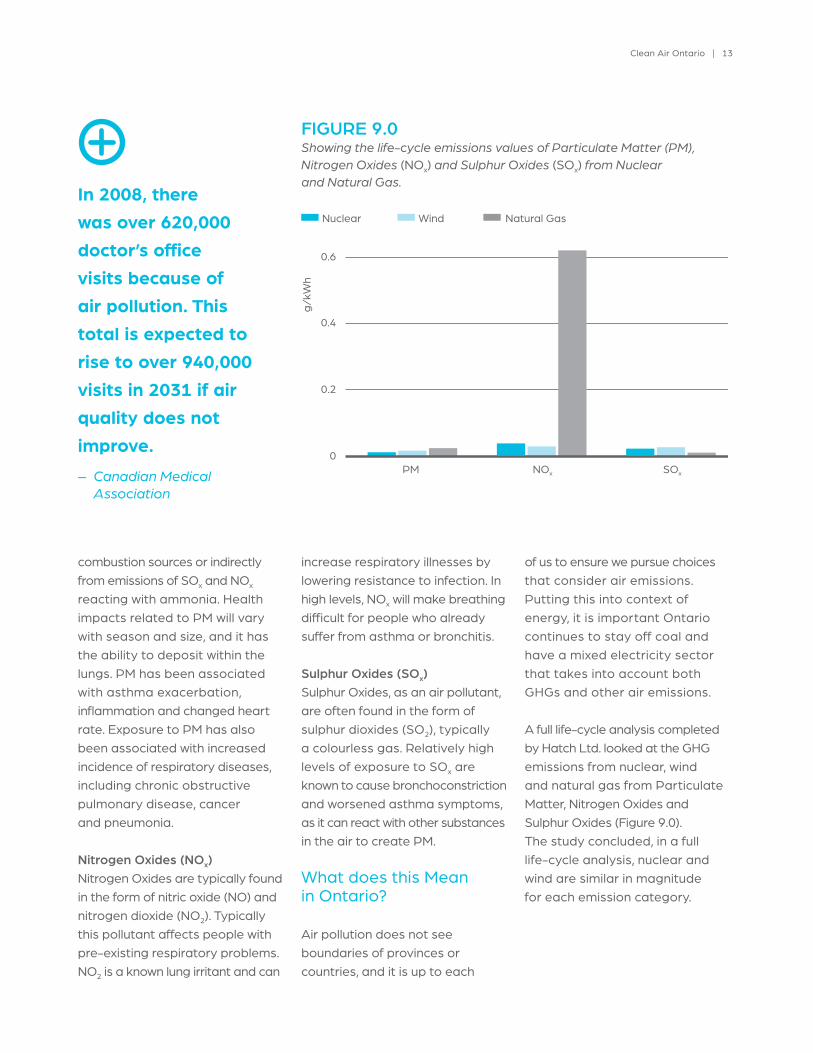
In 2008, there was over 620,000 doctor’s office visits because of air pollution. This total is expected to rise to over 940,000 visits in 2031 if air quality does not improve. – Canadian Medical Association
of us to ensure we pursue choices that consider air emissions . Putting this into context of energy, it is important Ontario continues to stay off coal and have a mixed electricity sector that takes into account both GHGs and other air emissions .
A full life-cycle analysis completed by Hatch Ltd . looked at the GHG emissions from nuclear, wind and natural gas from Particulate Matter, Nitrogen Oxides and Sulphur Oxides (Figure 9 .0) . The study concluded, in a full life-cycle analysis, nuclear and wind are similar in magnitude for each emission category .
FIGURE 9.0Showing the life-cycle emissions values of Particulate Matter (PM), Nitrogen Oxides (NOx) and Sulphur Oxides (SOx) from Nuclear and Natural Gas.
0
0.2
0.4
0.6
g/kW
h
PM NOx SOx
Nuclear Wind Natural Gas
14 | Asthma Society of Canada and Bruce Power
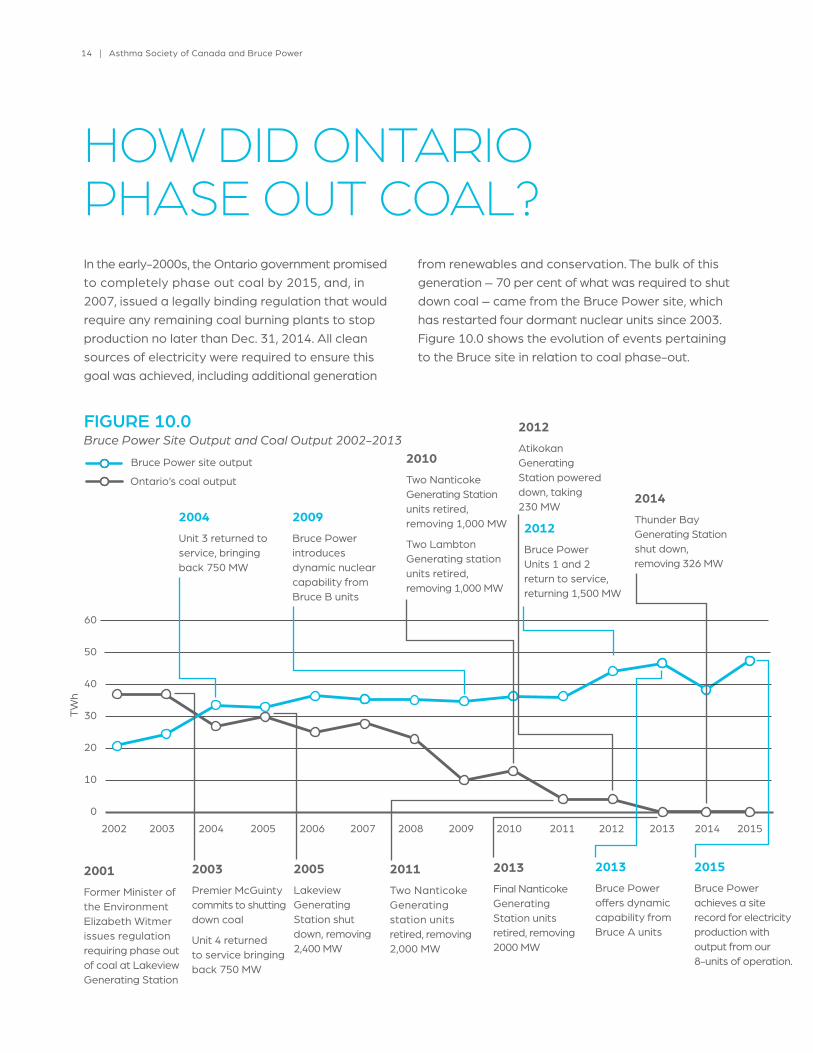
Bruce Power site output
Ontario’s coal output
FIGURE 10.0Bruce Power Site Output and Coal Output 2002-2013
2003
Premier McGuinty commits to shutting down coal
Unit 4 returned to service bringing back 750 MW
2004Unit 3 returned to service, bringing back 750 MW
2005Lakeview Generating Station shut down, removing 2,400 MW
2009Bruce Power introduces dynamic nuclear capability from Bruce B units
2010Two Nanticoke Generating Station units retired, removing 1,000 MW
Two Lambton Generating station units retired, removing 1,000 MW
2011Two Nanticoke Generating station units retired, removing 2,000 MW
2012Bruce Power Units 1 and 2 return to service, returning 1,500 MW
2013Bruce Power offers dynamic capability from Bruce A units
2015Bruce Power achieves a site record for electricity production with output from our 8-units of operation .
2014Thunder Bay Generating Station shut down, removing 326 MW
HOW DID ONTARIO PHASE OUT COAL?In the early-2000s, the Ontario government promised to completely phase out coal by 2015, and, in 2007, issued a legally binding regulation that would require any remaining coal burning plants to stop production no later than Dec . 31, 2014 . All clean sources of electricity were required to ensure this goal was achieved, including additional generation
from renewables and conservation . The bulk of this generation – 70 per cent of what was required to shut down coal – came from the Bruce Power site, which has restarted four dormant nuclear units since 2003 . Figure 10 .0 shows the evolution of events pertaining to the Bruce site in relation to coal phase-out .
60
50
40
30
20
10
0
2002 2003 2004 2005 2006 2007 2008 2009 2010 2011 2012 2013 2014 2015
TWh
2001Former Minister of the Environment Elizabeth Witmer issues regulation requiring phase out of coal at Lakeview Generating Station
2013Final Nanticoke Generating Station units retired, removing 2000 MW
2012Atikokan Generating Station powered down, taking 230 MW
Clean Air Ontario | 15
2002 2003 2004 2005 2006 2007 2008 2009 2010 2011 2012 2013 2014 2015
THEN
Bruce Output Down On Oct, 16, 1997, Unit 1 was laid up, taking 750 MW of electricity off Ontario’s grid . Unit 2 had been laid up two years earlier . Units 3 and 4 were both laid up in 1998 . Many thought Bruce A would never return to service.
Coal Output Up Following Units 1 and 2 being removed from service, combined with Units 3 and 4 in 1998, fossil generation dramatically increased in Ontario – from 12 per cent of the province’s energy supply mix in 1995 to 29 per cent in 2000 .
NOW
Bruce Output Up Seventeen years later, Bruce Units 1 and 2 are producing low-cost, clean electricity . Since 2004, Bruce A Units 3 and 4 have demonstrated safe, reliable operations . The revitalization of Bruce A provides Ontario with an additional 3,000 MW of low-cost, clean electricity, since the number of operating units on site was doubled from four to eight, while Bruce B continues to be counted on for 15 per cent of Ontario’s electricity .
Coal Output Down Over the past decade, Ontario reduced its use of coal by nearly 100 per cent, accounting for just two per cent of the electricity in 2013 before being shut down in 2014 . The result has been a 93 per cent reduction in Ontario sulphur emissions and the number of smog days in the Greater Toronto Area dropped from 53 days in 2005 to zero in 2014 .
ROLE OF BRUCE POWER NUCLEAR
Nuclear power plays a critical role in meeting the energy and air quality needs of the province every day . Since 2013, nuclear accounted for more than 59 per cent of Ontario’s electricity supply, with Bruce Power providing 30 per cent of the province’s power and over half its nuclear . A coal-free electricity supply mix has led to a significant reduction in
harmful emissions, contributing to cleaner air and a healthier environment . Since 2001, Bruce Power has doubled the number of its operating units, contributing significantly to Ontario’s agenda to phase out coal . In fact, the increased energy from Bruce Power nuclear from 2002-15 accounts for about 70 per cent of the energy Ontario needed to phase out coal .
16 | Asthma Society of Canada and Bruce Power
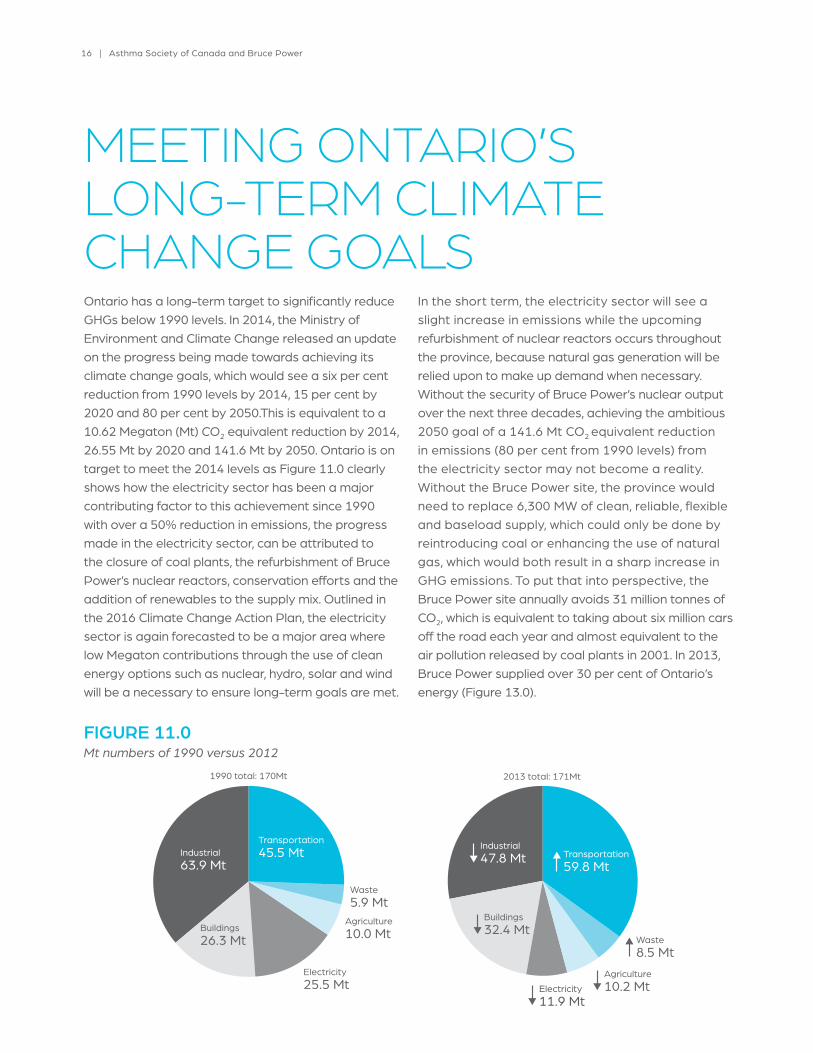
FIGURE 11.0Mt numbers of 1990 versus 2012
MEETING ONTARIO’S LONG-TERM CLIMATE CHANGE GOALS Ontario has a long-term target to significantly reduce GHGs below 1990 levels . In 2014, the Ministry of Environment and Climate Change released an update on the progress being made towards achieving its climate change goals, which would see a six per cent reduction from 1990 levels by 2014, 15 per cent by 2020 and 80 per cent by 2050 .This is equivalent to a 10 .62 Megaton (Mt) CO2 equivalent reduction by 2014, 26 .55 Mt by 2020 and 141 .6 Mt by 2050 . Ontario is on target to meet the 2014 levels as Figure 11 .0 clearly shows how the electricity sector has been a major contributing factor to this achievement since 1990 with over a 50% reduction in emissions, the progress made in the electricity sector, can be attributed to the closure of coal plants, the refurbishment of Bruce Power’s nuclear reactors, conservation efforts and the addition of renewables to the supply mix . Outlined in the 2016 Climate Change Action Plan, the electricity sector is again forecasted to be a major area where low Megaton contributions through the use of clean energy options such as nuclear, hydro, solar and wind will be a necessary to ensure long-term goals are met .
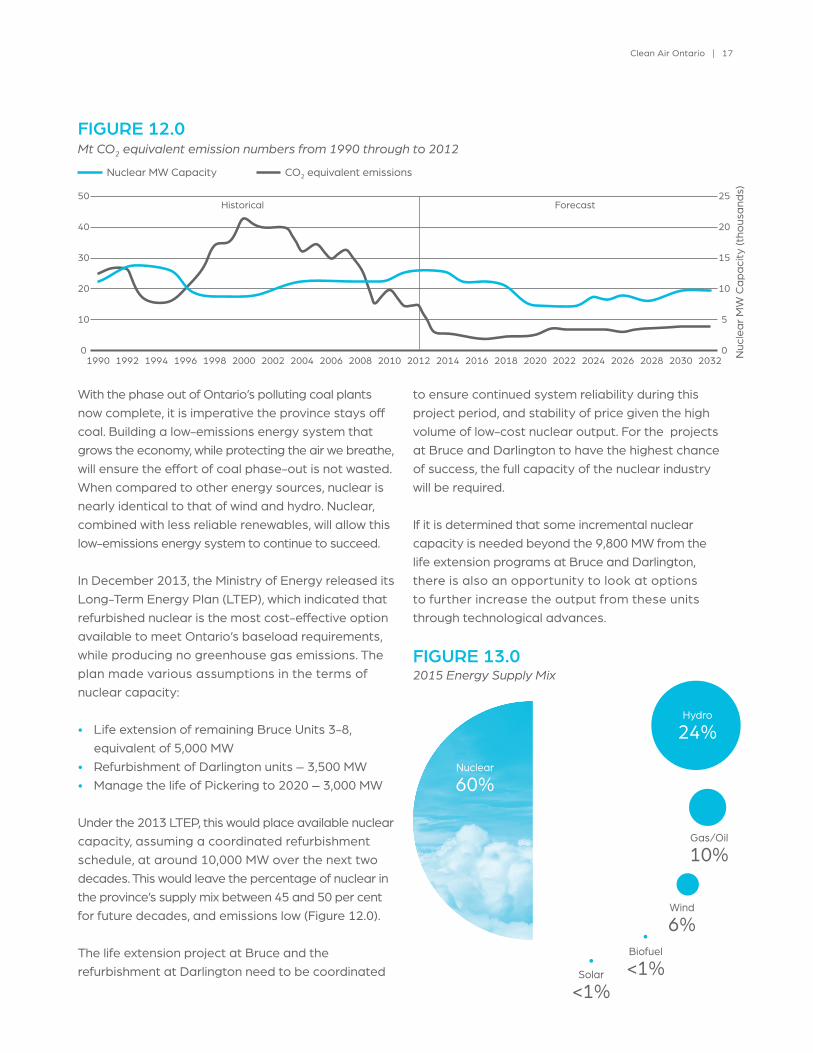
In the short term, the electricity sector will see a slight increase in emissions while the upcoming refurbishment of nuclear reactors occurs throughout the province, because natural gas generation will be relied upon to make up demand when necessary . Without the security of Bruce Power’s nuclear output over the next three decades, achieving the ambitious 2050 goal of a 141 .6 Mt CO2 equivalent reduction in emissions (80 per cent from 1990 levels) from the electricity sector may not become a reality . Without the Bruce Power site, the province would need to replace 6,300 MW of clean, reliable, flexible and baseload supply, which could only be done by reintroducing coal or enhancing the use of natural gas, which would both result in a sharp increase in GHG emissions . To put that into perspective, the Bruce Power site annually avoids 31 million tonnes of CO2, which is equivalent to taking about six million cars off the road each year and almost equivalent to the air pollution released by coal plants in 2001 . In 2013, Bruce Power supplied over 30 per cent of Ontario’s energy (Figure 13 .0) .
Waste5.9 Mt
Agriculture10.0 Mt
Electricity25.5 Mt
Transportation45.5 Mt
Buildings26.3 Mt
Industrial63.9 Mt
1990 total: 170Mt 2013 total: 171Mt
Transportation59.8 Mt
Industrial47.8 Mt
Buildings32.4 Mt
Electricity11.9 Mt
Agriculture10.2 Mt
Waste8.5 Mt
Clean Air Ontario | 17
to ensure continued system reliability during this project period, and stability of price given the high volume of low-cost nuclear output . For the projects at Bruce and Darlington to have the highest chance of success, the full capacity of the nuclear industry will be required .
If it is determined that some incremental nuclear capacity is needed beyond the 9,800 MW from the life extension programs at Bruce and Darlington, there is also an opportunity to look at options to further increase the output from these units through technological advances .
Solar
<1%
Wind 6%
Biofuel <1%
Gas/Oil
10%
FIGURE 13.02015 Energy Supply Mix
FIGURE 12.0Mt CO2 equivalent emission numbers from 1990 through to 2012
With the phase out of Ontario’s polluting coal plants now complete, it is imperative the province stays off coal . Building a low-emissions energy system that grows the economy, while protecting the air we breathe, will ensure the effort of coal phase-out is not wasted . When compared to other energy sources, nuclear is nearly identical to that of wind and hydro . Nuclear, combined with less reliable renewables, will allow this low-emissions energy system to continue to succeed .
In December 2013, the Ministry of Energy released its Long-Term Energy Plan (LTEP), which indicated that refurbished nuclear is the most cost-effective option available to meet Ontario’s baseload requirements, while producing no greenhouse gas emissions . The plan made various assumptions in the terms of nuclear capacity:
• Life extension of remaining Bruce Units 3-8, equivalent of 5,000 MW• Refurbishment of Darlington units – 3,500 MW• Manage the life of Pickering to 2020 – 3,000 MW
Under the 2013 LTEP, this would place available nuclear capacity, assuming a coordinated refurbishment schedule, at around 10,000 MW over the next two decades . This would leave the percentage of nuclear in the province’s supply mix between 45 and 50 per cent for future decades, and emissions low (Figure 12 .0) .
The life extension project at Bruce and the refurbishment at Darlington need to be coordinated
0
10
20
30
40
50
0
5
10
15
20
25
2032203020282026202420222020201820162014201220102008200620042002200019981996199419921990
Historical Forecast
Nuc
lear
MW
Cap
acity
(tho
usan
ds)
Nuclear MW Capacity CO2 equivalent emissions
Nuclear
60%Bruce Power
30%(50% of nuclear)
Hydro
24%
18 | Asthma Society of Canada and Bruce Power
ELECTRICITY PRICE STABILITY & ECONOMIC CONSIDERATIONS
Not only is Ontario attempting to achieve long-term climate change goals, it is also trying to ensure affordable power, jobs and economic growth and prosperity for the province . Ontario outlined, in its Long-Term Energy Plan (LTEP), the role nuclear and renewables would play in ensuring all of these mandates are met .
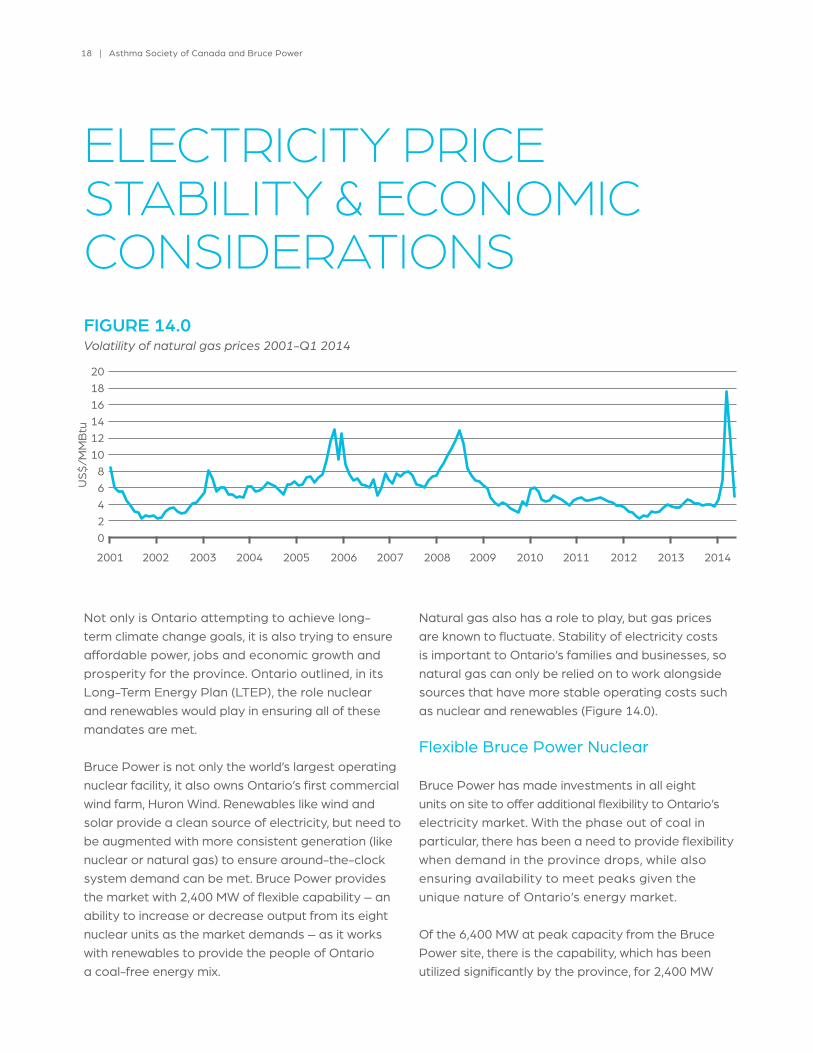
Bruce Power is not only the world’s largest operating nuclear facility, it also owns Ontario’s first commercial wind farm, Huron Wind . Renewables like wind and solar provide a clean source of electricity, but need to be augmented with more consistent generation (like nuclear or natural gas) to ensure around-the-clock system demand can be met . Bruce Power provides the market with 2,400 MW of flexible capability – an ability to increase or decrease output from its eight nuclear units as the market demands – as it works with renewables to provide the people of Ontario a coal-free energy mix .
Natural gas also has a role to play, but gas prices are known to fluctuate . Stability of electricity costs is important to Ontario’s families and businesses, so natural gas can only be relied on to work alongside sources that have more stable operating costs such as nuclear and renewables (Figure 14 .0) .
Flexible Bruce Power Nuclear
Bruce Power has made investments in all eight units on site to offer additional flexibility to Ontario’s electricity market . With the phase out of coal in particular, there has been a need to provide flexibility when demand in the province drops, while also ensuring availability to meet peaks given the unique nature of Ontario’s energy market .
Of the 6,400 MW at peak capacity from the Bruce Power site, there is the capability, which has been utilized significantly by the province, for 2,400 MW
20
2001 2002 2003 2004 2005 2006 2007 2008 2009 2010 2011 2012 2013 2014
US$
/MM
Btu
1816141210
86420
FIGURE 14.0Volatility of natural gas prices 2001-Q1 2014
Clean Air Ontario | 19
20000
18000
16000
14000
12000
10000
8000
60004/26 4/27 4/28 4/29 4/30 5/1 5/2 5/3
B5 Shut down + DeratesB5 Shut down + Derates
B1 Shut down + Derates8 Bruce Units Running
Bruce Unit DeratesBruce Unit Derates
MW
Nuclear Other Baseload Generation Wind Ontario Demand
Bruce Unit Derates
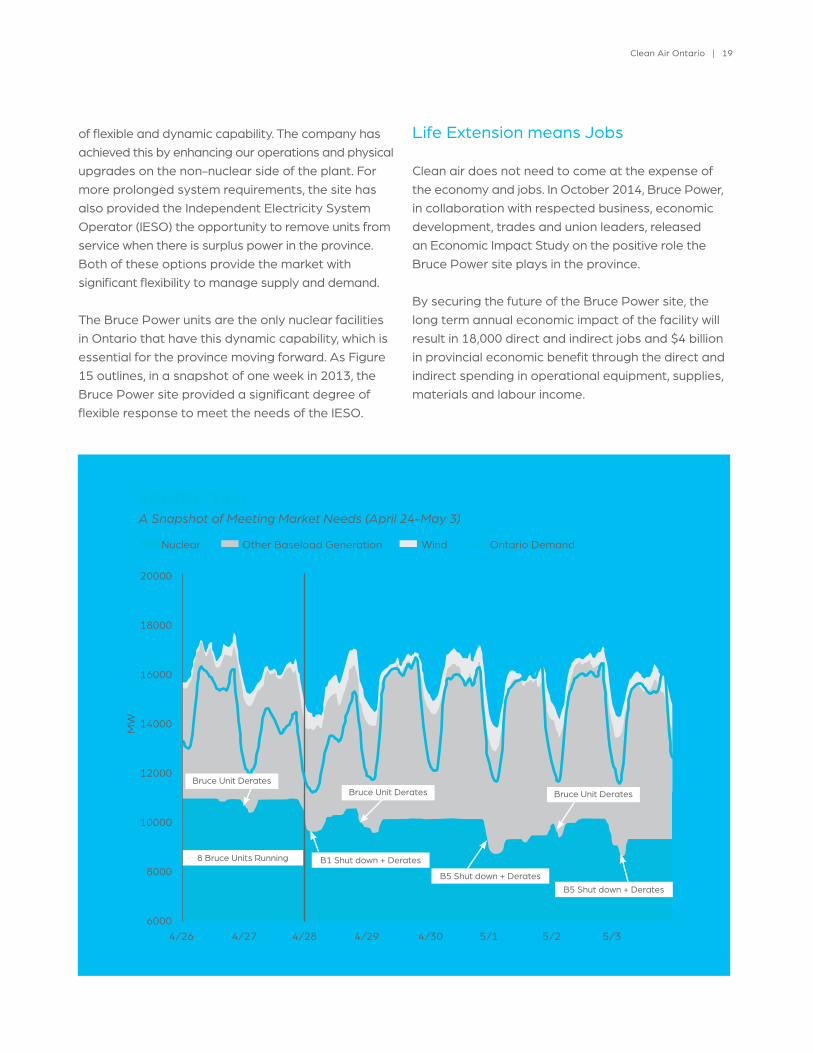
FIGURE 15.0A Snapshot of Meeting Market Needs (April 24-May 3)
of flexible and dynamic capability . The company has achieved this by enhancing our operations and physical upgrades on the non-nuclear side of the plant . For more prolonged system requirements, the site has also provided the Independent Electricity System Operator (IESO) the opportunity to remove units from service when there is surplus power in the province . Both of these options provide the market with significant flexibility to manage supply and demand .
The Bruce Power units are the only nuclear facilities in Ontario that have this dynamic capability, which is essential for the province moving forward . As Figure 15 outlines, in a snapshot of one week in 2013, the Bruce Power site provided a significant degree of flexible response to meet the needs of the IESO .
Life Extension means Jobs
Clean air does not need to come at the expense of the economy and jobs . In October 2014, Bruce Power, in collaboration with respected business, economic development, trades and union leaders, released an Economic Impact Study on the positive role the Bruce Power site plays in the province .
By securing the future of the Bruce Power site, the long term annual economic impact of the facility will result in 18,000 direct and indirect jobs and $4 billion in provincial economic benefit through the direct and indirect spending in operational equipment, supplies, materials and labour income .
Over the next 20 years, as Bruce Power renews its fleet as outlined in Ontario’s LTEP, additional economic benefits of 5,000 direct and indirect jobs annually, and around $1 billion in annual economic benefit through equipment, supplies and materials, is expected . There is no other single, well-established project, facility or infrastructure program in Ontario that will have such a significant economic impact .
Strategic Public Policy Considerations
Over the last 12 years, Ontario’s energy sector has come a long way with the phase out of coal, a modernized infrastructure and a return to a healthy supply situation, even during some of the most extreme summer heat the province has faced . This has created an environment that allows the province to consider how to leverage this strong position related to other public policy considerations .
Long Term Energy Policy
Energy policy which provides commitment to the continued use of low carbon emitting energy options is a key factor to ensuring the air we breathe remains clean . In the spring of 2016, the Ontario Government released its Climate Change Action Plan that committed to the continued reduction of Greenhouse Gas Emissions (GHG), and a transition to a low-carbon economy . The plan gave acknowledgment to the fact the transportation sector is the leading GHG contributor in the province and outlines five main areas where emission reduction will be achieved .
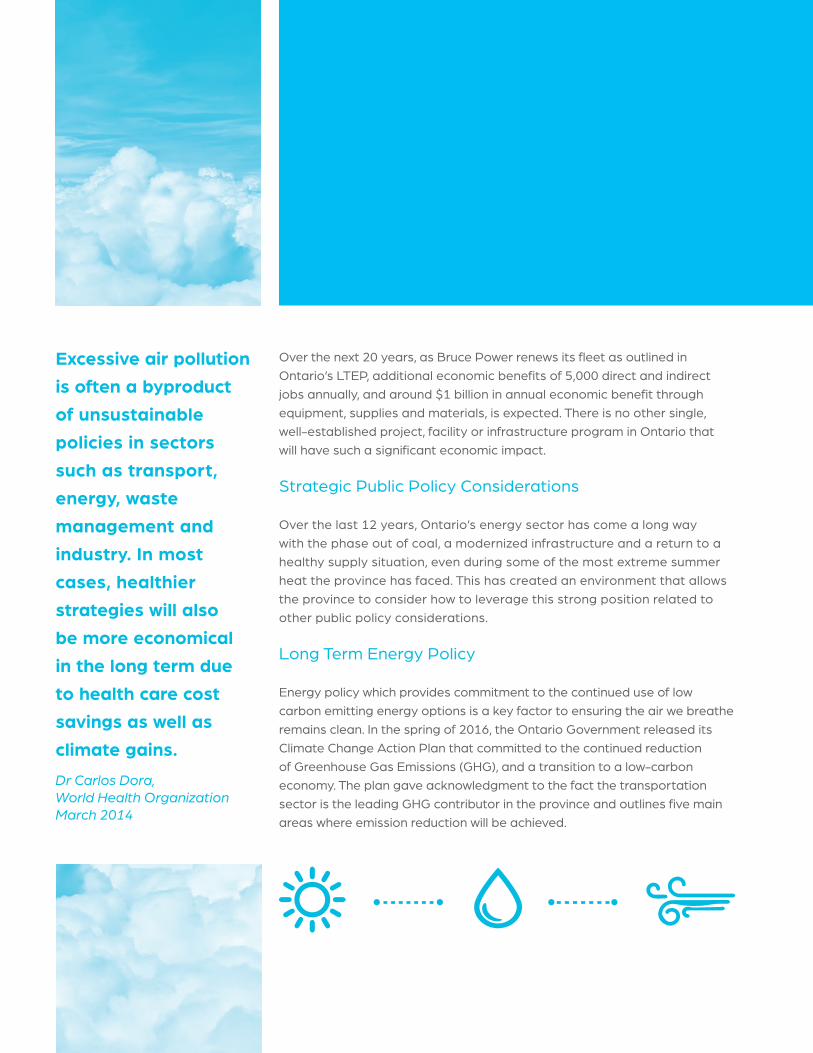
Excessive air pollution is often a byproduct of unsustainable policies in sectors such as transport, energy, waste management and industry. In most cases, healthier strategies will also be more economical in the long term due to health care cost savings as well as climate gains.Dr Carlos Dora, World Health Organization March 2014

Clean Air Ontario | 21
In the fall of 2016, the Ontario Government launched a review of the Long-Term Energy Plan (LTEP), which includes an outlook of the Fuels Sector in Ontario for 2016 through to 2035 .
The inclusion of fuel in this review highlights the important connection that exists between energy supply, fuel use and transportation, and the importance in evaluating multiple factors in tandem . While a clean electricity supply mix in itself is an important element to reduce GHG emissions, it is also a critical component of promoting the adoption of clean transportation . If a supply mix is comprised of a large volume of high-emitting sources of electricity generation, it reduces the emissions benefits of electric vehicles (EV) . When you look specifically at Ontario, the good news is that the province as a whole has a very clean supply mix, setting Ontarians up for success with increasing benefits of EV adoption .
The Province has committed to life extension of the six units at the Bruce Power site which will extend the life of the zero GHG operator for more than 30 years . This policy means that through 2064 the province has set themselves up for success .
In very simple terms if you were to look at the operational GHG emission output annually from the Bruce Power site and compare the equivalent operational emissions supplied by natural gas through 2064 the Bruce Power site will avoid over 873 million tons of CO2 . In a more measurable perspective that is equivalent to 303,649 Rogers Centres worth of emissions .
A nuclear reactor produces zero CO2 tons/MWh operationally where a Natural Gas plant produces 0 .48 CO2 tons/MWh . While all forms of electricity have an important role to play . Ontario aspires to continue to be a low emitting electricity sector .
The next important factor to evaluate from a policy stand point is the Price on Carbon . As a clean supply mix from sources such as nuclear will avoid rate payer costs as carbon is valued from a monetary point of view going forward .

Price on Carbon & Avoided Ratepayer Costs
As provinces looks for ways to incentivise deeper decarbonization of their economies, many including Ontario are adopting a Carbon tax or levy mechanism . Those provinces who do not, may be subject to a Federal imposed mechanism by 2018 . Carbon tax or levy mechanisms put a limit on the amount of GHG business and institutions can emit, and each year lower emission limits . Anything above the limit will be charged per tonne, and as time goes on that charge will also increase . From a rate payer stand point maintaining a low carbon emissions electricity mix, will be key to ensuring costs remain low . As further carbonization of the electricity system will be subject to these costs .
Based on the life extension of the Bruce Power site and the estimated $14-$95 per tonne of CO2, the province will not only gain over 30 additional years of clean, cap and trade free electricity, it will also from now through to 2064 avoid Ontario rate payers $12 to 63 billion, which is equivalent to $2,700 to 14,000 per household over the next 43 plus years . Figure 16 shows the potential cost avoidance from 2017 to 2060 with the life extension of Bruce Powers site over a variety of projected Carbon Pricing scenarios . This analysis looked at the production forecast to ensure conservatism, and assumed the replacement of that electricity generation with fossil fuels .
Emissions-free jurisdictions will establish a competitive advantage as electricity from emitting sources will be charged a premium. This is a long-term strategic opportunity for Ontario that should not be discounted, and is an important public policy issue to push both at the national and international level.
FIGURE 16.0Carbon Pricing Mechanism Scenario (5)
Total Overall Provincial Rate Payer Avoidance (2017-2060) (1) (2)
Total Household Rate Payer Avoidance (2017-2060) (2) (3)
$14/CO2 ton from 2017 to 2060
$12 Billion $2,774
$18/CO2 ton from 2017 to 2060
$15 Billion $3,566
$50/CO2 ton starting in 2022 (3)
$40 .2 Billion to 40 .6 Billion $9,000 to 9,100
$95/CO2 ton starting in 2030 (4)
$62 Billion to 63 Billion $13,000 to $14,000
(1) Based on power production forecasts, and a fossil fuel generation with emissions of 0.48 CO2 tons/MWh
(2) Value is total over 43 years not each individual year(3) Based on average household demand of 800kWh/month(4) Evaluations assume $14/CO2 ton & $18/CO2 ton from 2017 to 2021 then $50/CO2 ton
then proposed federal carbon price of $50/CO2 ton from 2022 to 2060(5) Evaluation assumes $14/CO2 ton & $18/CO2 ton from 2017 to 2029 and projected
provincial cost of $95/CO2 ton 2030 to 2060
Clean Air Ontario | 23
Clean Transportation
Now that Ontario has moved closer to an emissions-free supply mix, the next issue to tackle will be clean transportation .
Transportation represents one of the largest challenges Ontario faces in achieving its emission reduction targets .
Transportation accounts for over 33 per cent of the province’s emissions, and have risen since 1990 . With Ontario’s reduction in GHG, this means the operation of households, businesses and industries have smaller carbon footprints . The auto sector has made great strides in reducing vehicle emissions and by working together, there are opportunities to do much more .
Ontario’s clean electricity system and supported by Ontario’s innovative auto sector, accelerating the shift to electric, plug-in and hydrogen vehicles will be crucial if Ontario wants to achieve its climate change targets .
Outlined in the 2016 Climate Change Action Plan, the province has committed to building more charging stations at government buildings, including LCBO outlets, and will consider making electrical vehicle plug-ins mandatory on all new buildings . The plan sets targets of expanding electric vehicle sales to 5 per cent of all vehicles sold by 2020, up to 12 per cent by 2025, and aiming to get an electric or hybrid vehicle in every multivehicle driveway by 2024, a total of about 1 .7 million cars .
Bruce Power will continue to advance projects and research into electric car applications, as well as possibilities around the development of hydrogen technology .
As is the case with the opportunity to provide support to lower-income energy users, the supply surplus during certain periods of the day may also be a strategic advantage for developing a clean transportation sector . This would is a very strategic area for Ontario to focus on from both a supply mix and long-term economic development point of view; however, it needs focus and high-level sponsorship .
24 | Asthma Society of Canada and Bruce Power
Opportunities with Electric Vehicles
Electric vehicle (EV) technology presents an enormous opportunity to help provinces and territories reduce their greenhouse gas (GHG) emissions from the transportation sector, which is the second largest contributor to GHGs in Canada .
A collaborative report released September 20th, 2016 in Ottawa by Bruce Power, Plug’n Drive, Pollution Probe and the University of Waterloo’s Department of Chemical Engineering, explores ways to build upon existing policy framework at the federal and provincial levels with respect to plug-in EVs .
The report, titled Accelerating the Deployment of Plug-in Electric Vehicles in Canada and Ontario, also highlights opportunities to accelerate and optimize the decarbonization capability of EVs .
Some of the report’s key recommendations include:
• Ensuring provincial governments maintain and, where applicable, improve its lower-carbon energy supply mix of nuclear, hydroelectric, renewables and natural gas to support its enhanced EV adoption .
• The federal government should work with provinces and territories to develop individual clean transportation plans that account for energy supply mix . Those locations with more carbon-intensive supply mixes should be encouraged
to create a strategy that balances emissions reductions realized from EVs and those from the electricity sector .
• The provincial government should develop a plan to address the long-term sustainability of the EV public charging station network being built through Electric Vehicle Chargers Ontario (EVCO) program funding, to ensure initial investment is maintained .
• Future EV infrastructure incentives should be reduced to partially government funded, to encourage partnerships with the private sector .
• Assigning a lead ministry or agency within provincial governments with a mandate to implement Ontario’s vision related to EV deployment .
• The federal government should consider a national study that evaluates the EV experience across Canada and identifies opportunities and barriers to EV deployment .
• Automotive manufacturers, dealerships, governments and non-governmental organizations should work together to explore options for increasing EV inventory at dealerships, and consider committing to a percentage of dealerships that will have cars at any time . Enhanced financial incentives and recognition for salespeople should also be considered .
• The provincial government should ensure fulfillment of its commitment to create an EV Showcase and support for other public awareness strategies as outlined in the 2016 Ontario Climate Change Action Plan .
The federal government should formally commit to and deliver on converting a portion of its operational fleet to EVs to demonstrate their viability to Canadians .
Bruce Power, Plug’n Drive, Pollution Probe and the University of Waterloo’s Department of Chemical Engineering released a collaborative report in September 2016 on EVs.

Clean Air Ontario | 25
REFERENCESAlbertine, J .M, Manning, W .J, DaCosta ,M ., Stinson, K .A, Muilenberg, M .L, Rogers, C .A . (2014) Projected Carbon Dioxide to Increase Grass Pollen and Allergen Exposure Despite Higher Ozone Levels. PLoS One, 9 (11) . Retrieved from http://www .plosone .org/article/info%3Adoi%2F10 .1371%2Fjournal .pone .0111712
Canadian Medical Association (2008, August) . No Breathing Room National Illness Costs of Air Pollution.
Canadian encyclopedia (2006) . Coal, Historic Canada. Retrieved October, 2014 from http://www .thecanadianencyclopedia .ca/en/article/coal/
Canadian Energy Law . http://www .canadianenergylaw .com/ tags/cap-and-trade/
Bernstein, A .S, Rice, M .B . (2013) Lungs in a warming world: climate change and respiratory health. Chest. 143 (5), 1455-9 . Retrieved from doi: 10 .1378/chest .12-2384
Bruce Power (2012) . Revitalizing the Bruce Power site, generating low cost power, supporting coal phase out and growing our economy.
Bruce Power (2014) . Briefing for the 41st Parliament of Ontario: Keeping electricity prices low and supporting economic growth.
Exxon Mobile (2014) . The Outlook for Energy: A view to 2014.
Environmental Commissioner of Ontario (2014, July) . Looking for Leadership the Costs of Climate Inaction, Annual Greenhouse Gas Progress Report 2014.
Hatch Ltd (2014, September) . Life-cycle emissions of nuclear, wind and natural gas power generation.
International Atomic Energy Agency (2006, April) . Nuclear Power and Sustainable Development.
International Atomic Energy Agency (2013) . Climate Change and Nuclear Power.
International Energy Agency (2012) . World Energy Outlook 2012 Executive Summary.
Intergovernmental Panel on Climate Change (2007) . Climate Change 2007: Synthesis Report.
Intergovernmental Panel on Climate Change (2014) . Final Draft WG III Assessment Report 5 – Mitigation of Climate Change.
Ontario Minister of Energy (2013, December) . Achieving Balance Ontario’s Long Term Energy Plan.
Ontario Minister of Energy (1997, November) . Direction for Change Charting a Course for Competitive Electricity and Jobs in Ontario.
Ontario’s Minister of Environment and Climate Change (2014) . Ministry of the Environment and Climate Change Ontario’s Climate Change Update 2014. Retrieved October, 2014 from, http://www .ontario .ca/environment-and-energy/ontarios-climate-change-update-2014
Ontario Clean Air Alliance (2003, February) . How Ontario can improve air quality by phasing out coal-fired electricity generation.
Ontario Medical Association (2005, June) . The illness costs of air pollution 2005-2026 Health and Economic Damages Estimates.
OECD Development Centre (2010, January) . Working Paper No. 285 The Emerging Middle Class in Developing Countries, Global Development Outlook.
Pembina Institute (2013, March) . A Costly Diagnosis Subsidizing coal power with Albertans’Health.
University of Wisconsin- Madison (2002, April) . Life-Cycle Energy Requirements and Greenhouse Gas Emissions for Building-Integrated Photovoltaic. Retrieved October, 2014 from http://www .ecw .org/sites/default/files/210-1 .pdf
United Nations Commission on Sustainable Development (2007, May) . Health Effect of Air Pollution Associated with Energy Use.
United Nations (2013, June) . World population projected to reach 9.6 billion by 2050 . Retrieved October, 2014 from, https://www .un .org/en/development/desa/news/population/un-report-world-population-projected-to-reach-9-6-billion-by-2050 .html
United Nations Economic and Social Affairs (2004) . World Population to 2300.
U .S Energy Information Administration (2014, September) . International Energy Outlook 2014.
World Health Organization (2014, March) . 7 Million Premature deaths annually linked to air pollution news release. Retrieved October, 2014 from http://www .who .int/mediacentre/news/releases/2014/air-pollution/en/
World Health Organization (2014, March) . Ambient (outdoor) air quality health fact sheet number 313. Retrieved October, 2014 from http://www .who .int/mediacentre/factsheets/fs313/en/
Ziska, L ., Knowlton, K ., Rogers, C ., Dalan, D ., Tierney, N ., Elder, M .A ., …Frenz, D . (2011) . Recent warming by latitude associated with increased length of ragweed pollen season in central North America . Proceedings of the National Academy of Sciences of the United States of America, 108 (10), 4248–4251


28 | Asthma Society of Canada and Bruce Power
P .O . Box 1540 Tiverton, Ontario, Canada N0G 2T0 | brucepower .com | 1 866 748 4787 © 2016 Bruce Power L .P . Published work . All rights reserved .
CS140411 R002
A joint study by the Asthma Society of Canada and Bruce Power,
updated October 2016


![Global Companies Join Hands to Empower the Citizens of Ontario with Clean Energy [Company Update]](https://img.pdfslide.us/doc/110x75/577cb4071a28aba7118c448b/global-companies-join-hands-to-empower-the-citizens-of-ontario-with-clean-energy.jpg)