Embed Size (px)
Citation preview
1
PROGRESS REPORT
PROJECT TITLE: Hyper-Thermostable Enzyme (Lactonases) for use as Microbial Biocontrol Agents for
Plant Diseases
PROJECT NUMBER: 4136-17SP
REPORTING PERIOD: May. 1, 2019 – July. 31, 2019
PRINCIPAL INVESTIGATOR: Michael Sadowsky and Mikael Elias
ORGANIZATION: University of Minnesota
PHONE NUMBER: 612-624-2706
EMAIL: [email protected]
Clavibacter michiganensis subsp. nebraskensis (Cmn) Dose Response Assay for Corn Leaves
Maize growth
Maize cv Viking seed (40-30UP) were grown in Euro pots (diameter 8 inch) with a sterilized soil
mixture (50 standard soil/ 50 Germinating Mix) in a plant growth chamber under diurnal
conditions with a 16 hour light at 22 ˚C and 8 hour dark cycle at 18˚C.
Bacteria working solution
Firstly, Clavibacter michiganensis subsp. nebraskensis (causing Goss's bacterial wilt & leaf
blight on Maize) was grown on NBY agar at room temperature ( for ~5 days). Then, a single
colony of Cmn was transferred into the fresh NBY plate. After three days, Cmn was centrifuged
and suspended into 1X PBS to obtain working solution at OD540=0.1 ( about 108 cell/ml).
Infection assays and results
The corn leaves were scraped with sterilized sand paper and inoculated serial diluted cells from
106, 105,104,103,102,10,0 cells on the scraped corn leaf, respectively. The effect of each
concentration of Cmn on disease was evaluated using triplicate samples. After 18 days, Goss’s
Wilt Symptoms were observed at two highest concentrations (106 and105) experiments.
106 105 104 103 102 10 0
Cmn + + - - - - -
2
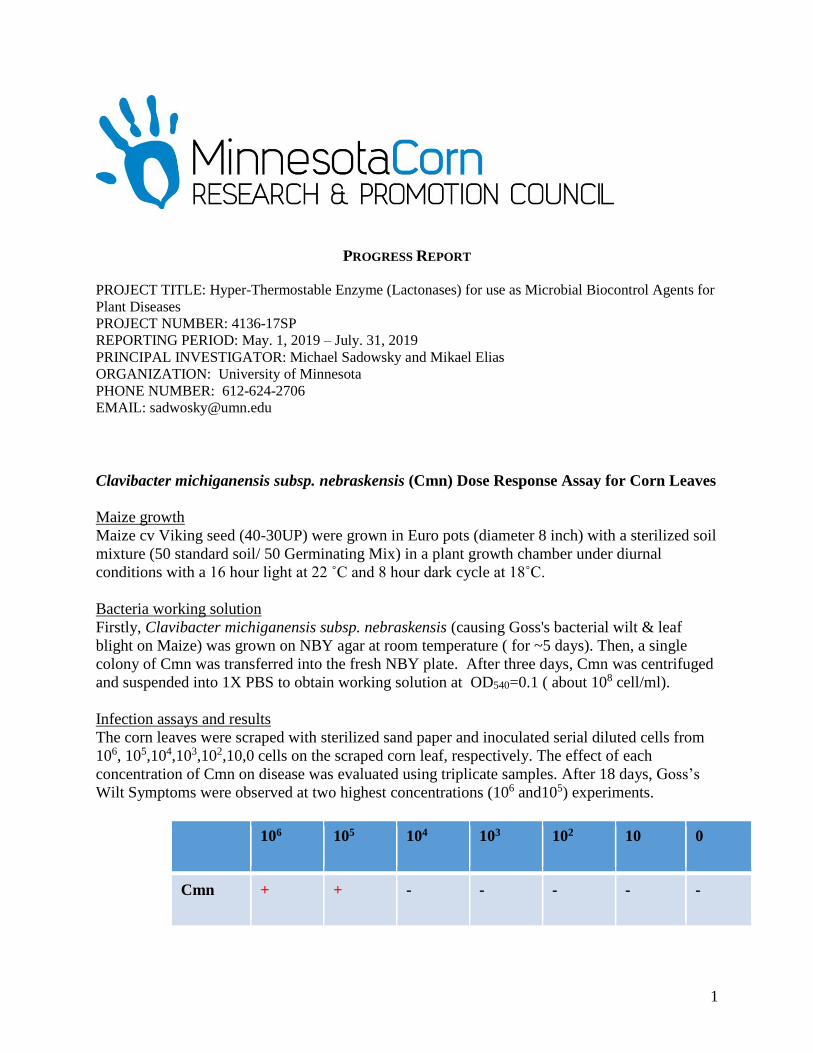
To better quantify the effect on plant disease, we adopted the use of chlorosis assay that non-
destructively measures plant chlorophyll in control and diseased corn leaf tissue.
Chlorophyll
Results showed that dead/chlorotic leaves had 5-fold less chlorophyll than did controls. This
assay will now be used on plants showing disease symptoms between these two extremes.
We have now obtained a culture of Xanthomonas axonopodis pv. glycines causing bacterial
pustule disease on soybean and we will test our enzymes against this pathogen. We also now
have permission from APHIS to test Erwinia stewartii (Syn. Pantoea stewartii) causing Stewart's
wilt (Stewart's disease, Stewart's bacterial wilt), Erwinia chrysanthemi pv zeae, and Dickeya zeae
(bacterial stalk rot of maize) and we are trying to obtain these strain now to test on corn.
To better assess the relationship between pathogen effects and quorum quenching lactonases we
developed a system to measure this in a quantitative fashion. Here disease scale has 13 levels,
representing 0-100% tissue necrosis/leaf.
The test plant was maize and this is seen below.
Quantification of Disease Levels
Scale designation Level
1
Level
2
Level
3
Level
4
Level
5
Level
6
Level
7
Level
8
Level
9
Level
10
Level
11
Level
12
Level
13
Percent of
leaf with
necrosis
0 2 5 10 20 30 40 50 60 70 80 90 100
Chlorophyll content in 6 replicates of corn with 106 cells Cmm Mean
Day 0 37.7 44.8 46.9 49.4 47.6 45.5 45.3
Day 18 2.4 9.0 7.8 8.8 13.1 10.9 8.6
Day 0 Day 18
3
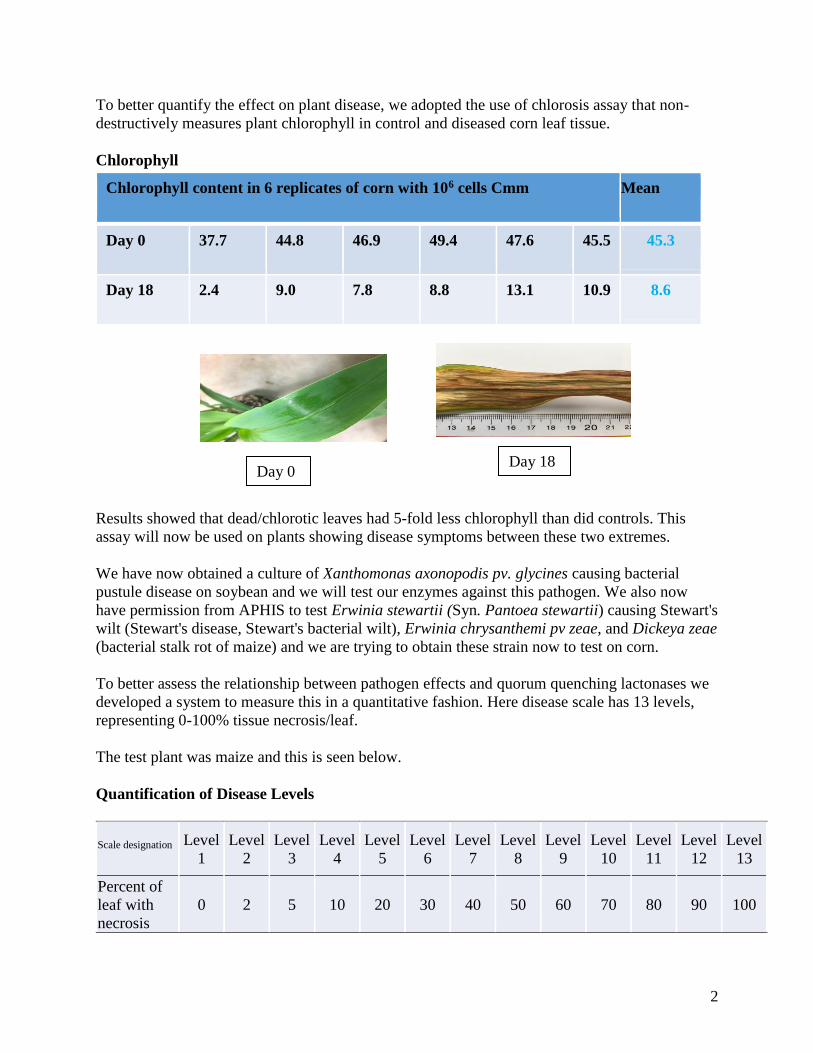
The assay appears to be useful for other pathogens as well. Below is the Corn Leaf Assay done
using Clavibacter michiganensis subsp. nebraskensis (Cmn)
Treatment
Disease levels
Rep. A Rep. B Rep. C
Negative control 1 1 1
Buffer needle 1 1 1
SsoPox only 1 1 1
Cmn only 9 9 9
Cmn+SsoPox 3 3 3
Bacterial strains and quorum quenching lactonases.
Eleven pathogenic strains that we are using in this study include Clavibacter michiganensis
subsp. nebraskensis, Erwinia chrysanthemi pv. Zeae, Pantoea stewartii Mergaert, Erwinia
aroideae 8066, Erwinia atroseptica 8064, Xanthomonas campestris pv. campestris,
Pseudomonas syringae pv syringae, Pseudomonas syringae pv phaseolicola, Erwinia
carotovora, Xanthomonas campestris pv. phaseoli, and Pectobacterium carotovorum. The strains
were grown in selected medium at 25-30˚C. There will be two kinds of the quorum quenching
lactonases (SsoPox W2631, and GcL WT) used in this study. The characterizations of these
lactonases were studied by Dr. Elias groups 1, 2.
We previously reported successful protection of several plant species from bacterial diseases by
using lactonase enzyme SsoPox. Here we described our initial assays on corn using Clavibacter
michiganensis subsp. nebraskensis (Cmn). The goal was to determine if the presence of lactonase
4
on the corn leaf surface (the phyllosphere) alters bacterial community structure, in addition to
preventing disease.
Variation of maize phyllosphere microbiome due to interaction of Cmn and SsoPox
Next-Generation Sequencing The V4 hypervariable region of 16S rRNA was amplified for bacteria and archaea by using
primer set 515F (5’– GTG CCA GCM GCC GCG GTA A –3’) and 806R (5’– GGA CTA CHV
GGG TWT CTA AT –3’). Sequencing was done by the University of Minnesota Genomics
Center (Minneapolis, MN, USA) as previously described3. Briefly, samples were first amplified
by using the following cycling conditions: 95˚C for 5 min, followed by 25 cycles of 98˚C for 20
s, 55˚C for 15 s, and 72˚C for 1 min. Adapters and barcodes were added by using an additional
10 cycles PCR. Amplicons were gel purified, pooled, and paired-end sequenced at a read length
of 300 nt on the Illumina MiSeq platform (Illumnia, Inc., San Diego, CA, USA).
Bioinformatics
Highly quality sequence data for analyses were obtrained by submitting the raw sequencing data
through the SHI7 pipeline for quantity control (QC) 4, 5. In brief, sequencing adaptors were
removed, the two paired-end reads were merged, and residual adaptors were further trimmed.
Low quality reads were removed to keep QC values > 31 and highly quality reads were
converted into the FASTA format and aligned on the basis of the Greengenes ver. 13.86.
UCHIME software was used to identify and remove the probable Chimeric sequence7. All
sequence data was rarefied to 63,000 sequence reads per sample before sustainable statistical
analysis. Raw sequencing data will eventually be deposited in the Sequence Read Archive (SRA)
of NCBI (https://www.ncbi.nlm.nih.gov/sra).
Statistical analysis
For statistical analysis, Alpha diversity (average species diversity) indices, as well as Good’s
coverage, were calculated using the Shannon index and abundance-based coverage estimate
through mother program. Visualization of the taxonomic distribution of microbial communities
was performed by using the “ggplot2” package in R (Al-Masaudi et al., 2017). Differences in
beta diversity among samples was evaluated by using analysis of similarity (ANOSIM), which
employs Bray-Curtis dissimilarity matrices (BC)8, 9. Principal coordinates analysis (PCoA) was
used to analyze the differences in microbial community structure between various DNA
extraction methods. Linear discriminant analysis (LDA) of effect size (LEfSe) was used to
identify OTUs that differed significantly influencing of SsoPox on phyllosphere. Moreover,
indicator OTUs association with influencing of SsoPox on phyllosphere was determined based
on multipatt function using the indcespecies package in R. The association was further
considered significant using a false discovery rate.
Attended conference
Summarized the results of project and prepared the poster. Presented the poster in MN AG
EXPO on January 24,2019. The results attracted a lot of attention. Lots of farmers were
5
interested when the technology could be used in the field. We will continue to improve our
technology and conduct the addition experiments in the field.
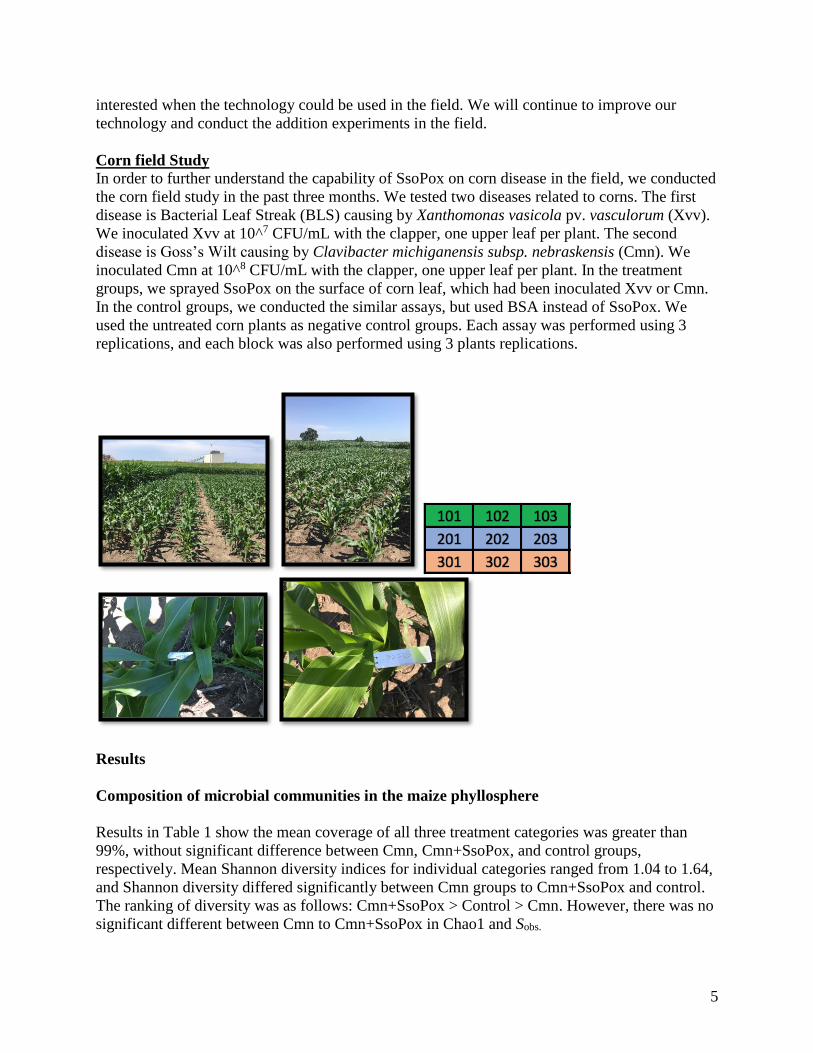
Corn field Study
In order to further understand the capability of SsoPox on corn disease in the field, we conducted
the corn field study in the past three months. We tested two diseases related to corns. The first
disease is Bacterial Leaf Streak (BLS) causing by Xanthomonas vasicola pv. vasculorum (Xvv).
We inoculated Xvv at 10^7 CFU/mL with the clapper, one upper leaf per plant. The second
disease is Goss’s Wilt causing by Clavibacter michiganensis subsp. nebraskensis (Cmn). We
inoculated Cmn at 10^8 CFU/mL with the clapper, one upper leaf per plant. In the treatment
groups, we sprayed SsoPox on the surface of corn leaf, which had been inoculated Xvv or Cmn.
In the control groups, we conducted the similar assays, but used BSA instead of SsoPox. We
used the untreated corn plants as negative control groups. Each assay was performed using 3
replications, and each block was also performed using 3 plants replications.
Results
Composition of microbial communities in the maize phyllosphere
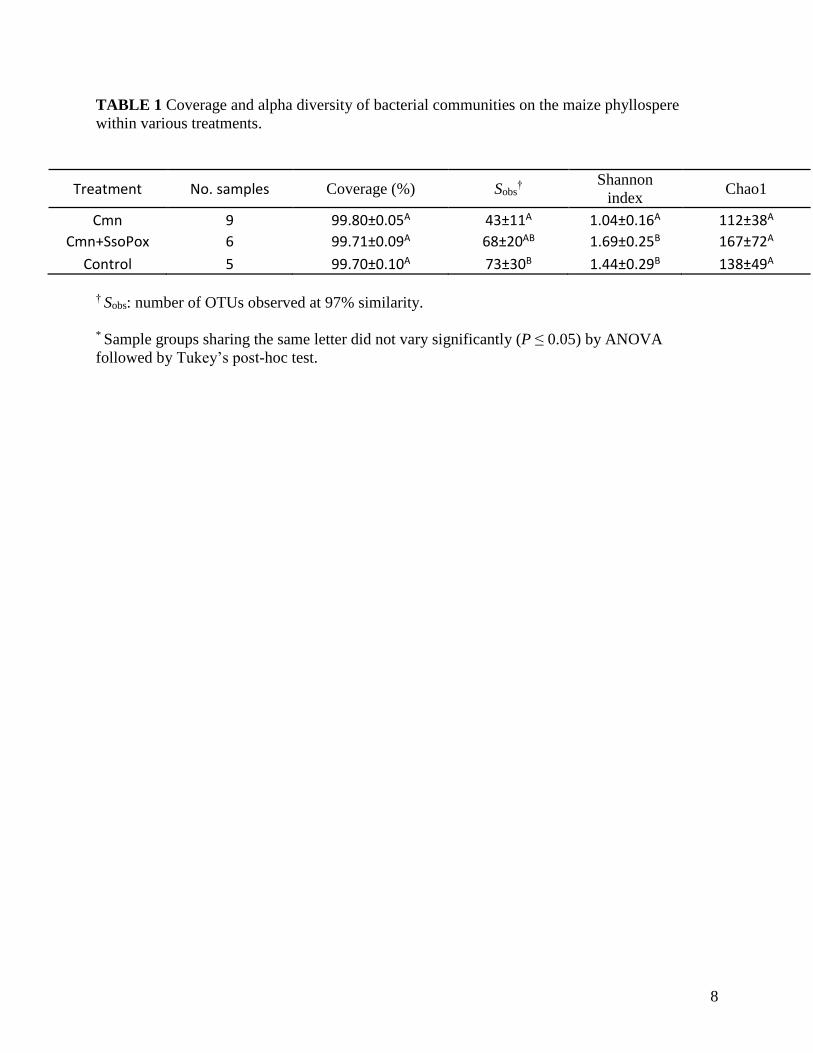
Results in Table 1 show the mean coverage of all three treatment categories was greater than
99%, without significant difference between Cmn, Cmn+SsoPox, and control groups,
respectively. Mean Shannon diversity indices for individual categories ranged from 1.04 to 1.64,
and Shannon diversity differed significantly between Cmn groups to Cmn+SsoPox and control.
The ranking of diversity was as follows: Cmn+SsoPox > Control > Cmn. However, there was no
significant different between Cmn to Cmn+SsoPox in Chao1 and Sobs.
6
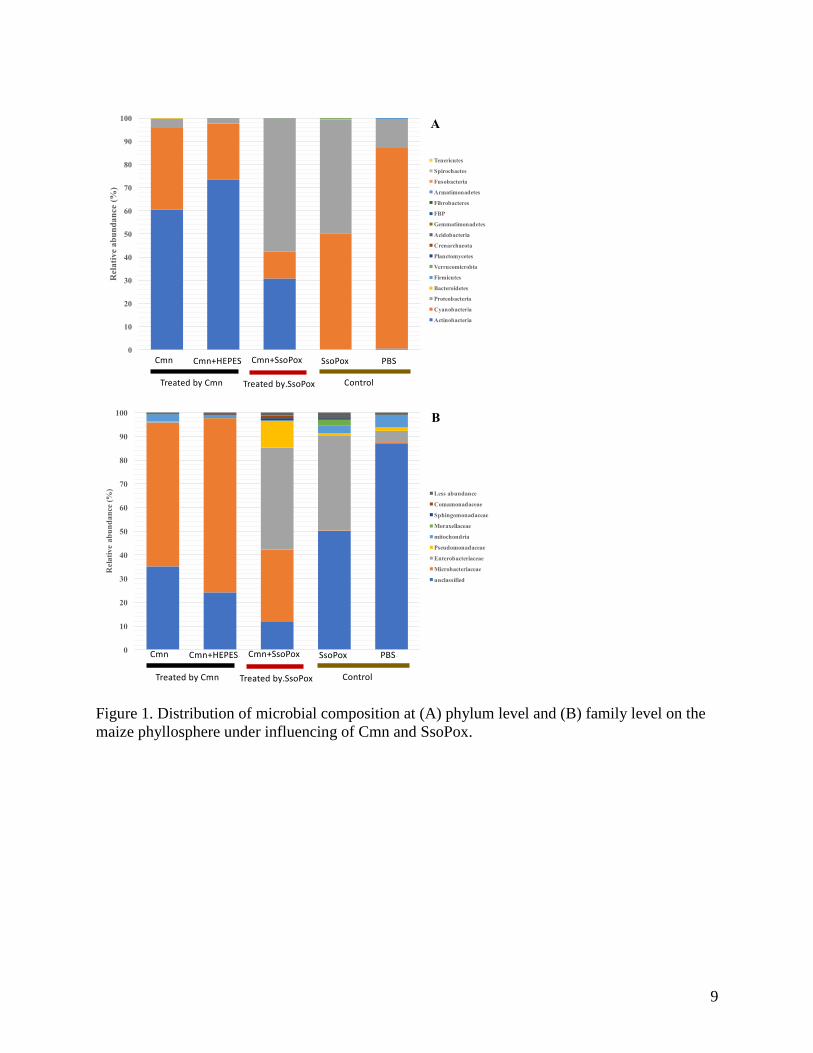
Bacterial community analyses found that the Cmn group was primarily composed of members of
the phyla Actinobacteria (>60%), Cyanobacteria (>20%), and Proteobacteria (>5%). The
composition in Cmn+SsoPox groups ranked from Proteobacteria (mean 57.4%) > Actinobacteria
(mean 30.8%) > Cyanobacteria (11.7%). This compared with the dominant Cyanobacteria
(>50%) and Proteobacteria in the control groups (Figure 1A). Microbacteriaceae, which is the
family level for Clavibacter michiganensis subsp. nebraskensis, was found as the major
composition (mean 64.8%) in the Cmn group, but decreased significantly to 30.6% in the
Cmn+SsoPox group (Kruskal-Wallis test, P<0.001), and rarely presented (ca. 0.2%) in control
groups (Figure 1B).
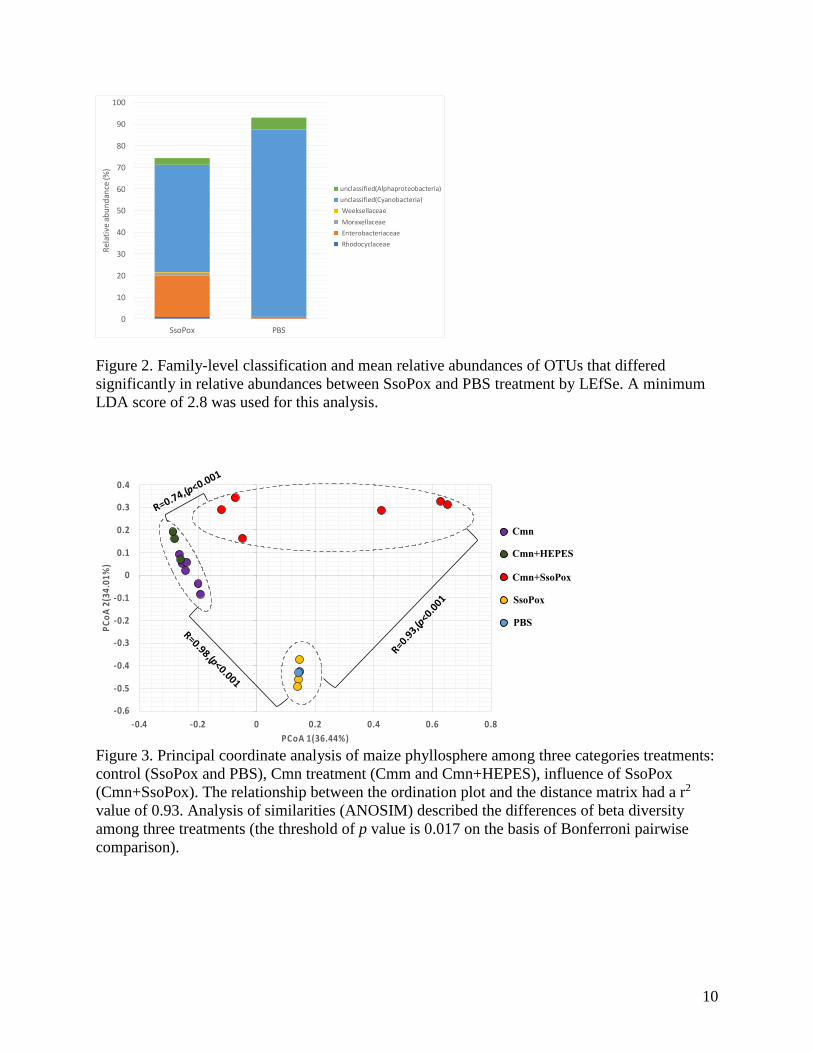
Notably, in control group, PBS treatment communities were characterized by greater relative
abundance of taxa within unclassified family levels under Cyanobacteria and
Alphaproteobacteria (Figure 2). In contrast, SsoPox treatment communities had greater relative
abundance of Weeksellaceae, Moraxellaceae, Enterobacteriaceae, and Rhodocyclaceae.
Moreover, microbial indicator analysis showed that Acetobacteraceae (delta R=0.931, p=0.022)
could be used to as an indicator for PBS treatment, although its relative abundance was very low
(0.005%). Contrasting, Corynebacteriaceae, Methylocytaceae, and Clostridiaceae could be used
to indicator SsoPox treatment, and their delta R is 0.816, 0.816, and 0.784, respectively.
Interestingly, these three taxa also had very low relative abundance (<0.01%).
Shifts in bacterial community composition following treatments.
Ordination analyses via PCoA (Figure 2) showed the separation of samples by three categories,
and these clusters were significantly different by ANOSIM (P<0.001) and AMOVA (P<0.001).
Inoculation with Cmn significantly shifted the bacterial community (beta diversity) from control
groups to the treatment groups. For example, significant differences were observed in control v.s.
Cmn (R=0.98, P<0.001) and control vs. Cmn+SsoPox (R=0.93, P<0.001), respectively. Among
samples treated with Cmn, difference in beta diversity, evaluated by ANOSIM and AMOVA
were also significantly different between Cmn and Cmn+SsoPox (R=0.74, P<0.001). Notably, in
the control group, PBS and SsoPox were not significantly different (P>0.05). Similarly, Cmn and
Cmn+HEPES communities did not significantly differ (P>0.05) from each other.
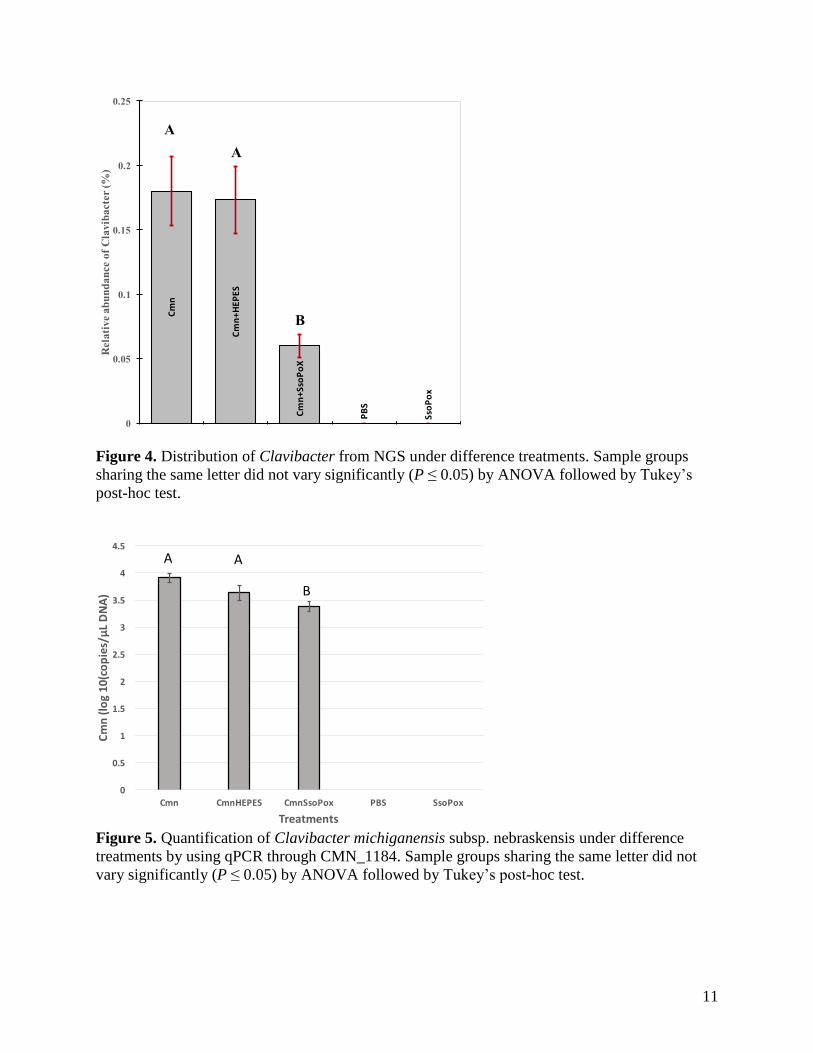
Reduction of Clavibacter and Clavibacter michiganensis subsp. nebraskensis
Analysis of Clavibacter from abundance data at the genus level revealed that Clavibacter had a
mean value less than 0.3 % in all of treatments, which was ranking as follows: Cmn
(0.18%±0.02%) > Cmn+HEPES (0.17 %±0.02%) > Cmn+SsoPox (0.06%±0.02%) > SsoPox =
PBS (0%), respectively (Figure 4). In the Cmn Groups, the relative abundance of Clavibacter
was not significantly different between Cmn and Cmn+HEPES treatments (ANOVA, P>0.05).
However, with treatment with the lactonase SsoPox, Clavibacter was significantly reduced in the
Cmn+SsoPox groups (ANOVA, P<0.05). Notably, the similar trend was also quantified by
qPCR through CMN_1184 gene (Figure 5). The quantification of Clavibacter michiganensis
subsp. nebraskensis followed from 3.91, 3.63, and 3.38 1og10 (copies/µL DNA) for Cmn,
Cmn+HEPES, and Cmn+SsoPox, respectively. The highest concentration of Clavibacter
michiganensis subsp. nebraskensis was observed in the Cmn Groups, while Cmn treatment did
7
not signify with Cmn+HEPES treatment ((ANOVA, P>0.05). However, significantly reduced
quantification of Clavibacter michiganensis subsp. nebraskensis was observed in Cmn+SsoPox
groups (ANOVA, P<0.05).
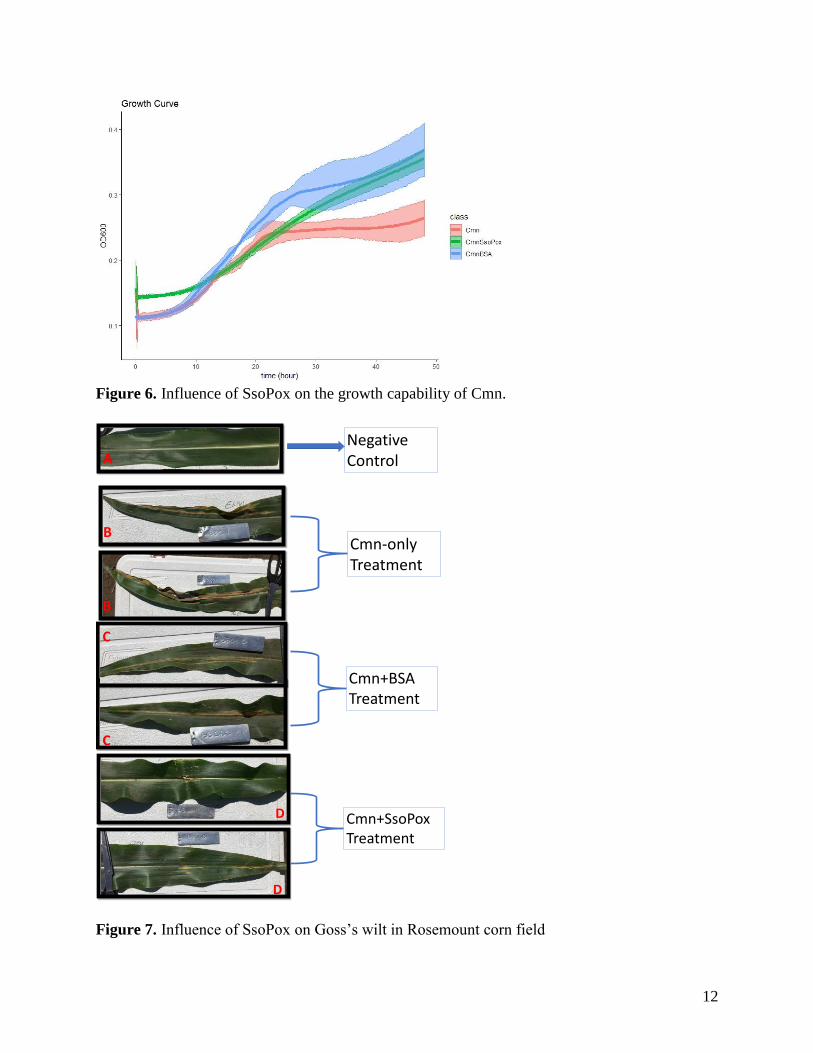
Influence of SsoPox on the growth capability of Cmn
From the Figure 6, it clearly elucidated that SsoPox did not stress the grow capability of Cmn in
the NBY broth. In comparison to only growing in NBY broth (Cmn treatment), the Cmn+SsoPox
treatment group and the Cmn+BSA treatment group were grew much fast, particularly due to
SsoPox and BSA as protein providing the additional nutrient in the cultural broth. The results
indicated that the SsoPox was indirectly regulating the disease of Gross’s wilt on the corn leaf.
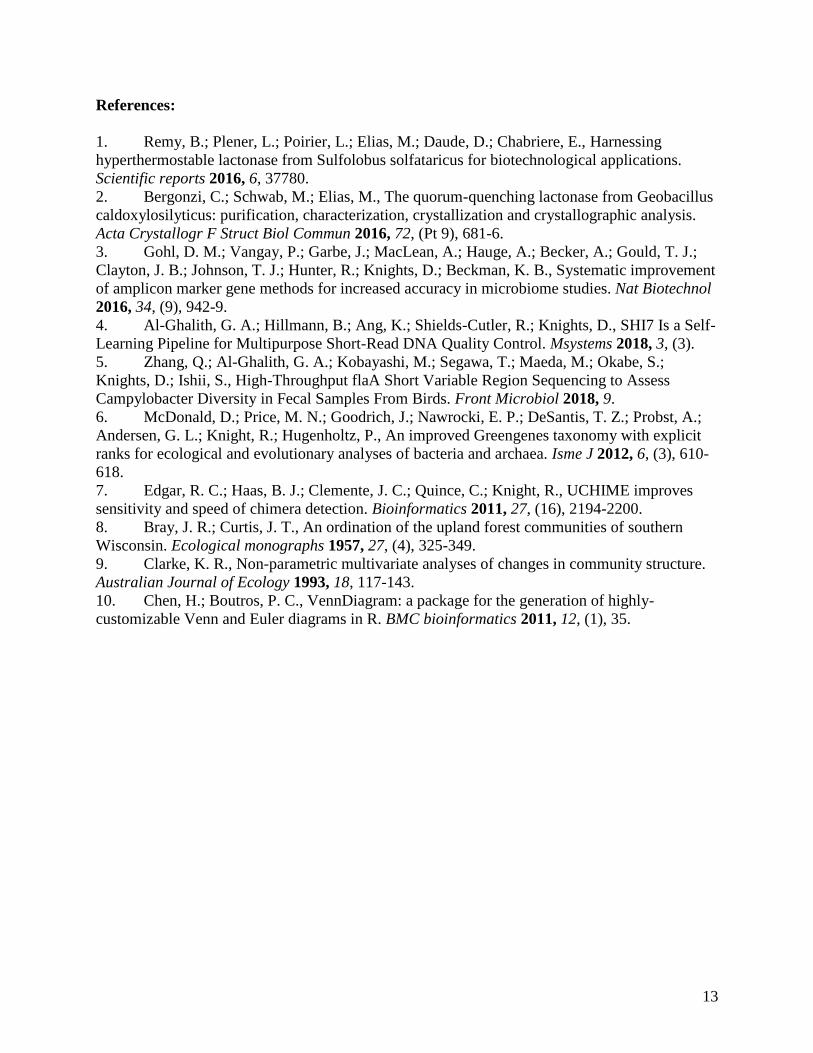
Influence of SsoPox on corn disease at the Rosemount filed station
Bacterial leaf streak (BLS) symptom developed to only low severity levels at the Rosemount
study field. We will continue to examine BLS symptom next season. Therefore, we focused on
Goss’s Wilt caused by Cmn. From our study (Figure 7), SsoPox successfully suppressed the
Cmn (Figure 7D) compared with the Cmn-only treatment (Figure 7B) and Cmn+BSA treatment
(Figure7A). These exciting results were consistent and repeated in three different corn blocks at
the Rosemount field site. Based on these results, we are planning to test whether Goss’s Wilt can
be suppressed by SsoPox on different varieties of corn in the next season and at different
locations. Moreover, we will also test other corn disease, for example, diseases caused by
Xanthomonas vasicola pv. vasculorum (Xvv) (bacteria) and Exserohilum turcicum (Et) (fungus).
Outreach, writing a manuscript and preparing the conference
The manuscript related to our initial corn studies is under preparation now. We plan to submit it
for publication in the next month or so.
Qian Zhang will also make an oral presentation at the ASA/CSSA/SSA conference in San
Antonio, TX next month (Nov. 10-13, 2019).
8
TABLE 1 Coverage and alpha diversity of bacterial communities on the maize phyllospere
within various treatments.
Treatment No. samples Coverage (%) Sobs†
Shannon
index Chao1
Cmn 9 99.80±0.05A 43±11A 1.04±0.16A 112±38A
Cmn+SsoPox 6 99.71±0.09A 68±20AB 1.69±0.25B 167±72A
Control 5 99.70±0.10A 73±30B 1.44±0.29B 138±49A
† Sobs: number of OTUs observed at 97% similarity.
* Sample groups sharing the same letter did not vary significantly (P ≤ 0.05) by ANOVA
followed by Tukey’s post-hoc test.
9
Figure 1. Distribution of microbial composition at (A) phylum level and (B) family level on the
maize phyllosphere under influencing of Cmn and SsoPox.
0
10
20
30
40
50
60
70
80
90
100
Cmn Cmn+HEPS Cmn+SsoPox SsoPox PBS
Rel
ati
ve
ab
un
da
nce
(%
)
Tenericutes
Spirochaetes
Fusobacteria
Armatimonadetes
Fibrobacteres
FBP
Gemmatimonadetes
Acidobacteria
Crenarchaeota
Planctomycetes
Verrucomicrobia
Firmicutes
Bacteroidetes
Proteobacteria
Cyanobacteria
Actinobacteria
A
Treated by Cmn ControlTreated by.SsoPox
Cmn Cmn+HEPES SsoPoxCmn+SsoPox PBS
0
10
20
30
40
50
60
70
80
90
100
Cmn Cmn+HEPS Cmn+SsoPox SsoPox PBS
Rel
ati
ve
ab
un
dan
ce (
%)
Less abundance
Comamonadaceae
Sphingomonadaceae
Moraxellaceae
mitochondria
Pseudomonadaceae
Enterobacteriaceae
Microbacteriaceae
unclassified
B
Treated by Cmn ControlTreated by.SsoPox
Cmn Cmn+HEPES SsoPoxCmn+SsoPox PBS
10
Figure 2. Family-level classification and mean relative abundances of OTUs that differed
significantly in relative abundances between SsoPox and PBS treatment by LEfSe. A minimum
LDA score of 2.8 was used for this analysis.
Figure 3. Principal coordinate analysis of maize phyllosphere among three categories treatments:
control (SsoPox and PBS), Cmn treatment (Cmm and Cmn+HEPES), influence of SsoPox
(Cmn+SsoPox). The relationship between the ordination plot and the distance matrix had a r2
value of 0.93. Analysis of similarities (ANOSIM) described the differences of beta diversity
among three treatments (the threshold of p value is 0.017 on the basis of Bonferroni pairwise
comparison).
0
10
20
30
40
50
60
70
80
90
100
SsoPox PBS
Rel
ativ
e a
bu
nd
ance
(%)
unclassified(Alphaproteobacteria)
unclassified(Cyanobacteria)
Weeksellaceae
Moraxellaceae
Enterobacteriaceae
Rhodocyclaceae
-0.6
-0.5
-0.4
-0.3
-0.2
-0.1
0
0.1
0.2
0.3
0.4
-0.4 -0.2 0 0.2 0.4 0.6 0.8
PC
oA
2(3
4.0
1%
)
PCoA 1(36.44%)
Cm n
Cm nHEPS
Cm nSSO
SsoPox
PBS
R=0.93,(p
<0.001
R=0.98,(p<0.001
R=0.74,(p<0.001
-0.6
-0.5
-0.4
-0.3
-0.2
-0.1
0
0.1
0.2
0.3
0.4
-0.4 -0.2 0 0.2 0.4 0.6 0.8
PC
oA
2(3
4.0
1%
)
PCoA 1(36.44%)
Cm n
Cm nHEPS
Cm nSSO
SsoPox
PBS
Cmn
Cmn+HEPES
Cmn+SsoPox
SsoPox
PBS
11
Figure 4. Distribution of Clavibacter from NGS under difference treatments. Sample groups
sharing the same letter did not vary significantly (P ≤ 0.05) by ANOVA followed by Tukey’s
post-hoc test.
Figure 5. Quantification of Clavibacter michiganensis subsp. nebraskensis under difference
treatments by using qPCR through CMN_1184. Sample groups sharing the same letter did not
vary significantly (P ≤ 0.05) by ANOVA followed by Tukey’s post-hoc test.
Cm
n
Cm
n+H
EPE
S
Cm
n+S
soP
oX
PB
S
Sso
Po
x0
0.05
0.1
0.15
0.2
0.25R
ela
tiv
e a
bu
nd
an
ce o
f C
lavib
acte
r (
%)
A
B
A
12
Figure 6. Influence of SsoPox on the growth capability of Cmn.
Figure 7. Influence of SsoPox on Goss’s wilt in Rosemount corn field
Negative Control
Cmn-only Treatment
A
B
B
Cmn+BSATreatment
C
C
Cmn+SsoPoxTreatment
D
D
13
References:
1. Remy, B.; Plener, L.; Poirier, L.; Elias, M.; Daude, D.; Chabriere, E., Harnessing
hyperthermostable lactonase from Sulfolobus solfataricus for biotechnological applications.
Scientific reports 2016, 6, 37780.
2. Bergonzi, C.; Schwab, M.; Elias, M., The quorum-quenching lactonase from Geobacillus
caldoxylosilyticus: purification, characterization, crystallization and crystallographic analysis.
Acta Crystallogr F Struct Biol Commun 2016, 72, (Pt 9), 681-6.
3. Gohl, D. M.; Vangay, P.; Garbe, J.; MacLean, A.; Hauge, A.; Becker, A.; Gould, T. J.;
Clayton, J. B.; Johnson, T. J.; Hunter, R.; Knights, D.; Beckman, K. B., Systematic improvement
of amplicon marker gene methods for increased accuracy in microbiome studies. Nat Biotechnol
2016, 34, (9), 942-9.
4. Al-Ghalith, G. A.; Hillmann, B.; Ang, K.; Shields-Cutler, R.; Knights, D., SHI7 Is a Self-
Learning Pipeline for Multipurpose Short-Read DNA Quality Control. Msystems 2018, 3, (3).
5. Zhang, Q.; Al-Ghalith, G. A.; Kobayashi, M.; Segawa, T.; Maeda, M.; Okabe, S.;
Knights, D.; Ishii, S., High-Throughput flaA Short Variable Region Sequencing to Assess
Campylobacter Diversity in Fecal Samples From Birds. Front Microbiol 2018, 9.
6. McDonald, D.; Price, M. N.; Goodrich, J.; Nawrocki, E. P.; DeSantis, T. Z.; Probst, A.;
Andersen, G. L.; Knight, R.; Hugenholtz, P., An improved Greengenes taxonomy with explicit
ranks for ecological and evolutionary analyses of bacteria and archaea. Isme J 2012, 6, (3), 610-
618.
7. Edgar, R. C.; Haas, B. J.; Clemente, J. C.; Quince, C.; Knight, R., UCHIME improves
sensitivity and speed of chimera detection. Bioinformatics 2011, 27, (16), 2194-2200.
8. Bray, J. R.; Curtis, J. T., An ordination of the upland forest communities of southern
Wisconsin. Ecological monographs 1957, 27, (4), 325-349.
9. Clarke, K. R., Non-parametric multivariate analyses of changes in community structure.
Australian Journal of Ecology 1993, 18, 117-143.
10. Chen, H.; Boutros, P. C., VennDiagram: a package for the generation of highly-
customizable Venn and Euler diagrams in R. BMC bioinformatics 2011, 12, (1), 35.