Embed Size (px)
Citation preview

Classification of birefringence inmode-locked fiber lasers using machine
learning and sparse representation
Xing Fu, Steven L. Brunton and J. Nathan Kutz∗Department of Applied Mathematics, University of Washington, Seattle, WA 98195-2420 USA
Abstract: It has been observed that changes in the birefringence, whichare difficult or impossible to directly measure, can significantly affectmode-locking in a fiber laser. In this work we develop techniques toestimate the effective birefringence by comparing a test measurement of agiven objective function against a learned library. In particular, a toroidalsearch algorithm is applied to the laser cavity for various birefringencevalues by varying the waveplate and polarizer angles at incommensurateangular frequencies, thus producing a time-series of the objective function.The resulting time series, which is converted to a spectrogram and thendimensionally reduced with a singular value decomposition, is then labelledwith the corresponding effective birefringence and concatenated into alibrary of modes. A sparse search algorithm (L1-norm optimization) is thenapplied to a test measurement in order to classify the birefringence of thefiber laser. Simulations show that the sparse search algorithm performsvery well in recognizing cavity birefringence even in the presence of noiseand/or noisy measurements. Once classified, the wave plates and polar-izers can be adjusted using servo-control motors to the optimal positionsobtained from the toroidal search. The result is an efficient, self-tuning laser.
© 2014 Optical Society of America
OCIS codes: (140.4050) Mode-locked lasers; (140.3510) Fiber lasers; (320.7090) Ultrafastlasers.
References and links1. D. J. Richardson, J. Nilsson, and W. A. Clarkson, “High power fiber lasers: current status and future perspectives,”
J. Opt. Soc. Am. B 27, B63–B92 (2010).2. C. D. Poole and R. E. Wagner, “Phenomenological approach to polarization dispersion in long single-mode
fibers,” Electron. Lett. 22, 1029–1030 (1986).3. C. R. Menyuk, “Pulse propagation in an elliptically birefringent Kerr media,” IEEE J. Quant. Electron. 25, 2674–
2682 (1989).4. C. R. Menyuk, “Nonlinear pulse propagation in birefringent optical fibers,” IEEE J. Quant. Electron. 23, 174–176
(1987).5. P. K. A. Wai and C. Menyuk, “Polarization mode dispersion, decorrelation, and diffusion in optical fibers with
randomly varying birefringence,” J. Light. Tech. 14, 148–157 (1996).6. J. P. Gordon and H. Kogelnik, “PMD fundamentals: polarization mode dispersion in optical fibers,” PNAS 97,
4541–4550 (2000).7. J. N. Kutz, “Mode-locked soliton lasers,” SIAM Review 48, 629–678 (2006).8. H. A. Haus, “Mode-locking of lasers,” IEEE J. Sel. Top. Quant. Elec. 6, 1173–1185 (2000).9. K. Tamura, E.P. Ippen, H.A. Haus, and L.E. Nelson, “77-fs Pulse generation from a stretched-pulse mode-locked
all-fiber ring laser,” Opt. Lett. 18, 1080–1082 (1993).
#203188 - $15.00 USD Received 18 Dec 2013; revised 20 Mar 2014; accepted 21 Mar 2014; published 3 Apr 2014(C) 2014 OSA 7 April 2014 | Vol. 22, No. 7 | DOI:10.1364/OE.22.008585 | OPTICS EXPRESS 8585

10. K. Tamura and M. Nakazawa, “Optimizing power extraction in stretched pulse fiber ring lasers,” App. Phys. Lett.67, 3691–3693 (1995).
11. G. Lenz, K. Tamura, H. A. Haus, and E. P. Ippen, “All-solid-state femtosecond source at 1.55 µm,” Opt. Lett. 20,1289–1291 (1995).
12. A. Chong, W. H. Renninger, and F. W. Wise, “Properties of normal-dispersion femtosecond fiber lasers,” J. Opt.Soc. Am. B 25, 140–148 (2008).
13. A. Chong, J. Buckley, W. Renninger, and F. Wise, “All-normal-dispersion femtosecond fiber laser,” Opt. Express14, 10095 (2006).
14. W. Renninger, A. Chong, and F. W. Wise, “Dissipative solitons in normal-dispersion fiber lasers,” Phys. Rev. A77, 023814 (2008).
15. F. O. Ilday, J. Buckley, and F. W. Wise, “Self-similar evolution of parabolic pulses in a laser cavity,” Phys. Rev.Lett. 92, 213902 (2004).
16. W. H. Renninger, A. Chong, and F. W. Wise, “Self-similar pulse evolution in an all-normal-dispersion laser,”Phys. Rev. A 82, 021805 (2010).
17. B. Bale and S. Wabnitz, “Strong spectral filtering for a mode-locked similariton fiber laser,” Opt. Lett. 35, 2466–2468 (2010).
18. F. Li, P. K. A. Wai, and J. N. Kutz, “Geometrical description of the onset of multi-pulsing in mode-locked lasercavities,” J. Opt. Soc. Am. B 27, 2068–2077 (2010).
19. F. Li, E. Ding, J. N. Kutz, and P. K. A. Wai, “Dual transmission filters for enhanced energy in mode-locked fiberlasers,” Opt. Express 19, 23408–23419 (2011).
20. X. Fu and J. N. Kutz, “High-energy mode-locked fiber lasers using multiple transmission filters and a geneticalgorithm,” Opt. Express 21, 6526–6537 (2013).
21. S. L. Brunton, X. Fu, and J. N. Kutz, “Extremum-seeking control of a mode-locked laser,” IEEE J. Quant.Electron. 49, 852–861 (2013).
22. X. Shen, W. Li, M. Yan, and H. Zeng, “Electronic control of nonlinear-polarization-rotation mode locking inYb-doped fiber lasers,” Opt. Lett. 37, 3426–3428 (2012).
23. D. Radnatarov, S. Khripunov, S. Kobtsev, A. Ivanenko, and S. Kukarin, “Automatic electronic-controlled modelocking self-start in fibre lasers with non-linear polarisation evolution,” Opt. Express 21, 20626–20631 (2013).
24. S. Wiggins, Introduction to Applied Nonlinear Dynamical Systems and Chaos, Second Edition, (Springer 2003).25. J. N. Kutz, Data-Driven Modeling and Scientific Computation (Oxford 2013).26. J. Wright, A. Yang, A. Ganesh, S. Sastry, and Y. Ma, “Robust face recognition via sparse representation,” IEEE
Trans. Pattern Ana. Mach. Int. 31, 210–227 (2009).27. D. Needell and J. A. Tropp, “CoSaMP: iterative signal recovery from incomplete and inaccurate samples,”
Comm. of the ACM 53, 93–100 (2010).
1. Introduction
Mode-locked fiber lasers have continued to make tremendous strides in engineering perfor-mance, both in terms of output energy and peak powers, yielding approximately a two ordersof magnitude power increase in the last decade [1]. Despite such exceptional experimentalachievements, first-principals modeling of fiber lasers has remained, for over two decades now,qualitative in nature. The underlying and primary reason which has prevented quantitative mod-eling efforts is the fiber birefringence [2–5] (See also the recent review article by Gordon andKogelnik [6]). It is well understood from these studies, primarily aimed at fiber optic commu-nications, that the fiber birefringence is stochastic in nature, varying randomly along the lengthof the fiber laser cavity and highly susceptible (and sensitive) to environmental factors suchas bend, twist, anisotropic stress, and ambient conditions such as temperature. With moderndata-analysis methods, we propose to optimize mode-locking performance by learning a proxymeasure and classification for the fiber birefringence, thus allowing for a self-tuning laser de-sign capable of adapting rapidly to changes in birefringence.
Just as in optical communications, a fiber laser cavity propagates pulses over ultra-long dis-tances in fractions of a second. Signal distortions due to the chromatic dispersion and nonlin-earity accumulate after many round trips of the laser cavity, as does the signal distortion due tothe fiber birefringence [2–6]. Successful pulsed laser operation is achieved when the linear andnonlinear cavity effects balance each other resulting in stable mode-locked pulses [7, 8]. Al-though single-mode fibers are typically used for such laser cavities, the so-called single-mode
#203188 - $15.00 USD Received 18 Dec 2013; revised 20 Mar 2014; accepted 21 Mar 2014; published 3 Apr 2014(C) 2014 OSA 7 April 2014 | Vol. 22, No. 7 | DOI:10.1364/OE.22.008585 | OPTICS EXPRESS 8586

SA
P+ P-‐
α3 α2
α1
αp
u v
gain
(A) (B)
(C)
Fig. 1. (A) Schematic of a mode-locked laser cavity which includes a ring fiber with sat-urable absorber (SA) and gain element. (B) The SA is generated by nonlinear polarizationrotation interacting with three waveplates (α j where j = 1,2,3) and a polarizer (αp). In-coming polarized light (P−) is attenuated by the polarizer if it is not in alignment with thetransmitting axis. Thus only a single polarization direction (P+) is transmitted. (C) The fiberitself is subject to stochastic fluctuations in the birefringence, i.e. random rotations of theprincipal fast- and slow-axes, u and v respectively. Shown is an example portion of fiberwhere the rotations depend sensitively on bend, twist, anisotropic stress, and/or ambienttemperature.
fibers in fact support two modes simultaneously, which are orthogonally polarized. In an ideal-ized circular-core fiber, these two modes will propagate with the same phase velocity. However,practical fibers are not perfectly circularly symmetric. As a result, the two modes propagate withslightly different phase and group velocities due to small differences in the effective index ofrefraction experienced by each. While this birefringence is small in absolute terms in standardoptical fibers, approximately 10−7 index of refraction difference in the two modes, the corre-sponding beat length LB is about 10 meters with variations occurring on lengths of 100 meters,which is often on the same order as the dispersive and/or nonlinear length scales. As a result,the birefringence can have a significant impact on mode-locking dynamics.
To illustrate the cavity sensitivity to birefringence, consider one of the most commerciallysuccessful mode-locked lasers to date (See Fig. 1): the well-known mode-locked fiber laserthat relies on nonlinear polarization rotation (NPR) for achieving saturable absorption using acombination of waveplates and polarizer [8–11]. This NPR based laser concept is more thantwo decades old and is so successful in part due to its reliance on simple off-the-shelf telecomcomponents, rendering it a highly cost-effective mode-locking source. More recently, tremen-dous performance advances in this NPR laser have been made in power delivery by usingall-normal dispersion fiber cavities [12–14] and/or self-similar pulse evolutions [15–17]. It hasalso been recently conjectured that multi-NPR sections can be used in the cavity to overcomethe multi-pulsing instability and achieve additional performance gains [18–20]. However, suchcommercial lasers must enforce strict environmental control to maintain performance, i.e., thefiber birefringence is controlled by pinning into place and shielding it from temperature fluc-tuations. Such system sensitivity has prevented it from major performance advances, limitingpower and pulsewidths. Moreover, failure to accurately model the stochastic and sensitive bire-fringence fluctuations in the cavity have deprived the community for more than two decades ofa quantitatively accurate model of this highly successful laser system.
#203188 - $15.00 USD Received 18 Dec 2013; revised 20 Mar 2014; accepted 21 Mar 2014; published 3 Apr 2014(C) 2014 OSA 7 April 2014 | Vol. 22, No. 7 | DOI:10.1364/OE.22.008585 | OPTICS EXPRESS 8587

Our objective in this manuscript is to make use of modern data-analysis methods, i.e. ma-chine learning techniques, to help discover a proxy measure for the effective cavity birefrin-gence. Unlike optical communication lines where over long distances a statistical average mightbe experienced by a pulse, here a single realization of a stochastic variation of the birefringenceis what drives the laser cavity dynamics (See Fig. 1(c)). If the cavity is perturbed by bend, twist,anisotropic stress, and/or ambient temperature, then a new realization results. For optimizingperformance, it is critical to characterize, or recognize, the fiber birefringence correctly in orderto determine the waveplate and polarizer settings, for instance, required to give the best energyperformance.
Using pattern learning methods, we demonstrate that spectrogram measurements, which aredimensionally reduced using a singular value decomposition, uniquely characterize the aver-age cavity birefringence. This gives rise to a sparse representation and classification schemefor identifying the dynamic regime of the cavity. Our algorithm allows for efficient self-tuningof the laser cavity when combined with an adaptive controller [21] with servo-driven compo-nents [22, 23]. Thus instead of attempting to model the stochastic birefringence fluctuationsdirectly, which can only practically be done in a statistical way, we instead measure and learnthe impact of birefringence on mode-locking performance and provide a method by which op-timal, self-tuning can be achieved. Although we demonstrate the method on a computationalmodel, the algorithm would ideally apply directly to the laser cavity as there is no need for anunderlying model.
The paper is outlined as follows: Sec. 2 outlines the theoretical (computational) model usedfor the laser cavity along with the adaptive controller and objective function for optimizing thecavity performance. Section 3 develops a toroidal search algorithm which allows for an exten-sive and rapid search of the best candidate mode-locked states in the system. The constructionof spectrograms for various average birefringence values are also shown. Section 4 developsthe primary contribution of the paper: an algorithm that is capable of recognizing the averagebirefringence state of the system. Key to an accurate recognition is the application of a sparseclassifier, which is a novel method for identifying dynamical regimes. Section 5 gives the re-sults of the classification methodology and shows the success of the algorithm. An overview ofthe method and future outlook of its applicability are given in the concluding Sec. 6.
2. Fiber laser model and objective function
In previous work [21], an extremum seeking controller (ESC) was designed to achieve andmaintain a high-energy, single-pulse state in a mode-locked fiber laser. Given initial parametervalues, the ESC enables us to obtain the local maximum of our objective function by varying thefiber laser control parameters, i.e. waveplates and polarizers for a cavity based upon nonlinearpolarization rotation. However, the performance of the laser is still limited since the controlleritself is only capable of tracking the local maximum of the objective function instead of thedesired global maximum. As a result, we propose a data-driven technique which allows us tobuild a library of time series of the objective function that globally samples the entire param-eter space for different birefringence values. Once a sufficiently large library is obtained, thestate of fiber laser system can be then characterized by matching the current system behaviorwith library entries, hence the global optimal performance can be identified, and then subse-quently maintained by ESC. In order to perform such a task, an example model laser system isintroduced.
2.1. Laser Cavity Model
In order to demonstrate that the machine learning algorithm provides us with the accurate bire-fringence characterization, full simulations of a laser cavity are performed. In practice, the al-
#203188 - $15.00 USD Received 18 Dec 2013; revised 20 Mar 2014; accepted 21 Mar 2014; published 3 Apr 2014(C) 2014 OSA 7 April 2014 | Vol. 22, No. 7 | DOI:10.1364/OE.22.008585 | OPTICS EXPRESS 8588

gorithm advocated here would sample from the experimental laser dynamics and no theoreticalmodel would be required.
To describe the propagation dynamics in the laser fiber, including the interaction of chromaticdispersion, self-phase modulation, birefringence, cavity attenuation/loss, and bandwidth limitedgain and saturation, we use the coupled nonlinear Schrodinger equations (CNLS) [3, 4]:
i∂u∂ z
+D2
∂ 2u∂ t2 −Ku+(|u|2 +A|v|2)u+Bv2u∗ = iRu, (1a)
i∂v∂ z
+D2
∂ 2v∂ t2 −Kv+(|v|2 +A|u|2)v+Bu2v∗ = iRv, (1b)
where u and v represent two orthogonally polarized electric field envelopes (the fast- and slow-axis respectively) in the fiber cavity of an optical fiber with birefringence K. The variable zdenotes the propagation distance which is normalized by the length of the first fiber sectionand t is the retarded time normalized by the full-width at half-maximum of the pulse. Theparameter D is the averaged group velocity dispersion of the fiber section. It is positive foranomalous dispersion and negative for normal dispersion. The nonlinear coupling parametersA (cross-phase modulation) and B (four-wave mixing) are determined by the material of theoptical fiber. For axially symmetric fibers A = 2/3 and B = 1/3. The right hand side of theequations, which are dissipative terms, account for the bandwidth limited gain saturation andattenuation, where the operator R of the dissipative terms is defined as follows:
R =2g0
1+ 1e0
∫∞
−∞(|u|2 + |v|2)dt
(1+ τ
∂ 2
∂ t2
)−Γ . (2)
Here g0 and e0 are the nondimensional pumping strength and the saturating energy of the gain.Parameter τ characterizes the bandwidth of the pump, and Γ measures the losses (taken to bedistributed) caused by the output coupling and the fiber attenuation.
The waveplates and polarizer are modeled by discrete components in the laser cavity cor-responding to Jones matrices. The standard Jones matrices of the quarter-waveplate, half-waveplate and polarizer are given, respectively, by:
Wλ4=
(e−iπ/4 0
0 eiπ/4
), (3a)
Wλ2=
(−i 00 i
), (3b)
Wp =
(1 00 0
). (3c)
The Jones matrices are valid only when the principle axes of the device is aligned with the fastaxis of the fiber. However, this is not generically the case. For an arbitrary orientation given byαk (k = 1,2,3, p), the Jones matrices are modified so that
Jk = R(αk)WR(−αk), (4)
where W is one of the given Jones matrices and R is the rotation (alignment) matrix:
R(αk) =
(cos(αk) −sin(αk)sin(αk) cos(αk)
). (5)
This provides a full characterization of the waveplates and polarizers along with their alignmentback to the principal axes of the fiber itself.
#203188 - $15.00 USD Received 18 Dec 2013; revised 20 Mar 2014; accepted 21 Mar 2014; published 3 Apr 2014(C) 2014 OSA 7 April 2014 | Vol. 22, No. 7 | DOI:10.1364/OE.22.008585 | OPTICS EXPRESS 8589
The CNLS model together with the Jones matrices provides a full description of pulse propa-gation and mode-locking dynamics in the laser system. The full simulation of the laser evolvesthe CNLS equations, using a spectral (Fourier transform) decomposition in the time domainand an adaptive Runge-Kutta method for propagating along the fiber, and a periodic (after ev-ery round trip) implementation of the Jones matrices of waveplates and polarizers. The discreteapplication of Jones matrices after each cavity round trip produces an effective saturable ab-sorption that can be used to control and tune the mode-locking dynamics.
2.2. Objective Function
For any sampling and machine learning method to work, one need to decide how to characterizethe state of the laser system effectively. In previous work [21], an objective function O wasintroduced which was obtained by dividing the pulse energy E by the spectral kurtosis M4(fourth-moment) of the wave form:
O =E
M4. (6)
This objective function, which has been shown to be successful for applying adaptive control,is large (optimal) when we have a large amount of energy in a tightly confined temporal wavepacket [21]. The spectral kurtosis M4 measures the spread of the waveform.
The objective function enables us to discriminate multi-pulse and chaotic wave forms fromthe desired single-pulse wave form while providing us with a quantity that favors tight, high-energy, single-pulse wave forms. Figure 2(h) shows the normalized objective function (red),pulse energy (black) and kurtosis of the spectrum (blue) when rotating on the 2-torus of wave-plate α3 and polarizer αp. The objective function selected is ideal for optimizing pulse energywhile simultaneously keeping the mode-locking away from instability boundaries (gray re-gions) [21]. Figure 2(g) shows the wave forms that correspond to the settings marked by thecircle, square, diamond, and triangle in Fig. 2(h). The maximal energy occurs away from theregions of single-pulse mode locking (white region), thus tracking energy alone as the objectivefunction would lead to chaotic solutions (grey regions). In contrast, the objective function haslocal maxima in the single-pulse, mode-locked region. The spectral kurtosis (blue) is small inthe single-pulse mode-locking region and is much larger in the grey regions because of multi-pulsing or chaotic wave forms. As a result, dividing energy by the spectral kurtosis penalizesnon-mode-locked and multi-pulsing mode-locked states. In the remainder of this paper, we willuse this objective function to characterize the state of the fiber laser. It should be noted, how-ever, that any objective function could be picked so that the shortest pulse, broadest spectrumor some other quantity of interest can be selected as a quantity of interest.
3. Toroidal search and library building
In this section, a search algorithm will be developed for characterizing the optimal mode-locking performance as a function of birefringence. In practice, this algorithm could take afew to tens of minutes to execute given the fact that mode-locking itself occurs in microsec-onds. Thus the only limitation to how fast the algorithm can be executed is the speed of theservo-driven controllers [22, 23].
3.1. Toroidal Search
In the experimental setting, the NPR unit consists of the polarizer and three waveplates thatcan be rotated from 0 to 2π , thereby creating a parameter space that is a 4-torus. Multiple NPRsections can be included, let’s say N of them, to further enhance performance [18–20]. In orderto sample the resulting parameter space (4N-torus), a toroidal search algorithm is developed. If
#203188 - $15.00 USD Received 18 Dec 2013; revised 20 Mar 2014; accepted 21 Mar 2014; published 3 Apr 2014(C) 2014 OSA 7 April 2014 | Vol. 22, No. 7 | DOI:10.1364/OE.22.008585 | OPTICS EXPRESS 8590

(a)
20 40 60 80 1000
0.1
0.2
Objective
Time(sec)
(b)
(c)
20 40 60 80 1000
0.1
0.2
Objective
Time(sec)
(d)
(e)
20 40 60 80 1000
0.1
0.2
Objective
Time(sec)
(f)
−20 0 200
1
2
3
q
t
CircleSquareDiamondTriangle
(g)
31.5 32 32.50
0.5
1
Nor
mal
ized
Qua
ntiti
es
Time(sec)
(h)
Fig. 2. (a, c, e) 2-torus of α3 and αp with sample points shown (dots) for different samplerates (1.25Hz-black, 5Hz-magenta, 20Hz-blue, the global optimum is marked in red). (b, d,f) The time-series of the corresponding objective function with the global optimum againmarked in red. (g) Wave forms of the laser output corresponding to different parametervalues marked in (h). (h) Zoomed in objective function (red) plot near the global optimum,pulse energy (black) and kurtosis (blue) are also shown (all normalized to the same scalefor comparison).
we want to sample this 4N-dimensional torus, then 4N time series are constructed from:
θ j(t) = ω jt +θ j0 (7)
for j ∈ [1, . . . ,4N], where θ j0 are initial parameter values, ωi are angular frequencies which areincommensurate, i.e. equation
mω j +nωk = 0 (8)
doesn’t have integer solution. In other words, ω j/ωk is irrational for any j,k∈ [1, . . . ,4N], givenj 6= k. It is easy to prove that under such conditions, [θ1(t) . . . θ4N(t)] is dense on the torus [24].Thus using this method, it is guaranteed that one can sample any torus sufficiently well if sam-pling for a long enough time or using a high enough sample rate. In the following sections ofthis paper, we take a 2-torus for a single NPR laser as a simple example case. However, themethods mentioned in this paper can be applied to toroidal parameter spaces of any dimension-ality. Figure 2 shows how the toroidal sampling works on a 2-torus comprised of parametersα3 and αp. Specifically, the resulting time series of the objective function O is demonstrated
#203188 - $15.00 USD Received 18 Dec 2013; revised 20 Mar 2014; accepted 21 Mar 2014; published 3 Apr 2014(C) 2014 OSA 7 April 2014 | Vol. 22, No. 7 | DOI:10.1364/OE.22.008585 | OPTICS EXPRESS 8591

as the 2-torus is sampled. In Fig. 2(a), the torus in under-sampled and aliasing of the objectivefunction occurs. However, as the sampling rate is increased, as shown in Fig. 2(e), the objectivefunction is fully constructed and an evaluation of best performance can be ascertained. Indeed,the red dot in Fig. 2(f) shows the optimal global maxima of the laser cavity. The narrow shadedregion around this peak performance is highlighted in Fig. 2(h) where an additional evaluationis made of whether the solution is mode-locked or not.
3.2. The Gabor Transform (spectrogram) and Library Building
For a given birefringence value, toroidal sampling is used to produce a time series of the ob-jective function. Note that we use the entire time series to compute spectrograms in our librarybuilding process. Once the library is constructed, optimal parameter settings are kept for futureuse. In order to develop a robust algorithm that matches the current objective function timeseries with the library entries, we want to utilize both the temporal and spectral (frequency)signatures of the time series. As a result, we introduce the Gabor transform and construct aspectrogram [25] of the optimal solution.
It is observed that the time series collected from toroidal sampling are comprised of variousfrequency components that are exhibited at different times. Although the Fourier transform ofthe signal contains all frequency information, there is no indication of when each frequencyoccurs in time. Indeed, by definition, the Fourier transform eliminates all time-domain infor-mation since we integrate over all time. To circumvent the limitation of the direct application ofFourier transform, Gabor proposed a formal method for keeping information in both time andfrequency. His method involved a simple modification of the Fourier transform kernel:
gt,ω(τ) = eiωτ g(τ− t), (9)
where the filter g(τ− t) was introduced with the aim of localizing both time and frequency. TheGabor transform, also known as the short-time Fourier transform is then defined as:
fg(t,ω) =∫
∞
−∞
f (τ)g(τ− t)e−iωτ dτ, (10)
where the bar denotes the complex conjugate of the function. Thus the function g(τ− t) acts asa time filter for localizing the signal and its frequency content over a specific window of time,allowing for the construction of a spectrogram. A spectrogram represents a time series (signal)in both the time and spectral domain, as shown in Fig. 3.
Our key observation is that these spectrograms are unique for varying cavity birefringence.Thus the spectrogram serves as a proxy measure for classifying the underlying cavity birefrin-gence. Unique spectrograms for various birefringence values in the library are shown in Fig 4.By definition the spectrograms are symmetric in frequency, for storage and computation effi-ciency concerns, we only use the positive frequency part of the spectrograms for classificationpurposes. These spectrograms serve as the basis of a pattern recognition/classification schemefor determining the value of cavity birefringence.
4. Birefringence classification and recognition
In the previous section, we built a spectrogram library using a Gabor transform with Gaussianwindow. To match a current time series with library entries, the Gabor transform is also appliedto the time series sampled from the current system to get the spectrogram. A sparse samplingtechnique is then applied to recognize the current birefringence from possible library elements.
To start, assume we have computed the spectrogram Sk for a large number of possible bire-fringence values where k ranges from 1 to M, and for each k, a singular value decomposition
#203188 - $15.00 USD Received 18 Dec 2013; revised 20 Mar 2014; accepted 21 Mar 2014; published 3 Apr 2014(C) 2014 OSA 7 April 2014 | Vol. 22, No. 7 | DOI:10.1364/OE.22.008585 | OPTICS EXPRESS 8592

0 20 40 60 80 1000
0.10.2
Time(sec) sampled at 20 Hz, K=0.17143
Obj
Fun
Fig. 3. Top: objecive function time series sampled at K = 0.17143 (black solid), a GaussianGabor window centered at τ = 20 is also shown (red solid). Bottom: corresponding spec-trogram obtained using Gabor transform with the Gaussian window shown in top panel.
Fig. 4. Spectrograms for different birefringence values, various (and unique) temporal dy-namics can be observed from the comparison.
(SVD) is applied to the spectrogram [25]:
Sk =UkΣkV ∗k (11)
andUk = [uk1uk2 · · ·ukn ]. (12)
For each k value, we keep the first m (m < n) modes (low-rank approximation) of Uk which has
#203188 - $15.00 USD Received 18 Dec 2013; revised 20 Mar 2014; accepted 21 Mar 2014; published 3 Apr 2014(C) 2014 OSA 7 April 2014 | Vol. 22, No. 7 | DOI:10.1364/OE.22.008585 | OPTICS EXPRESS 8593

0 50 1000
0.1
0.2
Time
Obj
0 10 20 30 40 5010−5
100
Mode #
Sing
ular
Val
5 10 150
0.5
1
Mode #
Freq
Fig. 5. Top left: Time series of objective function obtained by toroidal search, sampled at20Hz. Top right: Spectrogram of the time series. Bottom left: Singular values from SVD,the largest 15 singular values (corresponding to SVD modes used in the library) are plottedin red and the rest are plotted in blue. Bottom right: SVD modes correspond to the largest15 singular values.
the highest energy and store them in the modes library UL such that
UL = [U1U2 · · ·UM] (13)
where the k-th sub-library Uk contains the first m modes of Uk:
Uk = [uk1uk2 · · ·ukm ]. (14)
Once we have constructed our dimensionally reduced modes library, we can take a measure-ment of the laser system (the objective function) and compute the spectrogram. Note that thesampling time does not have to be of the same length as the time series collected when the li-brary was built. We perform an SVD reduction on the measured spectrogram and keep the firstm modes as before, as illustrated in Fig. 5. With the most important (dominant) modes fromthe measurement in hand, we can do an L1-norm library search, thus promoting sparsity in oursolution [25]. In the L1-norm search, our objective is to find a vector
a = argmina‖a‖1 (15)
subject toUL ·a = um1 . (16)
Here we require the number of library modes to be greater than the dimensionality of the fre-quency domain. Given this condition, this becomes an underdetermined linear system of equa-tions. The L1-norm minimization produces a sparse vector a, i.e. only a small portion of theelements are non-zero, as shown in Fig. 6. The non-zero elements of vector a act as a classifier(indicator function) for identifying which sub-library the birefringence falls into. Thus if thelargest element falls into the i-th sub-library, the recognized birefringence value is equal to Ki.This sparsity promoting optimization, when used in conjunction with the unique spectrograms,gives a rapid and accurate classification scheme for the fiber birefringence. Thus birefringencerecognition can be easily accomplished. Note that our classification scheme essentially usesthe L1-norm minimization produce as an indicator function for the correct library elements.More sophisticated sparse classification/recognition strategies can be applied if desired [26],potentially yielding even better recognition results.
#203188 - $15.00 USD Received 18 Dec 2013; revised 20 Mar 2014; accepted 21 Mar 2014; published 3 Apr 2014(C) 2014 OSA 7 April 2014 | Vol. 22, No. 7 | DOI:10.1364/OE.22.008585 | OPTICS EXPRESS 8594

100 200 3000
0.5
1
j
|aj|
100 200 3000
0.05
j
|aj|
Fig. 6. Top: Barplot of the components of vector a from L1 optimization where sparsitycan be observed, i.e. it is mostly comprised of zeros. The indicator function nature of thesparse representation is clearly observed. Bottom: Barplot of components of vector a fromL2-norm optimization, showing it does not produce any classification.
5. Classification results
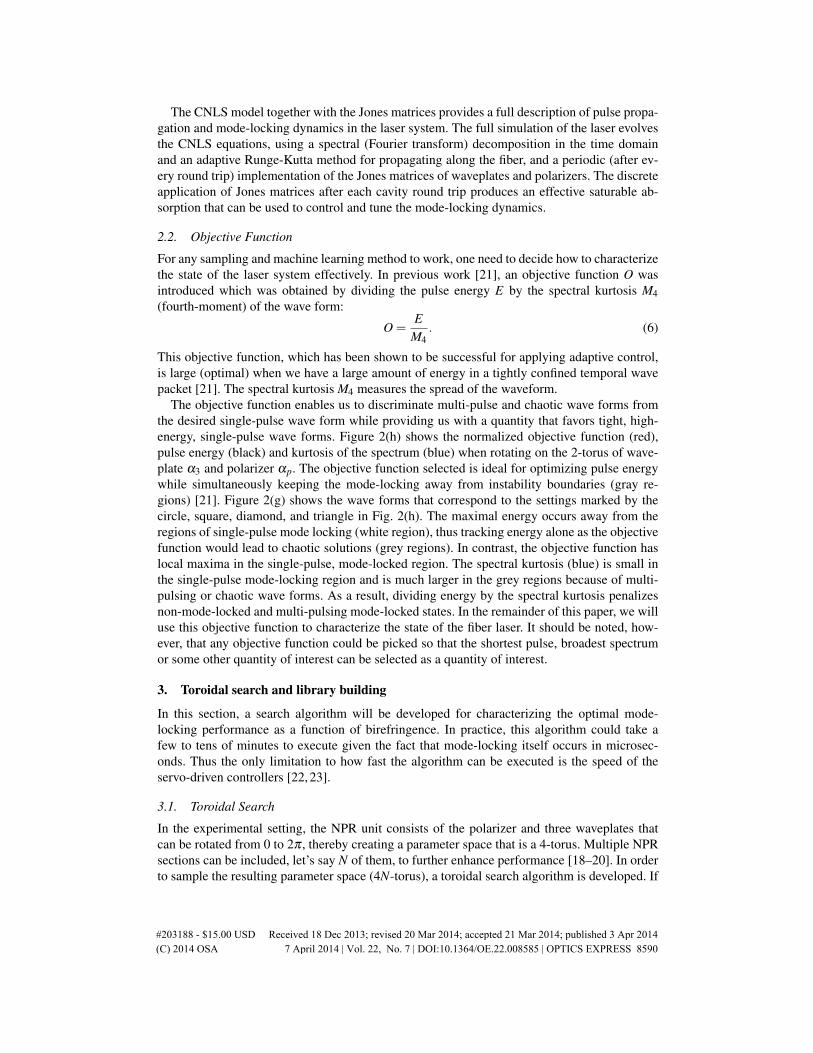
The sparse search algorithm is tested using the pre-computed spectrograms with Gaussian ran-dom noise added. In our test, the birefringence K is varied following a gaussian random walk.For each trial, the spectrogram corresponding to the current birefringence is computed and theL1-norm sparse search is executed. Recognition results and errors are showed in Fig 7. In thefigure, the recognition algorithm is tested in two scenarios: (i) well-aligned data given the as-sumption that the servo motors that control the waveplates and polarizers work without error,and (ii) the mis-aligned data that considers the error in the initial angle of the servo motors. Inboth of these two scenarios, the sparse search works very well. In the well-aligned case, a bire-fringence recognition (classification) rate of 98% is achieved while in the mis-aligned case, weget a 88% recognition rate. It should also be noted that even when our recognition algorithmfails to find the correct birefringence value, the error between the true birefringence and therecognized value is very small. Thus, even if we use the mis-classified birefringence, is is likelythat the predicted optimal parameters will be near the true optimal parameters and the adaptivecontroller [21] will bring the laser system back to peak performance.
6. Conclusions and outlook
The stochastic nature of fiber birefringence has been the major impediment in allowing forquantitatively accurate modeling of fiber lasers for optimizing their performance. Indeed, allother physical parameters in the system, such as the Kerr nonlinearity, dispersion characteris-tics as a function of wavelength, gain and gain bandwidth, can be fairly well characterized intheoretical models. Thus only the birefringence remains unknown and randomly varying. Andunlike optical communications, where statistical averaging methods can be used to quantify itseffects statistically, a fixed laser cavity represents a single, and unknown, statistical realizationof the birefringence which is highly susceptible and sensitive to environmental factors suchas bend, twist, anisotropic stress, and ambient conditions such as temperature. Such a systemrequires new modeling methods which are based upon state-of-the-art data-driven strategies.
We have demonstrated that a toroidal search method forms the basis of a machine learn-ing algorithm for characterizing the performance of a mode-locked laser cavity as a functionof birefringence. By constructing a library of objective function spectrograms and their peakperformance, a unique signature is given for various cavity birefringence values. Indeed, eachunique spectrogram can be reduced using a singular value decomposition and stored in a li-
#203188 - $15.00 USD Received 18 Dec 2013; revised 20 Mar 2014; accepted 21 Mar 2014; published 3 Apr 2014(C) 2014 OSA 7 April 2014 | Vol. 22, No. 7 | DOI:10.1364/OE.22.008585 | OPTICS EXPRESS 8595
0 50 100−0.5
0
0.5
K
0 50 100−0.5
0
0.5
K
0 50 100−0.5
00.5
Trial
Error
0 50 100−0.5
00.5
Trial
Error
Fig. 7. Left: Recognition results and errors using well-aligned data. A 98% correct bire-fringence classification is achieved. Right: recognition results and errors using mis-aligned(shifted) data. In this case, an 88% correct birefringence classification is achieved. Notethat the blue dots represent the true birefringence labels while the red circles are the classi-fied birefringence. Even if misclassified, the algorithm produces a birefringence that is onlyslightly off, thus still allowing for a rapid tuning of the laser cavity to the optimal waveplateand polarizer settings.
Gain
Fiber
Birefringence
s1s2 sps3Servos
Optics
↵1↵2 ↵p↵3
Machine Learning Module
Training & Execution
Laser onFull
toroidal search
SVD modes of
spectrogram for current K
Tested all K?
Append SVD
modes to library
StopYes
No(b) Training
Laser onShort
toroidal search
Sparse representation recognition in
library
Good performance? Use current
parameter valuesYes
No
Training
(c) Execution
(a) Setup
Objective Function
K
Fig. 8. (a) Setup of the proposed mode-locked fiber laser wrapped with servos and machinelearning module. (b) Flowchart of training algorithm. (c) Flowchart of execution algorithm.Colored boxes have corresponding pseudo code provided in Table 1.
brary for future reference and classification. To evaluate the current cavities birefringence, atime-series sample of the objective function is taken, converted to a spectrogram, reduced usinga singular value decomposition, and classified using a sparsity promoting L1-norm optimiza-tion routine. Accuracies as high as 98% are achieved, thus suggesting the algorithm is highlypromising for application purposes. And even when birefringence is misclassified, the resultsare only off by a small percentage, thus suggesting that cavity tuning can still be effective andefficient. Although the algorithm was demonstrated on an underlying theoretical model, themethod can be integrated directly into an experimental laser cavity design, i.e. the advocatedmethod does not rely on an underlying model of the laser dynamics.
Philosophically, the approach taken here does not attempt to construct a better model of
#203188 - $15.00 USD Received 18 Dec 2013; revised 20 Mar 2014; accepted 21 Mar 2014; published 3 Apr 2014(C) 2014 OSA 7 April 2014 | Vol. 22, No. 7 | DOI:10.1364/OE.22.008585 | OPTICS EXPRESS 8596

Algorithm for Training and Execution1. Toroidal Search for Different K- start search with same initial value theta 0 vec %initialization
- generate time series for toroidal search theta vec(t)=omega vec*t+theta 0 vec
- collect corresponding objective function objfun(k,t)=obj calc(theta vec(t))
2. Library Building- compute spectrogram† S k=spectrogram(objfun(k,t))
- SVD† each spectrogram† [U k,Sigma k,V k]=svd(S k)
- keep first m modes U tilde k=U k(:,1:m)
- store SVD modes in library U L=[U L,U tilde k]3. Sparse Representation Recognition- compute spectrogram† (current) S curr=spectrogram(Obj curr)
- SVD† spectrogram [U curr,Sigma curr,V curr]=svd(S curr)
- keep first m modes U tilde curr=U curr(:,1:m)
- L−1 norm library search K curr=L1search(U tilde curr,U L)
- use optimal parameter values based on library tmax = find(max(objfun(K curr,t)),t)
theta opt = omega vec*tmax+theta 0 vec
Table 1. Algorithms and pseudo code for training and execution of machine learning mod-ule in Fig 8. († represents built-in MATLAB functions svd and spectrogram. The L-1norm library search can be implemented using the cvx package with details provide inSection 4, or with the compressive sampling matching pursuit (CoSaMP) [27].)
birefringence and its stochastic fluctuations. Rather, the cavity birefringence simply is what itis, and the goal is to use state-of-the-art data methods for classifying the birefringence intoa previously learned library, i.e. the library and classifier become the expert-in-the-loop. Onceclassified, the optimal waveplate and polarizer settings are then already known from the toroidalsearch algorithm. This ultimately leads to an efficient, self-tuning laser since the waveplates andpolarizers can be adjusted directly to their optimal positions using servo-control motors [22,23].Specifics of the physical implementation are given in Fig. 8 with the training and executionalgorithms given by the pseudo-codes in Table 1. The flow charts and algorithm architecture,which are color coded with each other, illustrate the practical implementation of the method.
More broadly, such difficulties in quantitative modeling are a hallmark feature of complexsystems which display some underlying stochastic dynamics. For instance, the modeling ofclimate and weather is extremely difficult due to underlying stochastic, micro-scale physics. Insuch complex systems, data-driven modeling techniques are critical for improving quantitativepredictions. In weather forecasting, for instance, data-assimilation methods have been criticalin achieving better performance (accuracy) and longer forecast windows [25]. Thus instead ofattempting to construct more refined, and typically over-parametrized models for the stochasticeffects, the goal is to simply make use of recognized, coherent patterns of activity and directmeasurements to inform decisions about the state of the system. The demonstration here showsthat such a method is highly effective for modeling fiber lasers.
Acknowledgments
J. N. Kutz acknowledges support from the U.S. Air Force Office of Scientific Research(AFOSR) (FA9550-09-0174).
#203188 - $15.00 USD Received 18 Dec 2013; revised 20 Mar 2014; accepted 21 Mar 2014; published 3 Apr 2014(C) 2014 OSA 7 April 2014 | Vol. 22, No. 7 | DOI:10.1364/OE.22.008585 | OPTICS EXPRESS 8597


![Phase stabilization of mode-locked lasersjunye/yelabsOLD/pubs/science...mode-locked Ti:sapphire lasers [9, 10]. It is also possible to use an auxiliary CW laser [19–21]; however,](https://img.pdfslide.us/doc/110x75/611c631d3eb22307be7a4ce5/phase-stabilization-of-mode-locked-lasers-junyeyelabsoldpubsscience-mode-locked.jpg)

![All solid-state passively mode-locked ultrafast lasers ... · All Solid-State Passively Mode-Locked Ultrafas t Lasers Based on Nd, Yb, and Cr Doped Media 75 has been reported [3.1]](https://img.pdfslide.us/doc/110x75/60054b10eba93d5c7a6e4b8f/all-solid-state-passively-mode-locked-ultrafast-lasers-all-solid-state-passively.jpg)


![Volume 6100 Solid State Lasers XV: Technology and Devices · MODE LOCKED AND ULF LASERS Future trends and applications of ultrafast laser technology [6100-14] J. Eichenholz, M. Li,](https://img.pdfslide.us/doc/110x75/606dcab8a4d7d6735044e0f5/volume-6100-solid-state-lasers-xv-technology-and-mode-locked-and-ulf-lasers-future.jpg)