Embed Size (px)
Citation preview
CLASSIFICATION ALGORITHMS IN
MALIGNANT ASTROCYTOMAS DIAGNOSIS USING INFORMATION
ON GENETIC BIOMARKERS
Estudiante: Luis Pérez del Villar
MÁSTER EN BIOINFORMÁTICA Y BIOLOGÍA COMPUTACIONAL ESCUELA NACIONAL DE SALUD- INSTITUTO DE SALUD CARLOS III
2013-2014
Computational Intelligence Group, Department of Artificial Intelligence,
Technical University of Madrid, Madrid, Spain
DIRECTOR DE LA TESIS: Dr. Pedro Larrañaga
CODIRECTOR DE LA TESIS Dr. Alfonso Valencia
FECHA: September 2014

¡Gracias! Me gustaría agradecer a Concha Bielza e Irene Rodríguez Hernández sus ideas y
aportaciones a este trabajo; así como a mis directores, Pedro Larrañaga y
Alfonso Valencia, por las facilidades que me han prestado para el desarrollo de
las prácticas.

Índice
1 OBJECTIVES ................................................................................................................. 4
2 INTRODUCTION .......................................................................................................... 5
3 MATERIAL AND METHODS ...................................................................................... 9
4 RESULTS ..................................................................................................................... 19
5 DISCUSSION ............................................................................................................... 29
6 CONCLUSIONS .......................................................................................................... 35
7 REFERENCES ............................................................................................................. 36

4 OBJECTIVES
1 OBJECTIVES The main objective of the present work was to use of a machine learning approach
based on supervised classification and feature subset selection data mining to
predict 105 grade II to IV astrocytoma diagnosis according to 39 common
alterations in TP53, EGFR-PI3K and Rb pathways, IDH1 mutations, alterations in
DNA repair genes and epigenetic factors. In addition, we also performed
unsupervised hierarchical cluster analysis to gain further support for high-grade
astrocytoma patients’ biology and outcome. In this context, we define the following
specific objectives:
1) To use five well known supervised classification algorithms (logistic regression,
support vector machine, Decision Tree, Naïve Bayes and k-NN) and two further
ensemble methods (bagging and boosting) in order to determine astrocytoma
diagnosis on the basis of its molecular characteristics.
2) To perform a feature selection technique in order to improve the accuracy of
supervised classification algorithms and to seed light about those features that are
relevant for the diagnosis of astrocytomas.
3) To perform unsupervised classification algorithms to differentiate informative
groups about astrocymas survival and to explored those features that are relevant in
the prognosis.

5 INTRODUCTION
2 INTRODUCTION
Diffuse infiltrating astrocytomas are the most common and aggressive
primary brain tumors in adults. They account for 70% of all primary brain tumors
with an incidence rate adjusted to the European Standard Population of 5.27 per 100
000 persons per year [1,2]. Malignant astrocytomas are histologically
heterogeneous and invasive tumours classified on the basis of histopathological
characteristics [3]. Analysis of tumor differentiation, cellularity, cytonuclear atypia,
mitotic activity, microvascular proliferation, and necrosis grades astrocytomas as
low-grade astrocytomas (WHO grade II), anaplastic astrocytomas (WHO grade III)
and glioblastomas (WHO grade IV) with increasing aggressiveness [3].
All diffuse astrocytomas are characterized by a high propensity to infiltrate
the surrounding brain structures that renders them incurable by surgery. Low-grade
astrocytomas occur in young adults between the ages of 30 and 45 years. Low-grade
astrocytomas are well-differentiated and slow-growing tumors with long clinical
courses. They tend to relapse and progress over time to astrocytomas of higher
grades of malignancy with a median survival of 5 to 10 years. Anaplastic
astrocytomas are considered a progression of low-grade astrocytomas. They are
more rapidly fatal and exhibit increased cellularity, nuclear atypia and high mitotic
activity. Anaplastic astrocytomas occur in adults around the age of 45 years and
patients have a median survival of around 2 years [2,4]. Glioblastomas are the most
frequent and aggresive astrocytomas, with a median survival of 12-14 months after
diagnosis despite optimal treatment [5]. Glioblastomas are highly heterogeneous
and infiltrating tumours, with uncontrolled cellular proliferation, high mitotic
activity, regions of necrosis and microvascular proliferation. On the basis on their
clinical presentation, glioblastomas can be separated in primary and secondary
glioblastomas. Primary glioblastomas present in an acute de novo manner with no
evidence of antecedent lower grade pathology. They account for more than 95% of
glioblastomas and occur in patients older than 50 years. In contrast, secondary
6 INTRODUCTION
glioblastomas derives from the progressive transformation of lower grade
astrocytomas, are quite rare and tend to occur in patients below the age of 45 years.
However, primary and secondary glioblastomas are morphologically and clinically
indistinguishable [2,6].
Malignant transformation in astrocytomas results from the sequential
accumulation of genetic aberrations and the deregulation of growth-factor signaling
pathways that are normally associated with the grade of malignance of the tumour.
The classical genetic alterations in astrocytoma target pathways governing cellular
proliferation, cellular survival (apoptosis and necrosis), invasion, angiogenesis and
metabolism [1,2]. Thus, low-grade astrocytomas are characterized by mutations in
TP53 and IDH1 genes, and overexpression of the (platelet-derived growth factor
receptor (PDGFR). In the progress to anaplastic astrocytomas, tumours acquire
mutations in retinoblastoma gene and loss of heterozygosity of chromosomes 9 and
19. In addition, anaplastic astrocytomas could progress to secondary glioblastomas
that carry the same mutations of lower grades of malignance plus loss of
heterozygosity of chromosome 10 where PTEN gene is located. On the other hand,
primary glioblastomas are characterized by loss of heterozygosity of chromosome
10 and consequently of PTEN gene, EGFR amplification, loss of p16, whereas
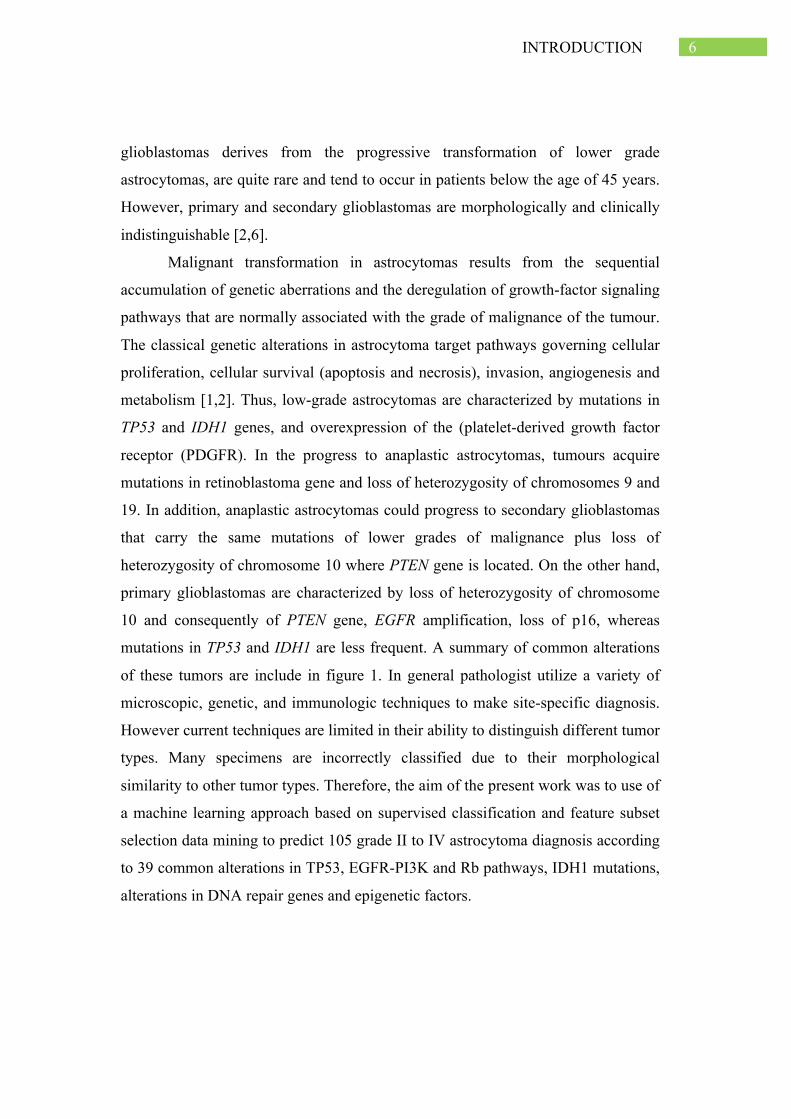
mutations in TP53 and IDH1 are less frequent. A summary of common alterations
of these tumors are include in figure 1. In general pathologist utilize a variety of
microscopic, genetic, and immunologic techniques to make site-specific diagnosis.
However current techniques are limited in their ability to distinguish different tumor
types. Many specimens are incorrectly classified due to their morphological
similarity to other tumor types. Therefore, the aim of the present work was to use of
a machine learning approach based on supervised classification and feature subset
selection data mining to predict 105 grade II to IV astrocytoma diagnosis according
to 39 common alterations in TP53, EGFR-PI3K and Rb pathways, IDH1 mutations,
alterations in DNA repair genes and epigenetic factors.
7 INTRODUCTION
Figure 1. Gene and genomic regions involved in the biology of diffuse astrocytomas. IDH1=isocitrate dehydrogenase 1. IDH2=isocitrate dehydrogenase 2. PTEN=phosphatase and tensin homologue. PI3K=phosphoinositide-3-kinase. EGFR=epidermal growth factor receptor. MDM2=mdm2 p53 binding protein homologue (mouse). PDGFR=platelet-derived growth factor receptor. Rb=Retinoblastoma. MGMT= methylguanine DNA methyltransferase. LOH=Loss of heterozygosity. CDKN2A=cyclin-dependent kinase inhibitor 2A encoding for p16.
We tested several different supervised classifier algorithms (see materials
and method). From a wide point of view, supervised machine learning is typically
associated with prediction where for each observation of the predictor
measurements (also known as feature variables) there is an associated response
measurement (also known as the class label). In this context, we aim to predict the
final diagnosis of astrocytomas based on their molecular alterations.
In addition, to gain further support for high-grade (grade III and IV) astrocytoma
patients’ biology and outcome, we also performed unsupervised hierarchical cluster
analysis. Unsupervised machine learning is a more open-ended style of statistical
learning. Instead of using labelled data sets, unsupervised learning is a set of
statistical tools intended for applications where there is only a set of feature
8 INTRODUCTION
variables measured across a number of observations. In this case, prediction is not
the goal because the data set is unlabeled, i.e. there is no associated response
variable that can supervise the analysis. Rather, the goal is to discover interesting
things about the measurements on the feature variables. For example, you might
find an informative way to visualize the data, or discover subgroups among the
variables or the observations. Methods to classify tumors according to key
molecular events that regulate growth of their most aggressive cellular component
and to predict changes that accompany disease recurrence might greatly facilitate
the development of targeted therapies.

3 MATERIAL AND METHODS Patients and Samples
One hundred and five astrocytoma samples were collected from the
Neurosurgery Department, University Hospital of Salamanca (Spain). All tumors
were histologically classified at the time of diagnosis and reviewed by an
independent blinded pathologist to the original diagnosis according to the 2007
WHO classification [3]. Tumors were classified as 24 low-grade astrocytomas
(grade II), 16 anaplastic astrocytomas (grade III) and 65 primary glioblastomas
(grade IV). Thus, the class to be predicted in the present study is the final diagnosis
of astrocytomas split on the three described categories. All patients gave informed
consent to participate and the study was approved by the local ethics committee.
Blood and tumor tissue samples of all patients were obtained at diagnosis before
initiation of treatment. Matched DNA from peripheral blood and frozen tumor
specimens were extracted by standard phenol/chloroform procedure. Tumor tissues
were also fixed in formalin and embedded in paraffin for immunohistochemical
analysis.
Mutational analysis
Exons and flanking intronic sequences of TP53 (all exons), PTEN (all
exons), PI3KCA (exons 7, 9 and 20), IDH1 (exon 4), IDH2 (exon 4) and BRAF
(exons 11 and 15) were screened for mutations in tumor DNA by PCR (Polymerase
Chain Reaction) amplification and direct sequencing analysis using an ABI Prism
3100 Genetic Analyzer (Applied Biosystems). Primers sequences are available upon
request.
Polymorphism analysis
Genotyping of TP53 (rs1042522) and MDM2 (rs10425229) polymorphisms
was performed by the PCR-RFLP (Polymerase Chain Reaction - Restriction
Fragment Length Polymorphism) technique using DNA extracted from peripheral
blood of patients as described [7,8]. Genotyping of BCL2 (rs2279115), BAX
10 MATERIAL AND METHODS
(rs4645878), KRAS-LCS6 (rs61764370) ERCC1 rs11615, ERCC2 rs13181, ERCC6
rs4253079, APEX1 rs1130409, XRCC1 rs25487, XRCC3 rs861539 and MLH1
rs1800734 polymorphisms was performed using TaqMan 5’-exonuclease allelic
discrimination assays (Applied Biosystems) [9]. To assess reproducibility, a
randomly selected 5% of the samples were re-genotyped and all of these genotypes
matched with genotypes initially designated.
Methylation-specific multiplex ligation-dependent probe amplification (MS-
MLPA)
Methylation status of MGMT, MLH1, MSH2 and MSH6 promoter regions
was detected using the SALSA MS-MLPA Kit ME011 (MRC-Holland) using
specific probes that recognized sequences containing a methylation-sensitive HhaI
restriction site. All reactions, processing and analysis were carried out as reported
previously [10,11].
Reverse transcription-polymerase chain reaction (RT-PCR)
Total RNA was extracted from frozen tumor tissues using Trizol reagent
(Invitrogen) according to manufacturer protocol. Complementary DNA (cDNA)
was synthesized with the Improm-IITM Reverse Transcription System (Promega).
EGFRvIII expression was determined by RT-PCR following the procedure reported
elsewhere [12].
Fluorescence In Situ Hybridization (FISH)
EGFR amplification (locus 7p12) and PTEN deletion (locus 10q23) were
analyzed by Fluorescence In Situ Hybridization (FISH). Dual-probe FISH analysis
was performed on tumor tissue sections using locus-specific probes for centromere
7/EGFR gene and centromere 10/PTEN gene (Vysis, Dowerners Grove, IL). FISH
studies were carried out following well-established methods as described before
[11,13].
Immunohistochemistry
p53, p63, ki67, VRK1, VRK2, MLH1, MSH2, MSH6, HDAC1, HDAC2
and HDAC3 protein expression was assessed by immunohistochemistry using a
tissue microarray containing the 105 astrocytomas and 8 different tissue controls as
it has been previously described [10,11]. The primary monoclonal antibodies used

11 MATERIAL AND METHODS
were p53 (clone DO-7, Novocastra), p63 (clone 4A4, Dako), ki-67 (clone MIB-1,
Dako), VRK1 [14], VRK2 [15], MLH1 (clone G168-15, BD Pharmingen), MSH2
(clone FE11, Biocare Medical), MSH6 (clone BC/44, Biocare Medical), HDAC1
(ab7028 Abcam), HDAC2 (ab7029 Abcam) and HDAC3 (ab7030 Abcam). Protein
expression was evaluated semiquantitatively by a blinded pathologist to clinical and
molecular information as reported before [10,11].
Microsatellite Instability (MSI)
MSI was assessed by PCR in paired normal and tumor DNA using a panel
of 8 markers: 3 mononucleotide markers (Bat25, Bat26 and Bat40), 3 dinucleotide
markers (D2S123, D5S346 and D17S250) and 2 tetranuclotide markers (Mycl and
Pax6). The procedures and analysis for MSI determination have been previously
reported [10].
Supervised classification methods
We used the supervised classification algorithms described above.
Logistic regression is useful to predict the presence or absence of an
outcome or a characteristic based upon the values of a set of predictor variables. We
consider the following definition for binary classification:
𝑝 𝐶 = 1 𝑥 = 1/[1+ 𝑒! !!! !" !!!!!! ]
Where x represents an instance to be classified meanwhile 𝛽!,𝛽!,… ,𝛽! are
the parameters of the model. These parameters should be estimated from the data in
order to obtain a concrete model. The parameter estimation is performed by means
of the maximum likelihood estimation method as previously described [16].
Nearest-neighbor (K-NN) classifier is a simple but effective classification
algorithm. The training process is basically memorizing all the training data. To
predict a new data point, we found the closest K (a tunable parameter) neighbours
from the training set and let them vote for the final prediction, as shown in figure 2.

12 MATERIAL AND METHODS
Figure 2: Example of a k-nearest-neighbor classification. The problem consists of two variables, X1 and X2 , and two classes, circle and cross. The circles and crosses represent the known examples, and the question mark a new instance that we need to classify. A 1-nearest neighbor classifies an unlabeled instance as the class of the known instance closest to the instance. In this case, a 1-nearest neighbor would classify the question mark as a cross. A 2-nearest neighbor looks at the two closest examples. In our case, we have a circle and a cross and thus have to choose a way to break the ties. A 3-nearest neighbor would classify the question mark as a circle (we have two circles and a cross). Setting the k value at an odd value allows us to avoid ties in the class assignment.
The IB-K algorithm used in this paper is a case-based K-NN classifier. The
main idea of K-NN is the following: to assign labels to new samples depending on
their similarity with a reference set of already labelled instances (K=5) [17].
Implementations commonly use Euclidean distance for numeric attributes and
nominal-overlap for symbolic features. In the present study Manhattan metric was
used as measure of the degree identity between the test sample and the training
instances. The strength of K-NN is its simplicity, as no model needs to be trained.
Incremental learning is automatic when more data arrives (and old data can be

13 MATERIAL AND METHODS
deleted as well). The weakness of K-NN is that it does not handle high number of
dimensions well.
Decision or Classification Trees are one of the oldest machine-learning
models and it is usually applied to illustrate the very basic idea of machine learning.
Based on a tree of decision nodes, the learning approach is to recursively divide the
training data into nodes of homogeneous members through the most discriminative
dividing criteria. The measurement of "homogeneity" is based on the output label.
The related literature proposes a broad range of metrics to measure this correlation
degree between the known class C and the instance mainly based on information
theory as describes later. The model is fitted using binary recursive partitioning.
Each internal node splits the instance space into two or more sub-spaces according
to a certain discrete function of the input attributes values. The selection of this
variable is used to expand a tree in as many branches as possible values the variable
takes. Terminal nodes will ideally have samples of only one of the classes, although
a mixture of classes is usually found. During the training, various dividing criteria
based on the input will be tried (using in a greedy heuristic; that is, selecting at each
step the best splitting variable according to the selected criterion). Tree algorithms
can take different data type of input and output variables (categorical, binary and
numeric value). It can handle missing values and outliers well. The decision tree is
also good in explaining reasoning for its prediction and therefore gives good insight
about the structure underlying the data.
ID3 algorithm. One of the most common decision trees used is the
algorithm ID3 described by Quinlan (1986). The correlation measure between the
variable 𝑋! and the variable Class C is based on information gain:
I X! C = H C − H(C|X!)
Information gain is the measure of the difference in entropy from before to after
the variable Class C is split on an attribute the variable 𝑋!.
14 MATERIAL AND METHODS
C.4.5 Algorithm is an extension of Quinlan´s earlier ID3 algorithm. In this
case the measure of correlation between the variable 𝑋! and the Class variable C is
based on gain ratio defined as follows:
I X! C /H(X!)
This ratio avoids that the variables with more possible values were
advantageous for its selection. In the present study the tree was constructed using
the C4.5 algorithm [18].
Naive Bayes algorithm is the simplest Bayesian classifier. It apply Bayes’
theorem with the assumption of conditional independence of the predictive
variables given the class [19]. Given an instance, described by its feature vector
(𝑋!… 𝑋!), and a class target c, Bayes’ theorem allows us to express the conditional
probability 𝑃 𝑐 𝑥 as a product of simpler probabilities using the naıve
independence assumption:
𝑃 𝑐 𝑥 =𝑃 𝑐 𝑃 𝑥 𝑐
𝑃(𝑥) = 𝑃 𝑐 Π!!!! 𝑃(𝑥!|𝑐)
𝑃(𝑥) ∝ 𝑃 𝑐 𝑃(𝑥!|𝑐)!
!!!
Since 𝑃 𝑐 is constant for a given instance; the most probable a posteriori
assignment of the class variable is calculated as follows:
𝑐 = argmax!𝑃 𝑐 𝑃(𝑥!|𝑐)
!
!!!
It assumes that all domain variables are independent when the class value is
known. This assumption dramatically simplifies the exposed statistics, and only
univariate class-conditioned terms 𝑃 𝑋! 𝑐 are needed. Although this assumption is
violated in numerous occasions in real domains, the paradigm still performs well in
many situations.
Suppport vector machine (SVM) provides a binary classification
mechanism based on finding a dividing hyperplane between a set of samples with
positive and negative outputs. It assumes the data is linearly separable after
transformation. The problem can be structured as a quadratic programming
15 MATERIAL AND METHODS
optimization problem as maximizing the margin subjected to a set of linear
constraints (ie: data output on one side of the line must be positive while the other
side is negative). This can be solved by a quadratic programming technique.
If the data is not linearly separable due to noise (majority is still linearly
separable), then an error term will be added to penalize the optimization. If the data
distribution is fundamentally non-linear, the trick is to transform the data to a higher
dimension and hopefully the data is linearly separable in that higher dimension. The
optimization term turns out to be a dot product of the transformed points in the high
dimensional space, which was found to be equivalent to perform a kernel function
in the original (before transformation) space.
The kernel function provides a cheap way to equivalently transform the
original point to a high dimension (since we do not actually transform it) and
perform the quadratic optimization in that high dimension space. SVM with Kernel
function is a highly effective model and works well across a wide range of problem
sets. Although it was designed as a binary classifier, it can be easily extended to
multi-class classification by training a group of binary classifiers and using “one vs
all” or “one vs one” to predict. SVM predicts the output based on the distance to the
dividing hyperplane, which does not directly provide a probability estimation of its
prediction. SVM is a very powerful technique and perform good in a wide range of
non-linear classification problems. It works best when you have a small set of input
features because it will expand the features into higher dimension space, providing
that you also have a good size of training data (otherwise, overfit can happen).
Ensemble methods. Although the most common approach is to use a single
model for class prediction, the combination of classifiers with different biases is
gaining popularity in the machine learning community. As each classifier defines its
own decision surface to discriminate between problem classes, the combination
could construct a more flexible and accurate decision surface. While the first
approaches proposed in the literature were based on simple combinative models
(majority vote, unanimity vote), more complex approaches are now demonstrating
notable predictive accuracies. Among these we can cite the bagging, boosting,

16 MATERIAL AND METHODS
stacked generalization, random forest, or Bayesian combinative approaches. Due to
the negative effect of small sample sizes on bioinformatics problems, model
combination approaches are broadly used due to their ability to enhance the
robustness of the final classifier (also known as the meta-classifier). On the other
hand, the expressiveness and transparency of the induced final models are
diminished [20].
Model selection and evaluation
The estimation method used to evaluate the models was the k-fold cross-
validation method. This method involves partitioning the examples randomly into k
folds or partitions. One partition is used as a test set and the remaining partitions
form the training set. The process is repeated k times using each of the partitions as
the test set. For each classification algorithms we obtained the overall accuracy as
well as the accuracy for each tumor diagnosis. The performance results were finally
compiled with the mean and standard errors statistics. We further compared the
results obtained from the classification paradigms thought one-way ANOVA test to
determine which algorithms were most effective.
Additionally, the methods were also evaluated by the score-based ROC
statistics of Area Under the Curve (AUC). The AUC quantifies the probability that
a classifier will give a randomly drawn deleterious example a lower score than a
randomly drawn neutral example.
Feature subset selection
The designed feature set is composed of 39 descriptors. We performed
feature selection since some of these features could be irrelevant to the prediction
and characterization of astrocytoma molecular diagnosis. Feature selection methods
yield parsimonious models that reduce information cost, are easy to explain and
understand, and increase model applicability and robustness. We utilized a feature
selection of genetic biomarker based on the following methods:
ü Mutual information: in this work we considered the use of mutual
information to evaluate “information content” of each individual feature
17 MATERIAL AND METHODS
with regard to the output class [InfoGain(Class, feature) = H(Class) -
H(Class | feature)]
ü Mutual information ratio: A univariate filter algorithm that ranks the
predictive variables according to their Gain Ratio with the class label and
keeps the best 6 variables. [GainR(Class, feature) = (H(Class) - H(Class |
Attribute)) / H(feature)]
ü Correlation feature selection algorithms: this algorithm tries to find a subset
of predictive variables that is highly correlated with the class, but has low
intercorrelation between the predictive variables. It starts with an empty
subset and iteratively adds the variable that yields a subset with the highest
correlation value. The correlation measures the symmetric uncertainty of
each variable in the subset with the class (to maximize), and adjusts it to
take into account the symmetric uncertainty between the predictive variables
(to minimize). The symmetric uncertainty is a measure of correlation based
on the marginal entropies and the joint entropies between pairs of variables
[21].
The number of variables selected in mutual information algorithm was
performed under the criteria of χ2 distribution (p-value<0.001) and then compared
with the ranking features obtained Mutual Information Ratio algorithm; meanwhile,
the selection process using a CSF was also performed using internal k-fold cross-
validation scheme. The results obtained for each classification paradigms before
and after Feature Selection process was compared using unpaired t-test statistic.
Unsupervised classification
Unsupervised classification algorithms were applied in order to discover
groups that share similar genetic profiles within the dataset. Its starting point is a
training database formed by a set of N independent samples DN = (x1 , . . ., xN )
drawn from a joint and unknown probability distribution p(x, c). Each sample is
characterized by a group of d predictive variables or features {X1, ..., Xd} [22] and
18 MATERIAL AND METHODS
C is a hidden variable that represents the cluster membership of each instance. In
contrast to supervised classification, there is no label that denotes the class
membership of an instance, and no information is available about the annotation of
the database samples in the analysis. A key concept in clustering is the type of
distance measure that determines the similarity degree between samples. This will
dramatically influence the shape and configuration of the induced clusters, and its
election should be carefully studied. Usual distance functions are the Euclidean,
Manhattan, or Mahalanobis.
We used hierarchical clustering applying Manhattan distance for computing
similarity matrix between pairs of observations. The output of a hierarchical
clustering algorithm is a nested and hierarchical set of partitions/clusters
represented by a tree diagram or dendrogram, with individual samples at one end
(bottom) and a single cluster containing every element at the other (top).
Ward´s linkage clustering method was used to define the clusters. The ultimate
cluster results are obtained by slicing the dendrogram at a particular level. In our
case, this level is when only two cluster remain, attempting to find differences in
mortality or prognosis of patients.
Survival analysis
Survival curves were estimated by the Kaplan-Meier method and compared among
patient subsets using the log-rank test. Furthermore, associations between
genetic/clinical features and clusters identified previously were analysed using the
χ2 contingency test and the Fisher’s exact test when necessary (expected values
below 5).
19 RESULTS
4 RESULTS Characteristics of the patients included in the analysis
A total of 105 patients newly diagnosed with primary grade II to IV
astrocytomas were included in this study. The class to be predicted was low-grade
astrocytomas (24 patients) and high-grade astrocytomas (81 patients). The later
class included in the analysis was the final diagnosis of high-grade astrocytomas in
anaplastic astrocytomas (16 patients) and glioblastomas (65 patients). The median
age at diagnosis of patients was 57 years (range 14-79 years) and male to female
ratio was 1.6:1. Detailed clinicopathological characteristics of the patients were
summarized in Table 1. The data set comprised 39 features or molecular biomarkers
belonging to core pathways for astrocytoma pathogenesis.
Classification of astrocytoma diagnosis based on supervised machine learning
methods
We seek to classify the astrocytoma diagnosis in two steps procedure. First,
we differentiated between low-grade and high-grade astrocytomas; therefore we
merged AA and GBM into high-grade astrocytomas. Secondly, we tried to
distinguish between AA and GBM diagnosis. A representation of the performed
analysis was included in figure 3.

20 RESULTS
Table 1. Summary of clinicopathological characteristics of the patients.
Patients, No (%) LGA n=24
AA n=16
GBM n=65
Sex Male 14 (58.3%) 11 (68.8%) 40 (61.5%) Female 10 (41.7%) 5 (31.2%) 25 (38.5%) Median age, years [IQR] 35 [29.3-46.0] 55.0 [45.3-66.0] 64 [55.0-69.5] Tumor Localization Tumor Side Right 9 (37.5%) 9 (56.2%) 39 (60.0%) Left 12 (50.0%) 7 (43.8%) 24 (36.9%) Other 3 (12.5%) 0 (0.0%) 2 (3.1%) Tumor Region Temporal 9 (37.5%) 7 (43.8%) 26 (40.0%) Frontal 7 (29.2%) 6 (37.5%) 23 (35.4%) Parietal 3 (12.5%) 2 (12.5%) 6 (9.2%) Occipital 2 (8.3%) 1 (6.2%) 7 (10.8%) Other 3 (12.5%) 0 (0.0%) 3 (4.6%) Surgery Total resection 14 (58.3%) 10 (62.5%) 49 (75.4%) Subtotal resection 10 (41.7%) 6 (37.5%) 16 (246%) Treatment No treatment 12 (50.0%) 4 (25.0%) 6 (9.2%) Radiotherapy 7 (29.2%) 5 (31.2%) 44 (67.7%) Radiotherapy + Chemotherapy 5 (20.8%) 7 (43.8%) 15 (23.1%)
Median of survival, months [IC 95%]
98.9 [52.4-145.4] 14.0 [12.3-15.7] 11.0 [8.4-13.6]
LGA: low-grade astrocytoma; AA: anaplastic astrocytoma; GBM: glioblastoma.

21 RESULTS
Figure 3: Flowchart showing the classification performance of astrocytoma diagnosis. The first step aims to classify low-grade and high-grade astrocytomas, meanwhile the second step is focused on the classification of high grade astrocytomas (Anaplasic Astrocytomas and glioblastomas).
In both steps, feature selection techniques were applied in order to simplify
the classification task and to improve the accuracy of the methods. This rationally
lead to increase the accuracy of the classification compared to the classification
obtained with the three categories separately.
Classification of Low-grade and High-grade
We first explored the use of supervised algorithms to classify low-grade and
high-grade astrocytomas. Classification power of logistic regression, k-NN (k-star),
classification tree (J48), Naïve Bayes and support vector machine (SMO)
classification techniques as well as the two ensemble methods (Bagging and
Boosting) were tested in the astrocytoma dataset without any biomarker selection.
These methods were mainly evaluated by the percent of corrected classified and the
score-based independent ROC statistic of AUC. In our series, the classification
accuracy ranges from 78.09 % to 90.55%. The results indicated that Bagging
ensemble method was the classification paradigm that best classified astrocytoma

22 RESULTS
tumors in low-grade and high-grade categories. Although, no significant differences
were detected among the classifiers in terms of accuracy or AUC, Bagging method
reached to correctly classify the 90.55% of patients; meanwhile, Naïve-Bayes
showed the highest AUC 0.913 but only classify correctly 86.73% of patients
(Table 2A).
Choosing a robust and reliable set of relevant features is crucial in
classification analysis. Feature selection procedures were applied in order to
identify the most relevant genetic features and to reduce redundant information.
Given the initial set of 39 genetic biomarkers, we found the subset with k<n
features that were maximally informative about the diagnosis. Therefore, we studied
how to select features according to the maximal statistical dependency criterion
based on mutual information, mutual information ratio and correlation feature
selection in order to classify low-grade and high-grade astrocytomas. Results of
mutual information algorithm were summarized in Figure 4, showing that IDH1
mutation, ki67 expression and p63 expression seed information about the grade of
these heterogeneous tumors (p-value<0.001). Furthermore, IDH1 mutation, ki67
expression and p63 expression were also the three first ranked features based on
mutual information ratio. These results were also confirmed through correlation
feature selection method.

23 RESULTS
Figure 4. Scree-plot representing Mutual Information between grade of astrocytomas and the genetic markers use for the classification task. IDH1 mutation, ki67 expression and p63 expression were the three first variables ranked thought Mutual Information algorithm (p-value<0.001).
We further analysed the classification results obtained by supervised
classification algorithm after feature selection algorithms (Table 2B). The
classification power was also measured in terms of % accuracy and AUC using k-
fold cross-validation method. Unpaired t-test was applied to compare the
classification results obtained by supervised classification algorithms with feature
selection and non-feature selection approaches. The results suggested that the
supervised techniques improve their classification power when it was applied a
feature selection technique; however, a significant difference was only detected in
K-NN algorithm (p-value<0.05) (Table 2). K-NN was configured with k=5 after
trying some preliminary test, this configuration obtained better accuracy than k=1,
k=3 and k=7. In spite of K-NN being the simplest algorithm used to classify
atrocytomas, the results obtained are quite competitive with other approaches.
Interestingly, we found that the Bagging meta-classifier was also the supervised
classification paradigm that better classify the astrocytoma subtypes after feature
selection approach. This method reached to correctly classify 96 of the 105 patients
Mut
ual I
nfor
mat
ion
0.00
0.05
0.10
0.15
0.20
0.25
0.30
IDH1 m
utatio
n
ki67 e
xpres
sion
p63 e
xpres
sion
PTEN muta
tion
EGFR ampli
ficati
on
TP53 m
utatio
n
EGFRvIII e
xpres
sion
BCL2 rs
2279
115
p53 e
xpres
sion
MSH2 exp
ressio
n
PTEN loss
HDAC1 exp
ressio
n
VRK2 exp
ressio
n
XRCC1 rs2
5487 MSI
p16 e
xpres
sion
ERCC1 rs1
1615
ERCC2 rs1
3181
TP53 rs
1042
522
MDM2 rs2
2797
44
HDAC2 exp
ressio
n
BRAF muta
tion
MDM2 exp
ressio
n
PIK3C
A muta
tion
XRCC3 rs8
6153
9
VRK1 exp
ressio
n
MGMT meth
ylatio
n
MLH1 r
s180
0734
MLH1 e
xpres
sion
KRAS LCS6 r
s617
6437
0
APEX1 rs1
1304
09
Ikaros
expre
ssion
MSH6 exp
ressio
n
HDAC3 exp
ressio
n
MLH1 m
ethyla
tion
MSH6 meth
ylatio
n
MSH2 meth
ylatio
n
BAX rs46
4587
8
ERCC6 rs4
2530
79
24 RESULTS
(91.45%) included in the study using the selected IDH1 mutation, ki67 expression
and p63 expression features.
Classification of Anaplastic Astrocytomas and Glioblastomas
Once we classified astrocytomas in low-grade and high-grade categories
based on their genetic features, we further determined the final diagnosis of high-
grade astrocytomas (AA and GBM) using the same supervised algorithms and
genetic features. Naïve Bayes and Bagging classifiers were the methods that best
classify high-grade astrocytomas based on overall accuracy and AUC (Table 3).
However, none of these techniques were able to reach an accurate classification of
anaplastic astrocytoma category. It was performed feature selection techniques in
order to improve the results obtained. However, we did not detect any improvement
in terms of accuracy or AUC in any of the supervised methods (data not shown) and
the classifiers also yielded low accuracies in anaplastic astrocytomas diagnosis,
suggesting a similar molecular profile between AA and GBM diagnostic groups.
These results were not surprising since distinguishing both high-grade astrocytomas
subtypes is proved to be difficult for the experts and it has been described that both
tumor types share common genetic alterations.

25 RESULTS
Tab
le 2
. Cla
ssifi
catio
n pe
rfor
man
ce o
f low
-gra
de a
nd h
igh-
grad
e as
troc
ytom
as w
ithou
t fea
ture
sele
ctio
n an
d us
ing
feat
ure
sele
ctio
n ap
proa
ch.
L
R
K-N
N
CT
N
B
SMO
B
aggi
ng
Boo
stin
g A
) No
Feat
ure
Sele
ctio
n
Low
-gra
de
15/2
4 15
/24
14/2
4 14
/24
13/2
4 15
/24
17/2
4 H
igh-
grad
e 70
/81
68/8
1 77
/81
77/8
1 69
/81
80/8
1 77
/81
Ove
rall
accu
racy
(SD
) 81
(9.7
3)
79.2
7 (1
3.77
)*
86.7
3 (1
3.02
) 86
.73
(9.4
) 78
.09
(11.
74)
90.5
5 (9
.79)
89
.55
(14)
A
UC
0.
797
0.81
3 0.
691
0.91
3 0.
697
0.86
8 0.
905
B) F
eatu
re S
elec
tion
Lo
w-g
rade
17
/24
14/2
4 15
/24
15/2
4 14
/24
15/2
4 16
/24
Hig
h-gr
ade
77/8
1 81
/81
78/8
1 79
/81
77/8
1 81
/81
78/8
1 O
vera
ll ac
cura
cy (S
D)
89.4
5 (9
.81)
90
.55
(7.6
9) *
88
.55
(13.
52)
89.5
5 (9
.62)
86
.64
(13.
14)
91.4
5 (8
.26)
89
.45
(11.
86)
AU
C
0.87
9 0.
92
0.73
0 0.
906
0.76
7 0.
879
0.87
9 LR
: log
istic
regr
essi
on; K
-NN
: K-N
eare
st N
eigh
bor;
CT:
cla
ssifi
catio
n tre
e; N
B: N
aïve
Bay
es; S
MO
: sup
port
vect
or m
achi
ne
Tab
le 3
. Cla
ssifi
catio
n pe
rfor
man
ce o
f Ana
plas
ic A
stro
cyto
mas
and
Glio
blas
tom
as w
ithou
t fea
ture
sele
ctio
n ap
proa
ch.
L
R
K-N
N
DT
N
B
SMO
B
aggi
ng
Boo
stin
g A
A
7/16
3/
16
0/16
3/
16
6/16
7/
16
0/16
G
liobl
asto
ma
46/6
5 45
/65
59/6
5 56
/65
49/6
5 51
/65
60/6
5 O
vera
ll ac
cura
cy (S
D)
65.2
8 (1
8.63
) 59
.17
(8.7
4)
72.7
8 (2
2.72
) 72
.64
(13.
10)
67.7
8 (2
0.71
) 71
.6 (0
.54)
74
.03
(0.5
1)
AU
C
0.55
0 0.
521
0.37
3 0.
913
0.56
4 0.
549
0.46
4 LR
: log
istic
regr
essi
on; K
-NN
: K-N
eare
st N
eigh
bor;
DT:
cla
ssifi
catio
n tre
e; N
B: N
aïve
Bay
es; S
MO
: sup
port
vect
or m
achi
ne.
26 RESULTS
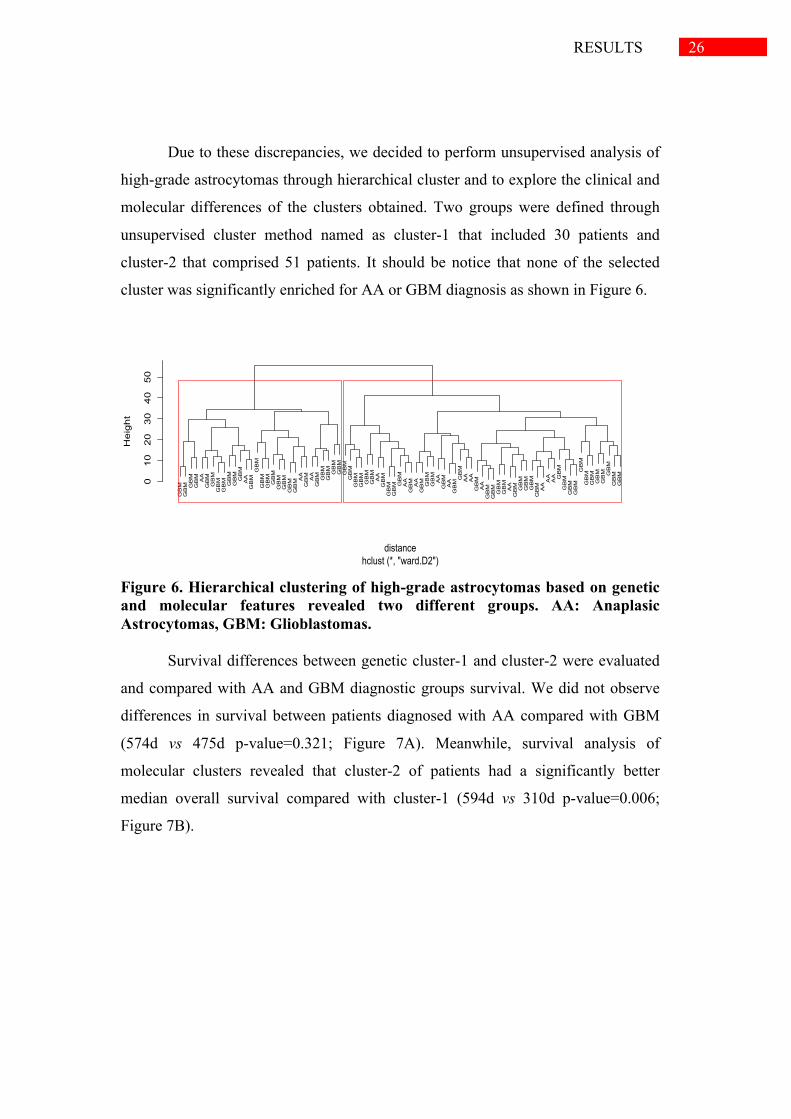
Due to these discrepancies, we decided to perform unsupervised analysis of
high-grade astrocytomas through hierarchical cluster and to explore the clinical and
molecular differences of the clusters obtained. Two groups were defined through
unsupervised cluster method named as cluster-1 that included 30 patients and
cluster-2 that comprised 51 patients. It should be notice that none of the selected
cluster was significantly enriched for AA or GBM diagnosis as shown in Figure 6.
Figure 6. Hierarchical clustering of high-grade astrocytomas based on genetic and molecular features revealed two different groups. AA: Anaplasic Astrocytomas, GBM: Glioblastomas.
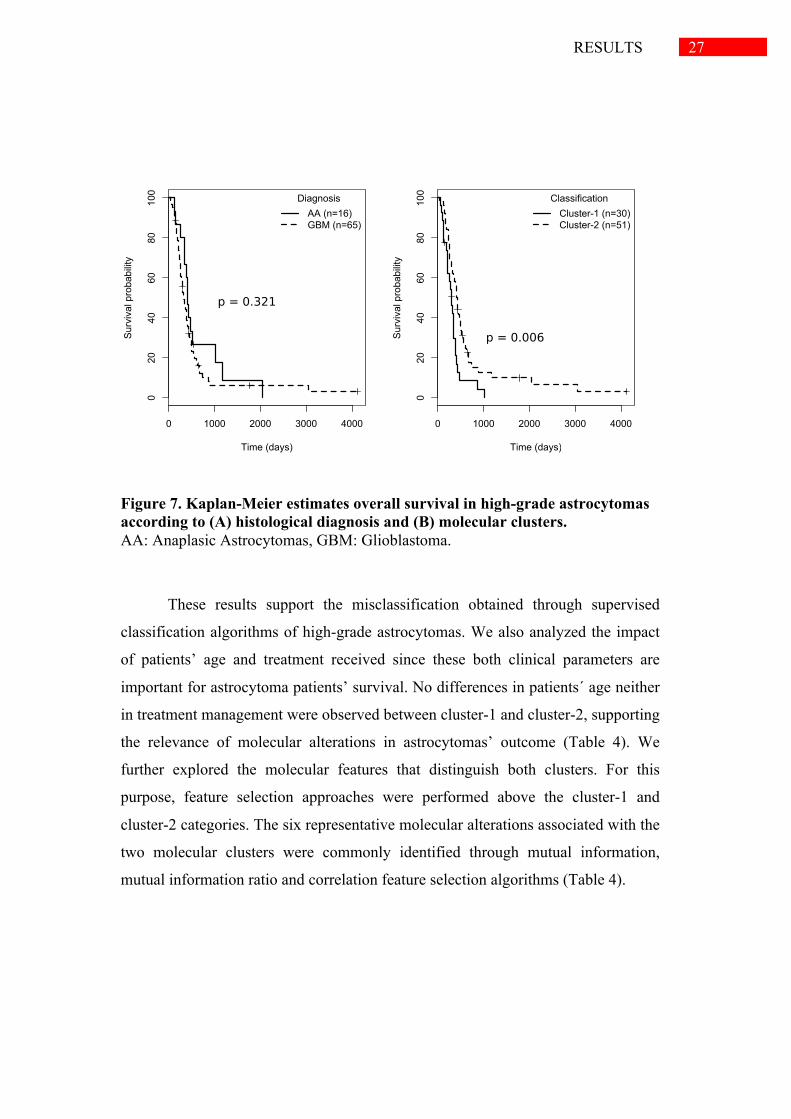
Survival differences between genetic cluster-1 and cluster-2 were evaluated
and compared with AA and GBM diagnostic groups survival. We did not observe
differences in survival between patients diagnosed with AA compared with GBM
(574d vs 475d p-value=0.321; Figure 7A). Meanwhile, survival analysis of
molecular clusters revealed that cluster-2 of patients had a significantly better
median overall survival compared with cluster-1 (594d vs 310d p-value=0.006;
Figure 7B).
GBM
GBM GBM
GBM AA
GBM
GBM
GBM
GBM GBM
GBMGBM
AA
GBMGBM
GBM
GBM
GBM
GBM
GBM
GBM
GBM AA
GBM AA
GBM GBM
GBM GBM
GBM
GBM
GBM
GBM
GBM
GBM
GBM
AA
GBM
GBM
GBM GBM
AA
GBM AA
GBM GBM
GBM
AA
GBM
AA
GBMGBM
AAAA
GBM
AA
GBM
GBM
GBM
GBM
AA
GBM GBM
GBM
GBM
GBM AAAAAA GBM
GBM
GBM
GBM
GBM
GBM
GBM
GBM
GBM GBM
GBM
GBM
01020304050
hclust (*, "ward.D2")distance
Height
27 RESULTS
Figure 7. Kaplan-Meier estimates overall survival in high-grade astrocytomas according to (A) histological diagnosis and (B) molecular clusters. AA: Anaplasic Astrocytomas, GBM: Glioblastoma.
These results support the misclassification obtained through supervised
classification algorithms of high-grade astrocytomas. We also analyzed the impact
of patients’ age and treatment received since these both clinical parameters are
important for astrocytoma patients’ survival. No differences in patients´ age neither
in treatment management were observed between cluster-1 and cluster-2, supporting
the relevance of molecular alterations in astrocytomas’ outcome (Table 4). We
further explored the molecular features that distinguish both clusters. For this
purpose, feature selection approaches were performed above the cluster-1 and
cluster-2 categories. The six representative molecular alterations associated with the
two molecular clusters were commonly identified through mutual information,
mutual information ratio and correlation feature selection algorithms (Table 4).
0 1000 2000 3000 4000
020
4060
8010
0
Time (days)
Sur
viva
l pro
babi
lity
DiagnosisAA (n=16)GBM (n=65)
0 1000 2000 3000 40000
2040
6080
100
Time (days)
Sur
viva
l pro
babi
lity
ClassificationCluster-1 (n=30)Cluster-2 (n=51)
p = 0.321
p = 0.006

28 RESULTS
Table 4. Clinical and genetic features of the two genetic clusters
Clinical features Cluster-1 (n=30) (bad-prognosis)
Cluster-2 (n=51) (good-prognosis) p-value
Diagnosis 0.266 AA 13.3% 23.5% GBM 86.7% 76.5% Median age, years [IQR] 62.0 [54.8-68.3] 65.0 [53.0-70.0] 0.932 Surgery 0.939 Total resection 73.3% 72.5% Subtotal resection 26.7% 27.5% Medical treatment 0.206 No treatment 20.0% 7.8% Radiotherapy 60.0% 60.8% Radiotherapy + Chemotherapy 20.0% 31.4%
ki67 expression <0.001 <5% 17.4% 37.0% 5-10% 8.7% 47.8% >10% 73.9% 15.2% MLH1 expression <0.001 positive 48.3% 96.1% negative 51.7% 3.9% MSH6 expression <0.001 positive 40.7% 82.0% negative 59.3% 18.0% HDAC3 expression <0.001 Positive 34.6% 80.0% negative 65.4% 20.0% VRK2 expression <0.001 Positive 17.9% 94.1% negative 82.1% 5.9% PTEN mutation <0.001 wild-type 51.7% 89.1% mutated 48.3% 10.9%
Thus, cluster 1 was characterized by poor survival, high ki67 expression,
loss of MLH1, MSH6, HDAC3 and VRK2 expression and mutations in PTEN gene;
whereas cluster 2 was distinguished by better prognosis, low levels of ki67, positive
expression of MLH1, MSH6, HDAC3 and VRK2 proteins and wild-type PTEN.

29 DISCUSSION
5 DISCUSSION
Malignant astrocytomas are one of the most devastating cancers with a
dismal prognosis. Virtually all astrocytomas progress and locally relapse regardless
of multi-modality treatment approach [5,23]. Treatment decisions and management
as well as the prognostic prediction of astrocytoma patients rely mainly on the
histological grade of the tumor, often combined with perceived clinical features
[1,5,23]. However, astrocytomas are highly heterogeneous tumors and the currently
used morphology-based grading system does not always adequately represent the
high heterogeneity of these tumors [6,24]. Therefore is a need for more accurate
methods of astrocytoma classification. Astrocytomas are characterized by an
infiltrating and aggressive behavior directly related to their genetic alterations in
core signaling pathways [1]. Recent large-scale genomic studies have revealed
different subclasses of gliomas with different molecular and/or clinical phenotypes
or responses to therapy, but most of them are mainly focused on glioblastomas and
relatively little has been done for the molecular classification of anaplastic
astrocytomas and low-grade astrocytomas [25-30]. Thus, identification of new
genetics biomarkers may contribute to a better classification of both low-grade and
high-grade astrocytomas and can guide clinical decision-making. The explanatory
variables used for all the analysis of this project comprised a range of factors
involved in astrocytomas pathogenesis related with key cellular processes including
cellular proliferation, survival, apoptosis, cellular damage and metabolism. They
include common alterations in TP53, EGFR-PI3K and Rb pathways, IDH1
mutations, alterations in DNA repair genes or epigenetic factors.
The first stage of the current study was to investigate whether genetic and
molecular alterations involved in tumor proliferation, survival, apoptosis,
metabolism and DNA repair were able to predict the histological classification of
astrocytomas using supervised algorithms. Despite the usefulness of data mining in
medical applications [16], there is no previous implementation of such machine
30 DISCUSSION
learning algorithms in the classification of malignant astrocytoma subtypes based
on genetic and molecular features.
Therefore, in this methodological study we have compared different
supervised classification methods used in machine learning to distinguish between
astrocytoma diagnoses based on their molecular alterations. Our results showed that
supervised classification is an effective approach for low-grade and high-grade
astrocytomas classification, with accuracy higher than 85% in all applied algorithms
using the three selected features: IDH1 mutation, ki67 expression and p63
expression. Thus, the preselection of the variables using feature selection techniques
enhance the performance of supervised methods. Models obtained using feature
selection methods are desirable, not only because a higher accuracy is achieved, but
also because more parsimonious and easily understood models are obtained.
Furthermore, we suggest Bagging meta-classifier as the optimal algorithm to
classify astrocytoma in low-grade and high-grade subtypes since it was able to
correctly classify 91.5% of tumors after feature selection procedures. Ensemble
methodology is an efficient technique that has increasingly been adopted to
combine multiple learning algorithms in order to improve overall prediction
accuracy [31]. In addition, ensemble techniques have the advantage to alleviate the
small sample size problem by averaging and incorporating over multiple
classification models to reduce the potential for overfitting the training data [32]
Therefore, our main finding is that the results obtained after applying feature
selection approach in combination with the classificatory paradigms emphasize the
importance of IDH1 mutation and proliferation status, determined by both ki67 and
p63 expression, to discriminate between low-grade and high-grade tumors. In
keeping with previous data reported by the literature, IDH1 mutation and ki67
expression are highly associated with the grade of malignance of astrocytomas
[33,34]. IDH1 is a NADP+-dependent isocitrate dehydrogenase involved in cellular
metabolism. Mutations in IDH1 gene are one of the most frequent alterations in
low-grade astrocytomas and have been described as an early event in the
pathogenesis of these tumors. [28,34]. Regarding Ki67, its expression is a marker of
mitotic activity and cellular proliferation but its precise function is still unclear [33].

31 DISCUSSION
Ki67 expression is among the WHO criteria established for the grading of
malignant astrocytomas [3]. Interestingly, our results suggest for the first time the
role of the expression of p63 in astrocytoma classification. P63 is a p53 family
member with different functions in controlling cell proliferation, maintenance,
differentiation and apoptosis [35]. Its expression has been associated with more
aggressive tumours and poor prognosis in breast or lung cancer [35,36]. These three
features, IDH1 mutation, ki67 and p63 expression, along with the classical WHO
histological criteria [3] could help in the first step of diagnostic classification
between low-grade and high-grade astrocytomas.
Next, we attempted to deep in high-grade astrocytoma classification and to
discriminate between anaplastic astrocytomas and glioblastomas using supervised
algorithms based on common alterations in core signaling pathways. In this case, no
more than 70% of diagnostic accuracy was obtained regardless the use of feature
selection techniques and, furthermore, more than 50% of anaplastic astrocytomas
were misclassify. It should remark that pathology data presents special challenges
for researchers, including data imbalance for particular responses or predictors, and
high individual patient data variation that makes patter recognition and rule
detection difficult. In addition, the resources and time required for collecting and
genotyping specimens limit the number of samples in each class, particularly in
Anaplasic Astrocytoma. This limitation makes statistical inference very difficult to
carry out. From a clinical point of view, a potential explanation for misclassification
results may be that some anaplastic astrocytomas were actually glioblastomas and
that the histological specimen had not reflected the true nature of the tumor. Indeed,
it is often difficult and subjected to a large interobserver variability to distinguish
anaplastic astrocytomas from glioblastoma based on the presence of necrosis and/or
microvascular proliferation due to high-grade astrocytomas’ intratumoral variability
[3,37]. In addition, in the sequential progression from anaplastic astrocytoma to
glioblastoma, anaplastic astrocytoma could rapidly acquire characteristic
glioblastoma genetic alterations lacking some histological glioblastoma
characteristics like extensive endothelial cell proliferation [37,38]. Several studies
32 DISCUSSION
support the hypothesis that anaplastic astrocytomas and glioblastomas represent a
mix of molecular and genetic subtypes [24,29,39,40].
In our study, the hierarchical clustering of high-grade astrocytomas based on
the molecular alterations of the tumors was included in order to gather information
about the tumor biology or prognosis. This performance could be useful when
comparing similar phenotypic diagnosis do not seed light about the prognosis of
tumor. In fact, the results obtained through cluster analysis revealed two clearly
different clusters with different prognosis that are different from histological
subgroups. Importantly, no differences on age or clinical management were
detected between the clusters defined. In fact, the molecular classification obtained
predicts better the outcome of high-grade astrocytomas than the histological
classification since we did not find significant differences in survival between
anaplastic astrocytomas and glioblastomas in our series. Although glioblastoma is
associated with uniform poor survival rates, a small but discrete subgroup of long-
term survivors exists [3,41] and, furthermore, the clinical outcome of anaplastic
astrocytoma varies widely, ranging from rapid progression to prolonged survival
[42], indicating that diagnostic groups do not fully predict the variations in
astrocytoma disease outcome.
One of the challenges of astrocytoma research is to identify molecular
factors that predict clinical outcome. Six specific molecular alterations were
significantly associated with the two clusters, ki67, MLH1, MSH6, HDAC3 and
VRK2 expression and PTEN mutations, indicating a high prognostic potential for
these molecular classifiers. These alterations are mainly involved in tumor
proliferation, DNA repair and epigenetic mechanisms. Several of these alterations
were previously found to be individually associated with astrocytoma prognosis. As
mention before, ki67 is a marker of proliferation related with increasing grade of
malignance and prognosis [33]. PTEN is a tumor suppressor gene involved in the
regulation of several cellular processes including cell cycle control, cellular
survival, angiogenesis or cellular metabolism [43]. PTEN gene is frequently
inactivated in high-grade astrocytomas and has been widely associated with more
33 DISCUSSION
aggressive tumors and reduced survival of these patients [44,45]. VRK2 is a
member of a subfamily of serine-threonine kinases involved in the regulation of
several signal transduction pathways in the context of cancer biology [46]. VRK2
expression has been correlated with a proliferative phenotype in head and neck
squamous cell carcinomas and astrocytomas [11,47]. Furthermore, VRK2
expression has recently been associated with better survival in breast cancer and
high-grade astrocytomas that could be explain by the role of VRK2 in the
modulation of mitogenic, stress or apoptosis signaling [11,48]. Interestingly, loss of
expression of two mismatch repair proteins, MLH1 and MSH6, were found to be
associated with poor prognosis in our series, suggesting an important role of this
cellular pathway in astrocytoma biology. Mismatch repair system maintains DNA
stability by repairing errors acquired during DNA replication, and its defective
function is mainly associated with the development of colorectal and endometrial
carcinomas [49,50]. In astrocytomas, loss of MSH6 function confers resistance to
alkylating agents and it has been associated with tumor growth and progression
[51,52]. Although less is known about the role of MLH1 in astrocytomas, its
expression have been linked to therapy response and tumor recurrence [53,54].
Finally, HDAC3 is involved in the control of gene expression through histone
deacetylation. Its expression has been inversely associated with tumor grade and
decreased expression of HDAC3 was correlated with unfavorable patient outcome
[55].
To sum up, our results suggest that supervised classification using IDH1 mutation,
ki67 expression and p63 expression could be a complementary approach to
histological classification of astrocytomas in low-grade and high-grade tumors.
Furthermore, unsupervised classification of high-grade astrocytomas using the
above 6-markers signature related to cell proliferation, DNA repair and histone
deacetylation predicts better their outcome than histological criteria. This finding
provides supporting evidence that genetic-based classification is a more accurate
method to classify high-grade astrocytomas. These six markers could be used as
prognostic factors of high-grade astrocytomas and might seed light in the clinical
management and treatment approach of these patients. Nonetheless, further studies

34 DISCUSSION
in larger series of patients are necessary to confirm our observations and the
external validation would be crucial in future investigations.

35 CONCLUSIONS
6 CONCLUSIONS
1) Our results suggest that supervised classification methods using molecular
information could be a complementary approach to histological
classification of astrocytomas in low-grade and high-grade tumors.
2) Feature selection techniques reveals the importance of IDH1 mutation, ki67
expression and p63 expression in the classification of low-grade and high-
grade astrocytomas
3) Unsupervised classification of high-grade astrocytomas based on
hierarchical clustering methods predicts better their outcome than
histological criteria. Suggesting that unsupervised classification methods as
suitable methodology to gather information about the tumor biology or
prognosis
4) Six molecular markers signature of ki67, MLH1, MSH6, HDAC3 and
VRK2 expression and PTEN mutations related to cell proliferation, DNA
repair and histone deacetylation could be used as prognostic factors of high-
grade astrocytomas and might seed light in the clinical management and
treatment approach of these patients.
36 REFERENCES
7 REFERENCES
1. Ricard D, Idbaih A, Ducray F, Lahutte M, Hoang-Xuan K, et al. (2012) Primary brain
tumours in adults. Lancet 379: 1984-1996.
2. Wen PY, Kesari S (2008) Malignant gliomas in adults. N Engl J Med 359: 492-507.
3. Louis DN, Ohgaki H, Wiestler OD, Cavenee WK, Burger PC, et al. (2007) The 2007
WHO classification of tumours of the central nervous system. Acta Neuropathol
114: 97-109.
4. Ohgaki H, Kleihues P (2009) Genetic alterations and signaling pathways in the
evolution of gliomas. Cancer Sci 100: 2235-2241.
5. Stupp R, Hegi ME, Mason WP, van den Bent MJ, Taphoorn MJ, et al. (2009) Effects
of radiotherapy with concomitant and adjuvant temozolomide versus
radiotherapy alone on survival in glioblastoma in a randomised phase III study:
5-year analysis of the EORTC-NCIC trial. Lancet Oncol 10: 459-466.
6. Furnari FB, Fenton T, Bachoo RM, Mukasa A, Stommel JM, et al. (2007) Malignant
astrocytic glioma: genetics, biology, and paths to treatment. Genes Dev 21:
2683-2710.
7. Gomez-Sanchez JC, Delgado-Esteban M, Rodriguez-Hernandez I, Sobrino T, Perez
de la Ossa N, et al. (2011) The human Tp53 Arg72Pro polymorphism explains
different functional prognosis in stroke. J Exp Med 208: 429-437.
8. Pastor-Idoate S, Rodriguez-Hernandez I, Rojas J, Fernandez I, Garcia-Gutierrez MT,
et al. (2013) The T309G MDM2 gene polymorphism is a novel risk factor for
proliferative vitreoretinopathy. PLoS One 8: e82283.
9. Rodriguez-Hernandez I, Perdomo S, Santos-Briz A, Garcia JL, Gomez-Moreta JA, et
al. (2014) Analysis of DNA repair gene polymorphisms in glioblastoma. Gene
536: 79-83.
10. Rodriguez-Hernandez I, Garcia JL, Santos-Briz A, Hernandez-Lain A, Gonzalez-
Valero JM, et al. (2013) Integrated analysis of mismatch repair system in
malignant astrocytomas. PLoS One 8: e76401.

37 REFERENCES
11. Rodriguez-Hernandez I, Vazquez-Cedeira M, Santos-Briz A, Garcia JL, Fernandez
IF, et al. (2013) VRK2 identifies a subgroup of primary high-grade astrocytomas
with a better prognosis. BMC Clin Pathol 13: 23.
12. Mellinghoff IK, Wang MY, Vivanco I, Haas-Kogan DA, Zhu S, et al. (2005)
Molecular determinants of the response of glioblastomas to EGFR kinase
inhibitors. N Engl J Med 353: 2012-2024.
13. Garcia JL, Perez-Caro M, Gomez-Moreta JA, Gonzalez F, Ortiz J, et al. (2010)
Molecular analysis of ex-vivo CD133+ GBM cells revealed a common invasive
and angiogenic profile but different proliferative signatures among high grade
gliomas. BMC Cancer 10: 454.
14. Valbuena A, Lopez-Sanchez I, Vega FM, Sevilla A, Sanz-Garcia M, et al. (2007)
Identification of a dominant epitope in human vaccinia-related kinase 1 (VRK1)
and detection of different intracellular subpopulations. Arch Biochem Biophys
465: 219-226.
15. Blanco S, Klimcakova L, Vega FM, Lazo PA (2006) The subcellular localization of
vaccinia-related kinase-2 (VRK2) isoforms determines their different effect on
p53 stability in tumour cell lines. Febs J 273: 2487-2504.
16. Larranaga P, Calvo B, Santana R, Bielza C, Galdiano J, et al. (2006) Machine
learning in bioinformatics. Brief Bioinform 7: 86-112.
17. Aha DW, Kibler, D., Albert, M.K. (1991) Instance-based learning algorithms.
Machine Learning 6.
18. JR Q (1993) C4.5: Programs for Machine Learning.; kaufmann SFM, editor.
19. 1961 M (1961) Steps toward artficial intelligence. Proceedings of the Institute of
Radio Engineers 49.
20. K.W.DeBock KC, and D.VandenPoel (2010) Ensemble classification based on
generalized additive models. Computational Statistics and Data Analysis 54:
1535-1546.
21. Hall M (1999) Correlation-based Feature selection for Machine Learning.
22. Osareh A, Shadgar B (2013) An efficient ensemble learning method for gene
microarray classification. Biomed Res Int 2013: 478410.
23. Wehming FM, Wiese B, Nakamura M, Bremer M, Karstens JH, et al. (2012)
Malignant glioma grade 3 and 4: how relevant is timing of radiotherapy? Clin
Neurol Neurosurg 114: 617-621.
38 REFERENCES
24. Gravendeel LA, Kouwenhoven MC, Gevaert O, de Rooi JJ, Stubbs AP, et al. (2009)
Intrinsic gene expression profiles of gliomas are a better predictor of survival
than histology. Cancer Res 69: 9065-9072.
25. Killela PJ, Pirozzi CJ, Reitman ZJ, Jones S, Rasheed BA, et al. (2014) The genetic
landscape of anaplastic astrocytoma. Oncotarget 5: 1452-1457.
26. (2008) Comprehensive genomic characterization defines human glioblastoma genes
and core pathways. Nature 455: 1061-1068.
27. Brennan CW, Verhaak RG, McKenna A, Campos B, Noushmehr H, et al. (2013)
The somatic genomic landscape of glioblastoma. Cell 155: 462-477.
28. Parsons DW, Jones S, Zhang X, Lin JC, Leary RJ, et al. (2008) An integrated
genomic analysis of human glioblastoma multiforme. Science 321: 1807-1812.
29. Phillips HS, Kharbanda S, Chen R, Forrest WF, Soriano RH, et al. (2006) Molecular
subclasses of high-grade glioma predict prognosis, delineate a pattern of disease
progression, and resemble stages in neurogenesis. Cancer Cell 9: 157-173.
30. Verhaak RG, Hoadley KA, Purdom E, Wang V, Qi Y, et al. (2010) Integrated
genomic analysis identifies clinically relevant subtypes of glioblastoma
characterized by abnormalities in PDGFRA, IDH1, EGFR, and NF1. Cancer
Cell 17: 98-110.
31. Dietterich T (2000) Ensemble methods in machine learning. Proceedings of the
Multiple Classifier System Conference: 1-15.
32. Dietterich TG (2000) An experimental comparison of three meth- ods for
constructing ensembles of decision trees: bagging, boosting, and randomization.
Machine Learning 40: 139-157.
33. Johannessen AL, Torp SH (2006) The clinical value of Ki-67/MIB-1 labeling index
in human astrocytomas. Pathol Oncol Res 12: 143-147.
34. Yan H, Parsons DW, Jin G, McLendon R, Rasheed BA, et al. (2009) IDH1 and
IDH2 mutations in gliomas. N Engl J Med 360: 765-773.
35. Graziano V, De Laurenzi V (2011) Role of p63 in cancer development. Biochim
Biophys Acta 1816: 57-66.
36. Petitjean A, Hainaut P, Caron de Fromentel C (2006) TP63 gene in stress response
and carcinogenesis: a broader role than expected. Bull Cancer 93: E126-135.
37. Ohgaki H, Kleihues P (2007) Genetic pathways to primary and secondary
glioblastoma. Am J Pathol 170: 1445-1453.
39 REFERENCES
38. Sonoda Y, Ozawa T, Aldape KD, Deen DF, Berger MS, et al. (2001) Akt pathway
activation converts anaplastic astrocytoma to glioblastoma multiforme in a
human astrocyte model of glioma. Cancer Res 61: 6674-6678.
39. Nutt CL, Mani DR, Betensky RA, Tamayo P, Cairncross JG, et al. (2003) Gene
expression-based classification of malignant gliomas correlates better with
survival than histological classification. Cancer Res 63: 1602-1607.
40. Freije WA, Castro-Vargas FE, Fang Z, Horvath S, Cloughesy T, et al. (2004) Gene
expression profiling of gliomas strongly predicts survival. Cancer Res 64: 6503-
6510.
41. Burger PC, Scheithauer BW, Vogel FS (2002) The brain tumors. Surgical pathology
of the central nervous system and its coverings. 4th ed: New York: Churchill
Livingstone. pp. 180–198.
42. Tortosa A, Vinolas N, Villa S, Verger E, Gil JM, et al. (2003) Prognostic
implication of clinical, radiologic, and pathologic features in patients with
anaplastic gliomas. Cancer 97: 1063-1071.
43. Song MS, Salmena L, Pandolfi PP (2012) The functions and regulation of the PTEN
tumour suppressor. Nat Rev Mol Cell Biol 13: 283-296.
44. Smith JS, Tachibana I, Passe SM, Huntley BK, Borell TJ, et al. (2001) PTEN
mutation, EGFR amplification, and outcome in patients with anaplastic
astrocytoma and glioblastoma multiforme. J Natl Cancer Inst 93: 1246-1256.
45. Xiao WZ, Han DH, Wang F, Wang YQ, Zhu YH, et al. (2014) Relationships
between PTEN gene mutations and prognosis in glioma: a meta-analysis.
Tumour Biol 35: 6687-6693.
46. Valbuena A, Sanz-Garcia M, Lopez-Sanchez I, Vega FM, Lazo PA (2011) Roles of
VRK1 as a new player in the control of biological processes required for cell
division. Cell Signal 23: 1267-1272.
47. Santos CR, Rodriguez-Pinilla M, Vega FM, Rodriguez-Peralto JL, Blanco S, et al.
(2006) VRK1 signaling pathway in the context of the proliferation phenotype in
head and neck squamous cell carcinoma. Mol Cancer Res 4: 177-185.
48. Fernandez IF, Blanco S, Lozano J, Lazo PA (2010) VRK2 inhibits mitogen-
activated protein kinase signaling and inversely correlates with ErbB2 in human
breast cancer. Mol Cell Biol 30: 4687-4697.

40 REFERENCES
49. Lynch HT, Lynch PM, Lanspa SJ, Snyder CL, Lynch JF, et al. (2009) Review of the
Lynch syndrome: history, molecular genetics, screening, differential diagnosis,
and medicolegal ramifications. Clin Genet 76: 1-18.
50. Koornstra JJ, Mourits MJ, Sijmons RH, Leliveld AM, Hollema H, et al. (2009)
Management of extracolonic tumours in patients with Lynch syndrome. Lancet
Oncol 10: 400-408.
51. Hunter C, Smith R, Cahill DP, Stephens P, Stevens C, et al. (2006) A hypermutation
phenotype and somatic MSH6 mutations in recurrent human malignant gliomas
after alkylator chemotherapy. Cancer Res 66: 3987-3991.
52. Yip S, Miao J, Cahill DP, Iafrate AJ, Aldape K, et al. (2009) MSH6 mutations arise
in glioblastomas during temozolomide therapy and mediate temozolomide
resistance. Clin Cancer Res 15: 4622-4629.
53. Friedman HS, McLendon RE, Kerby T, Dugan M, Bigner SH, et al. (1998) DNA
mismatch repair and O6-alkylguanine-DNA alkyltransferase analysis and
response to Temodal in newly diagnosed malignant glioma. J Clin Oncol 16:
3851-3857.
54. Gomori E, Pal J, Meszaros I, Doczi T, Matolcsy A (2007) Epigenetic inactivation of
the hMLH1 gene in progression of gliomas. Diagn Mol Pathol 16: 104-107.
55. Campos B, Bermejo JL, Han L, Felsberg J, Ahmadi R, et al. (2011) Expression of
nuclear receptor corepressors and class I histone deacetylases in astrocytic
gliomas. Cancer Sci 102: 387-392.