Embed Size (px)
Citation preview

Class Size Reduction,Teacher Quality, and AcademicAchievement inCalifornia PublicElementary Schools
• • •
Christopher JepsenSteven Rivkin
2002
PUBLIC POLICY INSTITUTE OF CALIFORNIA
Library of Congress Cataloging-in-Publication DataJepsen, Christopher.
Class size reduction, teacher quality, and academic achievement in California public elementary schools / Christopher Jepsen, Steven Rivkin.
p. cm.Includes bibliographical references.ISBN: 1-58213-058-2
1. Class size—California. 2. Elementary school teachers—Training of—California. 3. Academic achievement—California. I.Rivkin, Steven G. (Steven Gary), 1961– II. Title.
LB3013.2 .J47 2002371.2'51—dc21 2002069687
Research publications reflect the views of the authors and do notnecessarily reflect the views of the staff, officers, or Board ofDirectors of the Public Policy Institute of California.
Copyright © 2002 by Public Policy Institute of CaliforniaAll rights reservedSan Francisco, CA
Short sections of text, not to exceed three paragraphs, may be quotedwithout written permission provided that full attribution is given tothe source and the above copyright notice is included.
iii
Foreword
Intuitively, class size reduction is a good idea. Parents support itbecause it means that their children will receive more individualattention from teachers. Teachers like it for the same reason and alsobecause it creates a more manageable workload. It is generally assumedthat the fewer students in a class, the better they will learn and the higherthey will score on nationwide tests—currently one of the most commonmeasures of student achievement.
Nevertheless, several things could go wrong with mandated class sizereduction (CSR). This report presents evidence that the potential successor failure of such a reform may depend largely on how it is implementedand how teachers and administrators respond. If it is implementedquickly on a large scale, such a program may run into serious problems.In the following pages, Christopher Jepsen and Steven Rivkin analyzesome of the things that went right and some that did not after Californiapassed its CSR law in 1996.
One problem was the sweeping nature of the legislation, whichcalled for a one-third reduction in class size for kindergarten throughthird grade in every public elementary school in the state. This resultedin an immediate need for thousands of new teachers. But where werethey to come from? And what qualifications would they have? In 1997,the first year after the schools had scrambled to hire new teachers, nearlyone-quarter of the teaching workforce in California had one year ofexperience or less.
The authors also point to a more serious problem. Many teachers ineconomically disadvantaged communities left their schools to fillvacancies created in other schools. Thus, many schools had to fill notonly the positions created by their own efforts to reduce class size butalso positions vacated by departing teachers.
The analysis reveals that the effects of class size reduction extendedbeyond the third grade, leading to lower achievement in the fifth grade
iv
among schools with a high percentage of black students. Evidently,many fourth- and fifth-grade teachers chose to move to the earlier gradeswith fewer students, leaving many schools with the need to hire newteachers in other grades as well as K–3. In fact, the analysis indicates thatschools that had trouble hiring experienced teachers before CSR are thevery schools that did not appear to benefit from CSR.
On the positive side, the authors find that, all else equal, smallerclasses raise student achievement. Reducing class size by 10 studentsraises the percentage of third-grade students who exceed national mediantest scores by about 4 percentage points in mathematics and 3 percentagepoints in reading. However, all else is not equal when you hirethousands of new teachers. Separating out the effects of new teachersfrom the effects of smaller classes, Jepsen and Rivkin find that having anew teacher reduces the percentage of students who exceed the nationalmedian by roughly 3 percentage points in both mathematics and reading.So in many schools, class size reduction has meant zero gain, at least inthe short run.
The bottom line is that California has implemented a $1.6-billion-a-year program that is apparently yielding only modest gains. It alsoappears that some students and schools have actually been hurt ratherthan helped by class size reduction.
And now the cost of the reform is becoming a problem itself.California implemented CSR during prosperous times, when it had astrong budget surplus. The state also picked up most of the cost. Today,California is suffering from a $20 billion shortfall, and school districtsfind themselves shouldering more of the fiscal burden. Faced withdifficulty in meeting essential costs, such as teacher salaries, maintenance,and materials for the classroom, some districts are choosing to leave theprogram, preferring larger classes to cutbacks in other areas.
CSR does not appear to have been the silver bullet many expected itto be. If it remains in place, one obvious policy response at this pointwould be to help beginning teachers adapt to the classroom more quicklyand effectively and gain the essential training they need. An ongoingconcern that also needs to be addressed is the large disparity acrossschools in teacher qualifications and student achievement. There issufficient evidence to suggest that improving the quality of the teaching

v
staff in any school will go a long way toward improving studentachievement.
According to the authors, another lesson that other states might learnfrom the California experience is this: “A better approach to class sizereduction would have been to reduce class sizes in a subset of schoolseach year, starting with low-performing schools serving high-povertypopulations. This would have limited the departure of teachers for newlycreated jobs in suburban schools, lessened the overall competition fornew teachers, and reduced inequality in academic performance.”
No single reform will improve California’s K–12 system. As we havelearned from the class size reduction program, unintended consequencescan offset gains as well as create whole new problems. Much can belearned, however, from incremental policy changes for a limited numberof school districts before scaling up to statewide implementation. Thereis much still to be done, and the lessons from CSR will make the nextsteps more informed.
David W. LyonPresident and CEOPublic Policy Institute of California

vii
Summary
In response to widespread dissatisfaction with the public schools,California has implemented a number of educational reforms over thepast decade. Perhaps the most dramatic, and certainly the most costly,was the passage of the class size reduction (CSR) law in the summer of1996. This legislation aimed to reduce average class size in gradeskindergarten through third grade by roughly one-third, from 30 studentsto 20, at an annual cost of over $1 billion.
Educators and policymakers were hopeful that the gains attributed tosmaller class sizes in an experiment conducted in Tennessee wouldtranslate into large gains in achievement following California’s statewideclass size reduction. However, the hiring of large numbers ofinexperienced teachers in response to CSR had the potential to offset thedirect benefits of smaller classes, particularly for schools in economicallydisadvantaged communities that had extreme staffing difficulties beforeclass size reduction.
Because test scores before CSR are not available for most schools, thetotal effect of CSR will never be known. However, this report attemptsto provide some limited but very important answers to the followingquestions:
1. What were the effects of CSR on teacher experience, certification,and education? Were some schools affected more than others?
2. How did CSR affect student achievement in third grade? Whatwere the benefits of smaller classes? What were the effects ofnew teachers?
3. Are the benefits of smaller classes concentrated among a subsetof students, or did all schools benefit equally from CSR? Forexample, many researchers find that low-income and nonwhitestudents benefit more from smaller classes than do otherstudents.
viii
Student DiversityImmigration and other factors led to substantial demographic
changes in California public elementary schools during the 1990s. Nosingle ethnic group constitutes a majority of students: However,Hispanics are the most populous group. At the same time, largepercentages of students are attending schools where more than half thestudent population is enrolled in free or reduced-price (i.e., subsidized)lunch programs. There are substantial differences across the state in thedistribution of students by race/ethnicity and by the percentage enrolledin subsidized lunch programs. For example, urban schools have higherpercentages of nonwhite students and low-income students than dosuburban or rural schools. Such differences in demographiccomposition, even among the largest districts in the state, raise thepossibility that CSR may have had dramatically different effects acrossthe state, depending largely on the strength of the relationship betweenteacher characteristics and student demographic composition.
Teacher CharacteristicsNumerous reports have documented the change in teacher
characteristics following the implementation of CSR. Although ourdescription of California elementary school teachers covers much of thesame ground as earlier work, there are several key additions. First, ratherthan combining all teachers with less than three years of experience into asingle category, we create separate categories for first- and second-yearteachers and group all remaining teachers with at least two years ofexperience into a single category. Second, earlier studies examineddifferences in teacher characteristics by community type, studentracial/ethnic composition, or student income, but they did not considerthe distribution of teacher characteristics for combinations of thesefactors. As the distribution of students within each subsidized lunchcategory (0 to 25 percent, 25 to 50 percent, 50 to 75 percent, 75 to 100percent) differs by race, the distribution of teacher characteristics likelydiffers as well. However, these teacher differences would be overlooked ifone were focusing solely on either race/ethnicity or income categories.
ix
CSR led to a dramatic increase in the percentages of inexperiencedand uncertified teachers. In 1990, there were few differences in thesecharacteristics by racial/ethnic and income groups. Even as late as 1995–1996, the year before CSR, schools with high percentages of nonwhiteand low-income students were slightly more likely than other schools tohave inexperienced teachers who lacked full certification andpostgraduate schooling. By 1999, large gaps in teacher qualificationsemerged between schools attended by nonwhite and low-incomestudents compared with other schools. For black students in schoolswith more than 75 percent of the students enrolled in subsidized lunchprograms, nearly 25 percent had a first- or second-year teacher; almost30 percent had a teacher who was not fully certified. At the otherextreme, for white students attending schools with 25 percent or less ofthe students enrolled in subsidized lunch programs, only 12 percent hada first- or second-year teacher, and only 5 percent had a teacher who wasnot fully credentialed. These differences reflect the varying level ofdifficulty that many schools experienced in attempting to attract andretain teachers following the implementation of CSR.
Student AchievementEvaluating the effect of CSR on student achievement is challenging
for a number of reasons. First and probably most important, there areno statewide test scores in the years immediately preceding theimplementation of CSR. Statewide tests began in 1997–1998, thesecond year of CSR. Thus, although much can be learned about thecosts and benefits of CSR, its total effect on achievement will never beknown.
Second, not all schools were able to participate in the programimmediately, probably because of shortages of space and qualifiedteachers. Because participating schools had to reduce class size in firstand second grade before reducing class size in other grades, adoption ofCSR in the first and second grades was nearly complete by 1997–1998.Therefore, it is nearly impossible to compare achievement in 1997–1998of schools that implemented CSR in these grades with ones that had notimplemented CSR. However, nearly one-third of the schools had notimplemented CSR in third grade as of 1997–1998. Consequently, it is
x
possible to compare achievement in schools that reduced class sizes inthird grade to achievement in those that had not.
The decision to implement CSR is not random but is based onfinancial or space constraints or a lack of qualified teachers. Thesefactors also affect student achievement, making it extremely difficult toseparate the effects of these constraints from the effects of CSR. Thestate-supported CSR Research Consortium has attempted to control forthese differences between schools, but it is not clear that the consortiumcompletely controlled for these between-school differences in its analysisof achievement.
Rather than looking at changes between schools, our analysisexamines changes within schools in average class size in third gradebetween 1997–1998 and 1999–2000. We measure the effects of thesechanges, along with changes in teacher characteristics, on third-grademathematics and reading achievement in California. This techniqueallows us to consider two effects of class size reduction on studentachievement: the effects from the reduction in class size and the effectsfrom the change in the teacher force. One main finding of Tennessee’sStudent/Teacher Achievement Ratio (STAR) experiment was that, allelse equal, smaller classes are associated with higher achievement. InCalifornia, though, all else was not equal. As noted above, there weredramatic changes in teacher characteristics following the reduction ofaverage class size, particularly for nonwhite students. This increase in thenumber of inexperienced and not fully certified teachers is to be expectedwhen hiring a large number of new teachers. The effects of theseincreases should disappear as these new teachers acquire experience andfull certification.
However, CSR likely had a more profound effect on the teacherworkforce than simply increasing the number of inexperienced anduncertified teachers. Thousands of additional teaching positions werecreated, but thousands of additional teachers were not. Therefore, muchof the increase in teachers consists of individuals who would not havebeen hired as teachers in the absence of CSR, especially given theavailability of jobs with better pay and working conditions. If theseteachers continue to be of lower quality than other teachers even after
xi
they have acquired additional experience, certification, or education, thenCSR has the potential to create a long-term reduction in teacher quality.
The analysis shows that a ten-student reduction in class size (theaverage under CSR) raises the percentage of third-grade students whoexceed the national median test score by roughly 4 percentage points inmathematics and 3 percentage points in reading. These findings areslightly larger than the effects found by the consortium in its analyses.Unlike the consortium, we find substantial variation by school in CSR’seffect on achievement. Schools with more low-income students likelyreceive larger benefits, whereas schools in rural areas and those in which ahigh proportion of the students are black (primarily in Los AngelesUnified School District) appear to benefit little if at all from smallerclasses.
The relationship between teacher characteristics and achievement ismuch weaker. The only indicator that is systematically linked to studentachievement in third grade is experience. Having a new teacher reducesthe percentage of students who exceed the national median by roughly 3percentage points in both mathematics and reading. There is little or noevidence that teacher education or certification is significantly related tostudent achievement in third grade. However, the finding forcertification could be influenced by the lower quality of the certificationdata.
One possible explanation for the variation in class size effects is thetiming of CSR. As mentioned above, nearly one-third of schools had notimplemented CSR in 1997–1998. The results show that for schoolswith a large percentage of black students, those recently implementingCSR have much smaller benefits from class size reduction than do otherhigh-percentage black schools. A similar result is found for rural schools.In contrast, there is little evidence of a difference in class size benefitsbased on CSR timing in schools serving predominantly middle-class,nonblack students.
However, the hiring of new teachers explains only a portion of thedifference in class size effects by CSR timing. Recent research in Texasand elsewhere has documented that hard-to-measure teacher attributeshave an important effect on student achievement. It is likely that thesmaller effects of class size for recent CSR implementers are related to
xii
changes in these hard-to-measure components of teacher quality, giventhat they are related to easier-to-measure teacher attributes such asexperience. The schools that do not appear to benefit from CSR are thesame schools that had trouble hiring experienced, certified teachersbefore CSR.
The estimated decline in third-grade teacher quality in this analysisprobably understates the actual quality decline that accompanied theimplementation of CSR statewide in two ways. First, the effects of classsize reduction on teacher quality extend beyond the grades where classsizes were reduced. An analysis of fifth-grade achievement shows thatclass size reduction in third grade is negatively associated withachievement in fifth grade for schools with a high percentage of blackstudents. Such a finding is consistent with the story that the movementof many fourth- and fifth-grade teachers into the early grades meant thatschools had to rapidly expand hiring in all grades, not just K–3. Second,and perhaps even more important, the available data are not able tocapture between-school changes in instructional effectiveness. Yet, it iswidely believed that many teachers switched schools as a result of classsize reduction. Schools must fill not only the additional positions createdby their own efforts to reduce class size but also positions vacated by thedeparture of teachers for newly created opportunities at other schools.
Policy ImplicationsBecause it is difficult to calculate the magnitude of the benefits of
CSR in terms of higher student achievement, the question of whethermoney would have been better spent on other aspects of schools such ashigher teacher salaries, expanded and improved pre-school, technology,or other programs is very hard to answer. Nevertheless, there is clearevidence that, controlling for changes in teacher quality, smaller classesraised student achievement and the effects were larger in schools servingpredominantly lower-income students. Unfortunately, these schoolstended to suffer the largest deterioration in teacher quality as measuredby experience and certification. A better approach to class size reductionwould have been to reduce class sizes in a subset of schools each year,starting with low-performing schools serving high-poverty populations.
xiii
This would have limited the departure of teachers for newly created jobsin suburban schools, lessened the overall competition for new teachers,and reduced inequality in academic performance.
The results concerning new teachers and their struggles highlight theimportance of policies targeting new teachers, such as the BeginningTeacher Support Act (BTSA). These types of programs have twopotential benefits. First, they can minimize the adverse effects of newteachers by helping them adapt to the classroom more quickly andeffectively. Making these teachers more productive and effective alsoreduces the stress of the job, thereby reducing teacher turnover. Effectiveprograms that assist new teachers will become even more essential in thenear future, as enrollment and teacher retirements both increase. Futureresearch should carefully analyze the effectiveness of programs such asBTSA on student achievement.
Although we find that experience matters, the relationship betweencertification and achievement is much less clear. Our results show thatCalifornia’s certification system in the late 1990s had little if anyrelationship to student achievement, suggesting that policies that preventuncertified teachers from teaching are unlikely to raise studentachievement. The concern about the weak relationship betweencertification and student achievement is well known to Californiapolicymakers, and the California Commission on Teacher Credentialing(CCTC) is currently reforming the certification process. It is hoped thatthe effect of these reforms will be studied rigorously.
At the same time, the available data in California on certificationlimit the inferences that can be drawn. For example, it is not possible todistinguish between the two types of full credentials (preliminary versusprofessional clear). Nor can the data from the CCTC be linked to theCalifornia Basic Educational Data System (CBEDS) from theDepartment of Education. It is not possible to match individual studenttest scores from one year to the next to measure student growth. Thus,several improvements to the current data collection system are needed toconduct an in-depth evaluation of the effects of certification on studentachievement.

xv
Contents
Foreword..................................... iiiSummary..................................... viiFigures ...................................... xviiTables....................................... xxiAcknowledgments ............................... xxiii
1. INTRODUCTION........................... 1
2. ELEMENTARY SCHOOL DEMOGRAPHICCOMPOSITION ............................ 7Introduction ................................ 7Statewide Trends ............................. 8Differences by Community Type................... 12Enrollment Patterns in the Six Largest School Districts ..... 14Summary .................................. 16
3. TRENDS IN TEACHER CHARACTERISTICS DURINGTHE 1990s ................................ 19Introduction ................................ 19Experience ................................. 21Certification ................................ 24Education ................................. 25Teacher Characteristics, by Community Type........... 27Trends in the Six Largest School Districts ............. 29Summary .................................. 33
4. CSR AND STUDENT ACHIEVEMENT ............ 35Introduction ................................ 35Estimation of Class Size Effect .................... 36Existing Research on CSR ....................... 38Empirical Approach ........................... 40Findings .................................. 43
Basic Results .............................. 44Differences by Community Type ................. 46
xvi
Differences by Race/Ethnicity and Income ........... 49The Timing of CSR ......................... 53The Effects of CSR on Fifth-Grade Achievement ....... 63
Summary .................................. 66
5. SUMMARY AND POLICY IMPLICATIONS ......... 69
AppendixA. Data Sources................................ 75B. Additional Tables and Figures..................... 79C. Empirical Model for Student Achievement............. 91
References .................................... 105
About the Authors ............................... 109
Other PPIC Publications on Education ................. 111
xvii
Figures
2.1. Percentage Enrollment in Elementary Schools, byRace/Ethnicity, 1990–2000 ................... 8
2.2. Percentage Enrollment in Free or Reduced-Price LunchPrograms, 1990–2000 ....................... 10
2.3. Percentage Enrollment in Free or Reduced-Price LunchPrograms, by Race/Ethnicity, 1999–2000........... 11
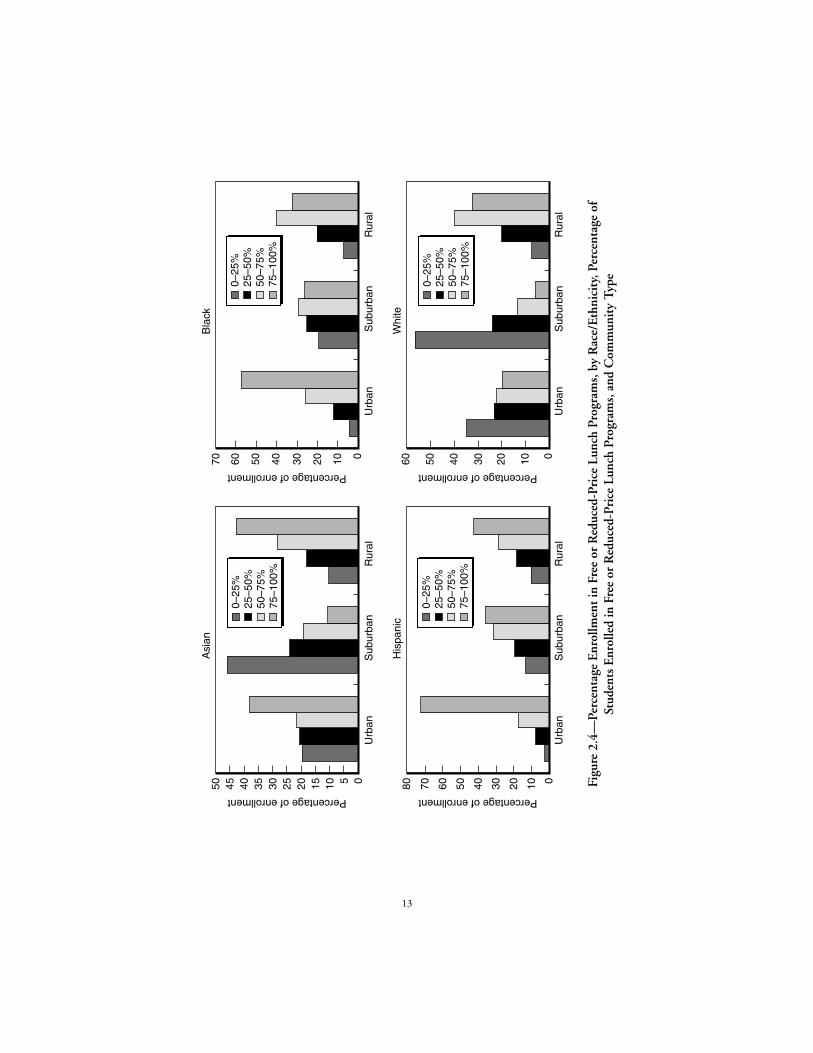
2.4. Percentage Enrollment in Free or Reduced-Price LunchPrograms, by Race/Ethnicity, Percentage of StudentsEnrolled in Free or Reduced-Price Lunch Programs, andCommunity Type.......................... 13
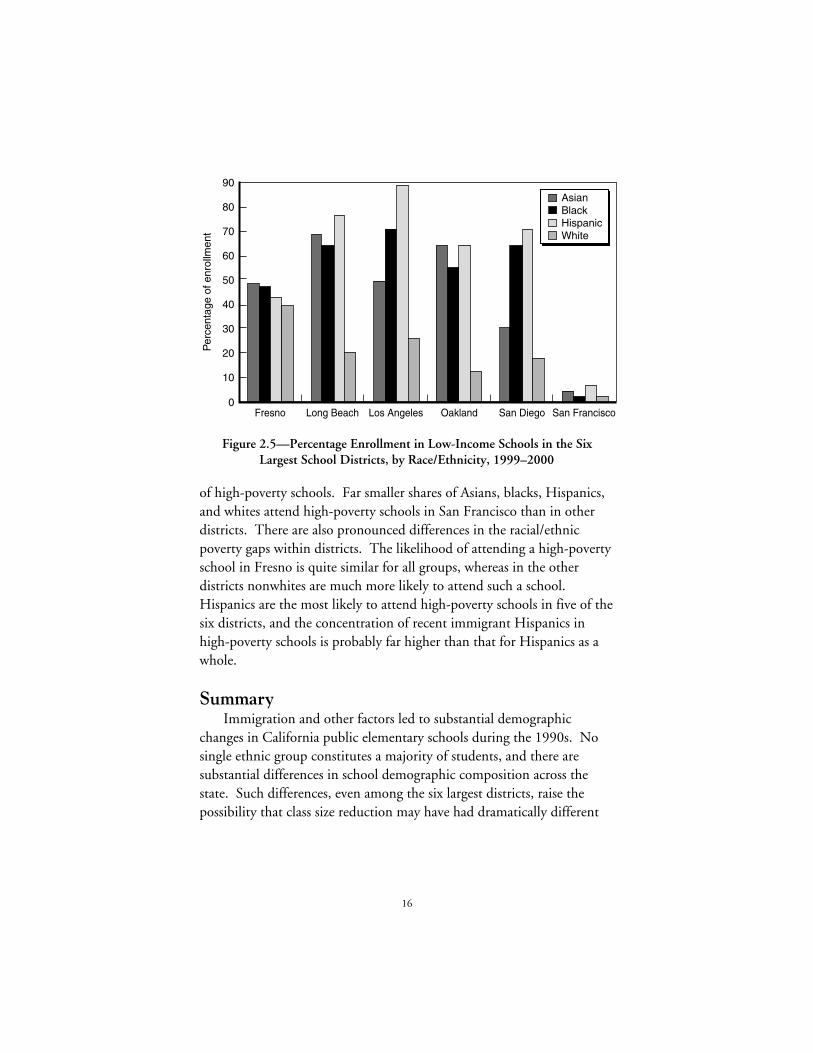
2.5. Percentage Enrollment in Low-Income Schools in the SixLargest School Districts, by Race/Ethnicity, 1999–2000 .................................. 16
4.1. Estimated Increase in the Percentage of StudentsExceeding the National Median Test Scores After aTen-Student Reduction in Class Size.............. 44
4.2. Estimated Increase in the Percentage of StudentsExceeding the National Median Test Scores After aTen-Student Reduction in Class Size, by CommunityType .................................. 47
4.3. Estimated Increase in the Percentage of StudentsExceeding the National Median Test Scores After aTen-Student Reduction in Class Size in Los AngelesUnified School District and the Five Next LargestDistricts ................................ 48
4.4. Estimated Increase in the Percentage of StudentsExceeding the National Median Test Scores After aTen-Student Reduction in Class Size, by Percentage ofStudents Enrolled in Free or Reduced-Price LunchPrograms ............................... 50
4.5. Estimated Increase in the Percentage of StudentsExceeding the National Median Test Scores After a
xviii
Ten-Student Reduction in Class Size, by Percentage ofStudents Enrolled in Free or Reduced-Price LunchPrograms and Community Type ................ 51
4.6. Estimated Increase in the Percentage of StudentsExceeding the National Median Test Scores After aTen-Student Reduction in Class Size in Los AngelesUnified School District and the Five Next LargestDistricts, by Percentage of Students Enrolled in Free orReduced-Price Lunch Programs and Community Type .. 52
4.7. Estimated Increase in the Percentage of StudentsExceeding the National Median Test Scores After aTen-Student Reduction in Class Size, by Percentage ofBlack Students in the School ................... 53
4.8. Estimated Increase in the Percentage of StudentsExceeding the National Median Test Scores After aTen-Student Reduction in Class Size in Urban Schools,by Percentage of Black Students in the School ........ 53
4.9. Estimated Increase in the Percentage of StudentsExceeding the National Median Test Scores After aTen-Student Reduction in Class Size in Los AngelesUnified School District and the Five Next LargestDistricts, by Percentage of Black Students in theSchool ................................. 54
4.10. Estimated Increase in the Percentage of StudentsExceeding the National Median Test Scores After aTen-Student Reduction in Class Size, by Timing ofCSR .................................. 58
4.11. Estimated Increase in the Percentage of StudentsExceeding the National Median Test Scores After aTen-Student Reduction in Class Size, by Timing of CSRand Percentage of Students Enrolled in Free or Reduced-Price Lunch Programs ....................... 59
4.12. Estimated Increase in the Percentage of StudentsExceeding the National Median Test Scores After aTen-Student Reduction in Class Size, by Timing of CSRand Percentage of Black Students in the School,Excluding Teacher Characteristics ............... 60
xix
4.13. Estimated Increase in the Percentage of StudentsExceeding the National Median Test Scores After aTen-Student Reduction in Class Size, by Timing of CSRand Percentage of Black Students in the School,Including Teacher Characteristics................ 62
4.14. Estimated Increase in the Percentage of Students in theFifth Grade Exceeding the National Median Test ScoresAfter a Ten-Student Reduction in Class Size in ThirdGrade, by Percentage of Black Students in the School ... 65
B.1. Percentage Enrollment, by Percentage of StudentsEnrolled in Free or Reduced-Price Lunch Programs andRace/Ethnicity, 1990–1998 ................... 80

xxi
Tables
2.1. Percentage Enrollment of Asian and Hispanic Students,by English Language Proficiency, 1990–2000 ........ 9
2.2. Percentage School Enrollment, by Race/Ethnicity andCommunity Type.......................... 12
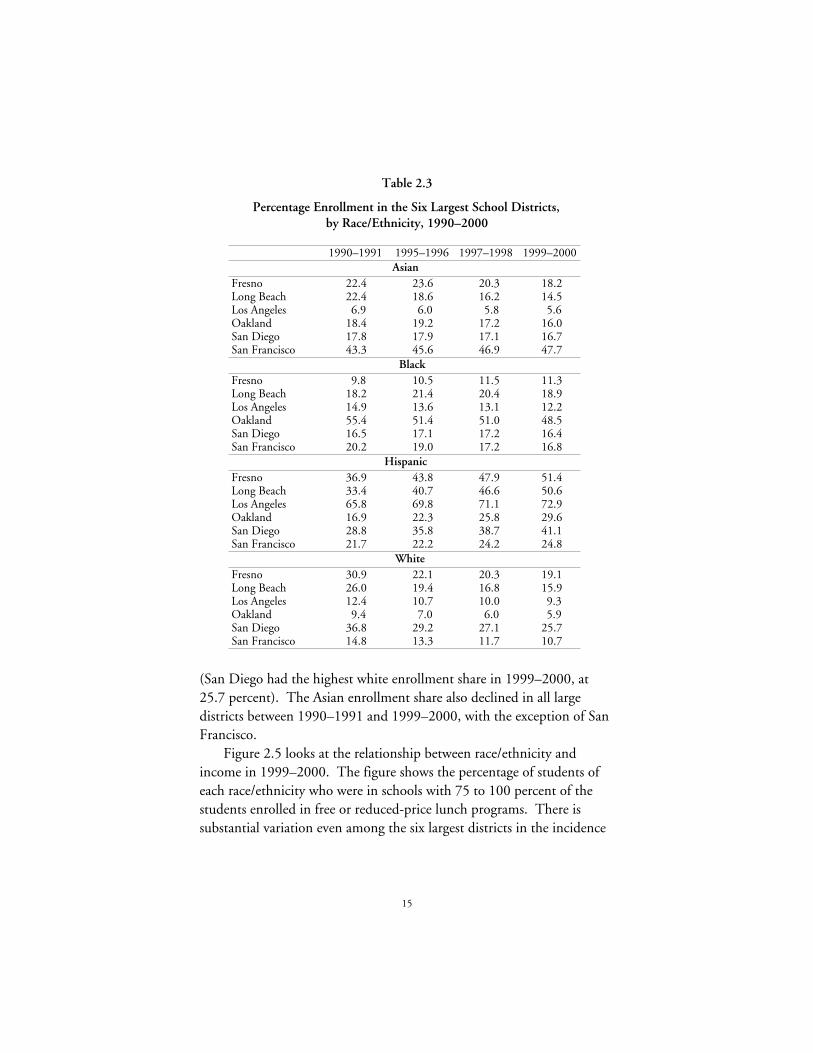
2.3. Percentage Enrollment in the Six Largest SchoolDistricts, by Race/Ethnicity, 1990–2000 ........... 15
3.1. Teacher Experience, by Student Race/Ethnicity andPercentage of Students Enrolled in Free or Reduced-Price Lunch Programs, All Students .............. 22
3.2. Teacher Credentials and Education, by StudentRace/Ethnicity and Percentage of Students Enrolled inFree or Reduced-Price Lunch Programs, All Students ... 26
3.3. Teacher Experience, Credentials, and Education, byCommunity Type and Student Race/Ethnicity ....... 28
3.4. Teacher Experience in the Six Largest School Districts,by District and Student Race/Ethnicity ............ 30
3.5. Teacher Credentials and Education in the Six LargestSchool Districts, by District and StudentRace/Ethnicity............................ 32
B.1. Average Class Size for Grades K–3, by Percentage ofStudents Enrolled in Free or Reduced-Price LunchPrograms and Race/Ethnicity, 1990–2000 .......... 81
B.2. Average Class Size for Grades 4–5, by Percentage ofStudents Enrolled in Free or Reduced-Price LunchPrograms and Race/Ethnicity, 1990–2000 .......... 82
B.3. Number of Elementary Schools, by Percentage ofStudents Enrolled in Free or Reduced-Price LunchPrograms, 1990–2000 ....................... 83
B.4. Percentage of Students in Each Lunch Category, byCommunity Type and Race/Ethnicity, 1990–2000 .... 84
xxii
B.5. Teacher Experience, by Student Race/Ethnicity,Percentage of Students Enrolled in Free or Reduced-Price Lunch Programs, and Community Type, 1990–2000 .................................. 85
B.6. Teacher Credentials and Education, by StudentRace/Ethnicity, Percentage of Students Enrolled in Freeor Reduced-Price Lunch Programs, and CommunityType, 1990–2000 .......................... 88
C.1. Estimated Effects of Class Size and TeacherCharacteristics on the Percentage of Students Exceedingthe National Median Test Scores ................ 95
C.2. Estimated Effects of Class Size and TeacherCharacteristics on Third-Grade Test Scores: RobustnessAnalysis for Credential and Experience ............ 96
C.3. Estimated Effects of Class Size on Third-Grade TestScores, by Community Type ................... 97
C.4. Estimated Effects of Class Size, by Student DemographicComposition and Community Type .............. 98
C.5. Estimated Effects of Class Size and TeacherCharacteristics on Third-Grade Test Scores CombiningAll Student Demographic Interactions, by TeacherCharacteristics ............................ 99
C.6. Variable Means and Standard Deviations for ThirdGrade, by Timing of CSR: Change in Variable from1997 to 1999 Below Overall Statistic ............. 100
C.7. Estimated Effects of Class Size on Third-Grade TestScores, by Timing of CSR, Teacher Characteristics, andStudent Demographic Composition: SeparateRegressions for Each Column and Panel ........... 101
C.8. Estimated Effects of Class Size on Third-Grade TestScores Combining All Interactions, by Timing of CSR,Teacher Characteristics, and Student DemographicComposition ............................. 102
C.9. Estimated Effects of Third-Grade and Fifth-Grade ClassSize on Fifth-Grade Test Scores ................. 103
C.10. Variable Means and Standard Deviations for FifthGrade, by Timing of CSR: Change in Variable from1997 to 1999 Below Overall Statistic ............. 104
xxiii
Acknowlegments
We would like to thank numerous people who assisted us with thisresearch project. Pedro Cerdan and Jacklin Chou provided excellentresearch assistance, and Anne Danenberg gave us ongoing help in theconstruction of the datasets. Julian Betts, Dominic Brewer, AnneDanenberg, Norton Grubb, and Belinda Reyes provided thoughtfulreviews of preliminary drafts, and seminar participants at PPIC alsooffered very helpful comments along the way. Gary Bjork, SusannaCooper, Joyce Peterson, and Patricia Bedrosian provided valuableeditorial assistance. Finally, we are extremely grateful to MarkBaldassare, Gary Hart, Kim Rueben, and Jon Sonstelie for theirinvaluable assistance and support throughout the project. The authorsare solely responsible for any errors of fact or interpretation.

1
1. Introduction
In response to widespread dissatisfaction with the public schools,California has implemented a number of education reforms over the pastdecade. The legislature and governor enacted the nation’s largest classsize reduction (CSR) law with overwhelming support in the summer of1996.1 Educators and policymakers hoped that this policy would lead tolarge gains in student achievement, echoing gains attributed to smallerclass sizes in the Tennessee Student/Teacher Achievement Ratio (STAR)experiment.2
The goal of the CSR program was to reduce class sizes to no morethan 20 students in each grade from kindergarten through third grade.In the initial year of the program, 1996–1997, school districts received$650 for each K–3 student in a full-day CSR program and $325 for eachstudent in a half-day CSR program (i.e., half the instructional minutesare spent in classes of 20 children or fewer). This amount is increasedevery year by a cost of living allowance. In 1996–1997, districts alsoreceived a one-time amount of $25,000 for newly created classrooms.That amount rose to $40,000 in later years. In 1996–1997 and 1997–1998, schools could use classrooms that were smaller than the stateminimum of 960 square feet for grades 1–3 and 1,350 square feet forkindergarten (Bohrnstedt and Stecher, 1999). However, by 1998–1999class sizes for CSR classrooms had to be the same size as other classroomsin the school. Overall, CSR reduced the state average class size for K–3from approximately 29 students in 1995–1996 to 19 in 1999–2000.____________
1The information on CSR comes from the California Department of Education’s“Fingertip Facts” on Class Size Reduction (http://www.cde.ca.gov/classsize/facts.htm).For more information, also see Bohrnstedt and Stecher (1999).
2Note that the Tennessee STAR experiment has nothing to do with California’sStandardized Testing and Reporting system even though both programs share the STARacronym. Throughout this report, STAR refers to the Tennessee STAR experiment.
2
Districts were free to choose the schools in which to reduce classsizes, although they were not free to choose the grades within a school.Each participating school had to reduce class size in first grade beforereducing class size in second grade. Similarly, each school had to reduceclass size in second grade before reducing class size in kindergarten orthird grade. Almost every school district participated in the initial year,although not in every school and grade. In the second year of CSR,1997–1998, over 95 percent of the first- and second-grade classroomsqualified for CSR, compared with only 70 percent for kindergarten andthird-grade classrooms (Bohrnstedt and Stecher, 2000). Participation inkindergarten and third grade increased to roughly 85 percent in 1998–1999.
There are few if any differences in average class size in the affectedgrades (K–3) by income level or race/ethnicity at any point during thedecade, as shown in Appendix Table B.1.3 Low-income and nonwhitestudents on average do not attend larger classes than other students. Infact, additional analyses of average K–3 class size found little variationbetween urban, suburban, and rural schools. Appendix Table B.2 showslittle variation in average class size for grades four and five.
One of the biggest challenges to districts implementing CSR was theneed to hire more teachers. Extra classes created a need for 25,000additional teachers statewide. In contrast, fewer than 4,000 new teacherswere hired in kindergarten through third grade in the year before CSR(1995–1996). Some districts were already beset by staffing difficultiesbefore class size reduction, and the need to hire many additional teachersexacerbated the problem. Ross (1999) describes the influx ofinexperienced, noncertified teachers into elementary schools in SouthCentral Los Angeles following CSR. This influx, he reports, wasprompted in part by the departure of experienced teachers to newlycreated positions in more affluent communities.____________
3Because we are interested in the typical classroom, special education and other“alternative” classrooms are excluded from the analysis. This exclusion eliminates thepossibility of confounding class size differences with differences in the number of specialeducation classes, which are typically smaller than regular classes and more numerous inlow-income schools and in schools with more nonwhite students.
3
This influx of new teachers sets up the possibility of a serious sideeffect of CSR: The need to hire large numbers of additional teachersmay have reduced teacher quality and offset some or most of the benefitsof smaller classes. A crucial question is whether any decline in quality is atemporary consequence of the need to hire large numbers ofinexperienced teachers or a longer-term result of employing less-qualifiedapplicants who would not have been considered before the enactment ofCSR. A distressing possibility is that any decline in teacher quality mayhave been concentrated in schools serving predominantly lower-incomeand minority students, which have the most difficulties attracting andretaining highly skilled teachers.
Many organizations have studied the effects of CSR on a variety ofoutcomes, including achievement. Because of the absence of statewidetesting before 1997–1998 and other aspects of policy implementation, itwill not be possible to ever know the full effect of CSR on thedistribution of teacher quality and student achievement. Moreover,because most research, including the widely publicized Tennessee STARexperiment, investigates the effect of smaller classes holding all otherfactors including teacher quality constant, the results provide informationstrictly on the benefits of smaller classes. Differences between Californiaand Tennessee or other research sites may limit the relevance of previouswork on class size even more.
Despite the impediments to understanding the full effect of CSR, itis still quite important to learn as much as possible about how it isaffecting California schools. The state commissioned the CSR ResearchConsortium to study the effects of CSR on student achievement andother outcomes. By comparing schools that implemented CSR withthose that did not, the first two reports by the consortium found smallbut positive effects of CSR implementation on achievement in secondand third grade. They found that these benefits were not concentrated inany particular demographic group such as low-income or nonwhitestudents; all students benefited equally. However, there were twoproblematic assumptions in these reports. First, they assumed that theeffect of CSR was the same for each school: Schools that reduced classsize from 21 to 20 received the same benefit as schools that reduced classsize from 31 to 20. Second, the consortium’s analysis of achievement in
4
third grade also explicitly assumed that CSR had no effect onachievement in grades four and five, despite its own findings that theancillary effects of CSR increased the number of new teachers in fourthand fifth grade by as much, if not more, than the number of new teachersin kindergarten through third grade.
The consortium’s third report used state-level data to look at theeffects of CSR implementation in kindergarten through third grade,rather than focusing on CSR in second and third grade. The reportfound no systematic relationship between CSR and achievement, but thedataset used for this analysis was extremely small. The fourth and finalconsortium report, due in the summer of 2002, will use much moreextensive student- and school-level data.
The achievement results from all three consortium reportscontradicted the anecdotal stories given by principals andsuperintendents describing the struggles faced by schools serving low-income and nonwhite students in their attempts to benefit from CSR.The Center for the Future of Teaching and Learning and the consortiumboth documented the staffing struggles of these schools following CSR.Although the center did not study achievement, it suggested that thesestaffing inequities are likely to lead to differences in achievement.
The primary objective of our report is to determine the mechanismsby which CSR affected student achievement. Rather than simply asking,“Does CSR raise achievement?” as the consortium did, we also ask, “Howdoes CSR raise achievement?” in an attempt to learn as much as possibleabout changes in teacher quality that may have accompanied CSR.
In addition to an analysis of all students combined, we also considerdifferences by income, race/ethnicity, community type, and even specificschool district. Previous work in California and across the nation hasshown that schools serving lower-income students in urban districts facesome of the greatest obstacles to raising achievement, in large partbecause of the difficulties of attracting and retaining high-qualityteachers. By highlighting the experiences of the state’s mostdisadvantaged students, we provide the detailed information for statepolicymakers to consider in their efforts to improve the quality ofCalifornia’s public schools.
5
To examine the effect of class size reduction on test scores, we focuson mathematics and reading achievement in third grade. Our analysisuses data from the 1997–1998 and 1999–2000 school years to examinechanges in class size within schools.4 We focus on third grade becauseCSR was not implemented in a substantial number of third-gradeclassrooms by 1997–1998.5 During our time period, some schools hadlarge changes in class sizes and teacher characteristics because of CSRimplementation, whereas other schools had much smaller changes as aresult of other factors such as enrollment. We consider the effect ofsmaller classes as well as the effect of the drastic changes in the teacherworkforce. We also investigate whether the relationship between classsize and achievement depends on the timing of CSR.
The report is structured as follows. Chapter 2 briefly describespublic school enrollment patterns to provide the context for our analysis.Chapter 3 describes teacher characteristics (i.e., experience, certification,and education) before and after the implementation of CSR, especiallythe distributions of teacher characteristics by community type, studentracial/ethnic composition, and income. Following the description oftrends in teacher characteristics, Chapter 4 analyzes the effects of classsize reduction on mathematics and reading achievement in third grade.The final chapter summarizes the findings and offers a number of policyimplications based on the empirical analysis. Additional technicalmaterials appear in appendices at the end of the report.____________
4Unfortunately, consistent test score data were not available for the pre-CSR period.5Standardized tests were not given in kindergarten, where implementation also was
not universal.

7
2. Elementary SchoolDemographic Composition
IntroductionDemographic composition may affect academic achievement in a
number of ways, including the influences of peers, structure of thecurriculum, and instructional quality. There remains little consensus onthe magnitude or even direction of peer group influences, and we do notaddress that issue in this work. Rather, we focus on the link betweenstudent demographic composition and the quality of instruction.Specifically, an important aspect of this report is the extent to which anychanges in instructional quality following the implementation of CSRvaried systematically by racial/ethnic or income characteristics of thestudents. Research shows that schools with high shares of black,Hispanic, or low-income students tend to have a more difficult timeattracting and retaining teachers, although there is little evidence on theunderlying causes of the association between teacher preferences andschool demographic composition.1 Some teachers may prefer specificstudent characteristics, but a much more likely explanation is that thelink between teacher preferences and student demographic compositionis driven by factors including the quality of facilities, safety, distance towork, and other aspects of working conditions.
This chapter provides background information on trends inCalifornia elementary school demographic composition during the1990s. Following a description of statewide enrollment shares, weexamine enrollment patterns for urban, suburban, and rural districts. Tolearn even more about the large urban districts that appear to have themost difficulty attracting and retaining teachers (see Chapter 3), we also____________
1See Lankford, Loeb, and Wyckoff (2001) and Hanushek, Rivkin, and Kain (1999).
8
document enrollment patterns for each of the six largest districts in thestate.
Statewide TrendsCalifornia has always been a destination for immigrants from other
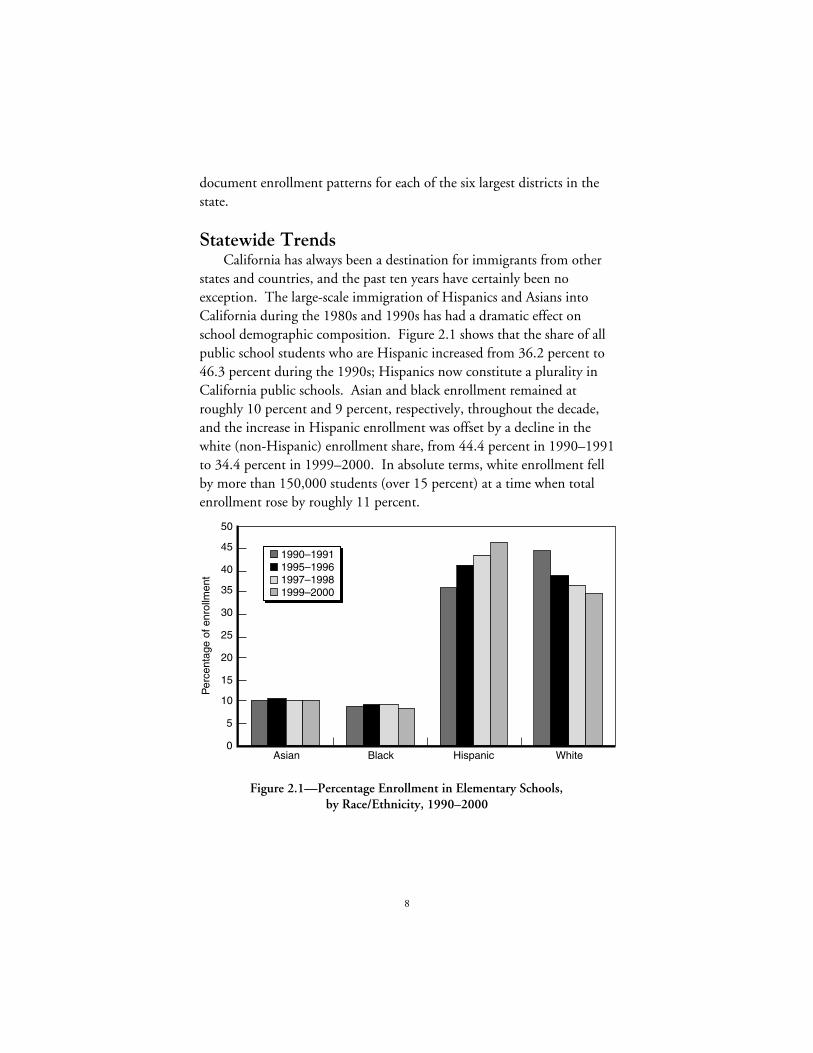
states and countries, and the past ten years have certainly been noexception. The large-scale immigration of Hispanics and Asians intoCalifornia during the 1980s and 1990s has had a dramatic effect onschool demographic composition. Figure 2.1 shows that the share of allpublic school students who are Hispanic increased from 36.2 percent to46.3 percent during the 1990s; Hispanics now constitute a plurality inCalifornia public schools. Asian and black enrollment remained atroughly 10 percent and 9 percent, respectively, throughout the decade,and the increase in Hispanic enrollment was offset by a decline in thewhite (non-Hispanic) enrollment share, from 44.4 percent in 1990–1991to 34.4 percent in 1999–2000. In absolute terms, white enrollment fellby more than 150,000 students (over 15 percent) at a time when totalenrollment rose by roughly 11 percent.
0
5
10
15
20
25
30
35
40
45
50
Asian Black Hispanic White
Per
cent
age
of e
nrol
lmen
t
1990–19911995–19961997–19981999–2000
Figure 2.1—Percentage Enrollment in Elementary Schools,by Race/Ethnicity, 1990–2000
9
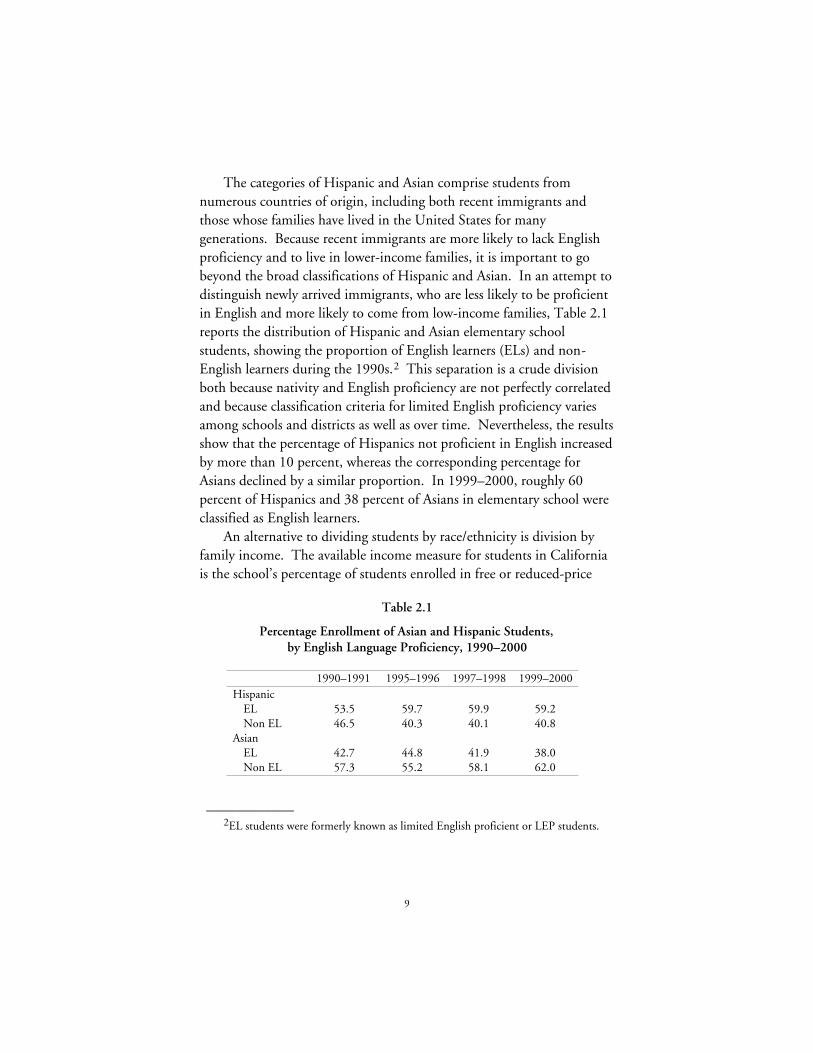
The categories of Hispanic and Asian comprise students fromnumerous countries of origin, including both recent immigrants andthose whose families have lived in the United States for manygenerations. Because recent immigrants are more likely to lack Englishproficiency and to live in lower-income families, it is important to gobeyond the broad classifications of Hispanic and Asian. In an attempt todistinguish newly arrived immigrants, who are less likely to be proficientin English and more likely to come from low-income families, Table 2.1reports the distribution of Hispanic and Asian elementary schoolstudents, showing the proportion of English learners (ELs) and non-English learners during the 1990s.2 This separation is a crude divisionboth because nativity and English proficiency are not perfectly correlatedand because classification criteria for limited English proficiency variesamong schools and districts as well as over time. Nevertheless, the resultsshow that the percentage of Hispanics not proficient in English increasedby more than 10 percent, whereas the corresponding percentage forAsians declined by a similar proportion. In 1999–2000, roughly 60percent of Hispanics and 38 percent of Asians in elementary school wereclassified as English learners.
An alternative to dividing students by race/ethnicity is division byfamily income. The available income measure for students in Californiais the school’s percentage of students enrolled in free or reduced-price
Table 2.1
Percentage Enrollment of Asian and Hispanic Students,by English Language Proficiency, 1990–2000
1990–1991 1995–1996 1997–1998 1999–2000Hispanic
EL 53.5 59.7 59.9 59.2Non EL 46.5 40.3 40.1 40.8
AsianEL 42.7 44.8 41.9 38.0Non EL 57.3 55.2 58.1 62.0
____________2EL students were formerly known as limited English proficient or LEP students.
10
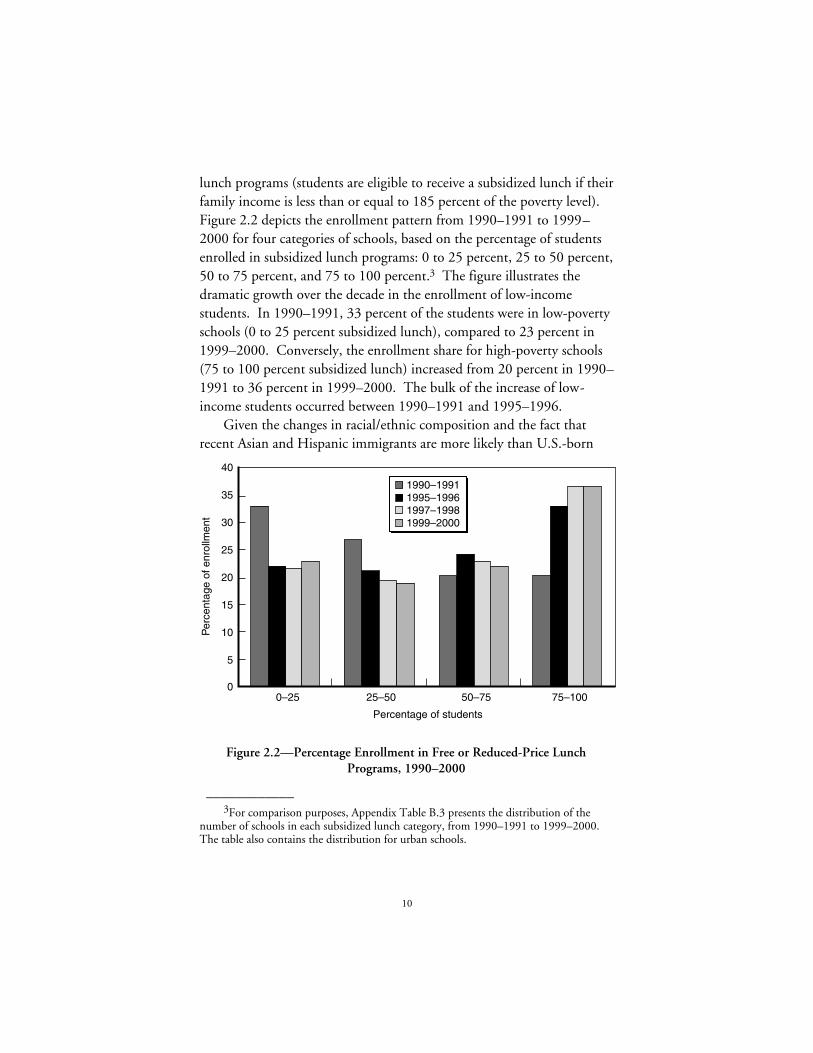
lunch programs (students are eligible to receive a subsidized lunch if theirfamily income is less than or equal to 185 percent of the poverty level).Figure 2.2 depicts the enrollment pattern from 1990–1991 to 1999–2000 for four categories of schools, based on the percentage of studentsenrolled in subsidized lunch programs: 0 to 25 percent, 25 to 50 percent,50 to 75 percent, and 75 to 100 percent.3 The figure illustrates thedramatic growth over the decade in the enrollment of low-incomestudents. In 1990–1991, 33 percent of the students were in low-povertyschools (0 to 25 percent subsidized lunch), compared to 23 percent in1999–2000. Conversely, the enrollment share for high-poverty schools(75 to 100 percent subsidized lunch) increased from 20 percent in 1990–1991 to 36 percent in 1999–2000. The bulk of the increase of low-income students occurred between 1990–1991 and 1995–1996.
Given the changes in racial/ethnic composition and the fact thatrecent Asian and Hispanic immigrants are more likely than U.S.-born
0
5
10
15
20
25
30
35
40
0–25 25–50 50–75 75–100
Percentage of students
1990–19911995–19961997–19981999–2000
Per
cent
age
of e
nrol
lmen
t
Figure 2.2—Percentage Enrollment in Free or Reduced-Price LunchPrograms, 1990–2000
____________3For comparison purposes, Appendix Table B.3 presents the distribution of the
number of schools in each subsidized lunch category, from 1990–1991 to 1999–2000.The table also contains the distribution for urban schools.
11
whites to be poor, the trends for income are not surprising. Perhaps amore important question is how the percentage of students enrolled infree or reduced-price lunch programs differs across racial/ethnic groupstoday. To the extent that income and race/ethnicity have independentlinks with teacher labor supply, it is important to identify differencesalong each of these dimensions.
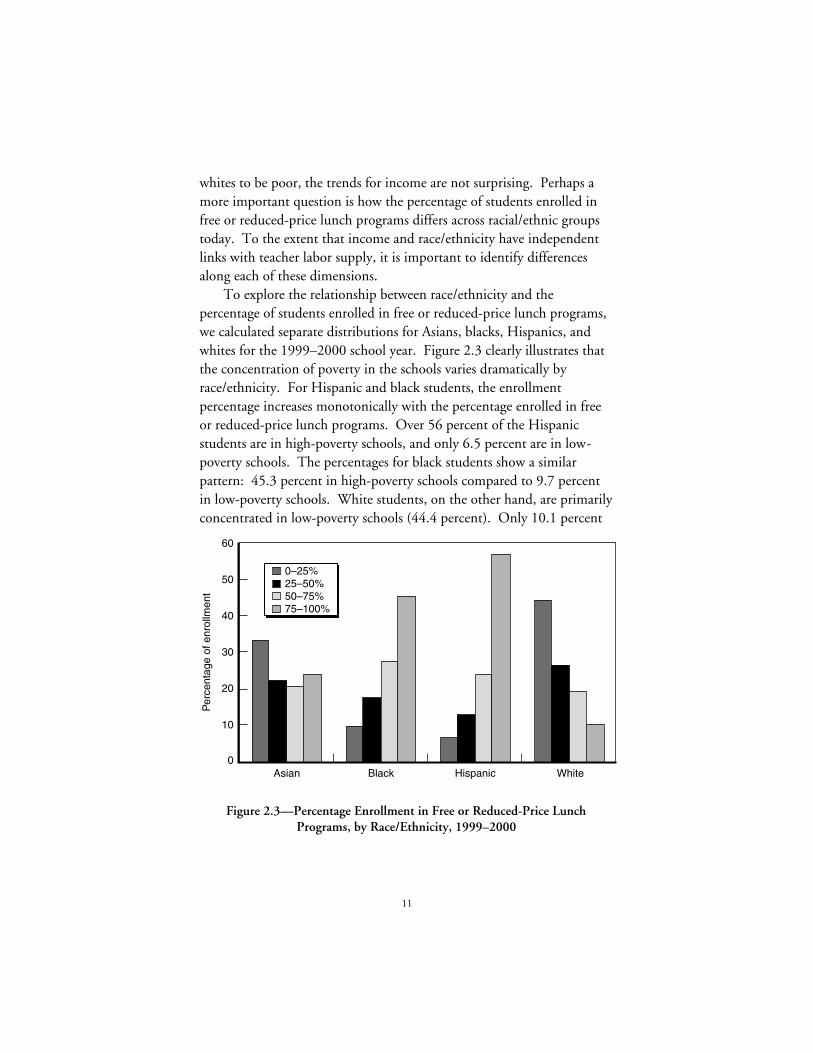
To explore the relationship between race/ethnicity and thepercentage of students enrolled in free or reduced-price lunch programs,we calculated separate distributions for Asians, blacks, Hispanics, andwhites for the 1999–2000 school year. Figure 2.3 clearly illustrates thatthe concentration of poverty in the schools varies dramatically byrace/ethnicity. For Hispanic and black students, the enrollmentpercentage increases monotonically with the percentage enrolled in freeor reduced-price lunch programs. Over 56 percent of the Hispanicstudents are in high-poverty schools, and only 6.5 percent are in low-poverty schools. The percentages for black students show a similarpattern: 45.3 percent in high-poverty schools compared to 9.7 percentin low-poverty schools. White students, on the other hand, are primarilyconcentrated in low-poverty schools (44.4 percent). Only 10.1 percent
0
10
20
30
40
50
60
Asian Black Hispanic White
Per
cent
age
of e
nrol
lmen
t
0–25%25–50%50–75%75–100%
Figure 2.3—Percentage Enrollment in Free or Reduced-Price LunchPrograms, by Race/Ethnicity, 1999–2000
12
of white students are in high-poverty schools. Finally, Asian students aremore evenly distributed across the school income distribution (33.1percent in low-poverty schools and 23.8 percent in high poverty schools).Note that these patterns are relatively constant throughout the decade(see Appendix Figure B.1).
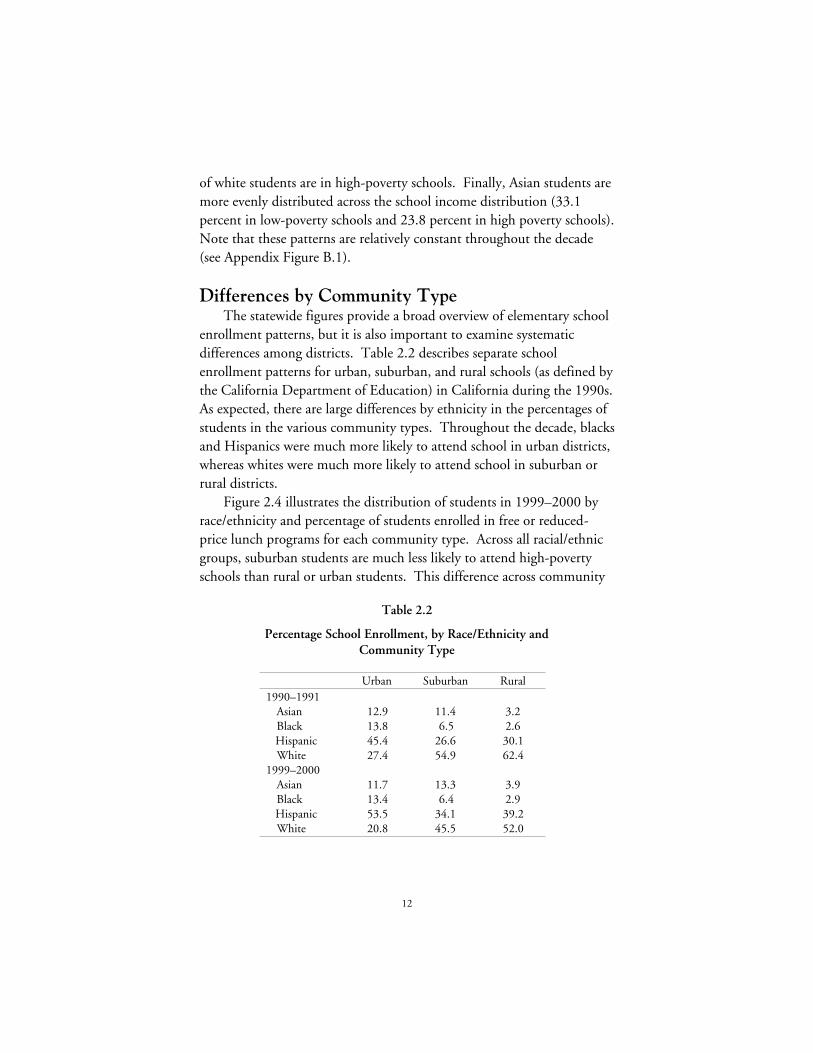
Differences by Community TypeThe statewide figures provide a broad overview of elementary school
enrollment patterns, but it is also important to examine systematicdifferences among districts. Table 2.2 describes separate schoolenrollment patterns for urban, suburban, and rural schools (as defined bythe California Department of Education) in California during the 1990s.As expected, there are large differences by ethnicity in the percentages ofstudents in the various community types. Throughout the decade, blacksand Hispanics were much more likely to attend school in urban districts,whereas whites were much more likely to attend school in suburban orrural districts.
Figure 2.4 illustrates the distribution of students in 1999–2000 byrace/ethnicity and percentage of students enrolled in free or reduced-price lunch programs for each community type. Across all racial/ethnicgroups, suburban students are much less likely to attend high-povertyschools than rural or urban students. This difference across community
Table 2.2
Percentage School Enrollment, by Race/Ethnicity andCommunity Type
Urban Suburban Rural1990–1991
Asian 12.9 11.4 3.2Black 13.8 6.5 2.6Hispanic 45.4 26.6 30.1White 27.4 54.9 62.4
1999–2000Asian 11.7 13.3 3.9Black 13.4 6.4 2.9Hispanic 53.5 34.1 39.2White 20.8 45.5 52.0
13
0–25
%25
–50%
50–7
5%75
–100
%
0–25
%25
–50%
50–7
5%75
–100
%
0–25
%25
–50%
50–7
5%75
–100
%
0–25
%25
–50%
50–7
5%75
–100
%
Percentage of enrollment
Asi
an
010152025303540 54550B
lack
010203040506070
Percentage of enrollment
Percentage of enrollment
His
pani
c
01020304050607080
1020304050
Whi
te
060
Percentage of enrollment
Figu
re 2
.4—
Perc
enta
ge E
nrol
lmen
t in
Fre
e or
Red
uced
-Pri
ce L
unch
Pro
gram
s, b
y R
ace/
Ethn
icit
y, P
erce
ntag
e of
St
uden
ts E
nrol
led
in F
ree
or R
educ
ed-P
rice
Lun
ch P
rogr
ams,
and
Com
mun
ity
Typ
e
Urb
anS
ubur
ban
Rur
al
Urb
anS
ubur
ban
Rur
al
Urb
anS
ubur
ban
Rur
al
Urb
anS
ubur
ban
Rur
al
14
types is most pronounced for Asian and white students, where mostsuburban students attend low-poverty schools. The enrollmentpercentage among Hispanic students increases with the percentageenrolled in free or reduced-price lunch programs in all three communitytypes; over 70 percent of urban Hispanic students are in high-povertyschools. Urban and rural black students are much more likely to attendhigh-poverty schools, whereas suburban blacks are likely to attend low-,middle-, and high-poverty schools in roughly the same proportions.
Enrollment Patterns in the Six Largest SchoolDistricts
The aggregate trends and differences by community type are quiteinformative, yet they may conceal substantial differences across districts.Because large urban districts tend to have high fractions of poor,nonwhite students, this report focuses additional attention on suchdistricts. Historically, the six largest school districts in California havebeen Fresno, Long Beach, Los Angeles, Oakland, San Diego, and SanFrancisco.4 These six districts represent 20 percent of the enrollment inCalifornia elementary schools and 50 percent of the enrollment in urbanschools.
There is substantial variation among the six districts in demographiccomposition, although each experienced qualitatively similardemographic shifts during the 1990s. Table 2.3 contains the enrollmentpercentages by year, race/ethnicity, and district. Each district has onedominant racial/ethnic group. In four of the districts, it is Hispanics; inOakland it is blacks; in San Francisco it is Asians.
Nevertheless, Hispanic enrollment as a percentage of the totalincreased in all six districts, so that by 1999–2000 the percentage ofHispanic students ranged from 25 percent in San Francisco to 73 percentin Los Angeles. The increase in percentage Hispanic was most dramaticin Oakland, nearly doubling between 1990–1991 and 1999–2000.During this same period, white enrollment dropped in all six districtsand did not exceed one-quarter of the enrollment in any of the districts____________
4Santa Ana is now the sixth largest school district in the state because of recentenrollment growth. Oakland is currently the seventh largest.
15
Table 2.3
Percentage Enrollment in the Six Largest School Districts,by Race/Ethnicity, 1990–2000
1990–1991 1995–1996 1997–1998 1999–2000Asian
Fresno 22.4 23.6 20.3 18.2Long Beach 22.4 18.6 16.2 14.5Los Angeles 6.9 6.0 5.8 5.6Oakland 18.4 19.2 17.2 16.0San Diego 17.8 17.9 17.1 16.7San Francisco 43.3 45.6 46.9 47.7
BlackFresno 9.8 10.5 11.5 11.3Long Beach 18.2 21.4 20.4 18.9Los Angeles 14.9 13.6 13.1 12.2Oakland 55.4 51.4 51.0 48.5San Diego 16.5 17.1 17.2 16.4San Francisco 20.2 19.0 17.2 16.8
HispanicFresno 36.9 43.8 47.9 51.4Long Beach 33.4 40.7 46.6 50.6Los Angeles 65.8 69.8 71.1 72.9Oakland 16.9 22.3 25.8 29.6San Diego 28.8 35.8 38.7 41.1San Francisco 21.7 22.2 24.2 24.8
WhiteFresno 30.9 22.1 20.3 19.1Long Beach 26.0 19.4 16.8 15.9Los Angeles 12.4 10.7 10.0 9.3Oakland 9.4 7.0 6.0 5.9San Diego 36.8 29.2 27.1 25.7San Francisco 14.8 13.3 11.7 10.7
(San Diego had the highest white enrollment share in 1999–2000, at25.7 percent). The Asian enrollment share also declined in all largedistricts between 1990–1991 and 1999–2000, with the exception of SanFrancisco.
Figure 2.5 looks at the relationship between race/ethnicity andincome in 1999–2000. The figure shows the percentage of students ofeach race/ethnicity who were in schools with 75 to 100 percent of thestudents enrolled in free or reduced-price lunch programs. There issubstantial variation even among the six largest districts in the incidence
16
0
10
20
30
40
50
60
70
80
90
Per
cent
age
of e
nrol
lmen
tAsianBlackHispanicWhite
Fresno Long Beach Los Angeles Oakland San Diego San Francisco
Figure 2.5—Percentage Enrollment in Low-Income Schools in the SixLargest School Districts, by Race/Ethnicity, 1999–2000
of high-poverty schools. Far smaller shares of Asians, blacks, Hispanics,and whites attend high-poverty schools in San Francisco than in otherdistricts. There are also pronounced differences in the racial/ethnicpoverty gaps within districts. The likelihood of attending a high-povertyschool in Fresno is quite similar for all groups, whereas in the otherdistricts nonwhites are much more likely to attend such a school.Hispanics are the most likely to attend high-poverty schools in five of thesix districts, and the concentration of recent immigrant Hispanics inhigh-poverty schools is probably far higher than that for Hispanics as awhole.
SummaryImmigration and other factors led to substantial demographic
changes in California public elementary schools during the 1990s. Nosingle ethnic group constitutes a majority of students, and there aresubstantial differences in school demographic composition across thestate. Such differences, even among the six largest districts, raise thepossibility that class size reduction may have had dramatically different

17
effects across the state. This depends largely on the strength of therelationship between teacher availability and student demographiccomposition, an issue to which we now turn.

19
3. Trends in TeacherCharacteristics During the1990s
IntroductionChanges in school enrollment patterns not only alter peer group
composition but also potentially affect a variety of other aspects of schoolquality, including the quality of instruction. Schools with highpercentages of nonwhite or low-income students appear to face morestaffing difficulties than do other schools. The observed pattern ofteacher transitions out of high-percentage nonwhite schools and thedifficulty many such schools experience in trying to attract and retaincertified teachers suggest that average instructional quality is likely to belower in high-percentage nonwhite schools.1 Consequently, the creationof teaching jobs by the CSR legislation was likely to exacerbate staffingdifficulties in schools that were struggling to attract and retain teachersbefore the implementation of CSR.
A growing body of research documents the preeminent role ofteacher quality in the determination of educational outcomes,particularly compared with class size and other observable school inputs.2
Identifying whether a teacher is effective is not an easy task, butidentifying the attributes that make a teacher effective is even moredifficult. The attributes of high-quality teachers are not entirely capturedby observable characteristics such as education and experience.Nevertheless, certain teacher characteristics appear to affect student____________
1See Hanushek, Rivkin, and Kain (1999) for evidence on teacher transitions inTexas. Reichardt (2000) provides preliminary evidence on teacher transitions inCalifornia.
2See Sanders and Horn (1994) and Rivkin, Hanushek, and Kain (2000).
20
achievement. Whereas average teacher experience is not closely linked tostudent achievement, recent work suggests that first- and second-yearteachers perform markedly worse than more experienced colleagues.3
Limited evidence shows that teachers lacking certification and training ina given field such as mathematics are likely to perform worse than otherteachers.4 Other potential indicators of quality are the test scores ofteachers and the quality of the college they attend.5
Moreover, because schools use education, certification, experience,and other observable characteristics in judging potential teachers, theirdistributions provide evidence on the difficulties schools (and districts)experience in teacher labor markets. For example, the state providesstrong incentives for the hiring of certified rather than uncertifiedteachers, so that a high rate of uncertified teachers indicates that manyschools are having serious difficulty attracting and retaining teachers.Such difficulties almost certainly lower the quality of instruction.
This chapter documents changes in the distribution of teachercharacteristics in California public elementary schools during the 1990s,highlighting the apparent effects of CSR.6 Similar to the previouschapter, the analysis begins with statewide trends in teachercharacteristics. Subsequently, changes for all urban districts combinedand for each of the six largest districts are described. The tables reportteacher characteristics for the school years 1990–1991, 1995–1996,1997–1998, and 1999–2000. The year 1995–1996 is not only themidpoint of the decade but also the year before the implementation ofCSR.
The description of the distribution of teacher characteristics in thisreport builds upon previous work. The reports by the CSR ResearchConsortium (Bohrnstedt and Stecher, 1999, 2000, 2002) describe theincrease in both the use of emergency certification and the percentage of____________
3See Rivkin, Hanushek, and Kain (2000).4See Fetler (1999) and Goldhaber and Brewer (2000).5See Ehrenberg and Brewer (1994) for evidence on college selectivity and Ferguson
(1998) for evidence on teacher test scores.6Because the trends in teacher characteristics are similar for the grades reducing class
size (K–3) and other grades (4–5), we combine the results for all elementary grades.
21
beginning teachers following the implementation of CSR. They alsodocument differences by student income and race/ethnicity in the levelsand changes in these teacher characteristics. Betts, Rueben, andDanenberg (2000) present a comprehensive analysis of differences inteacher characteristics both within and between public school districts inCalifornia for the single school year 1997–1998.7 In particular, theyhighlight the substantial differences in teacher characteristics withindistricts despite the presence of districtwide salary schedules. Theseresults strongly suggest that California teachers place a great deal ofweight on student characteristics and other determinants of workingconditions in deciding where to work.
Although our description of California elementary school teacherscovers much of the same ground, there are several key distinctions fromthis earlier work. First, rather than combining all teachers with less thanthree years of experience into a single category, we create separatecategories for first- and second-year teachers and group all remainingteachers with at least two years of experience into a single category.Second, the studies mentioned above examined differences bycommunity type, student racial/ethnic composition, and student income,but they did not consider the joint influences of these three sets offactors. The results in the previous chapter illustrate that the distributionof students within each income category differs by race, and thesedifferences would be overlooked if focusing on either race/ethnicity orincome categories.8 Therefore, our statewide analysis considers the jointdistribution of race/ethnicity and enrollment in free or reduced-pricelunch programs. Within each community type, there is a highcorrelation between race/ethnicity and income, so we consider the jointdistribution of community type and race/ethnicity.
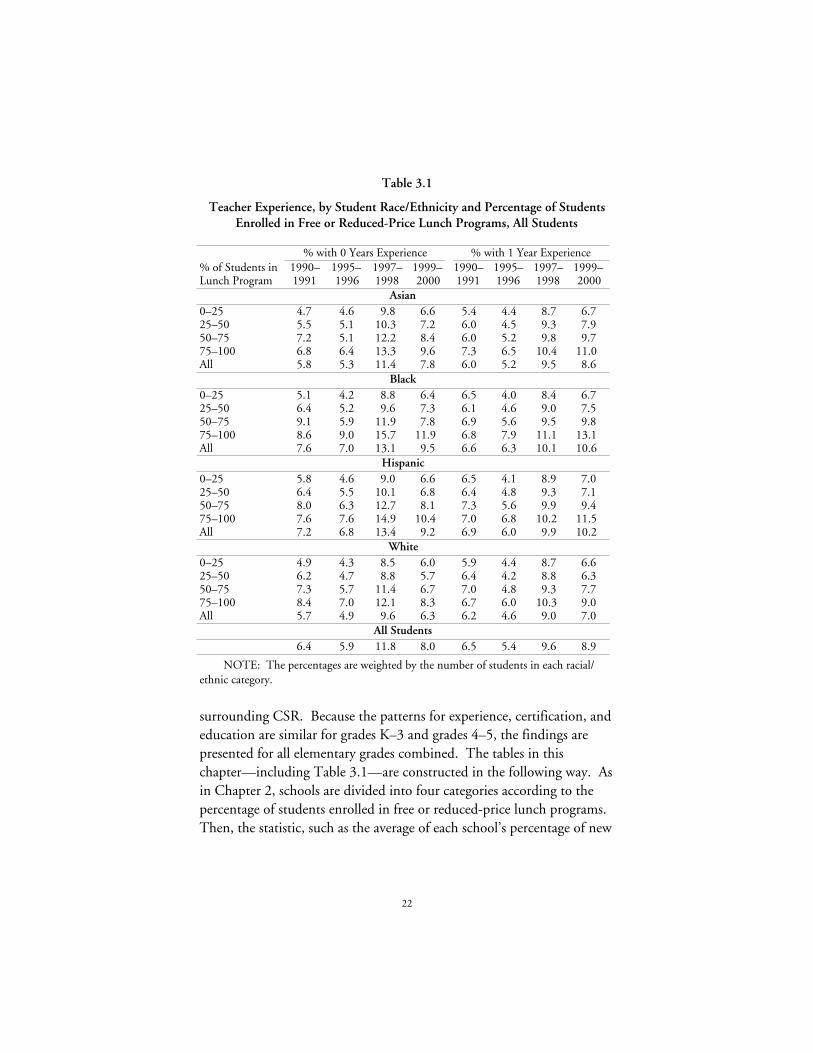
ExperienceTable 3.1 describes the percentages of new and second-year teachers
in an elementary school for the 1990s, not just the period immediately____________
7They look at middle and high schools, as well as elementary schools.8As in the previous chapter, the measure of income is the percentage of students
enrolled in free or reduced-price lunch programs.
22
Table 3.1
Teacher Experience, by Student Race/Ethnicity and Percentage of StudentsEnrolled in Free or Reduced-Price Lunch Programs, All Students
% with 0 Years Experience % with 1 Year Experience% of Students inLunch Program
1990–1991
1995–1996
1997–1998
1999–2000
1990–1991
1995–1996
1997–1998
1999–2000
Asian0–25 4.7 4.6 9.8 6.6 5.4 4.4 8.7 6.725–50 5.5 5.1 10.3 7.2 6.0 4.5 9.3 7.950–75 7.2 5.1 12.2 8.4 6.0 5.2 9.8 9.775–100 6.8 6.4 13.3 9.6 7.3 6.5 10.4 11.0All 5.8 5.3 11.4 7.8 6.0 5.2 9.5 8.6
Black0–25 5.1 4.2 8.8 6.4 6.5 4.0 8.4 6.725–50 6.4 5.2 9.6 7.3 6.1 4.6 9.0 7.550–75 9.1 5.9 11.9 7.8 6.9 5.6 9.5 9.875–100 8.6 9.0 15.7 11.9 6.8 7.9 11.1 13.1All 7.6 7.0 13.1 9.5 6.6 6.3 10.1 10.6
Hispanic0–25 5.8 4.6 9.0 6.6 6.5 4.1 8.9 7.025–50 6.4 5.5 10.1 6.8 6.4 4.8 9.3 7.150–75 8.0 6.3 12.7 8.1 7.3 5.6 9.9 9.475–100 7.6 7.6 14.9 10.4 7.0 6.8 10.2 11.5All 7.2 6.8 13.4 9.2 6.9 6.0 9.9 10.2
White0–25 4.9 4.3 8.5 6.0 5.9 4.4 8.7 6.625–50 6.2 4.7 8.8 5.7 6.4 4.2 8.8 6.350–75 7.3 5.7 11.4 6.7 7.0 4.8 9.3 7.775–100 8.4 7.0 12.1 8.3 6.7 6.0 10.3 9.0All 5.7 4.9 9.6 6.3 6.2 4.6 9.0 7.0
All Students6.4 5.9 11.8 8.0 6.5 5.4 9.6 8.9
NOTE: The percentages are weighted by the number of students in each racial/ethnic category.
surrounding CSR. Because the patterns for experience, certification, andeducation are similar for grades K–3 and grades 4–5, the findings arepresented for all elementary grades combined. The tables in thischapter—including Table 3.1—are constructed in the following way. Asin Chapter 2, schools are divided into four categories according to thepercentage of students enrolled in free or reduced-price lunch programs.Then, the statistic, such as the average of each school’s percentage of new
23
teachers, is calculated from all the schools in that lunch category. In thecase of the final row (“all students”), schools are weighted according tototal enrollment, and the reported percentage reflects the average for allstudents in that category. In the other rows, the calculations weight eachschool by the number of students in the specific ethnic group (e.g.,Asians in the case of the first five rows). Therefore, these four rowsreport the averages for students in each of the four ethnic groups.9
Differences among rows across ethnic groups within each lunch categoryprovide information on the degree to which the distributions of classsizes or teacher characteristics differ by race/ethnicity independent ofincome.
For teacher experience, a clear pattern, based on percentage ofstudents enrolled in subsidized lunch programs by 1995–1996, emerges:For all races/ethnicities, the percentage of teachers without experience orwith one year of experience increases as the percentage of studentsenrolled in subsidized lunch programs increases. Moreover, the gap inteacher experience between low-poverty and high-poverty schools widensfor nonwhites following the implementation of CSR. For students in thehighest poverty schools (75 percent of students or more enrolled insubsidized lunch programs), the increase between 1995–1996 and 1997–1998 in the number of teachers with no experience ranges from over 70percent for blacks to over 100 percent for Asians. Although thepercentage of teachers in their first year declines for all demographicgroups between 1997–1998 and 1999–2000, the rate in 1999–2000 stillexceeds that in 1990–1991 for nonwhites in high poverty schools. Animportant question is whether the higher rates of novice teachers in high-poverty schools will persist into the future.
The large discrepancies in the percentage of new teachers byrace/ethnicity and percentage of students enrolled in subsidized lunchprograms, coupled with the similarity across these groups in the averagereductions in class size (see Appendix Table B.1), are consistent with asubstantial teacher movement away from high-poverty, high-percentagenonwhite schools. Reichardt (2000) finds exactly this type of teacher____________
9The calculations assume that there is no systematic variation within schools by raceor ethnicity in the probability of having inexperienced or uncertified teachers.
24
movement within districts during the first year following CSRimplementation. However, more complete data regarding teachertransitions among schools are not available for subsequent years.
CertificationThe certification (or credentialing) process for elementary teachers in
California involves multiple steps. Currently, there are two types of fullycertified teachers.10 A professional clear certification has the mostrequirements, although legislation passed in 1998 (SB 2042) attempts tostreamline the certification process. For example, the required fifth yearof study (30 semester units beyond the completion of a bachelor’sdegree) can now be satisfied through completion of either a blendedfour-year university program or an induction program such as theBeginning Teacher Support Act (BTSA). The requirements for thepreliminary full certification, which are a prerequisite for the professionalclear credential, include the completion of the following: a bachelor’sdegree (or higher)—including the completion of an approved teachertraining program, the California Basic Educational Skills Test (CBEST),and a program or examination demonstrating subject mattercompetence. Teachers who possess either the professional clear or thepreliminary certification are considered fully certified, and the CaliforniaDepartment of Education data we use do not distinguish between thesetwo types of certification.
Teachers who do not meet these qualifications are considered notfully certified—or uncertified—teachers. There are several types ofuncertified teachers. University interns are teachers who are in theprocess of completing the required coursework for the teacher trainingprogram at a participating university. District interns have completedtheir bachelor’s degree but have not satisfied the requirements for theteacher training program. Teachers who complete either intern programbecome preliminary certified teachers.11
____________10The information on certification comes from the California Commission on
Teacher Credentialing website, www.ctc.ca.gov.11Before 1997–1998, these teachers were called trainees.
25
If a school demonstrates that it is not able to fill all its teachingpositions with certified or intern teachers, it may apply for permission tohire other uncertified teachers. There are two avenues for hiring suchteachers: emergency permits and waivers.12 Requirements for emergencyteachers are a bachelor’s degree, CBEST completion, and subject mattercompetence, through either an examination or coursework. Therequirements for a waiver teacher are not specified, but waiver teachersare expected to satisfy most of the requirements for full certification.
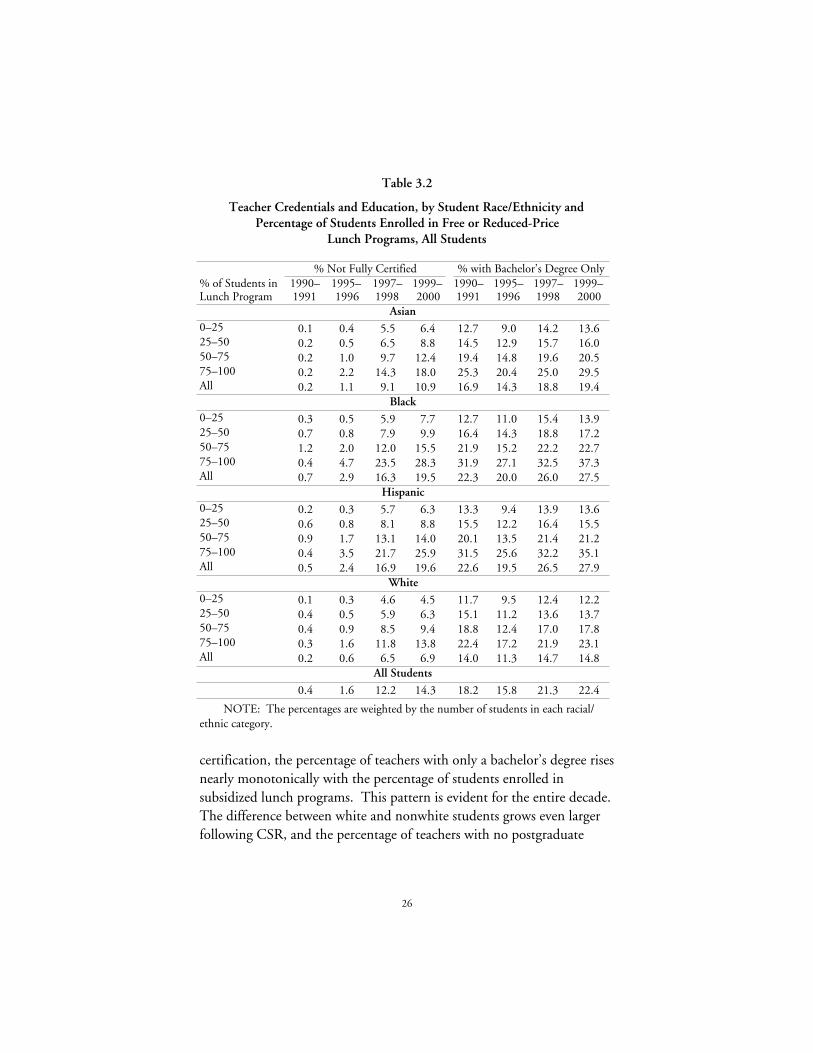
The left half of Table 3.2 reports the percentage of teachers who lackfull certification. In 1990–1991, there is virtually no systematic orderingby income. By 1995–1996, noncertification rates have begun to climb,particularly in schools with a higher percentage of students enrolled insubsidized lunch programs, although some of the increase is likely aresult of better reporting of teachers with emergency credentials. Thereis no doubt, however, that noncertification rates increase dramaticallyfollowing CSR. In 1997–1998, the noncertification rates were between4.6 and 5.9 percent for low-poverty schools (0 to 25 percent of studentsenrolled in subsidized lunch programs), compared with a range of 11.8to 23.5 percent for high-poverty schools (75 percent or more enrolled insubsidized lunch programs). Similar differences remain in 1999–2000,with even higher percentages of noncertified teachers in all categories.For both 1997–1998 and 1999–2000, nearly all teachers not fullycertified are emergency or waiver teachers, whereas only a small portionare interns, compared with a roughly even split between the two groupsin 1995–1996.
Within each income category, the increases in noncertification ratesfrom 1995–1996 to 1999–2000 for blacks and Hispanics are noticeablyhigher than for Asians and whites. In 1999–2000, over 25 percent ofblack and Hispanic students in high-poverty schools have teachers wholack full certification.
EducationThe close link between education and certification described above
is reflected in the right half of Table 3.2. Similar to experience and____________
12A preintern teacher is a type of emergency teacher.
26
Table 3.2
Teacher Credentials and Education, by Student Race/Ethnicity andPercentage of Students Enrolled in Free or Reduced-Price
Lunch Programs, All Students
% Not Fully Certified % with Bachelor’s Degree Only% of Students inLunch Program
1990–1991
1995–1996
1997–1998
1999–2000
1990–1991
1995–1996
1997–1998
1999–2000
Asian0–25 0.1 0.4 5.5 6.4 12.7 9.0 14.2 13.625–50 0.2 0.5 6.5 8.8 14.5 12.9 15.7 16.050–75 0.2 1.0 9.7 12.4 19.4 14.8 19.6 20.575–100 0.2 2.2 14.3 18.0 25.3 20.4 25.0 29.5All 0.2 1.1 9.1 10.9 16.9 14.3 18.8 19.4
Black0–25 0.3 0.5 5.9 7.7 12.7 11.0 15.4 13.925–50 0.7 0.8 7.9 9.9 16.4 14.3 18.8 17.250–75 1.2 2.0 12.0 15.5 21.9 15.2 22.2 22.775–100 0.4 4.7 23.5 28.3 31.9 27.1 32.5 37.3All 0.7 2.9 16.3 19.5 22.3 20.0 26.0 27.5
Hispanic0–25 0.2 0.3 5.7 6.3 13.3 9.4 13.9 13.625–50 0.6 0.8 8.1 8.8 15.5 12.2 16.4 15.550–75 0.9 1.7 13.1 14.0 20.1 13.5 21.4 21.275–100 0.4 3.5 21.7 25.9 31.5 25.6 32.2 35.1All 0.5 2.4 16.9 19.6 22.6 19.5 26.5 27.9
White0–25 0.1 0.3 4.6 4.5 11.7 9.5 12.4 12.225–50 0.4 0.5 5.9 6.3 15.1 11.2 13.6 13.750–75 0.4 0.9 8.5 9.4 18.8 12.4 17.0 17.875–100 0.3 1.6 11.8 13.8 22.4 17.2 21.9 23.1All 0.2 0.6 6.5 6.9 14.0 11.3 14.7 14.8
All Students
0.4 1.6 12.2 14.3 18.2 15.8 21.3 22.4
NOTE: The percentages are weighted by the number of students in each racial/ethnic category.
certification, the percentage of teachers with only a bachelor’s degree risesnearly monotonically with the percentage of students enrolled insubsidized lunch programs. This pattern is evident for the entire decade.The difference between white and nonwhite students grows even largerfollowing CSR, and the percentage of teachers with no postgraduate
27
education is far larger in high-poverty schools for nonwhite students.Over one-third of the teachers for black and Hispanic students, alongwith nearly 30 percent for Asian students, lack any education beyond thebachelor’s degree. The broad-based trend toward fewer teachers withonly a bachelor’s degree observed between 1990–1991 and 1995–1996for all demographic categories is nowhere to be seen in 1999–2000.
Teacher Characteristics, by Community TypeThe previous tables revealed dramatic changes in experience,
certification, and education trends following the implementation ofCSR. Not only did average teacher quality as measured by experience,certification, and education decline, but differences by studentrace/ethnicity and socioeconomic composition tended to widen. Animportant question is whether urban districts fared worse than therest of the state, even compared with other districts with similar studentdemographics. There is a widespread belief that cumbersomebureaucracies, poor facilities, high rates of crime and poverty, relativelylow salaries, and many other factors combine to inhibit urban districtsfrom attracting and retaining high-quality teachers. The economic boomconcentrated in the large metropolitan areas that raised salaries muchmore in the private sector than in the public schools and the concomitantincrease in housing prices likely exacerbated the teacher hiring difficultiesfaced by many of these districts.
Table 3.3 reports trends in experience, certification, and educationby community type. Because of the smaller sample sizes and the highcorrelation between race/ethnicity and income within each communitytype, the table presents results separated only by race/ethnicity.Distributions also separated by income are presented in Appendix TablesB.5 and B.6. Similar to the case for all schools taken as a whole (Tables3.1 and 3.2), black and Hispanic students in each community type haveteachers with less experience, certification, and education than do whiteand Asian students. Table 3.3 shows that the experience distributions inurban schools are similar to the experience distributions in suburban andrural public schools, with the exception of a larger increase in theproportion of inexperienced teachers for white students.
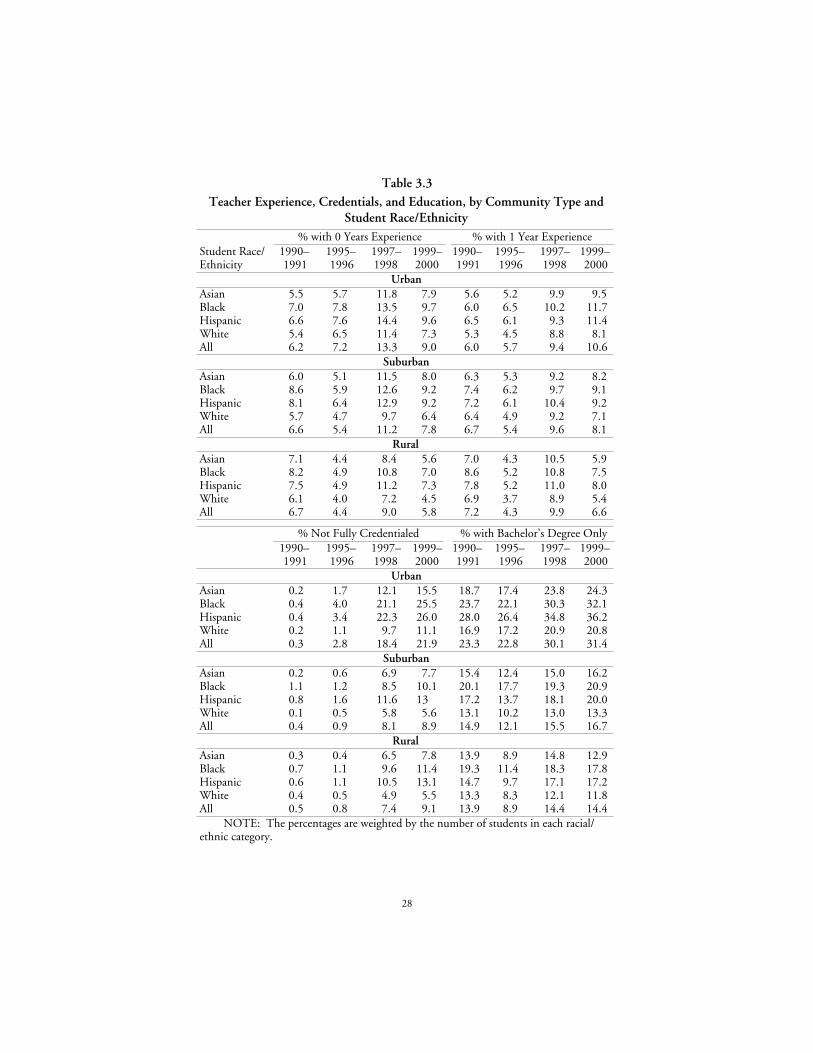
28
Table 3.3Teacher Experience, Credentials, and Education, by Community Type and
Student Race/Ethnicity% with 0 Years Experience % with 1 Year Experience
Student Race/Ethnicity
1990–1991
1995–1996
1997–1998
1999–2000
1990–1991
1995–1996
1997–1998
1999–2000
UrbanAsian 5.5 5.7 11.8 7.9 5.6 5.2 9.9 9.5Black 7.0 7.8 13.5 9.7 6.0 6.5 10.2 11.7Hispanic 6.6 7.6 14.4 9.6 6.5 6.1 9.3 11.4White 5.4 6.5 11.4 7.3 5.3 4.5 8.8 8.1All 6.2 7.2 13.3 9.0 6.0 5.7 9.4 10.6
SuburbanAsian 6.0 5.1 11.5 8.0 6.3 5.3 9.2 8.2Black 8.6 5.9 12.6 9.2 7.4 6.2 9.7 9.1Hispanic 8.1 6.4 12.9 9.2 7.2 6.1 10.4 9.2White 5.7 4.7 9.7 6.4 6.4 4.9 9.2 7.1All 6.6 5.4 11.2 7.8 6.7 5.4 9.6 8.1
RuralAsian 7.1 4.4 8.4 5.6 7.0 4.3 10.5 5.9Black 8.2 4.9 10.8 7.0 8.6 5.2 10.8 7.5Hispanic 7.5 4.9 11.2 7.3 7.8 5.2 11.0 8.0White 6.1 4.0 7.2 4.5 6.9 3.7 8.9 5.4All 6.7 4.4 9.0 5.8 7.2 4.3 9.9 6.6
% Not Fully Credentialed % with Bachelor’s Degree Only1990–1991
1995–1996
1997–1998
1999–2000
1990–1991
1995–1996
1997–1998
1999–2000
UrbanAsian 0.2 1.7 12.1 15.5 18.7 17.4 23.8 24.3Black 0.4 4.0 21.1 25.5 23.7 22.1 30.3 32.1Hispanic 0.4 3.4 22.3 26.0 28.0 26.4 34.8 36.2White 0.2 1.1 9.7 11.1 16.9 17.2 20.9 20.8All 0.3 2.8 18.4 21.9 23.3 22.8 30.1 31.4
SuburbanAsian 0.2 0.6 6.9 7.7 15.4 12.4 15.0 16.2Black 1.1 1.2 8.5 10.1 20.1 17.7 19.3 20.9Hispanic 0.8 1.6 11.6 13 17.2 13.7 18.1 20.0White 0.1 0.5 5.8 5.6 13.1 10.2 13.0 13.3All 0.4 0.9 8.1 8.9 14.9 12.1 15.5 16.7
RuralAsian 0.3 0.4 6.5 7.8 13.9 8.9 14.8 12.9Black 0.7 1.1 9.6 11.4 19.3 11.4 18.3 17.8Hispanic 0.6 1.1 10.5 13.1 14.7 9.7 17.1 17.2White 0.4 0.5 4.9 5.5 13.3 8.3 12.1 11.8All 0.5 0.8 7.4 9.1 13.9 8.9 14.4 14.4
NOTE: The percentages are weighted by the number of students in each racial/ethnic category.
29
The results in Table 3.3 for certification and education showsomewhat more pronounced changes in urban schools than in all publicschools (Table 3.2). For all racial and ethnic groups in 1997–1998 and1999–2000, urban schools have higher percentages of noncertifiedteachers and teachers with no graduate education than do other schools.For example, 26 percent of urban Hispanic students have teachers notfully certified in comparison with 19.6 percent for all Hispanics as shownin Table 3.2. Appendix Table B.6 suggests that this gap increases for allraces/ethnicities as the percentage of students enrolled in subsidizedlunch programs rises, showing that it is not driven by student incomedifferences across community types. Postgraduate education rates arealso lower in urban districts for schools of a given demographiccomposition. Thus, it appears that being in an urban district representsan additional burden schools must overcome in attracting and retaininghighly qualified teachers.
Trends in the Six Largest School DistrictsThe difficulties urban schools face in competing for teachers are
likely to be even more severe in the largest districts. This sectionexamines changes in teacher characteristics by student demographicgroup for each of the six largest districts in California as of 1990–1991.Again, because of the smaller sample sizes and the high correlationbetween poverty and racial/ethnic composition, the tables divide schoolsonly by race/ethnicity.13
Table 3.4 shows changes in the percentages of teachers with zero orone year of experience. The share of inexperienced teachers in some ofCalifornia’s largest districts has risen to an alarming level. In 1999–2000, more than 30 percent of the teachers for black and Hispanicstudents in San Diego were in their first or second year. Almost one-quarter of the teachers for black and Hispanic students in Los Angeles,Long Beach, Oakland, and San Francisco were in their first or secondyear. In sharp contrast, Asian and white students in these districts—aswell as all students in Fresno—have rates of inexperienced teachers quite____________
13The results separated by income are somewhat more dramatic but reveal the sameoverall patterns as those shown here.
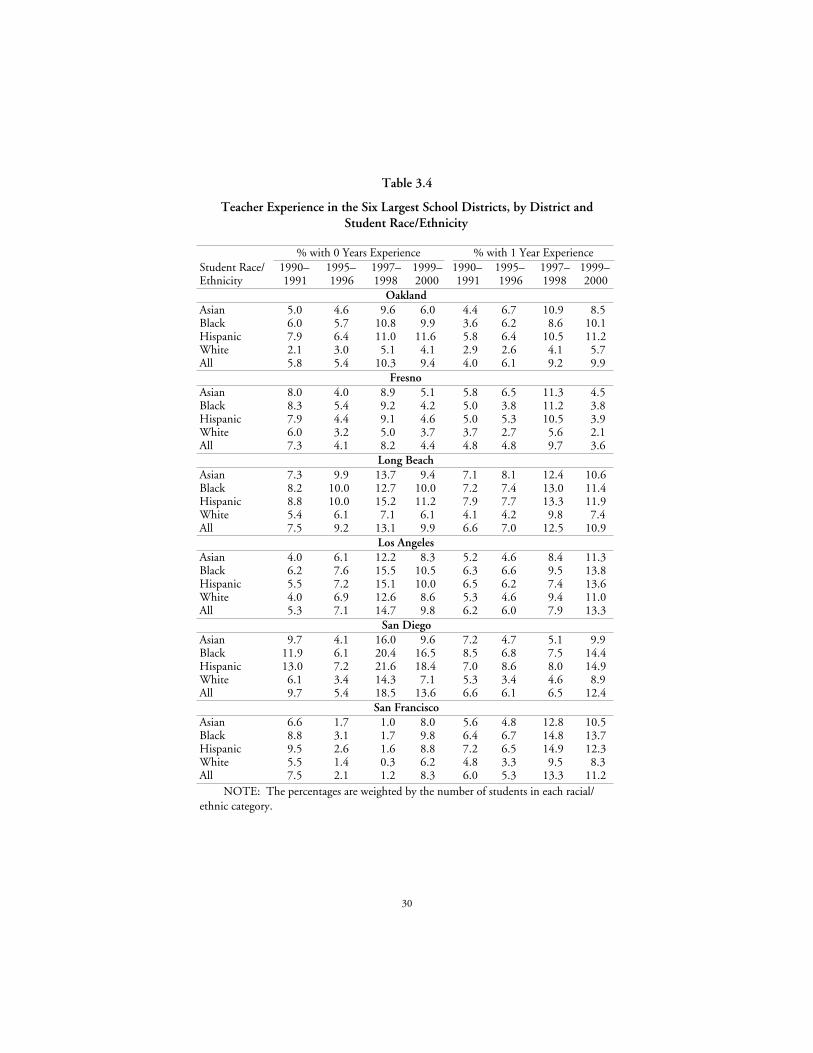
30
Table 3.4
Teacher Experience in the Six Largest School Districts, by District andStudent Race/Ethnicity
% with 0 Years Experience % with 1 Year ExperienceStudent Race/Ethnicity
1990–1991
1995–1996
1997–1998
1999–2000
1990–1991
1995–1996
1997–1998
1999–2000
OaklandAsian 5.0 4.6 9.6 6.0 4.4 6.7 10.9 8.5Black 6.0 5.7 10.8 9.9 3.6 6.2 8.6 10.1Hispanic 7.9 6.4 11.0 11.6 5.8 6.4 10.5 11.2White 2.1 3.0 5.1 4.1 2.9 2.6 4.1 5.7All 5.8 5.4 10.3 9.4 4.0 6.1 9.2 9.9
FresnoAsian 8.0 4.0 8.9 5.1 5.8 6.5 11.3 4.5Black 8.3 5.4 9.2 4.2 5.0 3.8 11.2 3.8Hispanic 7.9 4.4 9.1 4.6 5.0 5.3 10.5 3.9White 6.0 3.2 5.0 3.7 3.7 2.7 5.6 2.1All 7.3 4.1 8.2 4.4 4.8 4.8 9.7 3.6
Long BeachAsian 7.3 9.9 13.7 9.4 7.1 8.1 12.4 10.6Black 8.2 10.0 12.7 10.0 7.2 7.4 13.0 11.4Hispanic 8.8 10.0 15.2 11.2 7.9 7.7 13.3 11.9White 5.4 6.1 7.1 6.1 4.1 4.2 9.8 7.4All 7.5 9.2 13.1 9.9 6.6 7.0 12.5 10.9
Los AngelesAsian 4.0 6.1 12.2 8.3 5.2 4.6 8.4 11.3Black 6.2 7.6 15.5 10.5 6.3 6.6 9.5 13.8Hispanic 5.5 7.2 15.1 10.0 6.5 6.2 7.4 13.6White 4.0 6.9 12.6 8.6 5.3 4.6 9.4 11.0All 5.3 7.1 14.7 9.8 6.2 6.0 7.9 13.3
San DiegoAsian 9.7 4.1 16.0 9.6 7.2 4.7 5.1 9.9Black 11.9 6.1 20.4 16.5 8.5 6.8 7.5 14.4Hispanic 13.0 7.2 21.6 18.4 7.0 8.6 8.0 14.9White 6.1 3.4 14.3 7.1 5.3 3.4 4.6 8.9All 9.7 5.4 18.5 13.6 6.6 6.1 6.5 12.4
San FranciscoAsian 6.6 1.7 1.0 8.0 5.6 4.8 12.8 10.5Black 8.8 3.1 1.7 9.8 6.4 6.7 14.8 13.7Hispanic 9.5 2.6 1.6 8.8 7.2 6.5 14.9 12.3White 5.5 1.4 0.3 6.2 4.8 3.3 9.5 8.3All 7.5 2.1 1.2 8.3 6.0 5.3 13.3 11.2
NOTE: The percentages are weighted by the number of students in each racial/ethnic category.
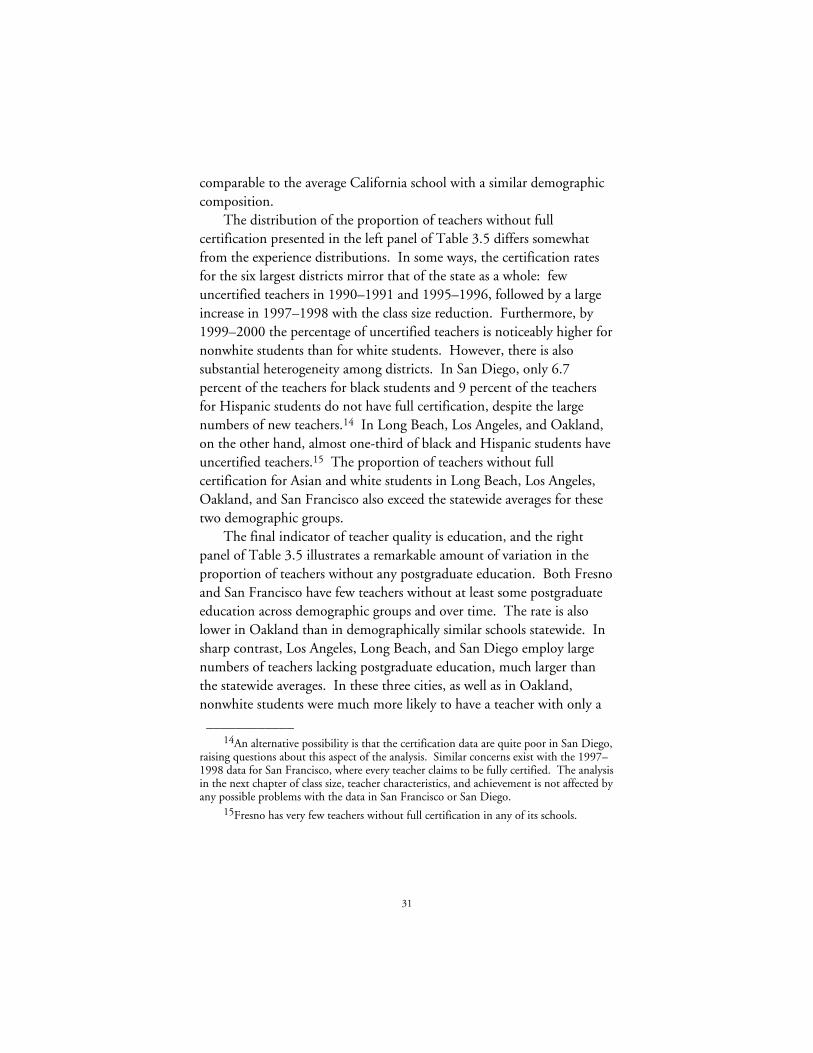
31
comparable to the average California school with a similar demographiccomposition.
The distribution of the proportion of teachers without fullcertification presented in the left panel of Table 3.5 differs somewhatfrom the experience distributions. In some ways, the certification ratesfor the six largest districts mirror that of the state as a whole: fewuncertified teachers in 1990–1991 and 1995–1996, followed by a largeincrease in 1997–1998 with the class size reduction. Furthermore, by1999–2000 the percentage of uncertified teachers is noticeably higher fornonwhite students than for white students. However, there is alsosubstantial heterogeneity among districts. In San Diego, only 6.7percent of the teachers for black students and 9 percent of the teachersfor Hispanic students do not have full certification, despite the largenumbers of new teachers.14 In Long Beach, Los Angeles, and Oakland,on the other hand, almost one-third of black and Hispanic students haveuncertified teachers.15 The proportion of teachers without fullcertification for Asian and white students in Long Beach, Los Angeles,Oakland, and San Francisco also exceed the statewide averages for thesetwo demographic groups.
The final indicator of teacher quality is education, and the rightpanel of Table 3.5 illustrates a remarkable amount of variation in theproportion of teachers without any postgraduate education. Both Fresnoand San Francisco have few teachers without at least some postgraduateeducation across demographic groups and over time. The rate is alsolower in Oakland than in demographically similar schools statewide. Insharp contrast, Los Angeles, Long Beach, and San Diego employ largenumbers of teachers lacking postgraduate education, much larger thanthe statewide averages. In these three cities, as well as in Oakland,nonwhite students were much more likely to have a teacher with only a____________
14An alternative possibility is that the certification data are quite poor in San Diego,raising questions about this aspect of the analysis. Similar concerns exist with the 1997–1998 data for San Francisco, where every teacher claims to be fully certified. The analysisin the next chapter of class size, teacher characteristics, and achievement is not affected byany possible problems with the data in San Francisco or San Diego.
15Fresno has very few teachers without full certification in any of its schools.
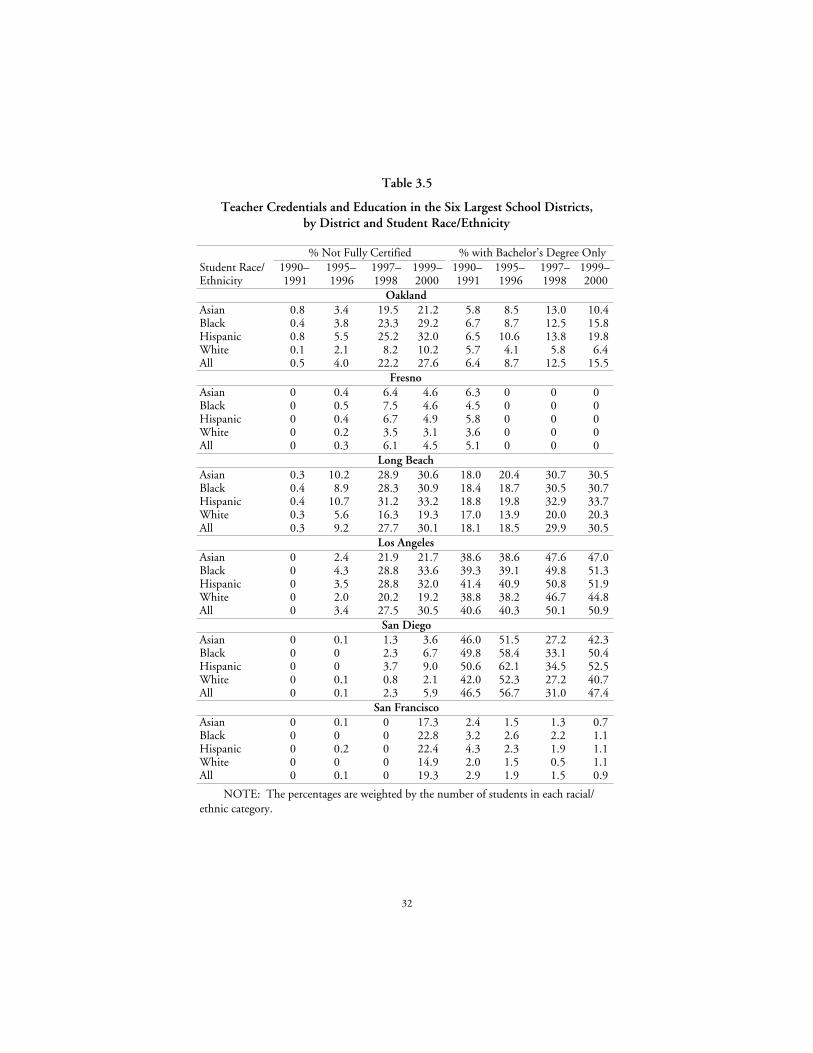
32
Table 3.5
Teacher Credentials and Education in the Six Largest School Districts,by District and Student Race/Ethnicity
% Not Fully Certified % with Bachelor’s Degree OnlyStudent Race/Ethnicity
1990–1991
1995–1996
1997–1998
1999–2000
1990–1991
1995–1996
1997–1998
1999–2000
OaklandAsian 0.8 3.4 19.5 21.2 5.8 8.5 13.0 10.4Black 0.4 3.8 23.3 29.2 6.7 8.7 12.5 15.8Hispanic 0.8 5.5 25.2 32.0 6.5 10.6 13.8 19.8White 0.1 2.1 8.2 10.2 5.7 4.1 5.8 6.4All 0.5 4.0 22.2 27.6 6.4 8.7 12.5 15.5
FresnoAsian 0 0.4 6.4 4.6 6.3 0 0 0Black 0 0.5 7.5 4.6 4.5 0 0 0Hispanic 0 0.4 6.7 4.9 5.8 0 0 0White 0 0.2 3.5 3.1 3.6 0 0 0All 0 0.3 6.1 4.5 5.1 0 0 0
Long BeachAsian 0.3 10.2 28.9 30.6 18.0 20.4 30.7 30.5Black 0.4 8.9 28.3 30.9 18.4 18.7 30.5 30.7Hispanic 0.4 10.7 31.2 33.2 18.8 19.8 32.9 33.7White 0.3 5.6 16.3 19.3 17.0 13.9 20.0 20.3All 0.3 9.2 27.7 30.1 18.1 18.5 29.9 30.5
Los AngelesAsian 0 2.4 21.9 21.7 38.6 38.6 47.6 47.0Black 0 4.3 28.8 33.6 39.3 39.1 49.8 51.3Hispanic 0 3.5 28.8 32.0 41.4 40.9 50.8 51.9White 0 2.0 20.2 19.2 38.8 38.2 46.7 44.8All 0 3.4 27.5 30.5 40.6 40.3 50.1 50.9
San DiegoAsian 0 0.1 1.3 3.6 46.0 51.5 27.2 42.3Black 0 0 2.3 6.7 49.8 58.4 33.1 50.4Hispanic 0 0 3.7 9.0 50.6 62.1 34.5 52.5White 0 0.1 0.8 2.1 42.0 52.3 27.2 40.7All 0 0.1 2.3 5.9 46.5 56.7 31.0 47.4
San FranciscoAsian 0 0.1 0 17.3 2.4 1.5 1.3 0.7Black 0 0 0 22.8 3.2 2.6 2.2 1.1Hispanic 0 0.2 0 22.4 4.3 2.3 1.9 1.1White 0 0 0 14.9 2.0 1.5 0.5 1.1All 0 0.1 0 19.3 2.9 1.9 1.5 0.9
NOTE: The percentages are weighted by the number of students in each racial/ethnic category.
33
bachelor’s degree than were white students. These differences, bothbetween and within cities, persist throughout the decade.
SummaryThe tables in this chapter demonstrate both the dramatic changes in
teacher characteristics following class size reduction and the importanceof race and ethnicity in the distribution of teacher characteristics.Perhaps most important, schools with high percentages of nonwhite andlow-income students were much more likely to have inexperiencedteachers who lack full certification and postgraduate schooling in 1999–2000 than in 1990–1991, and the racial/ethnic and income gaps clearlywidened during the decade. Urban school districts appeared to fareworse than the rest of the state, although there was substantial variationamong the six largest districts in the changes in the respective teachercharacteristics.
These changes in teacher characteristics are only as important as thelink between these characteristics and effectiveness in the classroom. Thenext chapter provides information on the importance of these shifts inteacher characteristics by investigating the relationship betweenachievement, class size, and the observable measures of teacher quality.Yet it is important to recognize that teacher quality is determined bymyriad factors, of which most are quite difficult to measure. Therefore,the empirical analysis also attempts to gain a better understanding ofadditional changes in teacher quality not captured by the observablecharacteristics.

35
4. CSR and StudentAchievement
IntroductionIn this chapter, we look at the effect of CSR on student achievement
in third grade. In particular, our analysis measures two important effectsof CSR on achievement: effects from the reduction in class size andeffects from the change in the teacher force. One main finding of theTennessee STAR experiment was that, all else equal, smaller classes areassociated with higher achievement. In California, though, all else wasnot equal. Chapter 3 describes the dramatic changes in teachercharacteristics following the reduction of average class size, particularlyfor nonwhite students. This increase in the number of inexperienced anduncertified teachers is to be expected when hiring many new teachers,and the negative effect of this increase should disappear as these newteachers acquire experience and certification.
However, CSR likely had a deeper and more pervasive effect on theteacher workforce than simply increasing the number of inexperiencedand uncertified teachers. Thousands of additional teaching positionswere created, but thousands of additional teachers were not. Thus, muchof the increase in the number of teachers consists of individuals whowould not have been hired as teachers in the absence of CSR. If theseteachers are less capable on average and continue to be less capable evenafter they have acquired additional experience, certification, or education,then CSR has the potential to create a long-term decline in the averageeffectiveness of California’s teacher force.
Because the relationship between class size, teacher quality, andstudent achievement is complex, our analysis provides several estimates ofthe effect of smaller classes. Some estimates combine the effect of smallerclasses and new teachers, whereas others provide separate estimates of
36
class size and teacher characteristics. We also investigate whether therelationship between class size and achievement depends on when schoolsimplemented CSR. Once schools have implemented CSR, there is nolonger a need to hire additional teachers, and the small year-to-yearfluctuations in class size resulting from changes in enrollment areunlikely to be correlated with systematic changes in teacher quality. Onthe other hand, the pre-CSR/post-CSR difference in class size isaccompanied by the hiring of additional teachers. Therefore, estimatedeffects of smaller classes from these schools are likely to capture anydecline in instructional effectiveness that is linked to the magnitude ofthe reduction in class size needed to satisfy CSR.
Estimation of Class Size EffectThe easiest programs to evaluate are the ones that can be observed as
random experiments. In the context of CSR, the ideal experiment (forthe purposes of evaluation) would be to randomly assign students to twosystems of schools that are identical in every relevant aspect except for theenactment of class size reduction. One set of schools would reduce classsize and the other would not. Those reducing class size would have tohire large numbers of additional teachers and the others would not. Animportant part of the experiment would be that the implementation ofCSR could not affect the schools not reducing class size in any way. Forexample, teachers could not switch from one set of schools to another.Under these conditions, a comparison of the change in academicperformance in the two groups of schools over a period of years wouldprovide a valid measure of the total effect of class size reduction: theeffect of smaller classes and the effect of hiring new teachers.
To conduct a statewide experiment in a state as large as California isvirtually impossible to conceptualize, let alone undertake. In fact, such acomprehensive study of class size reduction has never been attempted.Rather, virtually all research focuses solely on the effects of smaller classesholding everything else, including teacher quality, constant. Althoughnot comprehensive, this research still provides important and policy-relevant information.
The general problem that must be addressed in research on class sizeis that class size differences tend to be associated with other factors that
37
also affect achievement. Much of the problem comes from the fact thatfamilies choose where to live, what schools their children should attend,and in some cases which teacher they prefer in a particular grade. At thesame time, principals and other school personnel assign students andteachers to classrooms to achieve a variety of objectives. These choicesmake it very difficult to separate the causal effect of class size from theconfounding influences of other family and school factors.
Consider family decisions first. Families with greater resources andcommitment to schooling tend to choose districts and schools withsmaller classes or, in this case, those more likely to implement CSR in atimely manner. Thus, the finding that achievement is higher in classeswith fewer students or in schools that adopted CSR earlier may be drivenprimarily by family background. The key point is that these studentswould tend to do better regardless of class size.
On the other hand, what if policymakers provide additionalresources to reduce class size in schools with a high percentage ofdisadvantaged students? A finding that students in larger classesoutperform those in smaller classes would reflect preexisting differencesin student preparation rather than perverse effects of class size. Unlessappropriate statistical methods are used, it is not possible to identify thecontribution of class size or teacher characteristics in a world in whichthe distribution of students in classrooms and schools is a product ofnumerous choices by students, parents, teachers, principals, and centraladministrators. Because the California administrative data and mostother datasets contain only limited information on students and teachers,it is highly unlikely that the included variables are able to capture allrelevant differences among schools.
Researchers have thus turned to social experiments and innovativestatistical methods to identify the causal effect of smaller classes holdingteacher quality constant. The most prominent example of such an analysisis the Tennessee STAR experiment. Students were randomly assigned tosmall classes (treatments) or larger classes (controls). A comparisonbetween achievement in large and small classes provides an estimate ofthe benefits of smaller classes but provides no information on changes inteacher quality. Krueger (1999) and Krueger and Whitmore (2001) findthat smaller class sizes in kindergarten and first grade have a significant
38
and lasting effect on achievement. However, Hoxby (2000) discussespotential problems with the randomization of both students andteachers, thereby raising some questions about the validity of the results.1
Recent studies by Angrist and Lavy (1999), Hoxby (2000), andRivkin, Hanushek, and Kain (2000) use quasi-experiments to learn moreabout the effects of class size on achievement (in Israel, Connecticut, andTexas, respectively). Although these studies do not use true experiments,they are able to isolate changes in class size from other changes in theclassroom (and school). Except for Hoxby (2000), the studies find thatsmaller classes significantly increase achievement in the early grades(grade five and below), and the effects tend to be larger for lower-incomestudents. Because Hoxby’s data lead to bias against finding an effect ofsmaller classes, the overall pattern of results suggests that smaller classesare associated with higher achievement, holding all else, including teacherquality, constant.2
Existing Research on CSRThe implementation of CSR in California is a far cry from an ideal
experiment. Every school in California was eligible for class sizereduction, starting with the 1996–1997 school year. There were largewithin- and between-school movements of teachers in schools thatimplemented CSR, as well as in those that did not. Statewide testing didnot begin until the spring of the 1997–1998 school year. By this time,most schools had implemented CSR in the first and second grades.However, schools did vary in their timing of CSR in third grade. Nearlyone-third of the schools had not implemented CSR in third grade as of1997–1998. Therefore, it is possible to compare achievement in schoolsthat reduced class sizes in third grade to achievement in those that did not.____________
1See also Ehrenberg et al. (2001) for additional discussion of the Tennessee STARexperiment.
2In the Connecticut data used by Hoxby (2000), tests are administered in the fall.Therefore, the tests are regressed on class size for the previous school year. If a studentmoved into the school or district for the current academic year, he or she would cause anerroneous measure of class size. Such measurement error attenuates the estimates of classsize effects on achievement.
39
That is precisely the approach taken by the CSR ResearchConsortium, which recognized that there may be other differencesbetween early and late adopters of CSR. The consortium 2000 reportuses student demographic information and school average fifth-gradescores to control for important differences between early and late CSRadopters that also affect achievement.3 The use of fifth-grade test scores islogical because fifth-grade achievement captures many of the non–classsize differences between schools in achievement. Essentially this methodcompares the difference between third- and fifth-grade test scores inschools that adopted CSR to the difference in schools that had not yetadopted CSR. A finding that third-grade scores are higher relative tofifth-grade scores in schools that implemented CSR earlier providesevidence in support of the notion that smaller classes raise achievement.
The validity of this method rests on the assumption that the timingof CSR implementation did not affect achievement in fifth grade. Theconsortium finds substantial increases in the percentage of fourth- andfifth-grade teachers with little or no experience or lacking fullcertification following the implementation of CSR, compared with muchsmaller increases for secondary school teachers. Since the total numberof fourth- and fifth-grade teachers remained relatively constant, the mostlogical explanation for this increase is that many fourth- and fifth-gradeteachers switched to an earlier grade to take advantage of the smallerclasses.4 The consortium assumes that these changes had no effect onstudent achievement in fifth grade, in spite of mounting evidence(mentioned above) and the conventional wisdom that novice teachers areassociated with lower student achievement.
Instead, the consortium approach attributes any changes in fifth-grade achievement to CSR in third grade. Any decrease in studentachievement in fifth grade resulting from a deterioration in instructionaleffectiveness would increase the gap between third-grade and fifth-grade____________
3See Bohrnstedt and Stecher (2000). They use the same approach in their 1999report, except that they use fourth-grade test scores rather than fifth-grade test scores (seeBohrnstedt and Stecher, 1999).
4See Reichardt (2000).
40
achievement in schools that implemented CSR in third grade, therebyraising the estimated effect of CSR on achievement in third grade.Consequently, this approach cannot distinguish changes in third-gradeachievement caused by smaller third-grade classes from changes in fifth-grade achievement that resulted from a decline in fifth-grade teacherquality.
Another limitation of the consortium approach is that it considersachievement in only one school year. For example, the 2000 report usesachievement data only from the 1998–1999 school year. Therefore, thistechnique is unable to separate the effects of CSR in previous years fromother effects such as teacher experience.
The consortium’s February 2002 report uses multiple years of dataand finds little relationship between length of exposure to CSR andachievement. Unlike previous reports, this consortium report does notuse any data at the school or student level; all data are at the state level.The analysis contains a small sample size of fewer than 20 observations,making it very hard to find a systematic relationship between CSR andachievement. The next consortium report, available in the summer of2002, will use school- and student-level data.
Empirical ApproachOur approach in this report attempts to overcome some of the
impediments to the estimation of the effects of CSR and to gain a betterunderstanding of both the pure effects of smaller classes in Californiapublic schools and the effects that occurred as a result of changes in theteaching force throughout the state. Rather than comparing the effect ofCSR across schools, our analysis identifies class size effects through acomparison of the changes in average achievement and class size overtime within schools.5 We use data for third-grade students in 1997–1998 and 1999–2000. The empirical analysis focuses on test scoreperformance in third grade as measured by the proportion of students(excluding ELs) in a school who exceed the national median test score for____________
5This approach is similar to the one used by Hoxby (2000).
41
that year.6 The regression analysis controls for differences in studentdemographic composition, including percentage enrolled in subsidizedlunch programs, percentage black, percentage Hispanic, percentageAsian, and percentage classified as EL. Appendix C provides a moreformal discussion of the method used to identify the effects of class sizeand teacher characteristics on achievement.
This approach ignores achievement differences among schools,thereby avoiding an important source of contamination. It uses only thechanges over time in achievement, class size, and teacher characteristics ateach school to identify the effects of these variables. For example, if theaverage gain in achievement between 1997–1998 and 1999–2000 werelarger for schools that also experienced larger average reductions in classsize, our approach would estimate a positive effect of smaller classes onachievement.7
To address the fact that a major class size reduction such as thatundertaken by California almost certainly alters the composition andaverage quality of the teaching force, each model is estimated twice. Thefirst set of estimates comes from a model that does not control for anyteacher characteristics. The class size estimates in this model representthe comprehensive (or the “gross”) effect of the change in class size,including the effect of class size that we can attribute to teacher attributessuch as experience. The second set of estimates comes from a model thataccounts for teacher experience, certification, and education. The classsize estimates in this model do not contain the effects of teacherattributes, because those characteristics appear explicitly in the model. Inother words, these estimates are not comprehensive; they are the “net”effects of class size.
The model providing the “net” estimates of class size also providesestimates of the effect of each teacher characteristic on studentachievement. The teacher characteristics include the percentage ofnovice teachers, the percentage of second-year teachers, the percentage of____________
6Individual-level test score data are not available for multiple years. Similarly, theaverage (at the school level) of individual student test scores is not separately available fornon-EL students in 1997–1998.
7This method is actually somewhat more complicated in that it controls fordifferences in other variables included in the regressions.
42
uncertified teachers, and the percentage of teachers with no postgraduateeducation. As with class size, we consider only the within-school changein each of these teacher characteristics and its association with the within-school change in student achievement.
Because test score results for individual students are not available,separate school performance measures for each racial/ethnic or incomegroup cannot be calculated.8 Nevertheless, it is possible to examinewhether the effects of class size and teacher characteristics vary accordingto student demographic composition. Most evidence suggests that classsize effects are somewhat larger for lower-income students, althoughteacher quality changes may counteract any larger effects.9
It is also possible to separate the test scores of EL and non-ELstudents. We do not include test scores for EL students for two reasons.First, because the test is given in English, the test scores are poorindicators of student performance for students with little or noknowledge of English. Students who cannot even read the questions areunlikely to answer them correctly, regardless of academic ability.Second, most EL students were exempted from the test in 1997–1998,but by 1999–2000 all students (EL or not) were expected to take thetest to calculate the school’s Academic Performance Index. Thisdramatic change in the composition of EL test-takers makes it verydifficult to compare the test scores of any group containing EL studentsacross time.
Our focus on academic achievement as measured by standardizedtests does not imply that this is the only outcome of interest. At theelementary school level, these tests are the only measure of achievementthat is readily available in California. Plus, they are a more objective____________
8Student- or classroom-level data are not available; therefore, achievement, class size,teacher characteristics, and student demographics are measured at the grade level, withthe exception of the percentage enrolled in subsidized lunch programs and the percentageclassified as EL, both of which are measured at the school level. Although percentage ELat the grade level is available, percentage EL at the school level is preferred. Becauseprincipals may systematically assign students to classes partly on the basis of academicperformance, classroom-level data would be problematic even if it were available.
9See Summers and Wolfe (1977), Krueger (1999), Angrist and Lavy (1999), andRivkin, Hanushek, and Kain (2000).
43
measure of achievement across schools and districts than are subjectivemeasures such as teacher evaluations or grades.
One important issue that cannot be resolved is the inability to followindividual students over time. Given the substantial amount of mobilityin California, the third-grade cohort in a school contains many studentswho were not in second grade in that school in the previous year. Theresult is that the estimated effects of class size and teacher characteristicscapture the current year effect plus some portion of the effect from prioryears.10 Therefore, these estimates should not be treated as either thesingle-year effect of each variable or the sum total of the cumulativeeffects beginning with kindergarten or first grade.
FindingsThe estimated benefits of a ten-student reduction in class size in
terms of gains in third-grade mathematics and reading scores are derivedfrom the regression results that are reported in Appendix C.11 Thesebenefits are presented in a series of figures that depict the estimatedchange in the percentage of non-EL students who exceed the nationalmedian test score in a particular subject following a ten-studentreduction in class size.
Following the presentation of the basic results, the analysisinvestigates the possibility that the benefits of smaller classes differ byracial/ethnic or income composition at the school level. Estimates arecomputed for the state as a whole, by community type, for Los Angeles,and for the five next largest districts combined.
The final portion of the empirical analysis attempts to gainadditional information from the differences in timing of CSR. The____________
10In other words, the available California data measure the grade-level achievementfor each grade from grades 2 to 11 in each school. However, the data do not measure thesubstantial student mobility that occurs each year. Therefore, it is not possible to analyzethe gain in test scores as students progress through school.
11The regression class size coefficients represent the estimated effect of a one-studentreduction in class size. Multiplying the coefficients by ten yields estimated gains from aten-student reduction in class size, which is roughly the average gain across the state.This approach depends upon the assumption that the effects are linear, which issupported by unreported regression results on a large sample of public schools in Texas.
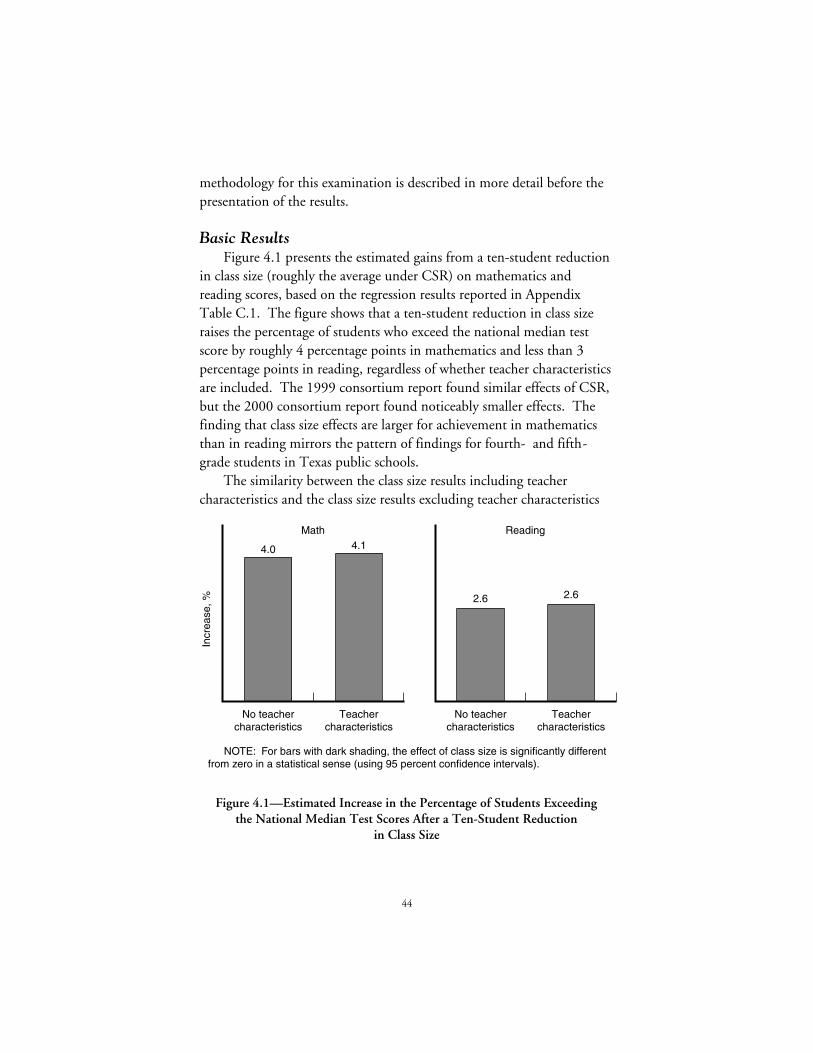
44
methodology for this examination is described in more detail before thepresentation of the results.
Basic ResultsFigure 4.1 presents the estimated gains from a ten-student reduction
in class size (roughly the average under CSR) on mathematics andreading scores, based on the regression results reported in AppendixTable C.1. The figure shows that a ten-student reduction in class sizeraises the percentage of students who exceed the national median testscore by roughly 4 percentage points in mathematics and less than 3percentage points in reading, regardless of whether teacher characteristicsare included. The 1999 consortium report found similar effects of CSR,but the 2000 consortium report found noticeably smaller effects. Thefinding that class size effects are larger for achievement in mathematicsthan in reading mirrors the pattern of findings for fourth- and fifth-grade students in Texas public schools.
The similarity between the class size results including teachercharacteristics and the class size results excluding teacher characteristics
Math
4.0 4.1
No teachercharacteristics
Teachercharacteristics
Incr
ease
, %
Reading
2.6 2.6
No teachercharacteristics
Teachercharacteristics
NOTE: For bars with dark shading, the effect of class size is significantly different from zero in a statistical sense (using 95 percent confidence intervals).
Figure 4.1—Estimated Increase in the Percentage of Students Exceedingthe National Median Test Scores After a Ten-Student Reduction
in Class Size
45
deserves further explanation. One possibility is that these teachercharacteristics explain little of the variation in the quality of instruction.This is not the case for teacher experience, as shown by the results inAppendix Table C.1 for the model including teacher characteristics. Theestimates indicate that having a novice teacher reduces the percentage ofstudents who exceed the national median by roughly 3 percentage pointsin both mathematics and reading. However, there is little or no evidencethat teacher education or certification is significantly related to thequality of instruction as measured by student achievement. This impliesthat the dramatic increase in the percentage of teachers without fullcertification does provide direct evidence of a decline in quality.
A second possibility is that class size differences are not stronglyassociated with changes in teacher characteristics. Although Chapter 3documented the dramatic increase in the share of teachers with little orno experience following the implementation of CSR, most schools hadalready hired additional teachers by 1997–1998. Consequently, changesin experience, education, and certification rates had already occurred inmost schools. This was not the case for those that postponedimplementation of CSR until 1998–1999 or 1999–2000, and we focuson that subset of schools below to learn more about changes in teacherquality.
Although the finding for teacher education is quite consistent withthe bulk of research on the determinants of academic achievement, theexisting evidence on certification is much more mixed. For example,Goldhaber and Brewer (2000) find that the students of teachers withsubject-matter certification in mathematics perform better than thestudents of other teachers, and the students of teachers with emergencycertification perform no worse than the students of teachers withstandard certification. There are concerns with the methodology in moststudies concerning teacher certification (as pointed out in Wayne andYoungs, 2001), so the mixed results are to be expected.12
To investigate the relationship between achievement andcertification in greater detail, we further divide teachers who are not fullycertified into two categories: teachers in the process of becoming____________
12For example, see Betts, Rueben, and Danenberg (2000).
46
certified (interns and preinterns) and teachers with emergency or waivercertification.13 Over two-thirds of the teachers not fully certified in both1997–1998 and 1999–2000 are emergency or waiver teachers, whereasthe remainder are interns. We cannot distinguish between the two typesof fully credentialed teachers (preliminary and professional clear), butthis limitation is mitigated by controls for the key differences betweenthese two types: experience and education.
The results from a series of alternative specifications for certificationand experience are reported in Appendix Table C.2. These models stillrely on within-school changes in teacher characteristics and studentachievement, but they use different definitions of teacher characteristics.Regardless of the taxonomy used to specify noncertified teachers, there islittle or no evidence that certification is systematically related toachievement. Only when teacher experience is excluded from the modeldoes certification become a statistically significant predictor ofachievement in both mathematics and reading. In addition, if averageyears of experience rather than the percentages of teachers in their firstand second year is used to measure differences in teacher experience, themagnitude of the certification estimate is larger (and significant formathematics). The evidence suggests that full certification as presentlymeasured is not a good predictor of student achievement in Californiaelementary schools. However, this conclusion should be qualifiedbecause there may be some error in the certification data that could leadto the underestimation of the importance of certification.
Differences by Community TypeThe findings for the state as a whole may conceal substantial
differences among schools in the benefits of class size reduction.Appendix Table C.3 reports class size coefficients for urban, suburban,and rural schools as well as for Los Angeles Unified School District andthe five next largest districts combined, all derived from separate____________
13These two categories are defined as mutually exclusive in our analysis. Teacherswho have both emergency/waiver credentials and internship/preinternship credentials areclassified only as interns. Similarly, teachers who have full certification and any otherform of certification (emergency, waiver, intern, preintern) are classified only as fullycertified.
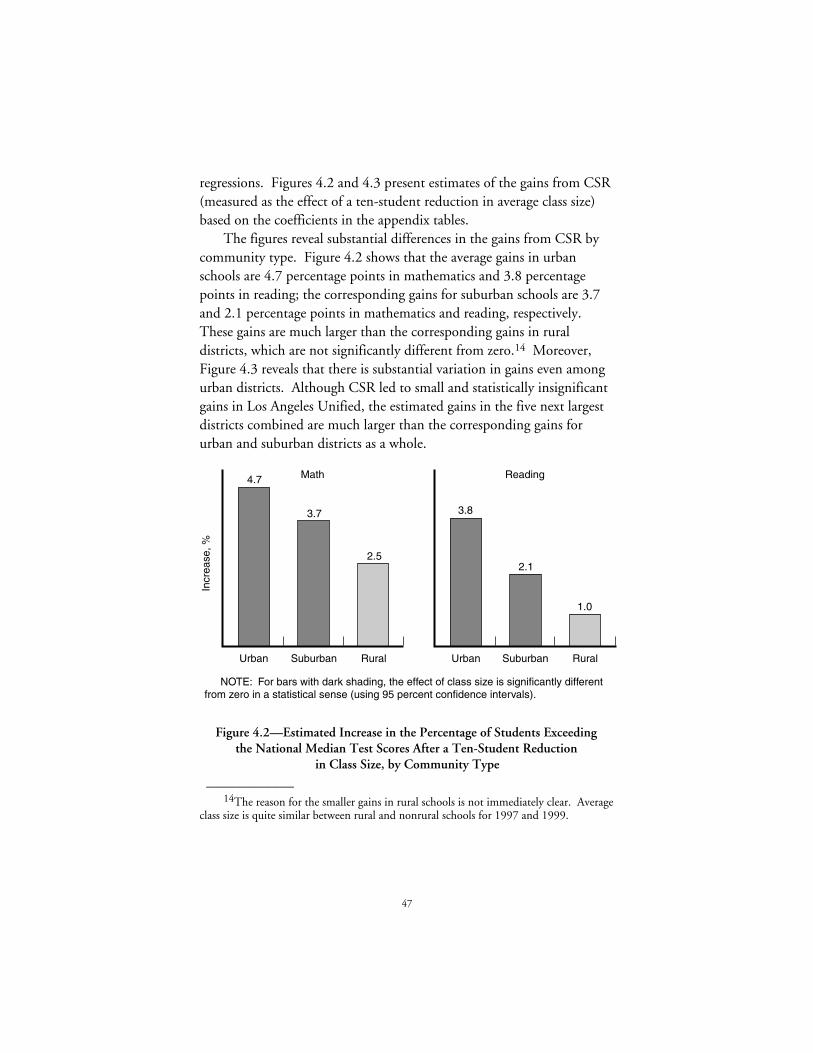
47
regressions. Figures 4.2 and 4.3 present estimates of the gains from CSR(measured as the effect of a ten-student reduction in average class size)based on the coefficients in the appendix tables.
The figures reveal substantial differences in the gains from CSR bycommunity type. Figure 4.2 shows that the average gains in urbanschools are 4.7 percentage points in mathematics and 3.8 percentagepoints in reading; the corresponding gains for suburban schools are 3.7and 2.1 percentage points in mathematics and reading, respectively.These gains are much larger than the corresponding gains in ruraldistricts, which are not significantly different from zero.14 Moreover,Figure 4.3 reveals that there is substantial variation in gains even amongurban districts. Although CSR led to small and statistically insignificantgains in Los Angeles Unified, the estimated gains in the five next largestdistricts combined are much larger than the corresponding gains forurban and suburban districts as a whole.
Math
3.7
4.7
2.5
Urban Suburban Rural Urban Suburban Rural
Incr
ease
, %
Reading
2.1
3.8
1.0
NOTE: For bars with dark shading, the effect of class size is significantly different from zero in a statistical sense (using 95 percent confidence intervals).
Figure 4.2—Estimated Increase in the Percentage of Students Exceedingthe National Median Test Scores After a Ten-Student Reduction
in Class Size, by Community Type____________
14The reason for the smaller gains in rural schools is not immediately clear. Averageclass size is quite similar between rural and nonrural schools for 1997 and 1999.
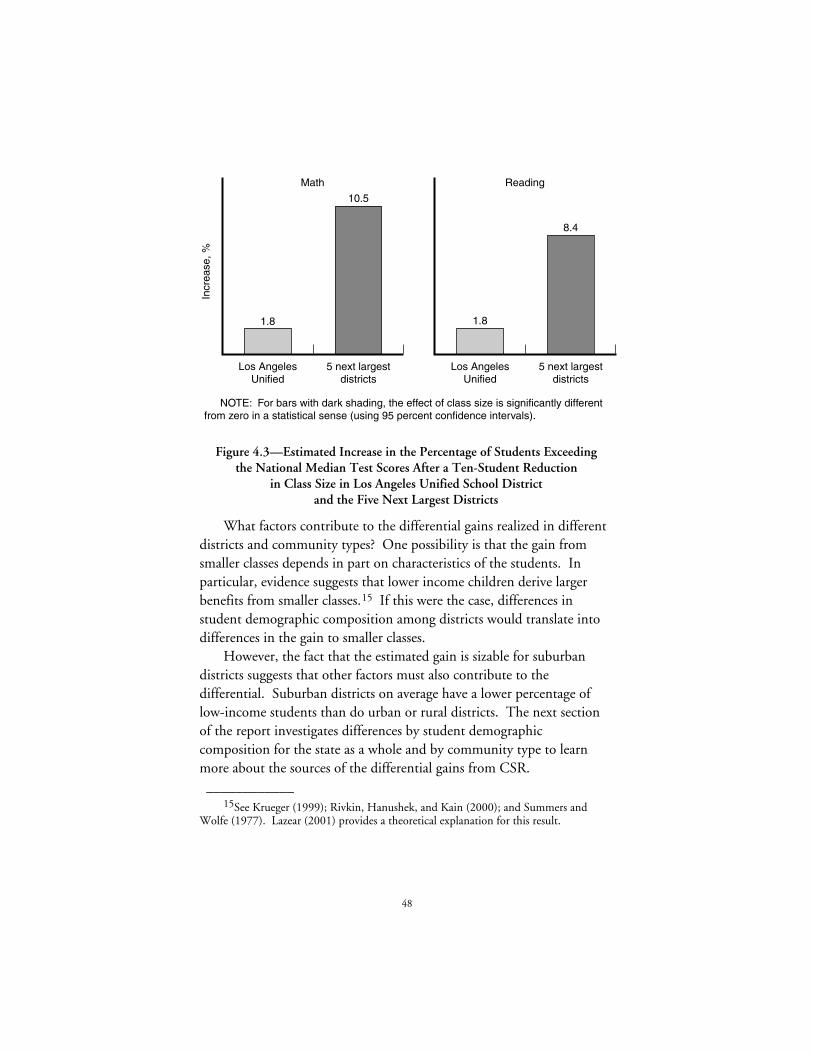
48
Math
1.8
10.5
Los AngelesUnified
5 next largestdistricts
Incr
ease
, %
Reading
1.8
8.4
Los AngelesUnified
5 next largestdistricts
NOTE: For bars with dark shading, the effect of class size is significantly different from zero in a statistical sense (using 95 percent confidence intervals).
Figure 4.3—Estimated Increase in the Percentage of Students Exceedingthe National Median Test Scores After a Ten-Student Reduction
in Class Size in Los Angeles Unified School Districtand the Five Next Largest Districts
What factors contribute to the differential gains realized in differentdistricts and community types? One possibility is that the gain fromsmaller classes depends in part on characteristics of the students. Inparticular, evidence suggests that lower income children derive largerbenefits from smaller classes.15 If this were the case, differences instudent demographic composition among districts would translate intodifferences in the gain to smaller classes.
However, the fact that the estimated gain is sizable for suburbandistricts suggests that other factors must also contribute to thedifferential. Suburban districts on average have a lower percentage oflow-income students than do urban or rural districts. The next sectionof the report investigates differences by student demographiccomposition for the state as a whole and by community type to learnmore about the sources of the differential gains from CSR.____________
15See Krueger (1999); Rivkin, Hanushek, and Kain (2000); and Summers andWolfe (1977). Lazear (2001) provides a theoretical explanation for this result.
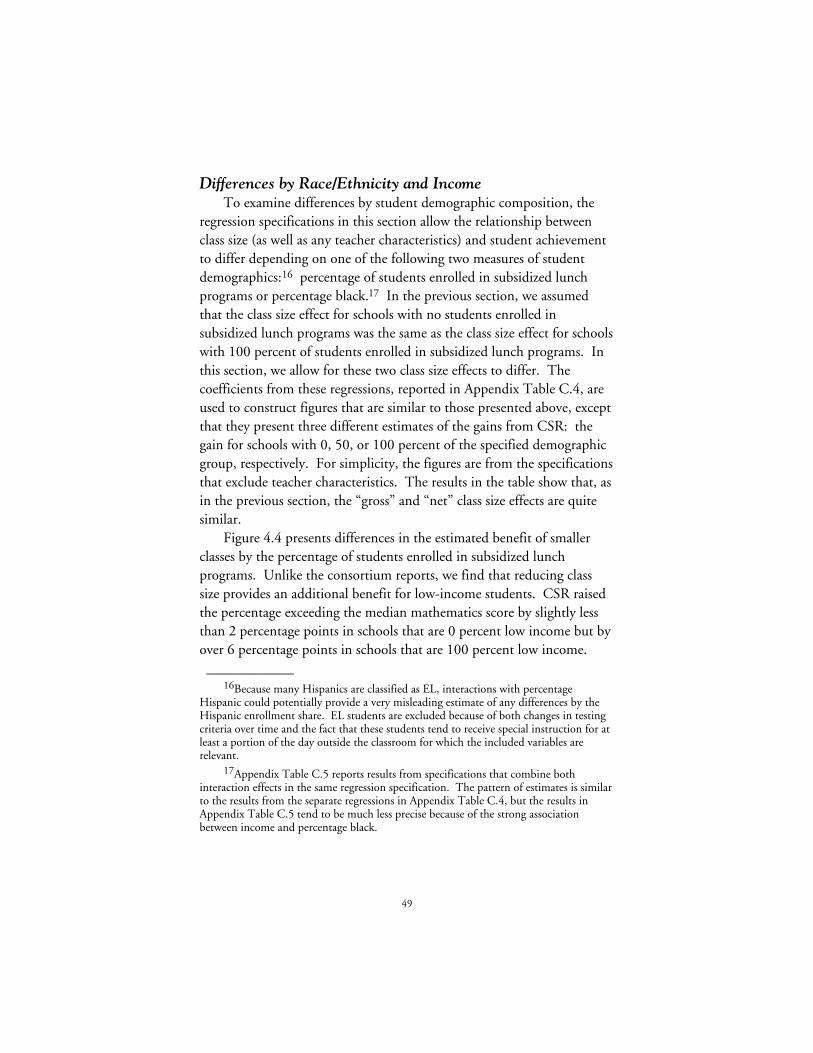
49
Differences by Race/Ethnicity and IncomeTo examine differences by student demographic composition, the
regression specifications in this section allow the relationship betweenclass size (as well as any teacher characteristics) and student achievementto differ depending on one of the following two measures of studentdemographics:16 percentage of students enrolled in subsidized lunchprograms or percentage black.17 In the previous section, we assumedthat the class size effect for schools with no students enrolled insubsidized lunch programs was the same as the class size effect for schoolswith 100 percent of students enrolled in subsidized lunch programs. Inthis section, we allow for these two class size effects to differ. Thecoefficients from these regressions, reported in Appendix Table C.4, areused to construct figures that are similar to those presented above, exceptthat they present three different estimates of the gains from CSR: thegain for schools with 0, 50, or 100 percent of the specified demographicgroup, respectively. For simplicity, the figures are from the specificationsthat exclude teacher characteristics. The results in the table show that, asin the previous section, the “gross” and “net” class size effects are quitesimilar.
Figure 4.4 presents differences in the estimated benefit of smallerclasses by the percentage of students enrolled in subsidized lunchprograms. Unlike the consortium reports, we find that reducing classsize provides an additional benefit for low-income students. CSR raisedthe percentage exceeding the median mathematics score by slightly lessthan 2 percentage points in schools that are 0 percent low income but byover 6 percentage points in schools that are 100 percent low income.____________
16Because many Hispanics are classified as EL, interactions with percentageHispanic could potentially provide a very misleading estimate of any differences by theHispanic enrollment share. EL students are excluded because of both changes in testingcriteria over time and the fact that these students tend to receive special instruction for atleast a portion of the day outside the classroom for which the included variables arerelevant.
17Appendix Table C.5 reports results from specifications that combine bothinteraction effects in the same regression specification. The pattern of estimates is similarto the results from the separate regressions in Appendix Table C.4, but the results inAppendix Table C.5 tend to be much less precise because of the strong associationbetween income and percentage black.
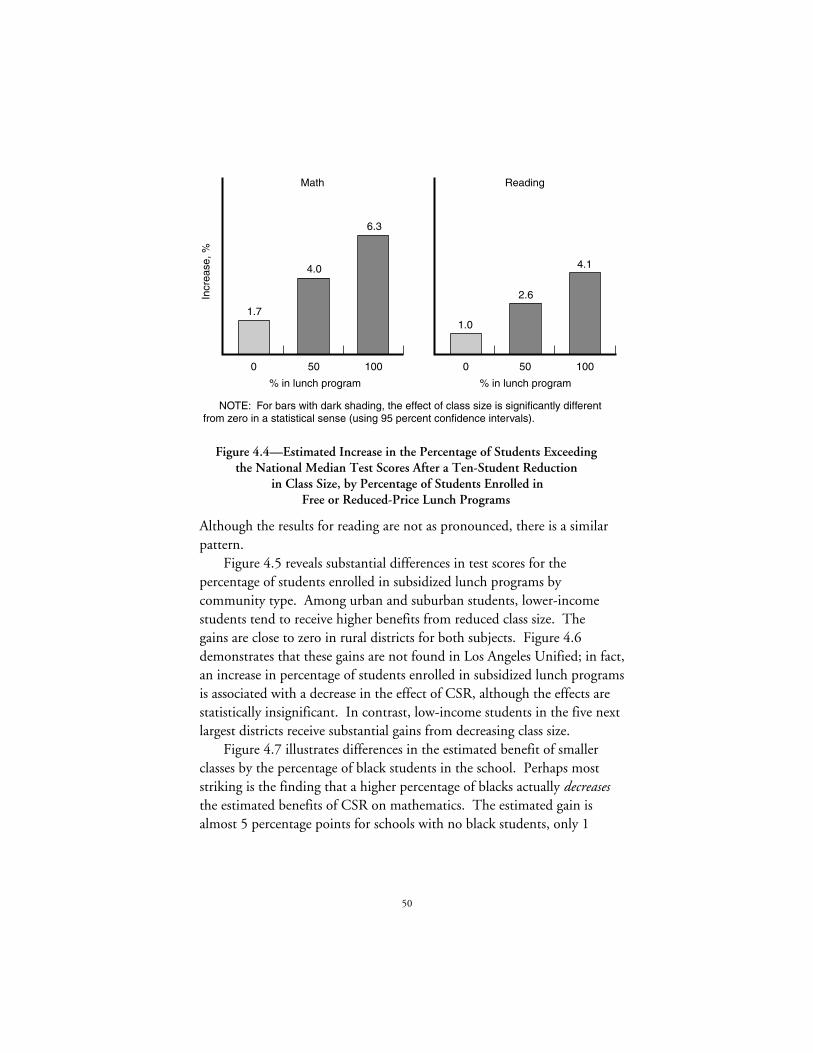
50
Math
4.0
1.7
6.3
0 50 100 0 50 100
Incr
ease
, %
Reading
2.6
1.0
4.1
% in lunch program % in lunch program
NOTE: For bars with dark shading, the effect of class size is significantly different from zero in a statistical sense (using 95 percent confidence intervals).
Figure 4.4—Estimated Increase in the Percentage of Students Exceedingthe National Median Test Scores After a Ten-Student Reduction
in Class Size, by Percentage of Students Enrolled inFree or Reduced-Price Lunch Programs
Although the results for reading are not as pronounced, there is a similarpattern.
Figure 4.5 reveals substantial differences in test scores for thepercentage of students enrolled in subsidized lunch programs bycommunity type. Among urban and suburban students, lower-incomestudents tend to receive higher benefits from reduced class size. Thegains are close to zero in rural districts for both subjects. Figure 4.6demonstrates that these gains are not found in Los Angeles Unified; in fact,an increase in percentage of students enrolled in subsidized lunch programsis associated with a decrease in the effect of CSR, although the effects arestatistically insignificant. In contrast, low-income students in the five nextlargest districts receive substantial gains from decreasing class size.
Figure 4.7 illustrates differences in the estimated benefit of smallerclasses by the percentage of black students in the school. Perhaps moststriking is the finding that a higher percentage of blacks actually decreasesthe estimated benefits of CSR on mathematics. The estimated gain isalmost 5 percentage points for schools with no black students, only 1
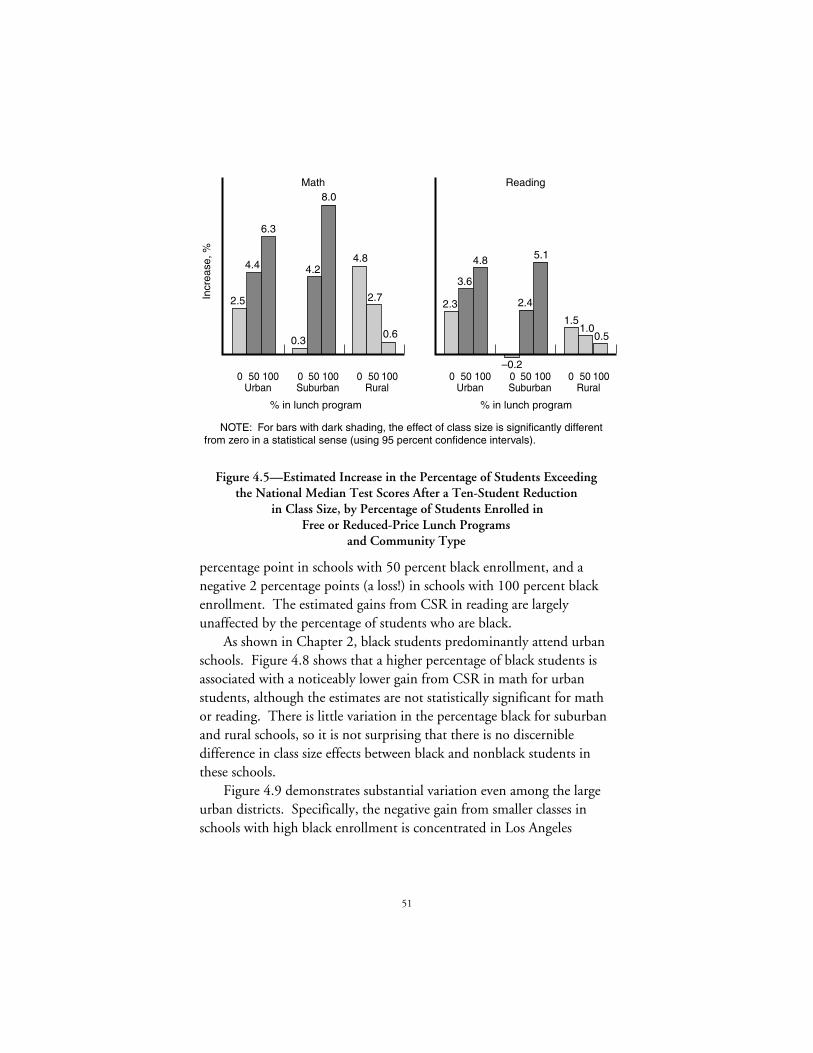
51
Math
4.24.4
2.7
8.0
6.3
0.60.3
2.5
4.8
0 50 100Suburban
0 50 100Rural
0 50Urban
100 0 50 100Suburban
0 50 100Rural
0 50Urban
100
Incr
ease
, %
Reading
2.4
–0.2
3.6
1.0
4.8
0.5
5.1
2.3
1.5
% in lunch program % in lunch program
NOTE: For bars with dark shading, the effect of class size is significantly different from zero in a statistical sense (using 95 percent confidence intervals).
Figure 4.5—Estimated Increase in the Percentage of Students Exceedingthe National Median Test Scores After a Ten-Student Reduction
in Class Size, by Percentage of Students Enrolled inFree or Reduced-Price Lunch Programs
and Community Type
percentage point in schools with 50 percent black enrollment, and anegative 2 percentage points (a loss!) in schools with 100 percent blackenrollment. The estimated gains from CSR in reading are largelyunaffected by the percentage of students who are black.
As shown in Chapter 2, black students predominantly attend urbanschools. Figure 4.8 shows that a higher percentage of black students isassociated with a noticeably lower gain from CSR in math for urbanstudents, although the estimates are not statistically significant for mathor reading. There is little variation in the percentage black for suburbanand rural schools, so it is not surprising that there is no discernibledifference in class size effects between black and nonblack students inthese schools.
Figure 4.9 demonstrates substantial variation even among the largeurban districts. Specifically, the negative gain from smaller classes inschools with high black enrollment is concentrated in Los Angeles
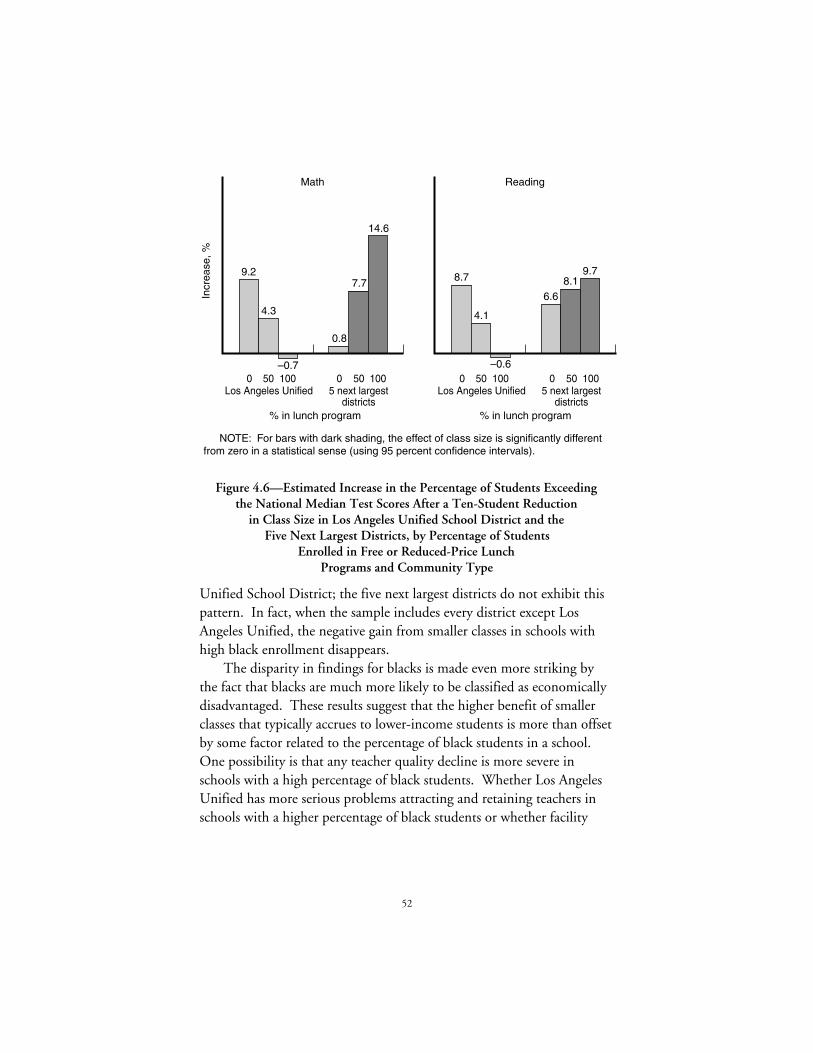
52
Math
4.3
7.7
14.6
9.2
0.8
4.1
8.19.7
8.7
6.6
0 50 1005 next largest
districts
0 50Los Angeles Unified
100 0 50 1005 next largest
districts
0 50Los Angeles Unified
100
Incr
ease
, %
Reading
–0.6–0.7
% in lunch program % in lunch program
NOTE: For bars with dark shading, the effect of class size is significantly different from zero in a statistical sense (using 95 percent confidence intervals).
Figure 4.6—Estimated Increase in the Percentage of Students Exceedingthe National Median Test Scores After a Ten-Student Reduction
in Class Size in Los Angeles Unified School District and theFive Next Largest Districts, by Percentage of Students
Enrolled in Free or Reduced-Price LunchPrograms and Community Type
Unified School District; the five next largest districts do not exhibit thispattern. In fact, when the sample includes every district except LosAngeles Unified, the negative gain from smaller classes in schools withhigh black enrollment disappears.
The disparity in findings for blacks is made even more striking bythe fact that blacks are much more likely to be classified as economicallydisadvantaged. These results suggest that the higher benefit of smallerclasses that typically accrues to lower-income students is more than offsetby some factor related to the percentage of black students in a school.One possibility is that any teacher quality decline is more severe inschools with a high percentage of black students. Whether Los AngelesUnified has more serious problems attracting and retaining teachers inschools with a higher percentage of black students or whether facility
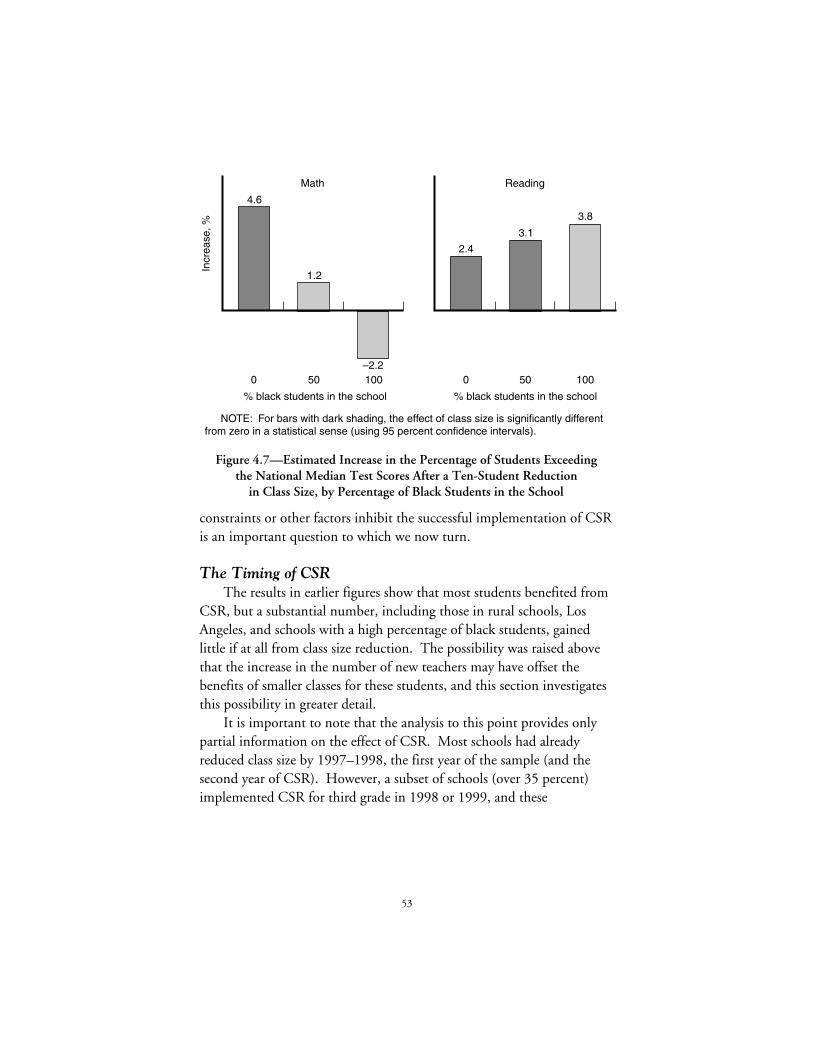
53
Math
1.2
4.6
–2.20 50 100 0 50 100
Incr
ease
, %
Reading
3.1
2.4
3.8
% black students in the school % black students in the school
NOTE: For bars with dark shading, the effect of class size is significantly different from zero in a statistical sense (using 95 percent confidence intervals).
Figure 4.7—Estimated Increase in the Percentage of Students Exceedingthe National Median Test Scores After a Ten-Student Reduction
in Class Size, by Percentage of Black Students in the School
constraints or other factors inhibit the successful implementation of CSRis an important question to which we now turn.
The Timing of CSRThe results in earlier figures show that most students benefited from
CSR, but a substantial number, including those in rural schools, LosAngeles, and schools with a high percentage of black students, gainedlittle if at all from class size reduction. The possibility was raised abovethat the increase in the number of new teachers may have offset thebenefits of smaller classes for these students, and this section investigatesthis possibility in greater detail.
It is important to note that the analysis to this point provides onlypartial information on the effect of CSR. Most schools had alreadyreduced class size by 1997–1998, the first year of the sample (and thesecond year of CSR). However, a subset of schools (over 35 percent)implemented CSR for third grade in 1998 or 1999, and these
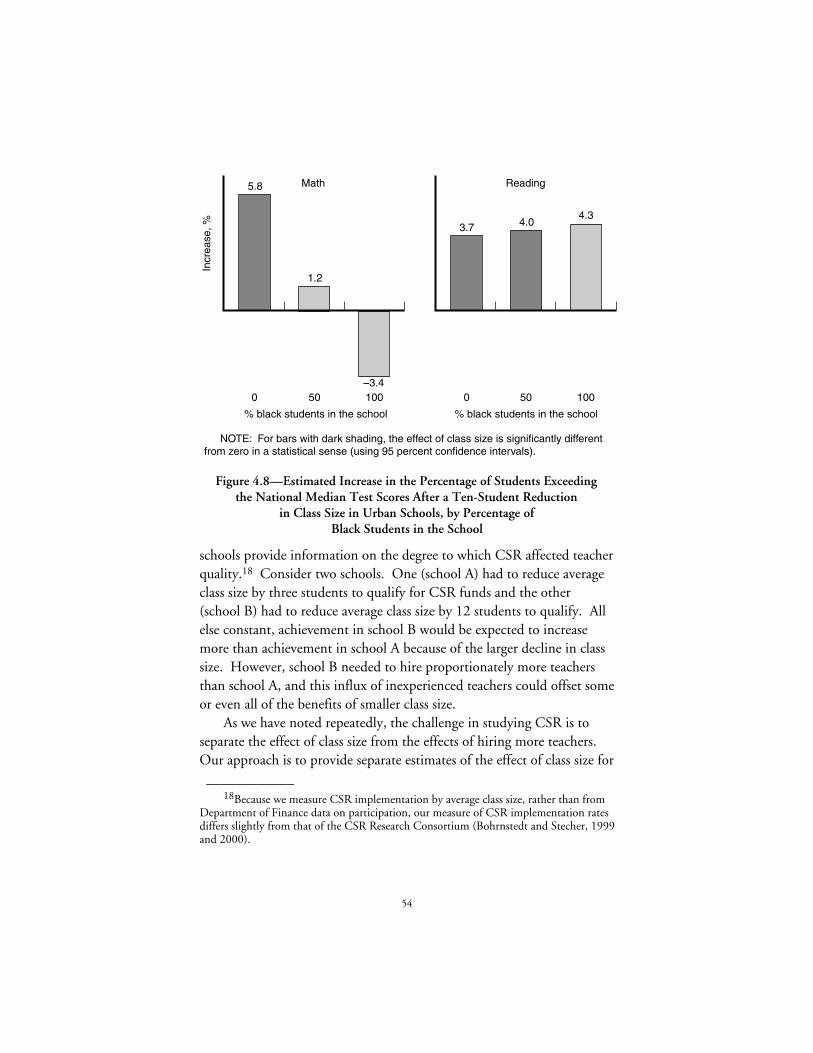
54
Math
1.2
5.8
–3.40 50 100 0 50 100
Incr
ease
, %
Reading
4.03.74.3
% black students in the school % black students in the school
NOTE: For bars with dark shading, the effect of class size is significantly different from zero in a statistical sense (using 95 percent confidence intervals).
Figure 4.8—Estimated Increase in the Percentage of Students Exceedingthe National Median Test Scores After a Ten-Student Reduction
in Class Size in Urban Schools, by Percentage ofBlack Students in the School
schools provide information on the degree to which CSR affected teacherquality.18 Consider two schools. One (school A) had to reduce averageclass size by three students to qualify for CSR funds and the other(school B) had to reduce average class size by 12 students to qualify. Allelse constant, achievement in school B would be expected to increasemore than achievement in school A because of the larger decline in classsize. However, school B needed to hire proportionately more teachersthan school A, and this influx of inexperienced teachers could offset someor even all of the benefits of smaller class size.
As we have noted repeatedly, the challenge in studying CSR is toseparate the effect of class size from the effects of hiring more teachers.Our approach is to provide separate estimates of the effect of class size for____________
18Because we measure CSR implementation by average class size, rather than fromDepartment of Finance data on participation, our measure of CSR implementation ratesdiffers slightly from that of the CSR Research Consortium (Bohrnstedt and Stecher, 1999and 2000).
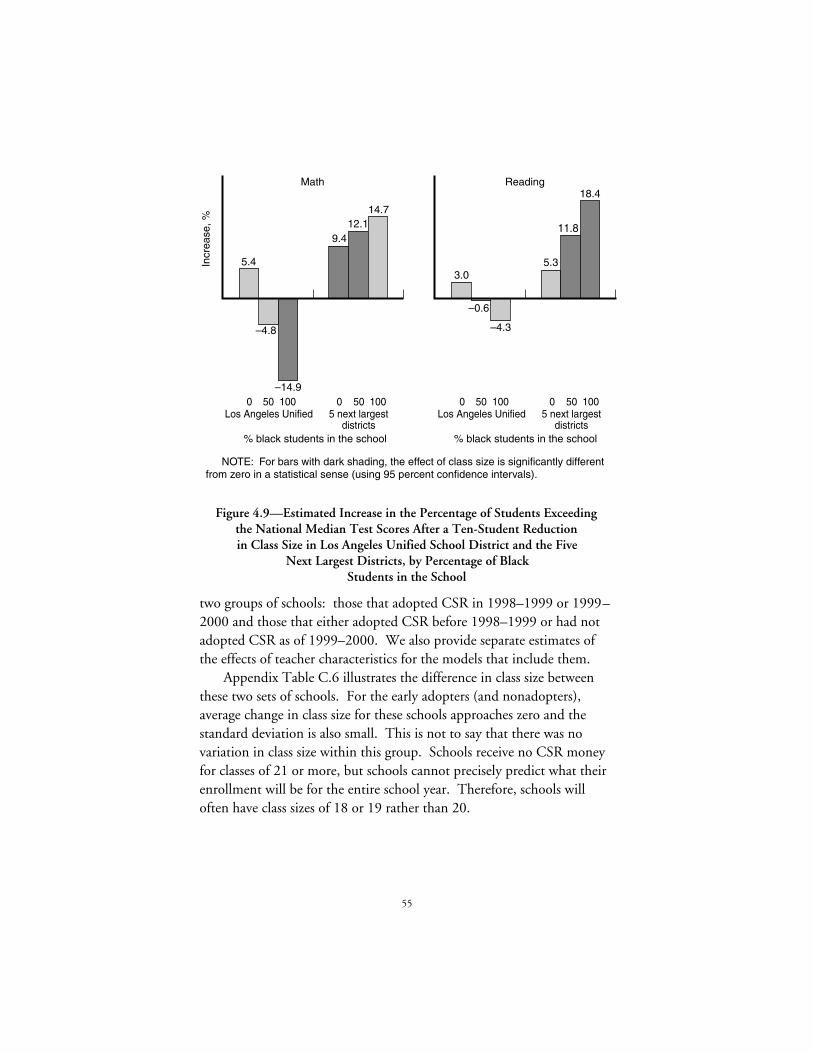
55
Math
–4.8
12.114.7
5.4
9.4
–0.6
11.8
18.4
3.05.3
0 50 1005 next largest
districts
0 50Los Angeles Unified
100 0 50 1005 next largest
districts
0 50Los Angeles Unified
100
Incr
ease
, %
Reading
–4.3
–14.9
% black students in the school % black students in the school
NOTE: For bars with dark shading, the effect of class size is significantly different from zero in a statistical sense (using 95 percent confidence intervals).
Figure 4.9—Estimated Increase in the Percentage of Students Exceedingthe National Median Test Scores After a Ten-Student Reductionin Class Size in Los Angeles Unified School District and the Five
Next Largest Districts, by Percentage of BlackStudents in the School
two groups of schools: those that adopted CSR in 1998–1999 or 1999–2000 and those that either adopted CSR before 1998–1999 or had notadopted CSR as of 1999–2000. We also provide separate estimates ofthe effects of teacher characteristics for the models that include them.
Appendix Table C.6 illustrates the difference in class size betweenthese two sets of schools. For the early adopters (and nonadopters),average change in class size for these schools approaches zero and thestandard deviation is also small. This is not to say that there was novariation in class size within this group. Schools receive no CSR moneyfor classes of 21 or more, but schools cannot precisely predict what theirenrollment will be for the entire school year. Therefore, schools willoften have class sizes of 18 or 19 rather than 20.
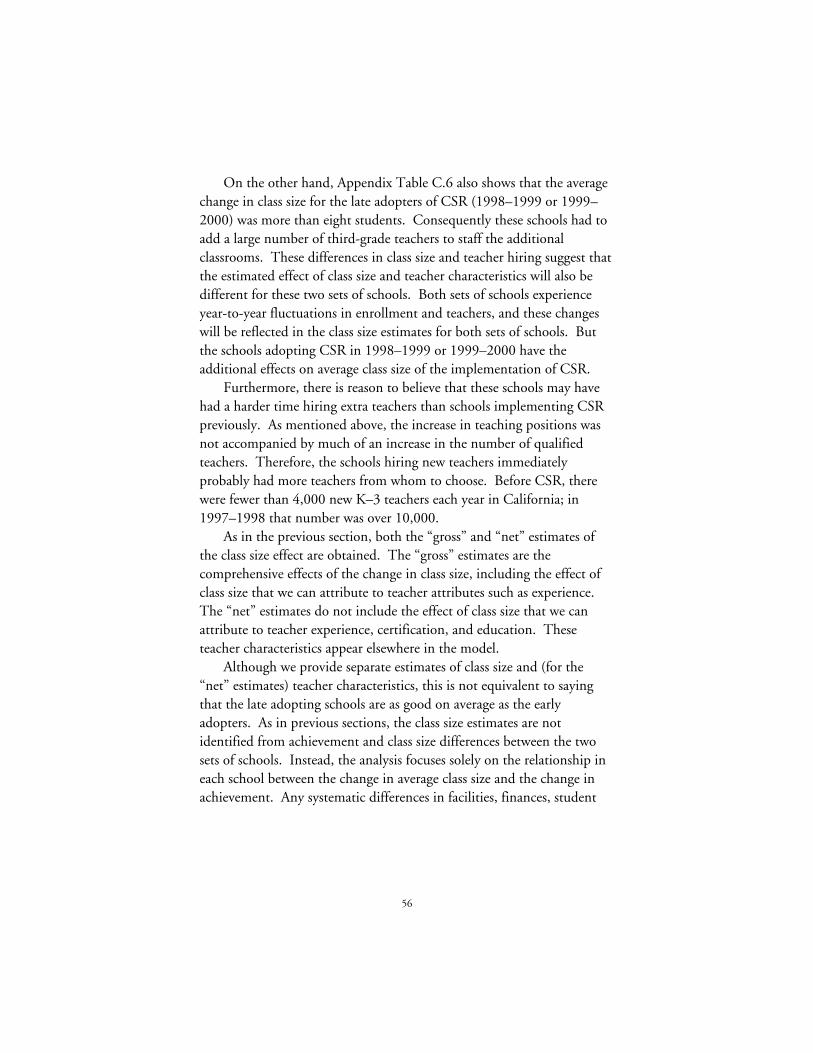
56
On the other hand, Appendix Table C.6 also shows that the averagechange in class size for the late adopters of CSR (1998–1999 or 1999–2000) was more than eight students. Consequently these schools had toadd a large number of third-grade teachers to staff the additionalclassrooms. These differences in class size and teacher hiring suggest thatthe estimated effect of class size and teacher characteristics will also bedifferent for these two sets of schools. Both sets of schools experienceyear-to-year fluctuations in enrollment and teachers, and these changeswill be reflected in the class size estimates for both sets of schools. Butthe schools adopting CSR in 1998–1999 or 1999–2000 have theadditional effects on average class size of the implementation of CSR.
Furthermore, there is reason to believe that these schools may havehad a harder time hiring extra teachers than schools implementing CSRpreviously. As mentioned above, the increase in teaching positions wasnot accompanied by much of an increase in the number of qualifiedteachers. Therefore, the schools hiring new teachers immediatelyprobably had more teachers from whom to choose. Before CSR, therewere fewer than 4,000 new K–3 teachers each year in California; in1997–1998 that number was over 10,000.
As in the previous section, both the “gross” and “net” estimates ofthe class size effect are obtained. The “gross” estimates are thecomprehensive effects of the change in class size, including the effect ofclass size that we can attribute to teacher attributes such as experience.The “net” estimates do not include the effect of class size that we canattribute to teacher experience, certification, and education. Theseteacher characteristics appear elsewhere in the model.
Although we provide separate estimates of class size and (for the“net” estimates) teacher characteristics, this is not equivalent to sayingthat the late adopting schools are as good on average as the earlyadopters. As in previous sections, the class size estimates are notidentified from achievement and class size differences between the twosets of schools. Instead, the analysis focuses solely on the relationship ineach school between the change in average class size and the change inachievement. Any systematic differences in facilities, finances, student
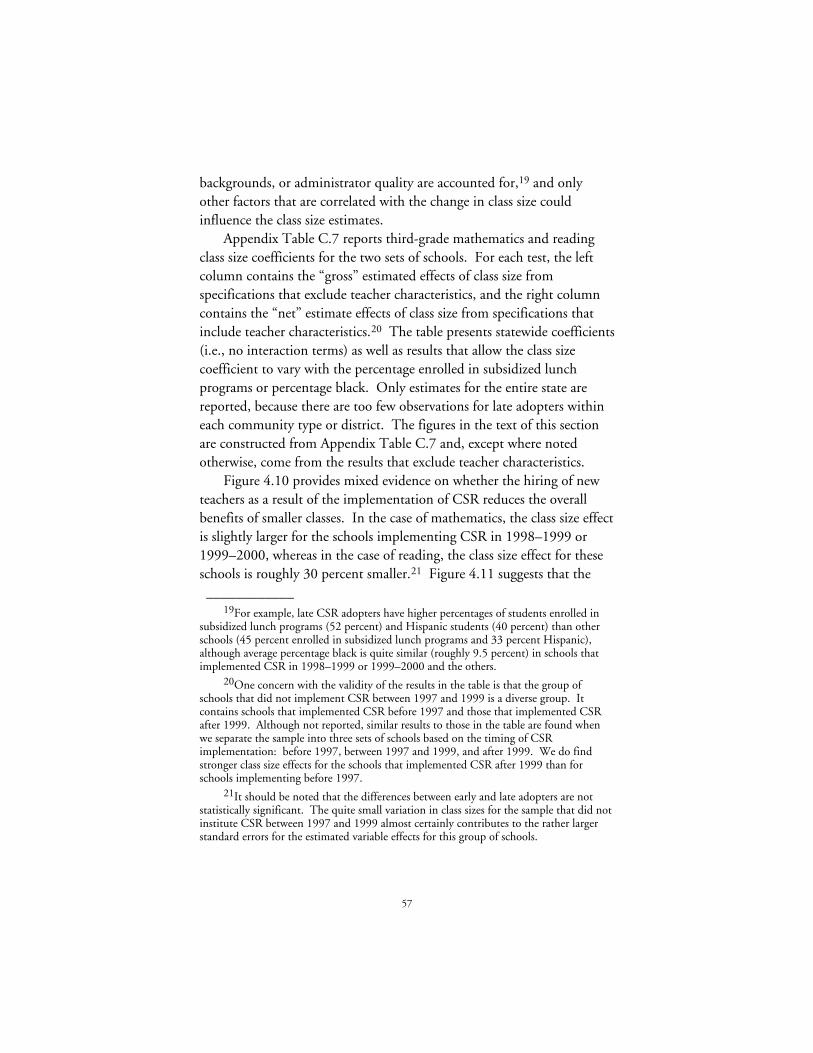
57
backgrounds, or administrator quality are accounted for,19 and onlyother factors that are correlated with the change in class size couldinfluence the class size estimates.
Appendix Table C.7 reports third-grade mathematics and readingclass size coefficients for the two sets of schools. For each test, the leftcolumn contains the “gross” estimated effects of class size fromspecifications that exclude teacher characteristics, and the right columncontains the “net” estimate effects of class size from specifications thatinclude teacher characteristics.20 The table presents statewide coefficients(i.e., no interaction terms) as well as results that allow the class sizecoefficient to vary with the percentage enrolled in subsidized lunchprograms or percentage black. Only estimates for the entire state arereported, because there are too few observations for late adopters withineach community type or district. The figures in the text of this sectionare constructed from Appendix Table C.7 and, except where notedotherwise, come from the results that exclude teacher characteristics.
Figure 4.10 provides mixed evidence on whether the hiring of newteachers as a result of the implementation of CSR reduces the overallbenefits of smaller classes. In the case of mathematics, the class size effectis slightly larger for the schools implementing CSR in 1998–1999 or1999–2000, whereas in the case of reading, the class size effect for theseschools is roughly 30 percent smaller.21 Figure 4.11 suggests that the____________
19For example, late CSR adopters have higher percentages of students enrolled insubsidized lunch programs (52 percent) and Hispanic students (40 percent) than otherschools (45 percent enrolled in subsidized lunch programs and 33 percent Hispanic),although average percentage black is quite similar (roughly 9.5 percent) in schools thatimplemented CSR in 1998–1999 or 1999–2000 and the others.
20One concern with the validity of the results in the table is that the group ofschools that did not implement CSR between 1997 and 1999 is a diverse group. Itcontains schools that implemented CSR before 1997 and those that implemented CSRafter 1999. Although not reported, similar results to those in the table are found whenwe separate the sample into three sets of schools based on the timing of CSRimplementation: before 1997, between 1997 and 1999, and after 1999. We do findstronger class size effects for the schools that implemented CSR after 1999 than forschools implementing before 1997.
21It should be noted that the differences between early and late adopters are notstatistically significant. The quite small variation in class sizes for the sample that did notinstitute CSR between 1997 and 1999 almost certainly contributes to the rather largerstandard errors for the estimated variable effects for this group of schools.
58
Math
3.7
4.2
Early Late
Incr
ease
, %
Reading
3.1
2.1
Early Late
NOTE: For bars with dark shading, the effect of class size is significantly different from zero in a statistical sense (using 95 percent confidence intervals).
Figure 4.10—Estimated Increase in the Percentage of Students Exceedingthe National Median Test Scores After a Ten-Student Reduction
in Class Size, by Timing of CSR
results for reading are driven by lower-income students. In the extremecase where all students are enrolled in subsidized lunch programs, theclass size effect is much smaller for the schools that implemented CSR in1998–1999 or 1999–2000 than for other schools.22 The gap is muchsmaller but still exists for schools where half the students are enrolled insubsidized lunch programs.
Figure 4.12 presents class size effects from specifications that allowfor different class size effects depending on the school’s percentage ofblack students. Because the specifications in the figure exclude teachercharacteristics, the effects of any accompanying changes in experience,certification, or education are captured by the class size coefficients.Although evidence based on all students or even allowing for incomedifferences is mixed, the results in Figure 4.12 provide strong support forthe belief that gains from implementing CSR fell as the percentage of____________
22For mathematics, the coefficients for class size interactions with percentageenrolled in subsidized lunch programs are 20 to 35 percent smaller for the sample ofschools that implemented CSR in 1998–1999 or 1999–2000.
59
Math
4.4
2.2
6.5
3.4
0.0
6.8
50 100Early
0Late Early Late Early Late Early Late Early Late Early Late
50 1000
Incr
ease
, %
Reading
2.9
0.8
3.7
2.3
0.2
5.7
% in lunch program % in lunch program
NOTE: For bars with dark shading, the effect of class size is significantly different from zero in a statistical sense (using 95 percent confidence intervals).
Figure 4.11—Estimated Increase in the Percentage of Students Exceedingthe National Median Test Scores After a Ten-Student Reduction
in Class Size, by Timing of CSR and Percentage ofStudents Enrolled in Free or Reduced-Price
Lunch Programs
black students in the school increased. In those schools that did notimplement CSR in 1998–1999 or 1999–2000, the estimated increases inthe percentage who exceeded the national median mathematics score are3.8, 3.5, and 3.2 percentage points for schools that are 0 percent, 50percent, and 100 percent black, respectively. In contrast, thecorresponding numbers for those schools that implemented CSR in1998–1999 or 1999–2000 are 4.8, 1.3, and –2.1 percentage points.These schools had to increase substantially the number of third-gradeteachers. Essentially, the results indicate that students in schools thatwere at least 70 percent black derived no improvement on average inmathematics achievement following the implementation of CSR, andthose in virtually all black schools may even have been hurt.
The estimates do not indicate that students in higher percentageblack schools received no benefits from smaller classes. For schools notimplementing CSR in 1998–1999 or 1999–2000, the class size estimates
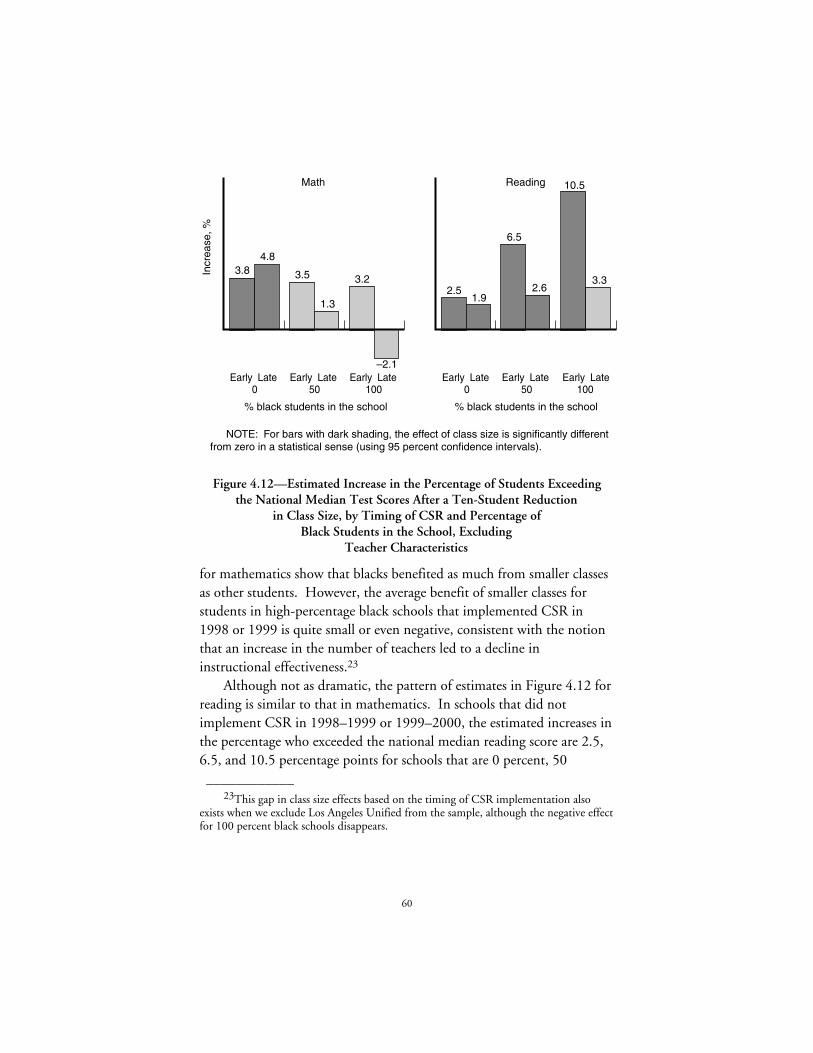
60
Math
1.3
4.8
–2.1
3.53.83.2
50 100Early
0Late Early Late Early Late Early Late Early Late Early Late
50 1000
Incr
ease
, %
Reading
6.5
1.9
3.32.62.5
10.5
% black students in the school % black students in the school
NOTE: For bars with dark shading, the effect of class size is significantly different from zero in a statistical sense (using 95 percent confidence intervals).
Figure 4.12—Estimated Increase in the Percentage of Students Exceedingthe National Median Test Scores After a Ten-Student Reduction
in Class Size, by Timing of CSR and Percentage ofBlack Students in the School, Excluding
Teacher Characteristics
for mathematics show that blacks benefited as much from smaller classesas other students. However, the average benefit of smaller classes forstudents in high-percentage black schools that implemented CSR in1998 or 1999 is quite small or even negative, consistent with the notionthat an increase in the number of teachers led to a decline ininstructional effectiveness.23
Although not as dramatic, the pattern of estimates in Figure 4.12 forreading is similar to that in mathematics. In schools that did notimplement CSR in 1998–1999 or 1999–2000, the estimated increases inthe percentage who exceeded the national median reading score are 2.5,6.5, and 10.5 percentage points for schools that are 0 percent, 50____________
23This gap in class size effects based on the timing of CSR implementation alsoexists when we exclude Los Angeles Unified from the sample, although the negative effectfor 100 percent black schools disappears.
61
percent, and 100 percent black, respectively, whereas in schools thatimplemented CSR in 1998 or 1999, the corresponding numbers are 1.9,2.6, and 3.2 percentage points.
Given the difficulties faced by new teachers, teacher quality would beexpected to fall in schools just implementing CSR even if they continuedto hire from the same pool of applicants because of the need to hire largenumbers of new teachers. This is an unavoidable short-term cost ofreducing class size that would disappear as these new teachers acquiredmore experience. If the apparent decline in the benefits of smaller classeswere to result entirely from the lack of experience of the recent hires, thiswould not be considered a serious problem.
The estimates in Appendix Table C.7 do in fact show that experienceaccounts for a portion of decline in the benefits of smaller classes.Controlling for experience raises the estimated gains of CSR for studentsin schools that adopted the program in 1998–1999 or 1999–2000 (theother characteristics do not have a significant effect on achievement).
Whereas Figure 4.12 contains the “gross” effect of class size forschools with different percentages of black students, Figure 4.13 presentsthe “net” class size effect (i.e., the effect accounting for teachercharacteristics). Consider the schools with at least 50 percent blackstudents. If all the decline in achievement between early and lateadopters in Figure 4.12 were due to teacher experience, education, andcertification, then there would be no decline in Figure 4.13. On theother hand, if none of the decline in Figure 4.12 were due to teachercharacteristics, then the gap between early and late adopters in Figure4.13 would match that in Figure 4.12. A comparison of the two figuressuggests that a noticeable portion of the decline in class size effects isattributable to teacher characteristics (largely experience), but more thanhalf the gap still remains.24
____________24In mathematics, the gap appears to be driven by Los Angeles Unified, because the
gap disappears when we exclude Los Angeles Unified from the sample. The gap forreading is still sizable when we exclude Los Angeles Unified but is smaller than in theoverall sample.

62
Math
2.2
4.6
–0.1
3.13.9
2.2
50 100Early
0Late Early Late Early Late Early Late Early Late Early Late
50 1000
Incr
ease
, %
Reading
6.5
2.0
4.03.0
2.5
10.5
% black students in the school% black students in the school
NOTE: For bars with dark shading, the effect of class size is significantly different from zero in a statistical sense (using 95 percent confidence intervals).
Figure 4.13—Estimated Increase in the Percentage of Students Exceedingthe National Median Test Scores After a Ten-Student Reduction
in Class Size, by Timing of CSR and Percentage ofBlack Students in the School, Including
Teacher Characteristics
What other factors could explain this gap in class size benefits? Asmentioned above, such factors would have to be correlated with thewithin-school change in class size. The model accounts for CSRimplementation, as well as for differences between schools. CSR resultedin the hiring of many teachers, and there is concern that these teacherswere less capable than other teachers. The fact that observed measures ofteacher quality (experience, certification, and education) account forsome but nowhere near all the decline in the benefits of smaller classessuggests that the implementation of CSR reduced the average quality ofnew hires from what it had been in the past, especially in schools with ahigh percentage of black students.
Because the variation in class size is much smaller for schools notimplementing CSR in 1998–1999 or 1999–2000 (see Appendix TableC.6), the coefficient on the class size/percentage black interaction term isnot precisely estimated. Therefore, we cannot reject, even at the 10percent level, the hypotheses that the mathematics and reading class size
63
effects for high-percentage black schools that adopted CSR in a timelymanner equal the effects for late adopters. Nevertheless, the significantlypositive interaction term for late adopters combined with the very smallinteraction coefficient for other schools and prior evidence that blacksbenefit as least as much from smaller classes as other students providesupport for the view that the benefits of CSR were much smaller forblacks in late-adopting schools.25
The Effects of CSR on Fifth-Grade AchievementCSR implementation in third grade also affects achievement in other
grades. The consortium documents large changes in teacher experiencein fourth and fifth grades following the implementation of CSR. Thesechanges suggest that many teachers moved to lower grades to takeadvantage of the now smaller classes. In this case, at least a portion ofany decline in teacher quality resulting from CSR would occur in fourthand fifth grades despite the fact that these grades did not reduce averageclass size. Therefore, a comparison of third-grade class size coefficientsmight actually underestimate the schoolwide decline in teacher qualityfrom CSR.
To provide additional evidence of the relationship between teacherquality and class size effects, we consider the relationship betweenchanges in third-grade class size and fifth-grade achievement. As in theprevious section, the models in this section allow for the effect of classsize to differ depending on the percentage of black students in the school.However, the model estimated in this section differs from the oneestimated in the previous section in two ways. First, all the variables thatwere previously estimated at the third-grade level (such as achievement)are now estimated at the fifth-grade level. Second, the model includesthe change in third-grade class size in addition to the change in fifth-grade class size. For schools that adopted CSR in 1998–1999 or 1999–____________
25Appendix Table C.8 shows that the inclusion of the subsidized lunch interactionsincreases the magnitude of the coefficient on the percentage black interaction for studentsin late-adopting schools. This is consistent with the notion that a decline in teacherquality offsets the higher benefits of smaller classes accruing to economicallydisadvantaged students.
64
2000, the change in third-grade class size is correlated with how manynew teachers the school added to implement CSR.
Appendix Table C.9 contains the results from these regressions forfifth-grade achievement that include third-grade class size as well as fifth-grade class size and other controls.26 The results display a very similarpattern to the results for third-grade test scores. Figure 4.14 shows that aten-student reduction in third-grade class size is associated with roughly1 to 2 percentage point drops in the percentages of fifth-grade studentswho exceeded the national medians in mathematics and reading inschools with 50 percent black enrollment. The declines for schools with100 percent black enrollment are between 2 and 4 percentage points. Inaddition, it appears that changes in the percentages of fifth-grade teacherswith zero and one year of experience account for roughly one-quarter ofthe decline associated with the reduction in third-grade class size, as theinclusion of teacher characteristics reduces the negative effect of third-grade class size by roughly one-quarter in Appendix Table C.9. Similarto the evidence for third grade, the findings for fifth grade suggest that inhigher-percentage black schools, CSR led to both the need to hire anumber of inexperienced teachers and a decline in the average quality ofnew hires.27
The conclusion that a decline in teacher quality offsets the benefits ofsmaller classes in high-percentage black schools is not based onobservable measures of quality such as experience or certification.Rather, it is based on the pattern of the relationship betweenachievement, class size, and teacher experience. If teacher experience canexplain a sizable portion of the decline in the benefits of smaller class size,it seems reasonable that unobserved measures of teacher quality can alsoexplain a portion of that decline. We believe that an overall decline inteacher quality provides the most plausible explanation for the smallerbenefits of class size reduction for late adopters of CSR that are only____________
26Appendix Table C.10 presents the descriptive statistics for the fifth-grade sample,by CSR timing.
27The interaction between percentage of black students in a school and class size isnearly identical when we remove Los Angeles Unified from the sample. Thus, althoughthe negative effects of class size for blacks appear to be concentrated in Los AngelesUnified, the effects for fifth grade appear to occur throughout the state.
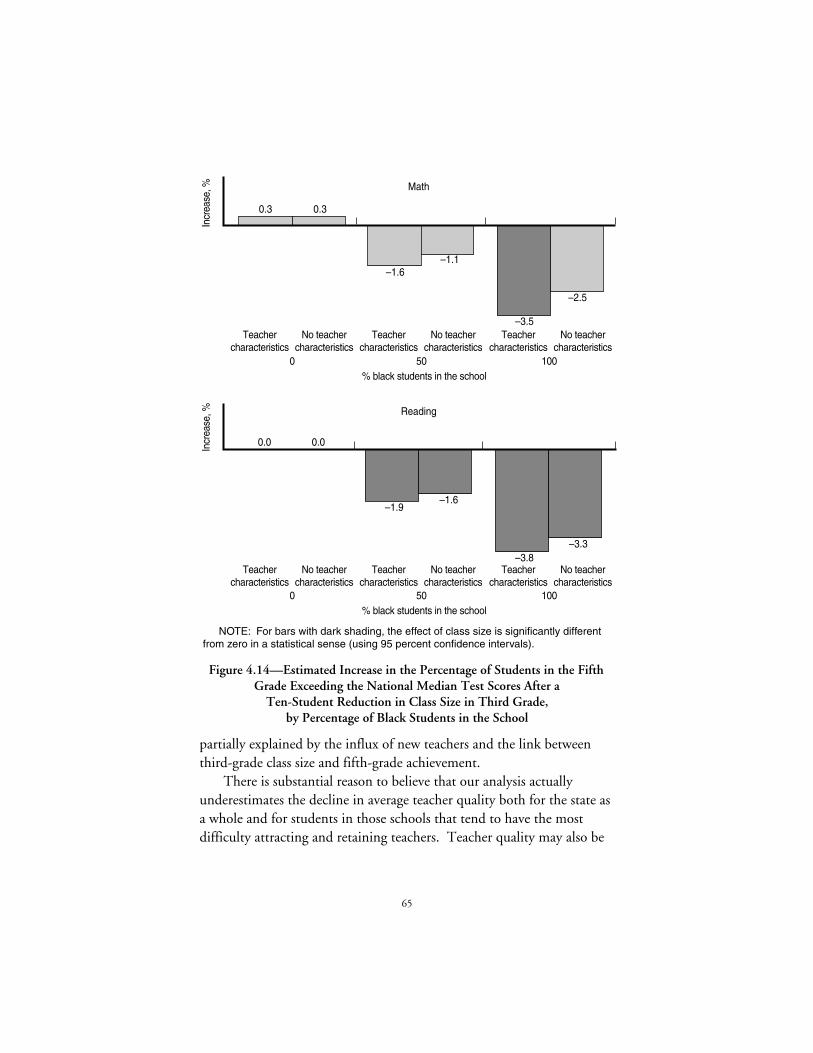
65
Incr
ease
, %
Incr
ease
, %
Math
–1.1
0.3
–2.5
–1.6
0.3
–3.5
50 100
Teachercharacteristics
0
No teachercharacteristics
Teachercharacteristics
No teachercharacteristics
Teachercharacteristics
No teachercharacteristics
% black students in the school
50 100
Teachercharacteristics
0
No teachercharacteristics
Teachercharacteristics
No teachercharacteristics
Teachercharacteristics
No teachercharacteristics
% black students in the school
Reading
–1.9
0.0
–3.3
–1.6
0.0
–3.8
NOTE: For bars with dark shading, the effect of class size is significantly different from zero in a statistical sense (using 95 percent confidence intervals).
Figure 4.14—Estimated Increase in the Percentage of Students in the FifthGrade Exceeding the National Median Test Scores After a
Ten-Student Reduction in Class Size in Third Grade,by Percentage of Black Students in the School
partially explained by the influx of new teachers and the link betweenthird-grade class size and fifth-grade achievement.
There is substantial reason to believe that our analysis actuallyunderestimates the decline in average teacher quality both for the state asa whole and for students in those schools that tend to have the mostdifficulty attracting and retaining teachers. Teacher quality may also be
66
affected by hiring at neighboring schools or other schools in the samedistrict. Consider two schools in Los Angeles. One is in a middle-classneighborhood in the San Fernando Valley and the other is in a high-poverty area of South Central Los Angeles. Class size reduction in theSan Fernando Valley school opens up additional jobs that may be filledby teachers currently working in South Central if they have theappropriate level of seniority. There may not be any decline in quality inthe San Fernando Valley school, but teacher quality could fall at theschool in South Central if that school is unable to find suitablereplacements. Because any such decline in teacher quality is not linkedto the magnitude of class size change at the affected school, it will not becaptured by the methodology used in this report. In fact, nomethodology could capture this effect with the currently available dataon teacher transitions. Our analysis of third-grade class size effects willunderstate any decline in teacher quality associated with the programbecause it does not measure the decline between schools or in othergrades.
SummaryA ten-student reduction in class size (the average under CSR) raises
the percentage of third-grade students who exceed the national mediantest score by roughly 4 percentage points in mathematics and 3percentage points in reading. Schools with more low-income studentslikely receive larger benefits, whereas schools in rural areas and those inwhich a high proportion of the students are black (primarily in LosAngeles Unified School District) appear to benefit little if at all fromsmaller classes.
The relationship between teacher characteristics and achievement ismuch weaker. The only indicator that is systematically linked to studentachievement in third grade is experience. Having a new teacher reducesthe percentage of students who exceed the national median by roughly 3percentage points in both mathematics and reading. There is little or noevidence that teacher education or certification is significantly related tostudent achievement in third grade. However, the finding forcertification could be influenced by the lower quality of the certificationdata.
67
One possible explanation for the variation in class size effects is thetiming of CSR. For schools with a large percentage of black students,schools recently implementing CSR have much smaller benefits of classsize reduction than do other high-percentage black schools. It is likelythat the smaller effects of class size for recent CSR implementers arerelated to changes in hard-to-measure teacher attributes, given that theyare related to easier-to-measure teacher attributes such as experience.The schools that do not appear to benefit from CSR are the same schoolsthat had trouble hiring experienced, certified teachers before CSR. Incontrast, there is little evidence of a difference in class size benefits basedon CSR timing in schools serving predominantly middle class, nonblackstudents.

69
5. Summary and PolicyImplications
This report examines the effect of class size reduction on third-grademathematics and reading achievement in California. The now-standardclass size of 20 students for grades K–3 is roughly one-third smaller thanthe average just six years ago. The results suggest that, all else equal,most students benefit from smaller classes and that lower-incomestudents likely receive larger benefits (except in Los Angeles). However,there is substantial variation across districts, and students in rural areasand those in Los Angeles Unified School District appear to benefit littleif at all from the smaller classes. In Los Angeles Unified, the struggles tobenefit from CSR are particularly challenging for schools with highpercentages of black students or students enrolled in subsidized lunchprograms.
Although the analysis does not provide a definitive explanation forthe failure of CSR to help some of the state’s most disadvantagedstudents, the pattern of findings strongly suggests that a decline in theaverage effectiveness of California’s teaching force is an important factor.Chapter 3 shows that the rapid expansion of the teaching force needed tostaff the additional classes led to a dramatic increase in the percentage ofteachers who lacked full certification, who had no postgraduateeducation, and who were in their first or second year of teaching. Theseteachers were concentrated in schools with high percentages of nonwhitestudents enrolled in subsidized lunch programs. For example, in 1999,nearly 30 percent of the teachers in these schools were not fully certified,and over 10 percent were novice teachers. In Los Angeles alone, over 30percent of the teachers lacked full certification and almost one in fourwere in their first or second year of teaching. Overall, the income andracial/ethnic gaps in teacher quality widened along virtually all measuredcharacteristics between 1995 and 1999.
70
The increase in the number of teachers with little or no experience isa large but unavoidable cost of class size reduction on the huge scale thatCalifornia implemented it. Although the lower certification rate wouldappear to signal a decline in the quality of new teachers, the empiricalanalysis does not reveal a strong relationship between achievement andteacher certification. However, the mere fact that many schools anddistricts found it so difficult to hire and retain certified teachers beforeCSR strongly suggests that the overall quality of the new teachers hiredby these districts because of CSR is lower than in other districts.
An example of this difference in teacher quality is found for schoolswith a high percentage of black students. Our regression analysis of theseschools shows that these students benefited from smaller classes, butmuch if not all of these benefits were offset by what appears to be adecline in teacher quality that accompanied the implementation of CSR.Moreover, the overall decline in teacher quality following CSR is onlypartially measured by our analysis of third-grade achievement. Theanalysis of fifth-grade achievement shows that the implementation ofCSR in third grade has a negative effect on achievement in fifth grade.The likely source of this decline is the movement of many fourth- andfifth-grade teachers into the early grades.
Our findings in this study have numerous implications forpolicymakers. The inability of CSR to raise achievement for some of thestate’s neediest students suggests that the statewide implementation ofCSR was far from ideal. It is not surprising that the schools that haddifficulty hiring before CSR had even more difficulty hiring after CSRcreated thousands of openings at schools with fewer needy students. If,instead, these struggling schools had been allowed to reduce class sizefirst, they might have had an easier time attracting and retaining teachersbecause of their smaller class sizes (compared with other schools).Furthermore, our finding that schools with few low-income studentsreceived few benefits from smaller classes implies that delaying CSR inthese schools would not have hurt these students.
The most obvious consequence of CSR was the need to hire 25,000additional teachers, and there is concern that these teachers were lesscapable than other teachers. For schools with a sizable percentage of
71
black students, the “gross” class size effect (i.e., the effect of smallerclasses and of teacher effectiveness) is lower in schools recently adoptingCSR. Observed measures of teacher quality (experience, certification,and education) account for some but nowhere near all this decline in thebenefits of smaller classes. The most plausible explanation for theremainder of the gap is a change in unobserved teacher quality.Whatever the reason, this gap suggests that the adverse effects of CSRimplementation may not simply go away when these new teachersacquire more experience.
The dramatic increase in new teachers will drive up the cost of CSR.As these teachers gain experience, they also receive more pay. Currently,the state funding for CSR does not cover the increase in teacher salaries.The political popularity of smaller classes may make it quite difficult toreduce expenditures through small increases in class size, possibly forcingadministrators to take resources from other uses. The Irvine schooldistrict has chosen to drop CSR rather than use its own money, andother districts may follow its example.
Our results concerning new teachers highlight the importance ofpolicies targeting new teachers, such as the BTSA. These types ofprograms have two potential benefits. First, they can minimize theadverse effects of new teachers by helping them adapt to the classroommore quickly and effectively. Making these teachers more productiveand effective also reduces the stress of the job, thereby reducing teacherturnover. Effective programs that assist new teachers will become evenmore essential in the near future, as enrollment and teacher retirementsboth increase. Future research should carefully analyze the effectivenessof programs such as BTSA on student achievement.
Although we find that experience matters, the relationship betweencertification and achievement is much less clear. Our results show thatCalifornia’s certification system in the late 1990s has little if anyrelationship to student achievement, suggesting that policies that preventuncertified teachers from teaching are unlikely to raise studentachievement. Indeed, such policies could have the perverse effect oflowering achievement by preventing talented but uncertified teachersfrom teaching. For example, Raymond, Fletcher, and Luque (2001) find
72
that test scores in Houston are at least as high, if not higher, foruncertified Teach for America teachers than for new, certified teachers.
The concern about the weak relationship between certification andstudent achievement is well known to California policymakers, and theCalifornia Commission on Teacher Credentialing (CCTC) is currentlyreforming the certification process. The first goal of these reforms is toalign the certification requirements with the content in the classroom toincrease the association between certification and achievement. Thesecond goal is to streamline the certification process to increase thenumber of certified teachers. It is hoped that the effect of these reformswill be studied rigorously.
At the same time, the available data in California on certificationlimit the inferences that can be drawn. For example, it is not possible todistinguish between the two types of full credentials (preliminary versusprofessional clear). Nor can the data from the CCTC be linked to theCalifornia Basic Education Data System (CBEDS) from the Departmentof Education. It is not possible to match individual student test scoresfrom one year to the next to measure student growth. Thus, severalimprovements to the current data collection system are needed toconduct an in-depth evaluation of the effects of certification on studentachievement.
Was CSR a good investment? The way it was implemented makesthe question extremely difficult to answer. In fact, the effects of CSRwill probably never be known with any certainty, particularly inkindergarten, first, and second grades. Our analysis focuses onachievement in third grade. Unlike previous work, it considers the effectof hiring many new teachers in addition to the effects of smaller classes.However, the data on teacher transitions within and between schools arelimited, so our analysis probably underestimates the decline ininstructional effectiveness. Overall, the gain in the percentage ofstudents scoring above the national median associated with smallerclasses is about equal to the loss in test scores associated with newteachers. Schools with many low-income students appear to benefitmore from smaller classes, but rural schools, schools in Los Angeles, andschools with high percentages of black enrollment do not gain from

73
smaller classes. Their inability to gain is only partially explained by theincrease in new teachers resulting from CSR. Only time will tell if theseschools ever gain from CSR.

75
Appendix A
Data Sources1
The majority of the data for this study are from the CaliforniaDepartment of Education. This appendix provides a description of thesedata.
CBEDSCBEDS is maintained and supported by the Educational
Demographics Unit in the California Department of Education. Thisreport uses data collected from two report forms each October: theProfessional Assignment Information Form (PAIF) and the SchoolInformation Form (SIF).
For each public school in California, the PAIF contains individual-teacher-level and classroom-level data, which are later aggregated to theschool level and weighted by full time equivalency. Variables at theindividual level include gender, ethnicity, education level, experience,and types of certification held.2 The PAIF also collects information onspecific classes taught and student counts per section for each teacher.For the 1999–2000 school year, this dataset included over 330,000individual observations and over 100 variables.
The school-level data in the SIF contain variables of two generaltypes: (1) staff and student counts and (2) program types. The studentcounts are enumerated by grade and ethnicity. For simplification, wecombine Filipinos, Asians, and Pacific Islanders into one category labeled“Asian.” Program type variables identify information such as the extentof participation in the class size reduction program and the type of school____________
1Most of the information in this appendix is based on the discussion of the datasources in Appendix A of Betts, Rueben, and Danenberg (2000).
2The experience question asks for the number of years of service including thecurrent school year. Given this definition, values of zero (which occur for a fewobservations) are recoded as missing.
76
(charter, alternative, etc.). The SIF contains over 500 variables for over8,500 public schools in California. For 1997–1998 and 1999–2000, theschool’s community type (urban, suburban, or rural) was not included inthe SIF. The data for this variable come from the 1996–1997 SIF andthe Common Core of Data, a national dataset.
Free or Reduced-Price Lunch EnrollmentThis school-level dataset contains counts and percentages of
California children enrolled in free or reduced-price lunch programs andchildren in families receiving Aid to Families with Dependent Children(AFDC), which was replaced in 1996 by Temporary Assistance forNeedy Families. According to the California Department of Education,schools report their meal program enrollment data annually, based ontheir October meal program enrollment files. AFDC data are collectedeach October through the cooperative efforts of the schools, districts,county offices of education, and county health and welfare offices. BothAFDC and subsidized-lunch data are collected on the CaliforniaDepartment of Education Finance Division Form Number CFP-2School Level AFDC Report.
The Language CensusThe language census is a school-level summary that collects
numerous types of data for elements in March of the current school year.This study uses the data on the number of LEP students—now known asEL students—and fluent English proficient students in California publicschools by grade and by primary non-English language. From thesecounts, we calculate the percentages of Asian and Hispanic students whoare ELs.
Standardized Test ScoresThe file containing standardized test scores is maintained by the
Standards, Curriculum, and Assessment Division of the CaliforniaDepartment of Education. For the 1997–1998 and 1999–2000 schoolyears, the file contains results from the Stanford Achievement Test Series,Ninth Edition, Form T (Stanford 9), administered by Harcourt, Brace &
77
Co. For each school, the test results are reported by grade in two waysfor each subject: for all students tested in that grade, and for all LEPstudents tested in that grade. In 1999–2000, the file also contains resultsfor non-LEP students. For 1997–1998, we calculate the test scores forthe non-LEP students from the reported scores for the other two groups.Our analysis focuses on the mathematics and reading test score results forgrades three and five, although the file contains results for other tests andfor the 1998–1999 school year.

79
Appendix B
Additional Tables and Figures
This appendix contains additional information on studentenrollment and teacher characteristics.
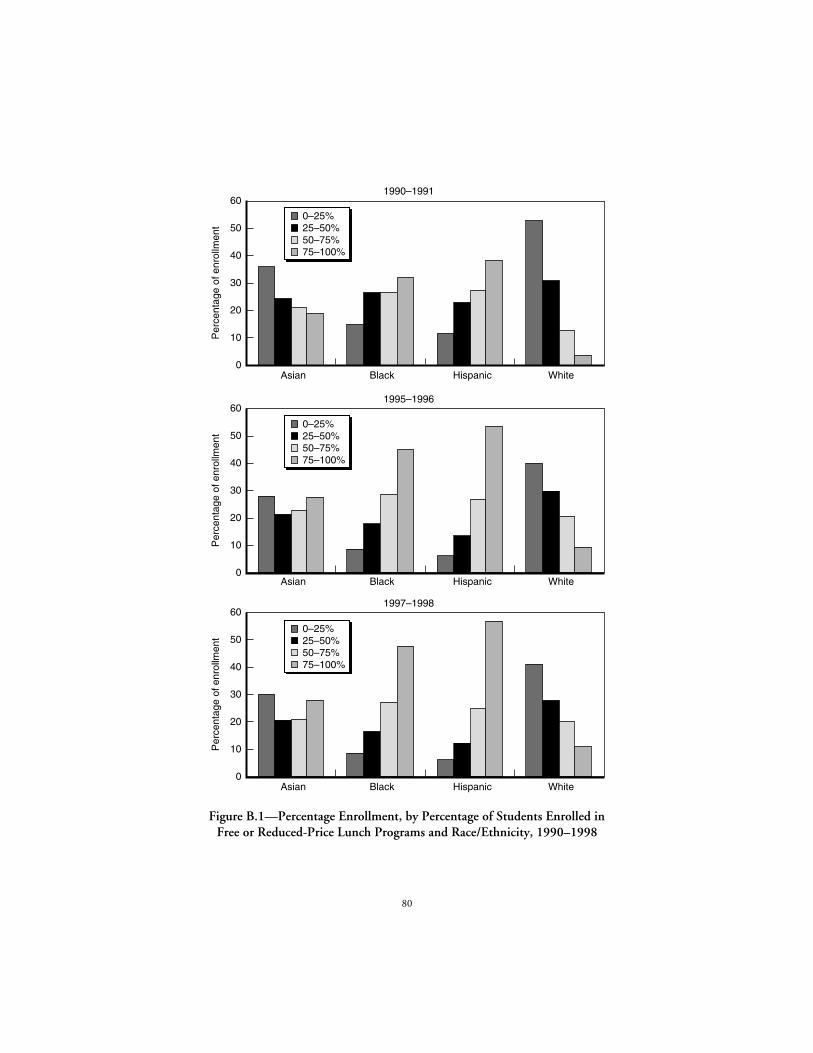
80
Asian Black Hispanic White
1990–1991
0
10
20
30
40
50
60
Per
cent
age
of e
nrol
lmen
t
1995–1996
0
10
20
30
40
50
60
Asian Black Hispanic White
Per
cent
age
of e
nrol
lmen
t
1997–1998
0
10
20
30
40
50
60
Asian Black Hispanic White
Per
cent
age
of e
nrol
lmen
t0–25%25–50%50–75%75–100%
0–25%25–50%50–75%75–100%
0–25%25–50%50–75%75–100%
Figure B.1—Percentage Enrollment, by Percentage of Students Enrolled inFree or Reduced-Price Lunch Programs and Race/Ethnicity, 1990–1998
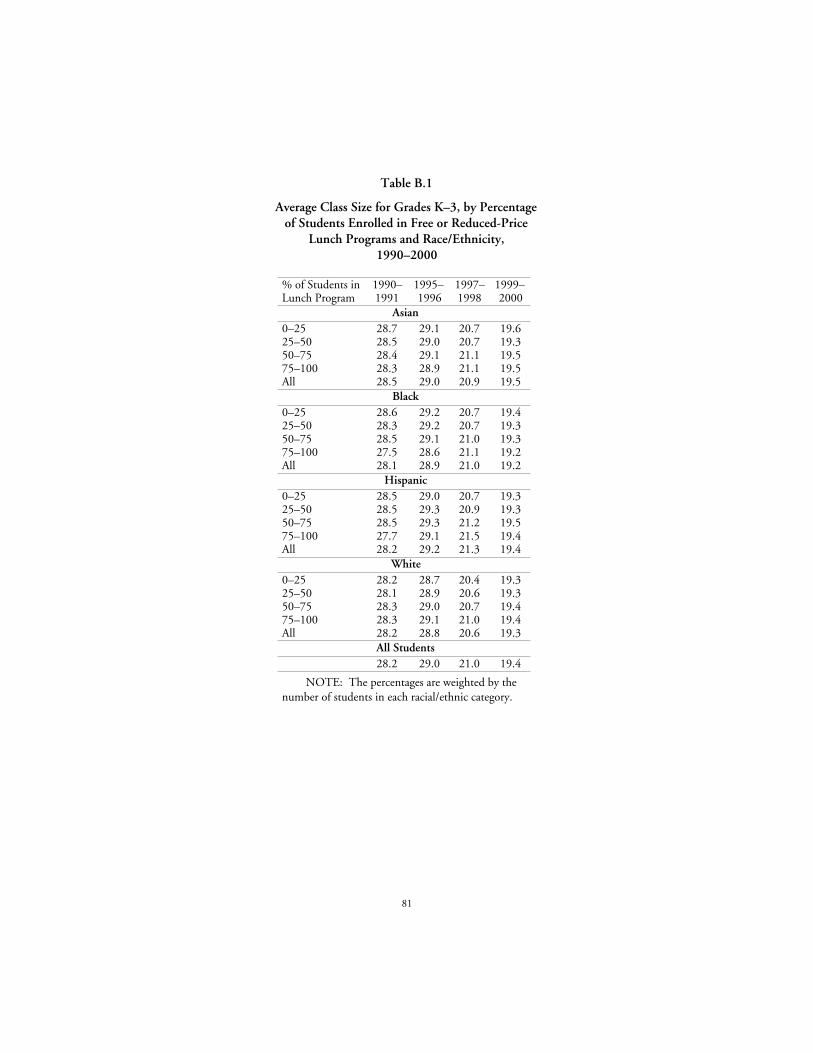
81
Table B.1
Average Class Size for Grades K–3, by Percentageof Students Enrolled in Free or Reduced-Price
Lunch Programs and Race/Ethnicity,1990–2000
% of Students inLunch Program
1990–1991
1995–1996
1997–1998
1999–2000
Asian0–25 28.7 29.1 20.7 19.625–50 28.5 29.0 20.7 19.350–75 28.4 29.1 21.1 19.575–100 28.3 28.9 21.1 19.5All 28.5 29.0 20.9 19.5
Black0–25 28.6 29.2 20.7 19.425–50 28.3 29.2 20.7 19.350–75 28.5 29.1 21.0 19.375–100 27.5 28.6 21.1 19.2All 28.1 28.9 21.0 19.2
Hispanic0–25 28.5 29.0 20.7 19.325–50 28.5 29.3 20.9 19.350–75 28.5 29.3 21.2 19.575–100 27.7 29.1 21.5 19.4All 28.2 29.2 21.3 19.4
White0–25 28.2 28.7 20.4 19.325–50 28.1 28.9 20.6 19.350–75 28.3 29.0 20.7 19.475–100 28.3 29.1 21.0 19.4All 28.2 28.8 20.6 19.3
All Students28.2 29.0 21.0 19.4
NOTE: The percentages are weighted by thenumber of students in each racial/ethnic category.
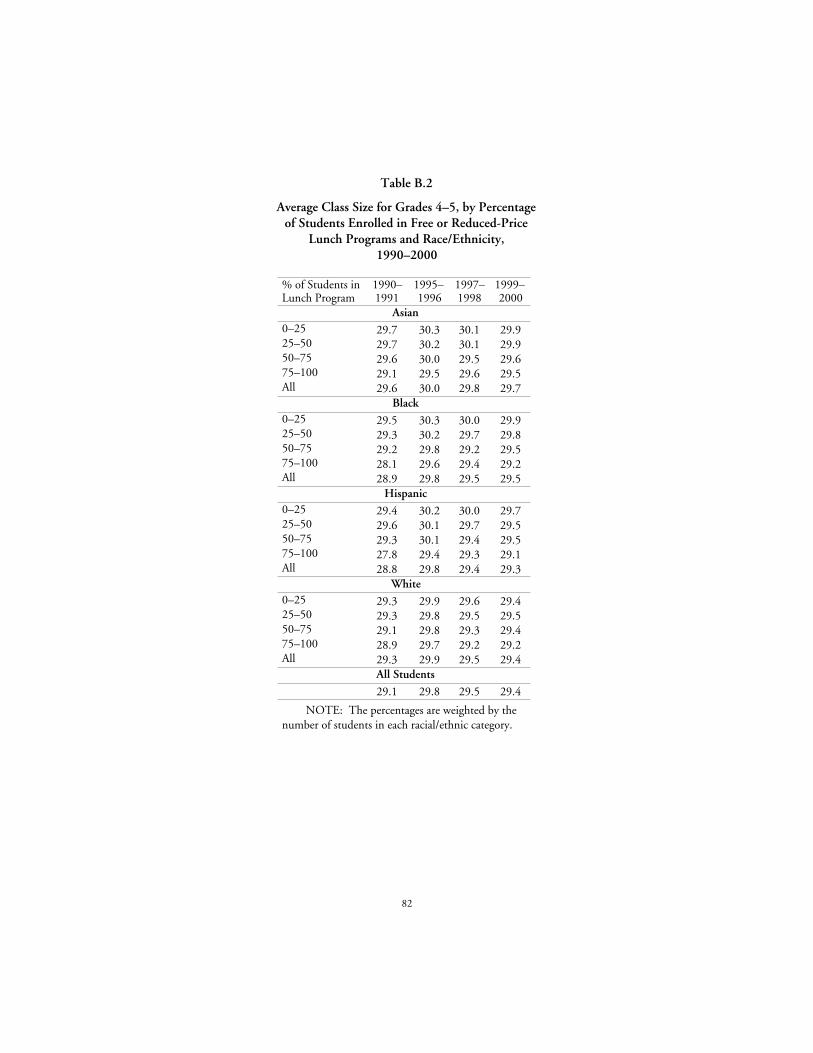
82
Table B.2
Average Class Size for Grades 4–5, by Percentageof Students Enrolled in Free or Reduced-Price
Lunch Programs and Race/Ethnicity,1990–2000
% of Students inLunch Program
1990–1991
1995–1996
1997–1998
1999–2000
Asian0–25 29.7 30.3 30.1 29.925–50 29.7 30.2 30.1 29.950–75 29.6 30.0 29.5 29.675–100 29.1 29.5 29.6 29.5All 29.6 30.0 29.8 29.7
Black0–25 29.5 30.3 30.0 29.925–50 29.3 30.2 29.7 29.850–75 29.2 29.8 29.2 29.575–100 28.1 29.6 29.4 29.2All 28.9 29.8 29.5 29.5
Hispanic0–25 29.4 30.2 30.0 29.725–50 29.6 30.1 29.7 29.550–75 29.3 30.1 29.4 29.575–100 27.8 29.4 29.3 29.1All 28.8 29.8 29.4 29.3
White0–25 29.3 29.9 29.6 29.425–50 29.3 29.8 29.5 29.550–75 29.1 29.8 29.3 29.475–100 28.9 29.7 29.2 29.2All 29.3 29.9 29.5 29.4
All Students
29.1 29.8 29.5 29.4
NOTE: The percentages are weighted by thenumber of students in each racial/ethnic category.
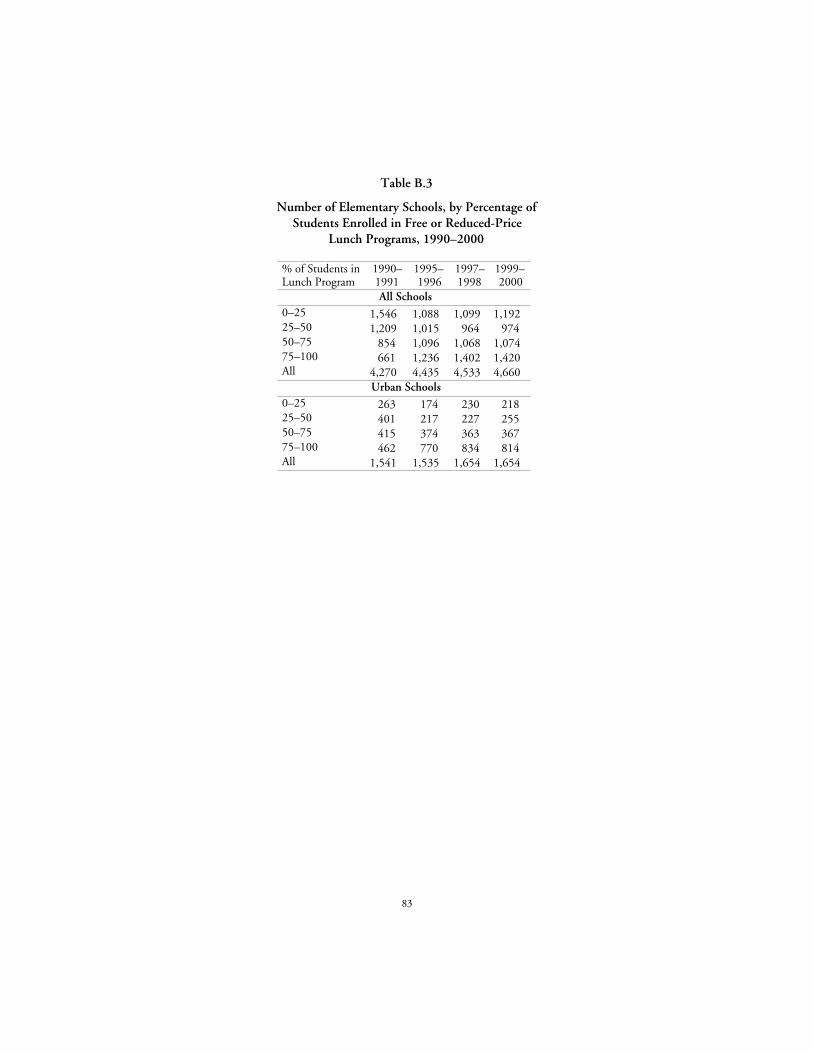
83
Table B.3
Number of Elementary Schools, by Percentage ofStudents Enrolled in Free or Reduced-Price
Lunch Programs, 1990–2000
% of Students inLunch Program
1990–1991
1995–1996
1997–1998
1999–2000
All Schools0–25 1,546 1,088 1,099 1,19225–50 1,209 1,015 964 97450–75 854 1,096 1,068 1,07475–100 661 1,236 1,402 1,420All 4,270 4,435 4,533 4,660
Urban Schools0–25 263 174 230 21825–50 401 217 227 25550–75 415 374 363 36775–100 462 770 834 814All 1,541 1,535 1,654 1,654
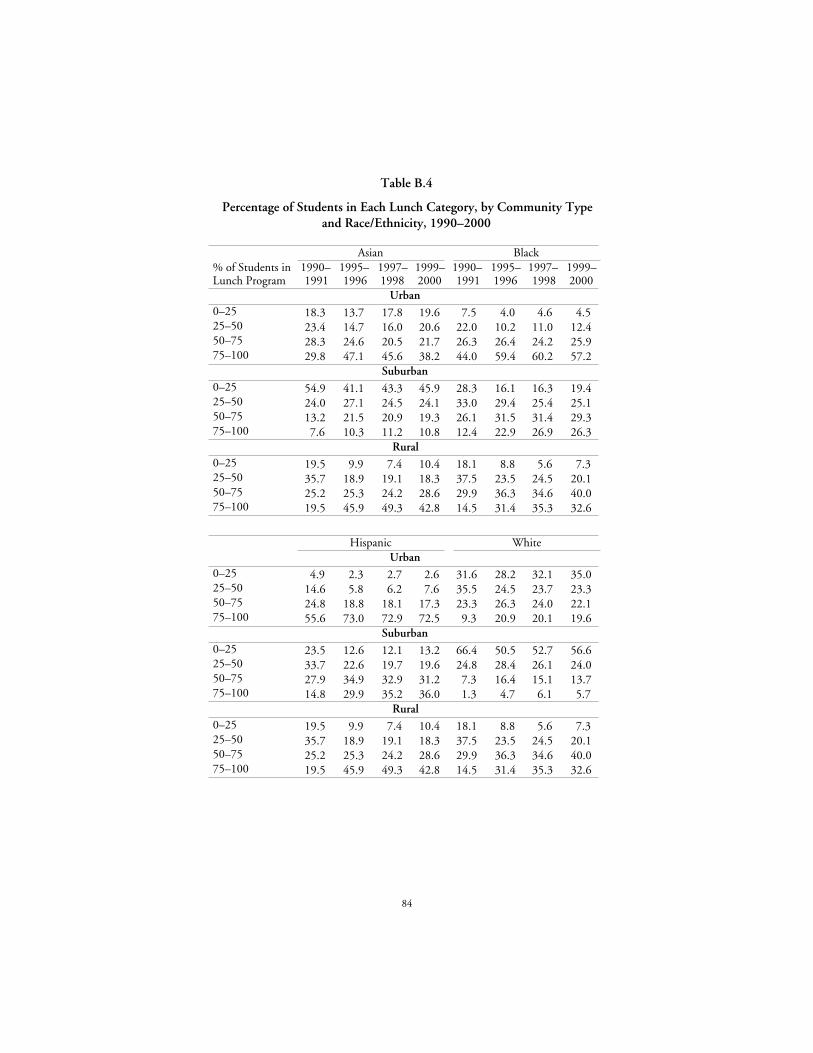
84
Table B.4
Percentage of Students in Each Lunch Category, by Community Typeand Race/Ethnicity, 1990–2000
Asian Black% of Students inLunch Program
1990–1991
1995–1996
1997–1998
1999–2000
1990–1991
1995–1996
1997–1998
1999–2000
Urban0–25 18.3 13.7 17.8 19.6 7.5 4.0 4.6 4.525–50 23.4 14.7 16.0 20.6 22.0 10.2 11.0 12.450–75 28.3 24.6 20.5 21.7 26.3 26.4 24.2 25.975–100 29.8 47.1 45.6 38.2 44.0 59.4 60.2 57.2
Suburban0–25 54.9 41.1 43.3 45.9 28.3 16.1 16.3 19.425–50 24.0 27.1 24.5 24.1 33.0 29.4 25.4 25.150–75 13.2 21.5 20.9 19.3 26.1 31.5 31.4 29.375–100 7.6 10.3 11.2 10.8 12.4 22.9 26.9 26.3
Rural0–25 19.5 9.9 7.4 10.4 18.1 8.8 5.6 7.325–50 35.7 18.9 19.1 18.3 37.5 23.5 24.5 20.150–75 25.2 25.3 24.2 28.6 29.9 36.3 34.6 40.075–100 19.5 45.9 49.3 42.8 14.5 31.4 35.3 32.6
Hispanic WhiteUrban
0–25 4.9 2.3 2.7 2.6 31.6 28.2 32.1 35.025–50 14.6 5.8 6.2 7.6 35.5 24.5 23.7 23.350–75 24.8 18.8 18.1 17.3 23.3 26.3 24.0 22.175–100 55.6 73.0 72.9 72.5 9.3 20.9 20.1 19.6
Suburban0–25 23.5 12.6 12.1 13.2 66.4 50.5 52.7 56.625–50 33.7 22.6 19.7 19.6 24.8 28.4 26.1 24.050–75 27.9 34.9 32.9 31.2 7.3 16.4 15.1 13.775–100 14.8 29.9 35.2 36.0 1.3 4.7 6.1 5.7
Rural0–25 19.5 9.9 7.4 10.4 18.1 8.8 5.6 7.325–50 35.7 18.9 19.1 18.3 37.5 23.5 24.5 20.150–75 25.2 25.3 24.2 28.6 29.9 36.3 34.6 40.075–100 19.5 45.9 49.3 42.8 14.5 31.4 35.3 32.6
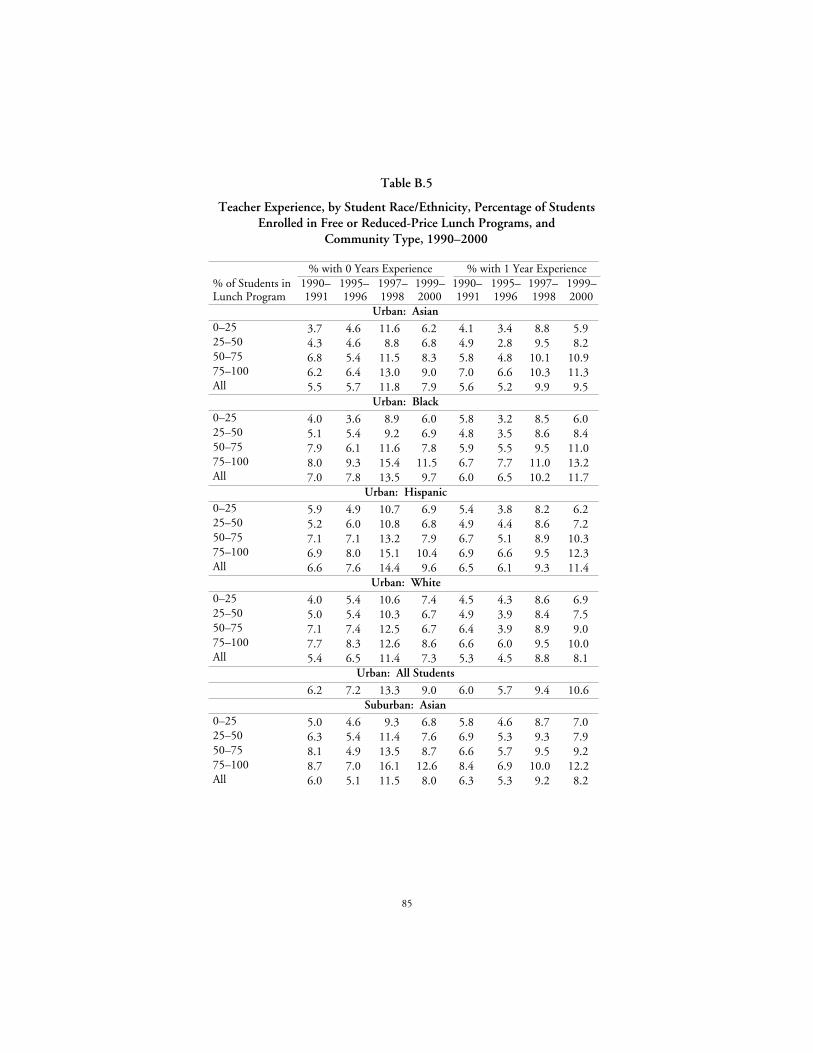
85
Table B.5
Teacher Experience, by Student Race/Ethnicity, Percentage of StudentsEnrolled in Free or Reduced-Price Lunch Programs, and
Community Type, 1990–2000
% with 0 Years Experience % with 1 Year Experience% of Students inLunch Program
1990–1991
1995–1996
1997–1998
1999–2000
1990–1991
1995–1996
1997–1998
1999–2000
Urban: Asian0–25 3.7 4.6 11.6 6.2 4.1 3.4 8.8 5.925–50 4.3 4.6 8.8 6.8 4.9 2.8 9.5 8.250–75 6.8 5.4 11.5 8.3 5.8 4.8 10.1 10.975–100 6.2 6.4 13.0 9.0 7.0 6.6 10.3 11.3All 5.5 5.7 11.8 7.9 5.6 5.2 9.9 9.5
Urban: Black0–25 4.0 3.6 8.9 6.0 5.8 3.2 8.5 6.025–50 5.1 5.4 9.2 6.9 4.8 3.5 8.6 8.450–75 7.9 6.1 11.6 7.8 5.9 5.5 9.5 11.075–100 8.0 9.3 15.4 11.5 6.7 7.7 11.0 13.2All 7.0 7.8 13.5 9.7 6.0 6.5 10.2 11.7
Urban: Hispanic0–25 5.9 4.9 10.7 6.9 5.4 3.8 8.2 6.225–50 5.2 6.0 10.8 6.8 4.9 4.4 8.6 7.250–75 7.1 7.1 13.2 7.9 6.7 5.1 8.9 10.375–100 6.9 8.0 15.1 10.4 6.9 6.6 9.5 12.3All 6.6 7.6 14.4 9.6 6.5 6.1 9.3 11.4
Urban: White0–25 4.0 5.4 10.6 7.4 4.5 4.3 8.6 6.925–50 5.0 5.4 10.3 6.7 4.9 3.9 8.4 7.550–75 7.1 7.4 12.5 6.7 6.4 3.9 8.9 9.075–100 7.7 8.3 12.6 8.6 6.6 6.0 9.5 10.0All 5.4 6.5 11.4 7.3 5.3 4.5 8.8 8.1
Urban: All Students
6.2 7.2 13.3 9.0 6.0 5.7 9.4 10.6Suburban: Asian
0–25 5.0 4.6 9.3 6.8 5.8 4.6 8.7 7.025–50 6.3 5.4 11.4 7.6 6.9 5.3 9.3 7.950–75 8.1 4.9 13.5 8.7 6.6 5.7 9.5 9.275–100 8.7 7.0 16.1 12.6 8.4 6.9 10.0 12.2All 6.0 5.1 11.5 8.0 6.3 5.3 9.2 8.2
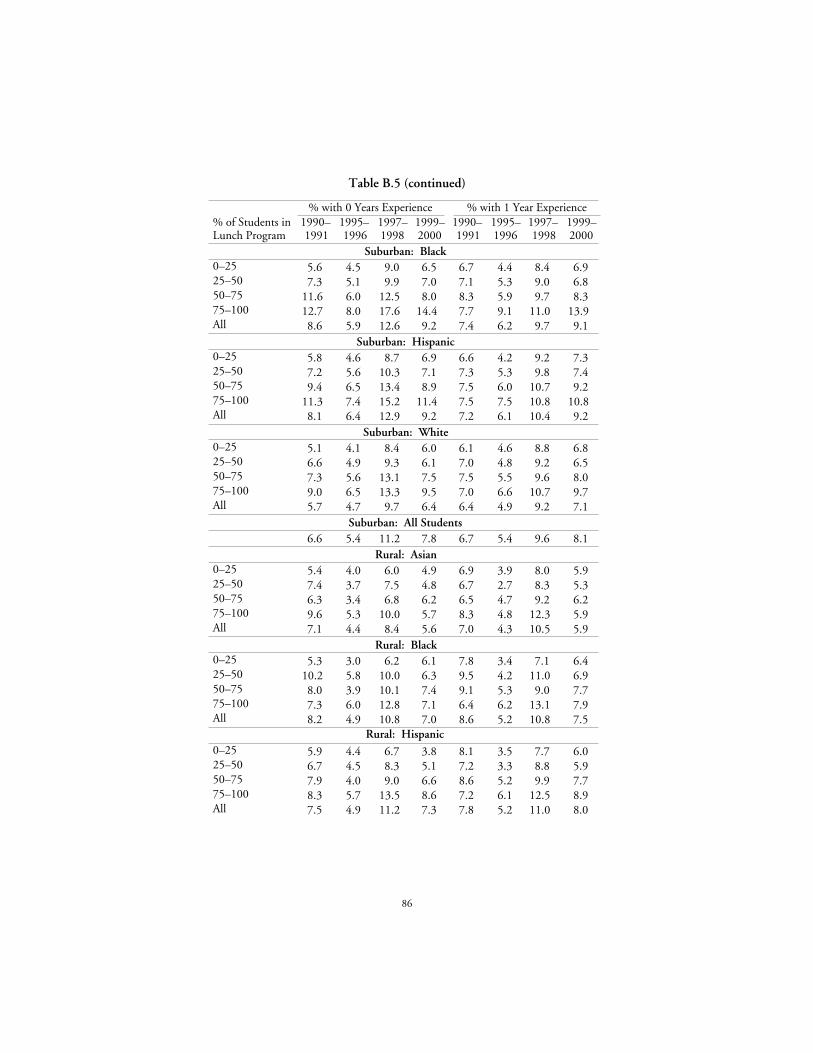
86
Table B.5 (continued)
% with 0 Years Experience % with 1 Year Experience% of Students inLunch Program
1990–1991
1995–1996
1997–1998
1999–2000
1990–1991
1995–1996
1997–1998
1999–2000
Suburban: Black0–25 5.6 4.5 9.0 6.5 6.7 4.4 8.4 6.925–50 7.3 5.1 9.9 7.0 7.1 5.3 9.0 6.850–75 11.6 6.0 12.5 8.0 8.3 5.9 9.7 8.375–100 12.7 8.0 17.6 14.4 7.7 9.1 11.0 13.9All 8.6 5.9 12.6 9.2 7.4 6.2 9.7 9.1
Suburban: Hispanic0–25 5.8 4.6 8.7 6.9 6.6 4.2 9.2 7.325–50 7.2 5.6 10.3 7.1 7.3 5.3 9.8 7.450–75 9.4 6.5 13.4 8.9 7.5 6.0 10.7 9.275–100 11.3 7.4 15.2 11.4 7.5 7.5 10.8 10.8All 8.1 6.4 12.9 9.2 7.2 6.1 10.4 9.2
Suburban: White0–25 5.1 4.1 8.4 6.0 6.1 4.6 8.8 6.825–50 6.6 4.9 9.3 6.1 7.0 4.8 9.2 6.550–75 7.3 5.6 13.1 7.5 7.5 5.5 9.6 8.075–100 9.0 6.5 13.3 9.5 7.0 6.6 10.7 9.7All 5.7 4.7 9.7 6.4 6.4 4.9 9.2 7.1
Suburban: All Students6.6 5.4 11.2 7.8 6.7 5.4 9.6 8.1
Rural: Asian0–25 5.4 4.0 6.0 4.9 6.9 3.9 8.0 5.925–50 7.4 3.7 7.5 4.8 6.7 2.7 8.3 5.350–75 6.3 3.4 6.8 6.2 6.5 4.7 9.2 6.275–100 9.6 5.3 10.0 5.7 8.3 4.8 12.3 5.9All 7.1 4.4 8.4 5.6 7.0 4.3 10.5 5.9
Rural: Black0–25 5.3 3.0 6.2 6.1 7.8 3.4 7.1 6.425–50 10.2 5.8 10.0 6.3 9.5 4.2 11.0 6.950–75 8.0 3.9 10.1 7.4 9.1 5.3 9.0 7.775–100 7.3 6.0 12.8 7.1 6.4 6.2 13.1 7.9All 8.2 4.9 10.8 7.0 8.6 5.2 10.8 7.5
Rural: Hispanic0–25 5.9 4.4 6.7 3.8 8.1 3.5 7.7 6.025–50 6.7 4.5 8.3 5.1 7.2 3.3 8.8 5.950–75 7.9 4.0 9.0 6.6 8.6 5.2 9.9 7.775–100 8.3 5.7 13.5 8.6 7.2 6.1 12.5 8.9All 7.5 4.9 11.2 7.3 7.8 5.2 11.0 8.0
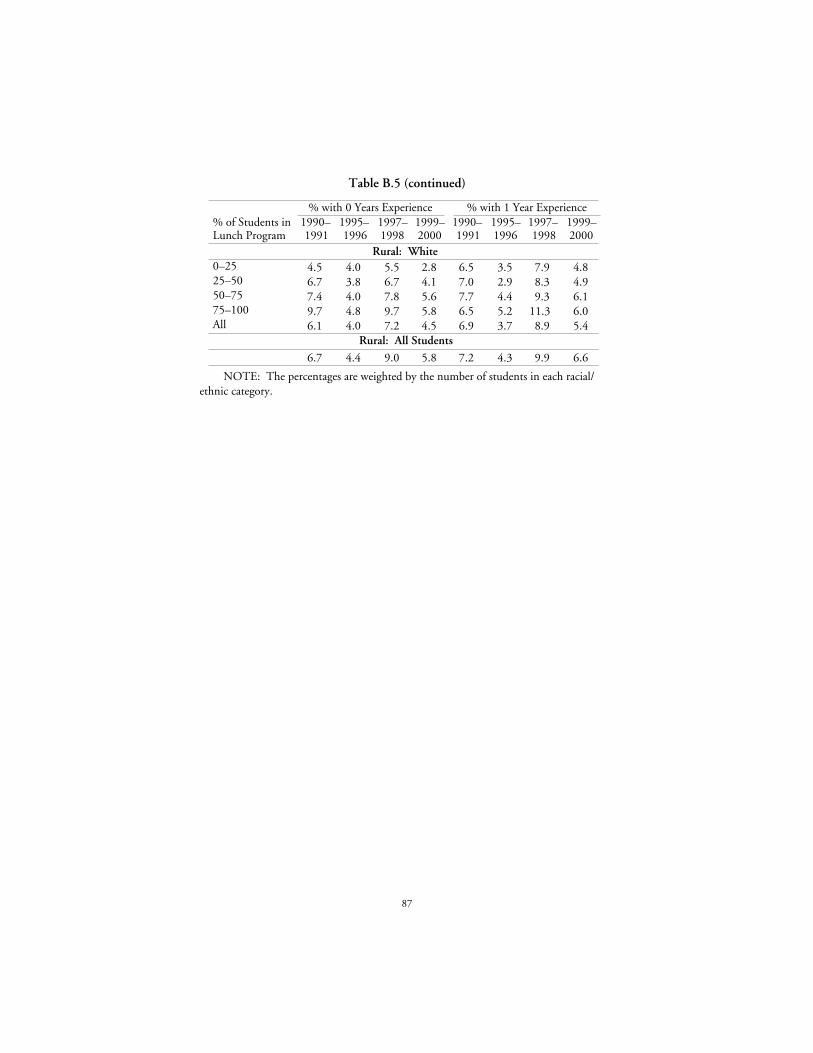
87
Table B.5 (continued)
% with 0 Years Experience % with 1 Year Experience% of Students inLunch Program
1990–1991
1995–1996
1997–1998
1999–2000
1990–1991
1995–1996
1997–1998
1999–2000
Rural: White0–25 4.5 4.0 5.5 2.8 6.5 3.5 7.9 4.825–50 6.7 3.8 6.7 4.1 7.0 2.9 8.3 4.950–75 7.4 4.0 7.8 5.6 7.7 4.4 9.3 6.175–100 9.7 4.8 9.7 5.8 6.5 5.2 11.3 6.0All 6.1 4.0 7.2 4.5 6.9 3.7 8.9 5.4
Rural: All Students
6.7 4.4 9.0 5.8 7.2 4.3 9.9 6.6
NOTE: The percentages are weighted by the number of students in each racial/ethnic category.
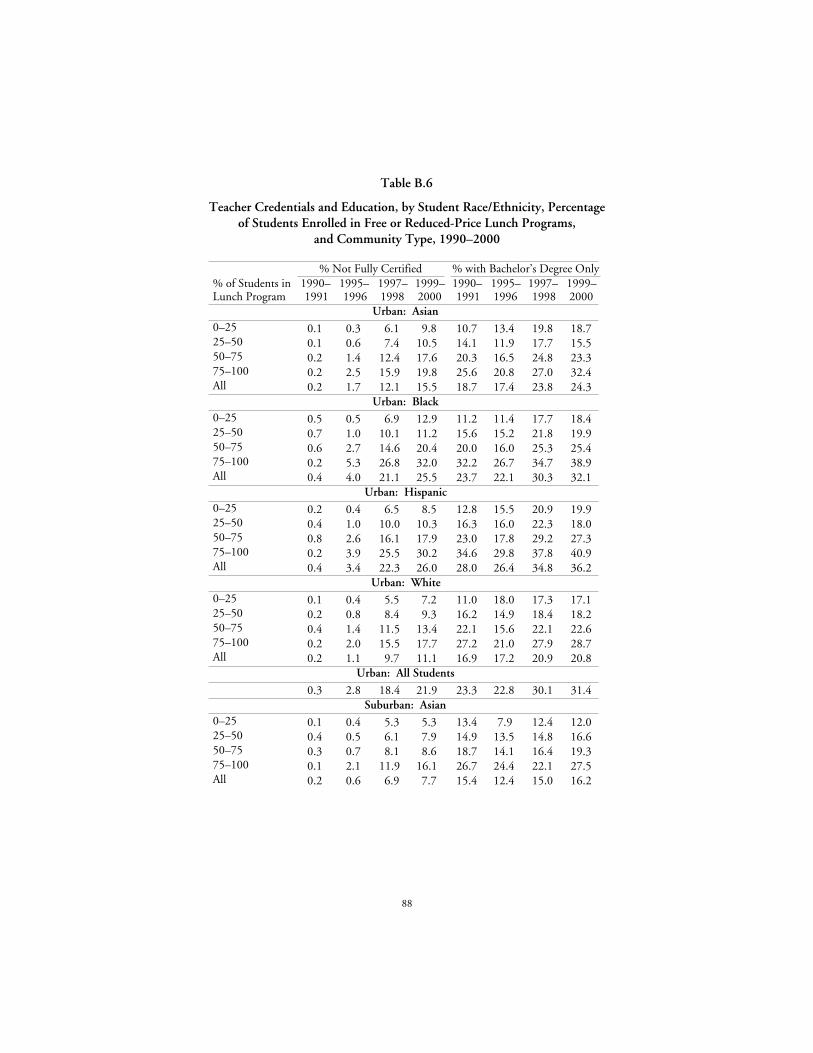
88
Table B.6
Teacher Credentials and Education, by Student Race/Ethnicity, Percentageof Students Enrolled in Free or Reduced-Price Lunch Programs,
and Community Type, 1990–2000
% Not Fully Certified % with Bachelor’s Degree Only% of Students inLunch Program
1990–1991
1995–1996
1997–1998
1999–2000
1990–1991
1995–1996
1997–1998
1999–2000
Urban: Asian0–25 0.1 0.3 6.1 9.8 10.7 13.4 19.8 18.725–50 0.1 0.6 7.4 10.5 14.1 11.9 17.7 15.550–75 0.2 1.4 12.4 17.6 20.3 16.5 24.8 23.375–100 0.2 2.5 15.9 19.8 25.6 20.8 27.0 32.4All 0.2 1.7 12.1 15.5 18.7 17.4 23.8 24.3
Urban: Black0–25 0.5 0.5 6.9 12.9 11.2 11.4 17.7 18.425–50 0.7 1.0 10.1 11.2 15.6 15.2 21.8 19.950–75 0.6 2.7 14.6 20.4 20.0 16.0 25.3 25.475–100 0.2 5.3 26.8 32.0 32.2 26.7 34.7 38.9All 0.4 4.0 21.1 25.5 23.7 22.1 30.3 32.1
Urban: Hispanic0–25 0.2 0.4 6.5 8.5 12.8 15.5 20.9 19.925–50 0.4 1.0 10.0 10.3 16.3 16.0 22.3 18.050–75 0.8 2.6 16.1 17.9 23.0 17.8 29.2 27.375–100 0.2 3.9 25.5 30.2 34.6 29.8 37.8 40.9All 0.4 3.4 22.3 26.0 28.0 26.4 34.8 36.2
Urban: White0–25 0.1 0.4 5.5 7.2 11.0 18.0 17.3 17.125–50 0.2 0.8 8.4 9.3 16.2 14.9 18.4 18.250–75 0.4 1.4 11.5 13.4 22.1 15.6 22.1 22.675–100 0.2 2.0 15.5 17.7 27.2 21.0 27.9 28.7All 0.2 1.1 9.7 11.1 16.9 17.2 20.9 20.8
Urban: All Students
0.3 2.8 18.4 21.9 23.3 22.8 30.1 31.4Suburban: Asian
0–25 0.1 0.4 5.3 5.3 13.4 7.9 12.4 12.025–50 0.4 0.5 6.1 7.9 14.9 13.5 14.8 16.650–75 0.3 0.7 8.1 8.6 18.7 14.1 16.4 19.375–100 0.1 2.1 11.9 16.1 26.7 24.4 22.1 27.5All 0.2 0.6 6.9 7.7 15.4 12.4 15.0 16.2
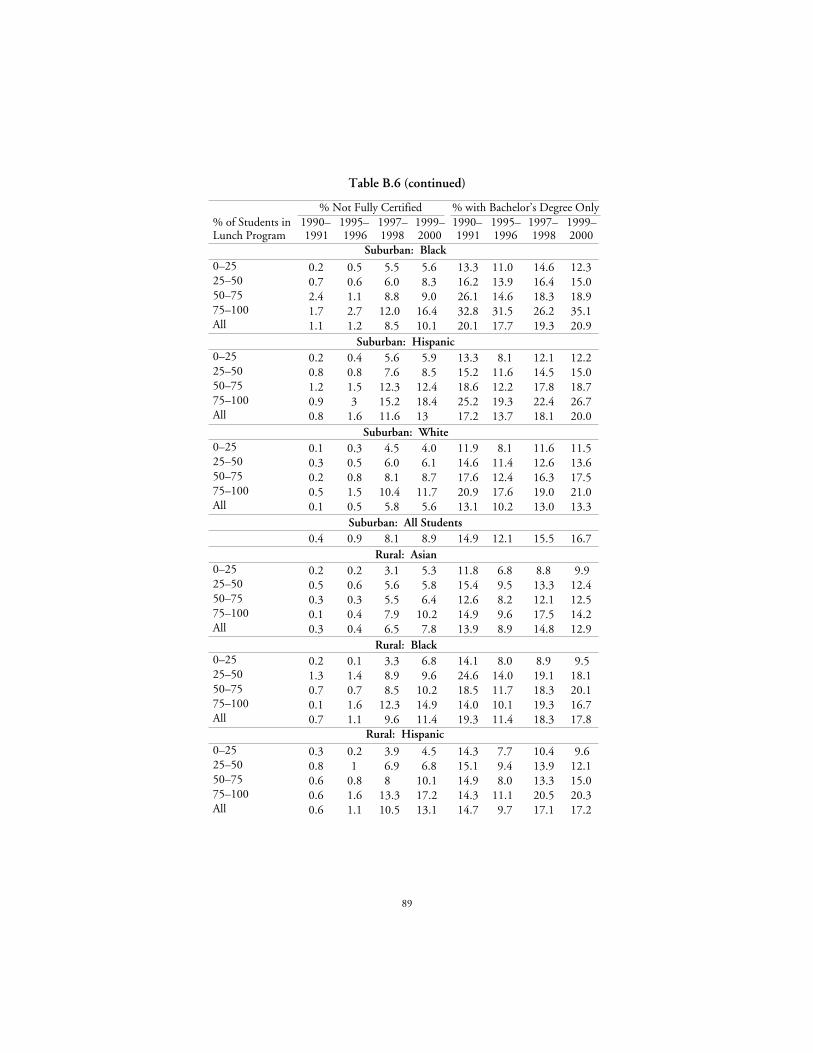
89
Table B.6 (continued)
% Not Fully Certified % with Bachelor’s Degree Only% of Students inLunch Program
1990–1991
1995–1996
1997–1998
1999–2000
1990–1991
1995–1996
1997–1998
1999–2000
Suburban: Black0–25 0.2 0.5 5.5 5.6 13.3 11.0 14.6 12.325–50 0.7 0.6 6.0 8.3 16.2 13.9 16.4 15.050–75 2.4 1.1 8.8 9.0 26.1 14.6 18.3 18.975–100 1.7 2.7 12.0 16.4 32.8 31.5 26.2 35.1All 1.1 1.2 8.5 10.1 20.1 17.7 19.3 20.9
Suburban: Hispanic0–25 0.2 0.4 5.6 5.9 13.3 8.1 12.1 12.225–50 0.8 0.8 7.6 8.5 15.2 11.6 14.5 15.050–75 1.2 1.5 12.3 12.4 18.6 12.2 17.8 18.775–100 0.9 3 15.2 18.4 25.2 19.3 22.4 26.7All 0.8 1.6 11.6 13 17.2 13.7 18.1 20.0
Suburban: White0–25 0.1 0.3 4.5 4.0 11.9 8.1 11.6 11.525–50 0.3 0.5 6.0 6.1 14.6 11.4 12.6 13.650–75 0.2 0.8 8.1 8.7 17.6 12.4 16.3 17.575–100 0.5 1.5 10.4 11.7 20.9 17.6 19.0 21.0All 0.1 0.5 5.8 5.6 13.1 10.2 13.0 13.3
Suburban: All Students0.4 0.9 8.1 8.9 14.9 12.1 15.5 16.7
Rural: Asian0–25 0.2 0.2 3.1 5.3 11.8 6.8 8.8 9.925–50 0.5 0.6 5.6 5.8 15.4 9.5 13.3 12.450–75 0.3 0.3 5.5 6.4 12.6 8.2 12.1 12.575–100 0.1 0.4 7.9 10.2 14.9 9.6 17.5 14.2All 0.3 0.4 6.5 7.8 13.9 8.9 14.8 12.9
Rural: Black0–25 0.2 0.1 3.3 6.8 14.1 8.0 8.9 9.525–50 1.3 1.4 8.9 9.6 24.6 14.0 19.1 18.150–75 0.7 0.7 8.5 10.2 18.5 11.7 18.3 20.175–100 0.1 1.6 12.3 14.9 14.0 10.1 19.3 16.7All 0.7 1.1 9.6 11.4 19.3 11.4 18.3 17.8
Rural: Hispanic0–25 0.3 0.2 3.9 4.5 14.3 7.7 10.4 9.625–50 0.8 1 6.9 6.8 15.1 9.4 13.9 12.150–75 0.6 0.8 8 10.1 14.9 8.0 13.3 15.075–100 0.6 1.6 13.3 17.2 14.3 11.1 20.5 20.3All 0.6 1.1 10.5 13.1 14.7 9.7 17.1 17.2
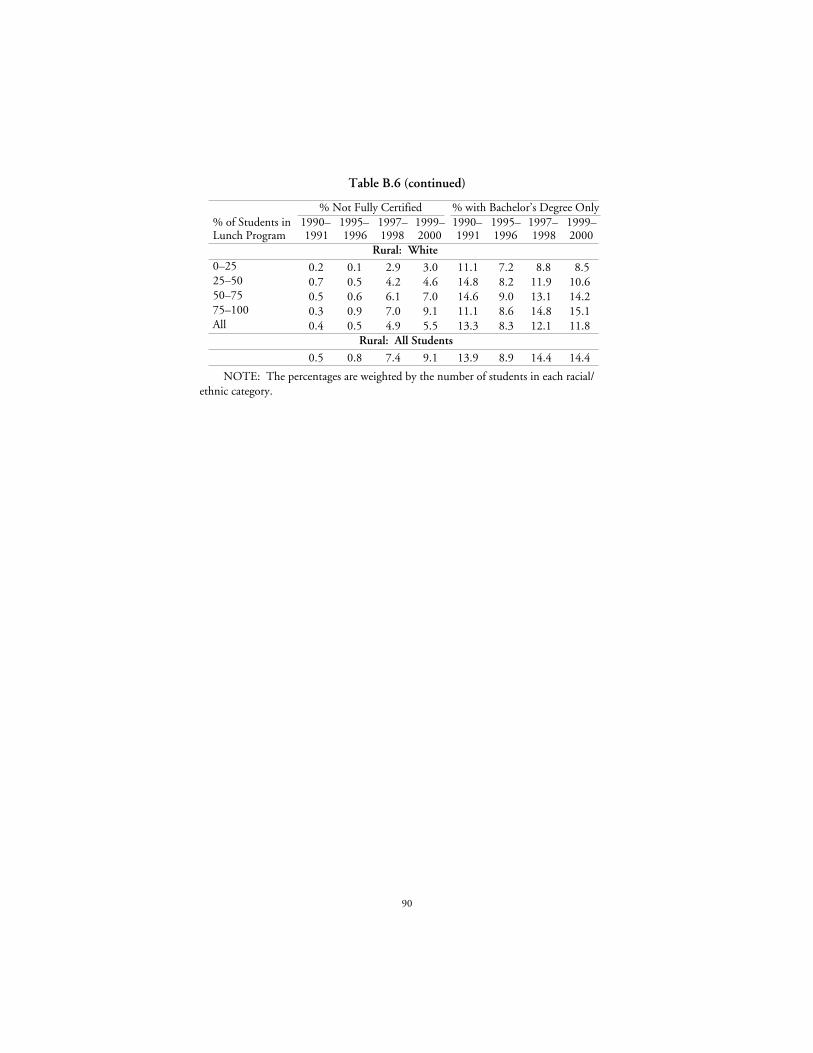
90
Table B.6 (continued)
% Not Fully Certified % with Bachelor’s Degree Only% of Students inLunch Program
1990–1991
1995–1996
1997–1998
1999–2000
1990–1991
1995–1996
1997–1998
1999–2000
Rural: White0–25 0.2 0.1 2.9 3.0 11.1 7.2 8.8 8.525–50 0.7 0.5 4.2 4.6 14.8 8.2 11.9 10.650–75 0.5 0.6 6.1 7.0 14.6 9.0 13.1 14.275–100 0.3 0.9 7.0 9.1 11.1 8.6 14.8 15.1All 0.4 0.5 4.9 5.5 13.3 8.3 12.1 11.8
Rural: All Students
0.5 0.8 7.4 9.1 13.9 8.9 14.4 14.4
NOTE: The percentages are weighted by the number of students in each racial/ethnic category.
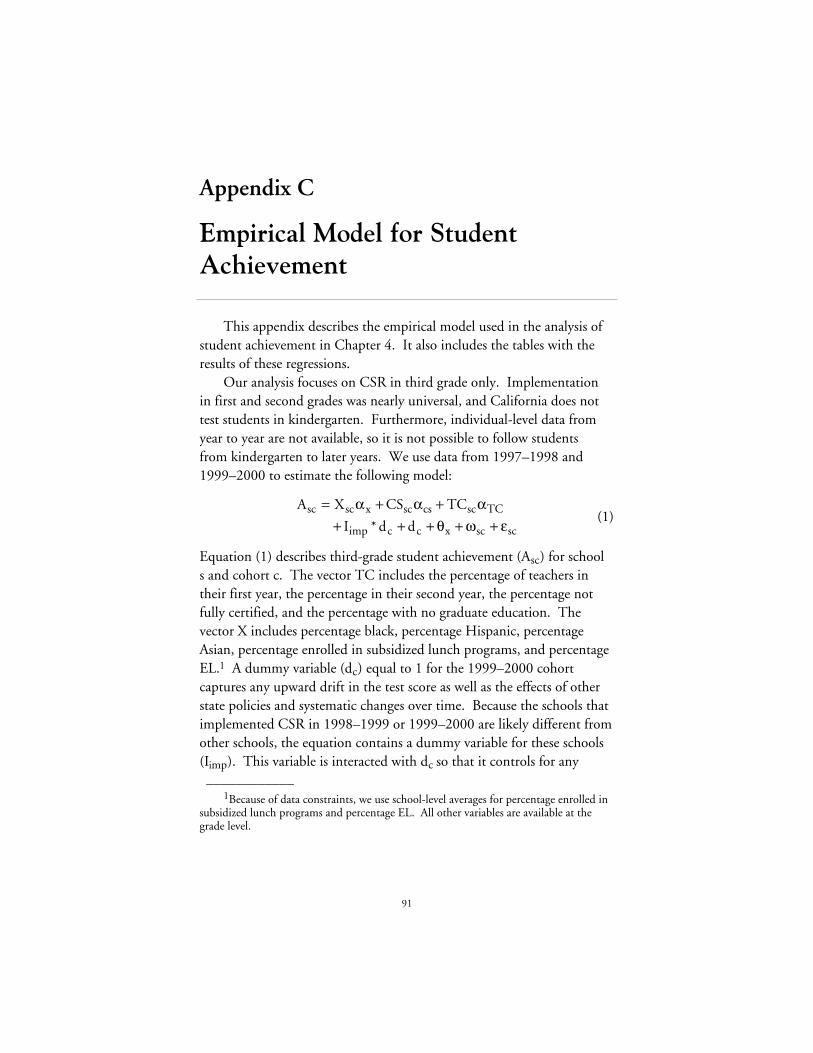
91
Appendix C
Empirical Model for StudentAchievement
This appendix describes the empirical model used in the analysis ofstudent achievement in Chapter 4. It also includes the tables with theresults of these regressions.
Our analysis focuses on CSR in third grade only. Implementationin first and second grades was nearly universal, and California does nottest students in kindergarten. Furthermore, individual-level data fromyear to year are not available, so it is not possible to follow studentsfrom kindergarten to later years. We use data from 1997–1998 and1999–2000 to estimate the following model:
A X CS TC
I d dsc sc x sc cs sc TC
imp c c x sc sc
= + ++ + + + +
α α αθ ω ε*
(1)
Equation (1) describes third-grade student achievement (Asc) for schools and cohort c. The vector TC includes the percentage of teachers intheir first year, the percentage in their second year, the percentage notfully certified, and the percentage with no graduate education. Thevector X includes percentage black, percentage Hispanic, percentageAsian, percentage enrolled in subsidized lunch programs, and percentageEL.1 A dummy variable (dc) equal to 1 for the 1999–2000 cohortcaptures any upward drift in the test score as well as the effects of otherstate policies and systematic changes over time. Because the schools thatimplemented CSR in 1998–1999 or 1999–2000 are likely different fromother schools, the equation contains a dummy variable for these schools(Iimp). This variable is interacted with dc so that it controls for any____________
1Because of data constraints, we use school-level averages for percentage enrolled insubsidized lunch programs and percentage EL. All other variables are available at thegrade level.
92
systematic differences in the rate of test score growth over time betweenearly and late adopters. Unobserved school quality is decomposed into apermanent (θ) and a time-varying component (ω), the latter of whichprimarily reflects changes over time in teacher quality that are notcaptured by the included characteristics.
Ordinary least squares estimation of Eq. (1) that does not control forunobserved differences among schools is probably going to generatebiased estimates, because there are many differences among schools notcaptured by the limited set of included variables. Therefore, we include afixed effect for each school that captures all systematic differences amongschools that are stable over time. The estimates are identified by within-school changes in class size, teacher characteristics, and achievement.
It is important to note that the school fixed effects do not control forother factors that may change over time at schools and that may becorrelated with class size. One such factor is teacher quality. If teacherquality tends to decline as class size is reduced because schools hire lower-quality teachers than those already teaching (and the decline is notcompletely captured by the included teacher variables), the estimatedclass size effect will combine such a change in teacher quality with thedirect effect of smaller classes.
In most cases, this would present a serious problem, but we believethat the identification of any change in teacher quality that accompaniedCSR is crucial to a comprehensive understanding of policy effectiveness.This is very difficult in the case of CSR, because many schools had fullyimplemented CSR before the first year of data were collected, and theremaining schools likely differ in important ways. Nevertheless, weattempt to learn something about the decline in instructionaleffectiveness by comparing class size effects for schools that adopted CSRduring our sample to those for schools that adopted CSR earlier (ornever).
Variation in class size for early adopters results entirely from smallyear-to-year changes in enrollment that lead class size to fluctuate at orbelow 20 students.2 Once schools have implemented CSR, there is no____________
2Similarly, schools that did not adopt CSR as of 1999–2000 had variation in classsize based on small year-to-year changes in enrollment.
93
longer a need to hire additional teachers, and these fluctuations areunlikely to be correlated with systematic changes in teacher quality. Onthe other hand, the pre-CSR/post-CSR difference in class size is drivenpredominantly by the hiring of additional teachers. Therefore, class-sizeestimates from these schools are likely to capture any decline in teacherquality that is linked to the magnitude of the reduction in class sizeneeded to satisfy CSR. Note that the more class size had to be reducedthe larger is the proportional increase in the teaching force.
This technique does not capture all of the changes in CSR thatoccurred throughout the state. First, teacher quality declines resultingfrom the hiring away of teachers by other districts, even after the schoolin question has reduced class size, are not captured. At the same time,there is concern that other factors (e.g., facility difficulties) may reducethe benefits of smaller classes for late adopters. The late-adopter fixedeffect captures systematic differences in the change in test scores between1997 and 1999, so the class-size estimates would capture only suchdifferences that are correlated with the change in class size.
To separate short- from long-term effects, we actually estimate twoequations, with and without teacher characteristics:
A X CS I CS I
d d I
sc sc x sc imp CSimp sc not CSnot
s c c imp sc sc
= + +
+ + + + +
α α α
θ ω ε
*
*
*(2)
A X CS I CS I
TC I TC I
d d I
sc sc x sc imp CSimp sc not CSnot
sc imp TCimp sc not TCnot
s c c imp sc sc
= + +
+ +
+ + + + +
α α α
α α
θ ω ε
*
* *
*
*
(3)
Inot is a dummy variable for schools that did not implement CSR in1998–1999 or 1999–2000. All other variables (including Iimp) aredefined as in Eq. (1).
How should the results be interpreted? We predict that the need tohire large numbers of inexperienced teachers reduces the class-size effectfor schools implementing CSR late (Iimp = 1), so that it is smaller thanthe effect for other schools. One possibility is that a smaller effect for lateadopters reflects the temporary problems at the time of CSR
94
implementation faced by many schools, including the addition of manynew teachers. Under this interpretation, other aspects of schoolsincluding teacher quality will return to pre-CSR levels after a few years.If the inclusion of teacher experience, certification, and educationeliminates much or all of the gap in class size effects between early andlate adopters, it would suggest that the gap reflects a temporary cost.
An alternative possibility is that the difference between early and lateadopters captures a permanent decline in teacher quality that movesaffected schools to a lower long-run average. If the inclusion of teacherexperience, certification, and education eliminates little or none of thegap, it would suggest that the gap reflects longer-term reductions inteacher quality that likely affected all relevant schools. Because the effectof CSR may differ by student demographics, we allow the effects of classsize to vary along a number of dimensions.
All in all, this approach attempts to uncover a portion of the changein teacher quality associated with CSR implementation. The teachercharacteristic tables in Chapter 3 provide clear evidence that CSR ledmany schools (particularly those with predominantly poor and minoritystudent bodies) to hire not fully certified and inexperienced teachers.Unfortunately, the included teacher characteristics measure only someaspects of teacher quality, which leads us to an alternative approach basedon differences in effect sizes by timing of CSR implementation. Thisapproach is likely to provide additional information, although, as notedabove, it does not capture any changes in teacher quality not related tothe school’s own reduction of class size.
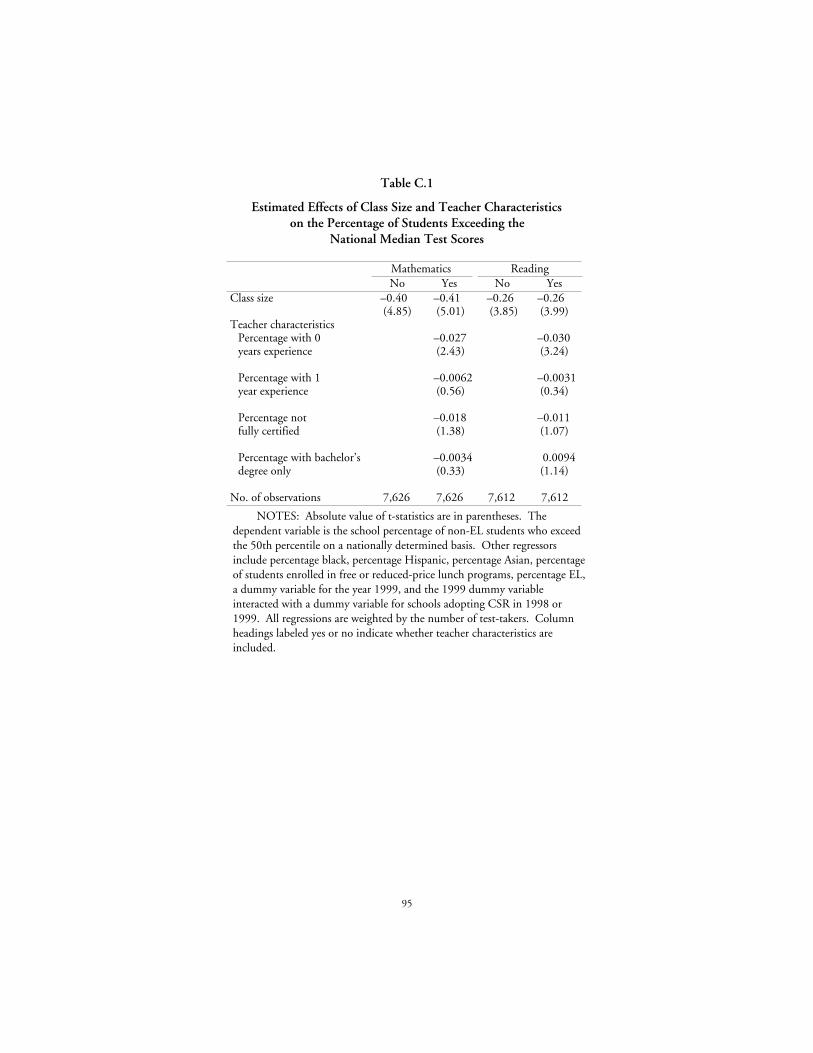
95
Table C.1
Estimated Effects of Class Size and Teacher Characteristicson the Percentage of Students Exceeding the
National Median Test Scores
Mathematics ReadingNo Yes No Yes
Class size –0.40 –0.41 –0.26 –0.26(4.85) (5.01) (3.85) (3.99)
Teacher characteristicsPercentage with 0 –0.027 –0.030years experience (2.43) (3.24)
Percentage with 1 –0.0062 –0.0031year experience (0.56) (0.34)
Percentage not –0.018 –0.011fully certified (1.38) (1.07)
Percentage with bachelor’s –0.0034 0.0094degree only (0.33) (1.14)
No. of observations 7,626 7,626 7,612 7,612
NOTES: Absolute value of t-statistics are in parentheses. Thedependent variable is the school percentage of non-EL students who exceedthe 50th percentile on a nationally determined basis. Other regressorsinclude percentage black, percentage Hispanic, percentage Asian, percentageof students enrolled in free or reduced-price lunch programs, percentage EL,a dummy variable for the year 1999, and the 1999 dummy variableinteracted with a dummy variable for schools adopting CSR in 1998 or1999. All regressions are weighted by the number of test-takers. Columnheadings labeled yes or no indicate whether teacher characteristics areincluded.
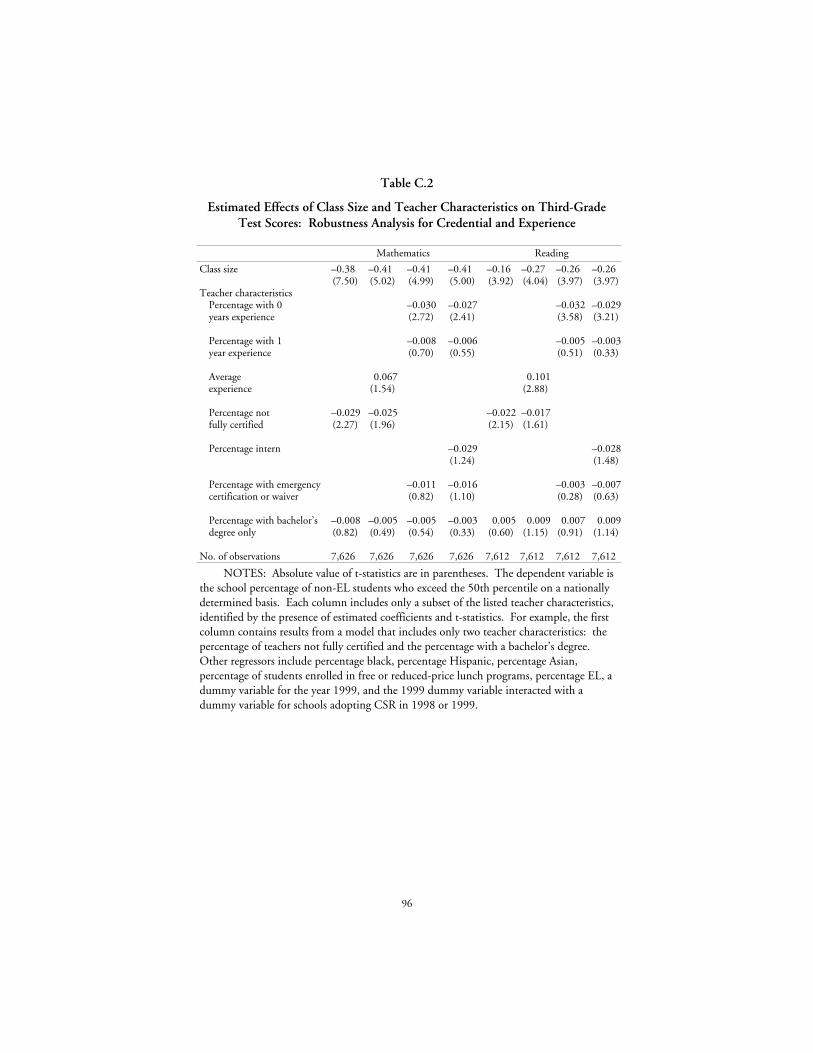
96
Table C.2
Estimated Effects of Class Size and Teacher Characteristics on Third-GradeTest Scores: Robustness Analysis for Credential and Experience
Mathematics Reading
Class size –0.38 –0.41 –0.41 –0.41 –0.16 –0.27 –0.26 –0.26(7.50) (5.02) (4.99) (5.00) (3.92) (4.04) (3.97) (3.97)
Teacher characteristicsPercentage with 0 –0.030 –0.027 –0.032 –0.029years experience (2.72) (2.41) (3.58) (3.21)
Percentage with 1 –0.008 –0.006 –0.005 –0.003year experience (0.70) (0.55) (0.51) (0.33)
Average 0.067 0.101experience (1.54) (2.88)
Percentage not –0.029 –0.025 –0.022 –0.017fully certified (2.27) (1.96) (2.15) (1.61)
Percentage intern –0.029 –0.028(1.24) (1.48)
Percentage with emergency –0.011 –0.016 –0.003 –0.007certification or waiver (0.82) (1.10) (0.28) (0.63)
Percentage with bachelor’s –0.008 –0.005 –0.005 –0.003 0.005 0.009 0.007 0.009degree only (0.82) (0.49) (0.54) (0.33) (0.60) (1.15) (0.91) (1.14)
No. of observations 7,626 7,626 7,626 7,626 7,612 7,612 7,612 7,612
NOTES: Absolute value of t-statistics are in parentheses. The dependent variable isthe school percentage of non-EL students who exceed the 50th percentile on a nationallydetermined basis. Each column includes only a subset of the listed teacher characteristics,identified by the presence of estimated coefficients and t-statistics. For example, the firstcolumn contains results from a model that includes only two teacher characteristics: thepercentage of teachers not fully certified and the percentage with a bachelor’s degree.Other regressors include percentage black, percentage Hispanic, percentage Asian,percentage of students enrolled in free or reduced-price lunch programs, percentage EL, adummy variable for the year 1999, and the 1999 dummy variable interacted with adummy variable for schools adopting CSR in 1998 or 1999.
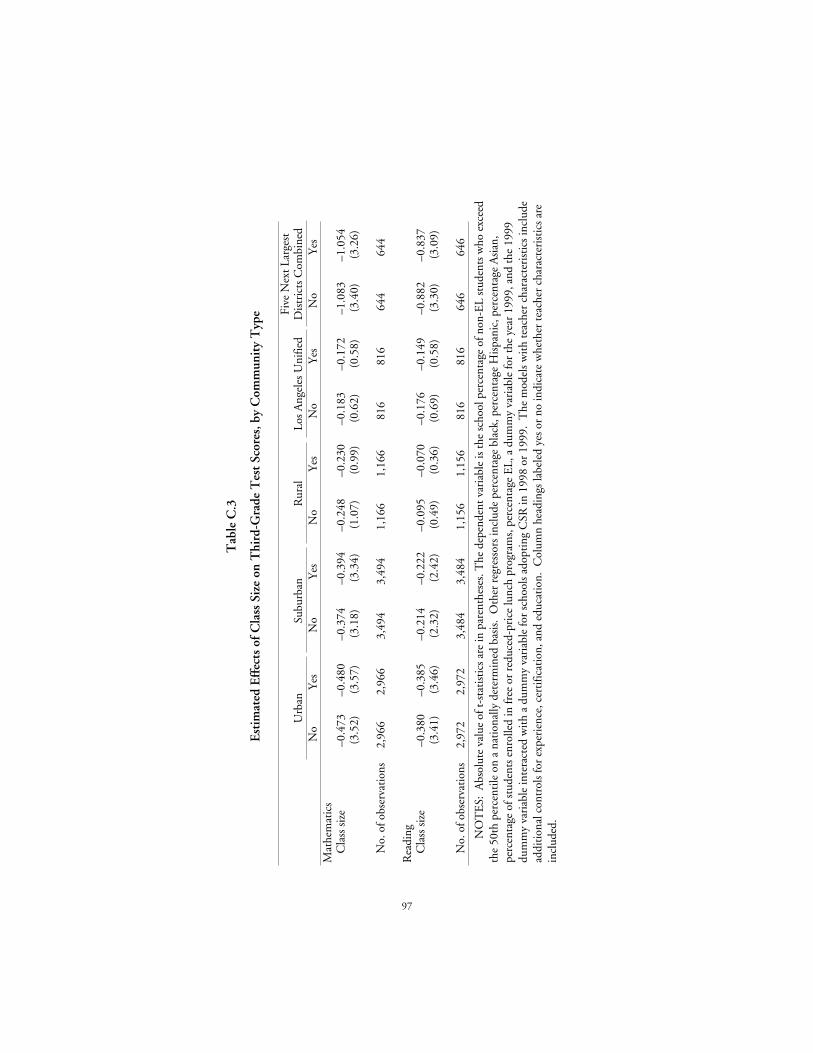
Tab
le C
.3
Est
imat
ed E
ffec
ts o
f Cla
ss S
ize
on T
hird
-Gra
de T
est
Scor
es, b
y C
omm
unit
y T
ype
Urb
anSu
burb
anR
ural
Los
Ang
eles
Uni
fied
Five
Nex
t Lar
gest
Dis
tric
ts C
ombi
ned
No
Yes
No
Yes
No
Yes
No
Yes
No
Yes
Mat
hem
atic
sC
lass
siz
e–0
.473
–0.4
80–0
.374
–0.3
94–0
.248
–0.2
30–0
.183
–0.1
72–1
.083
–1.0
54(3
.52)
(3.5
7)(3
.18)
(3.3
4)(1
.07)
(0.9
9)(0
.62)
(0.5
8)(3
.40)
(3.2
6)
No.
of o
bser
vati
ons
2,96
62,
966
3,49
43,
494
1,16
61,
166
816
816
644
644
Rea
ding
Cla
ss s
ize
–0.3
80–0
.385
–0.2
14–0
.222
–0.0
95–0
.070
–0.1
76–0
.149
–0.8
82–0
.837
(3.4
1)(3
.46)
(2.3
2)(2
.42)
(0.4
9)(0
.36)
(0.6
9)(0
.58)
(3.3
0)(3
.09)
No.
of o
bser
vati
ons
2,97
22,
972
3,48
43,
484
1,15
61,
156
816
816
646
646
NO
TE
S: A
bsol
ute
valu
e of
t-st
atis
tics
are
in p
aren
thes
es. T
he d
epen
dent
var
iabl
e is
the
scho
ol p
erce
ntag
e of
non
-EL
stud
ents
who
exc
eed
the
50th
per
cent
ile o
n a
nati
onal
ly d
eter
min
ed b
asis
. O
ther
reg
ress
ors
incl
ude
perc
enta
ge b
lack
, per
cent
age
His
pani
c, p
erce
ntag
e A
sian
,pe
rcen
tage
of s
tude
nts
enro
lled
in fr
ee o
r re
duce
d-pr
ice
lunc
h pr
ogra
ms,
per
cent
age
EL,
a d
umm
y va
riab
le fo
r th
e ye
ar 1
999,
and
the
1999
dum
my
vari
able
inte
ract
ed w
ith
a du
mm
y va
riab
le fo
r sc
hool
s ad
opti
ng C
SR in
199
8 or
199
9. T
he m
odel
s w
ith
teac
her
char
acte
rist
ics
incl
ude
addi
tion
al c
ontr
ols
for
expe
rien
ce, c
erti
ficat
ion,
and
edu
cati
on.
Col
umn
head
ings
labe
led
yes
or n
o in
dica
te w
heth
er te
ache
r ch
arac
teri
stic
s ar
ein
clud
ed.
97
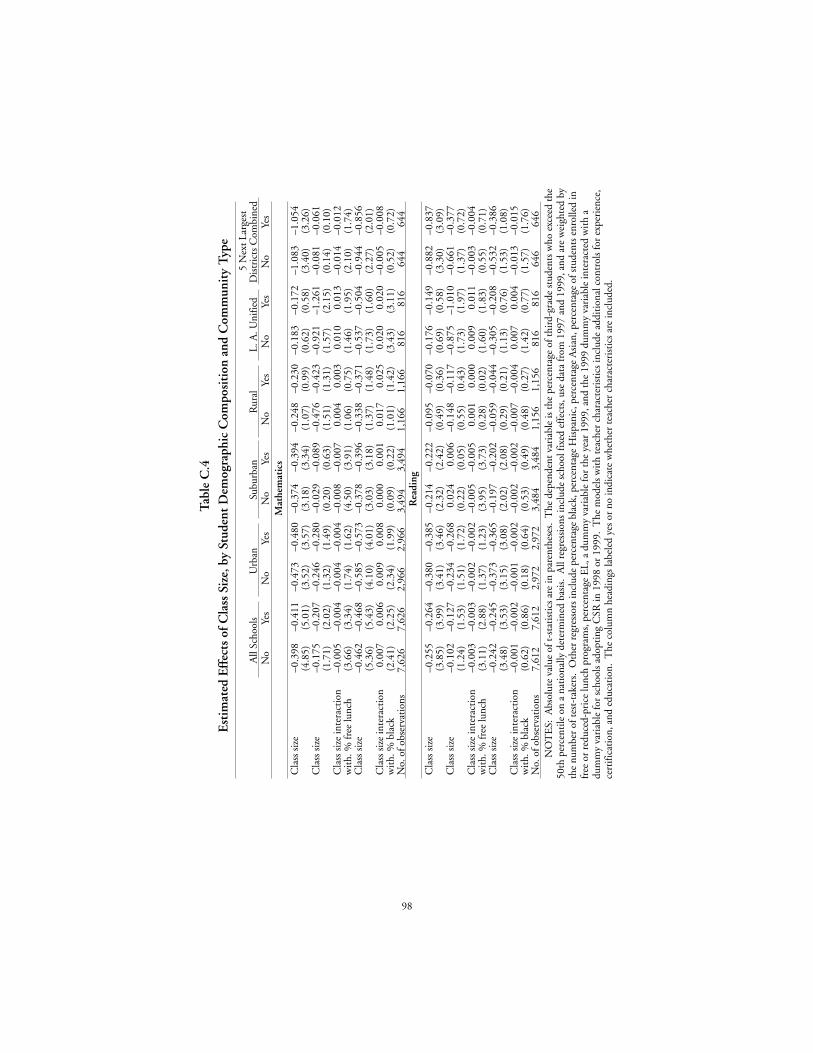
Tab
le C
.4E
stim
ated
Eff
ects
of C
lass
Siz
e, b
y St
uden
t D
emog
raph
ic C
ompo
siti
on a
nd C
omm
unit
y T
ype
All
Scho
ols
Urb
anSu
burb
anR
ural
L. A
. Uni
fied
5 N
ext L
arge
stD
istr
icts
Com
bine
dN
oYe
sN
oYe
sN
oYe
sN
oYe
sN
oYe
sN
oYe
sM
athe
mat
ics
Cla
ss s
ize
–0.3
98–0
.411
–0.4
73–0
.480
–0.3
74–0
.394
–0.2
48–0
.230
–0.1
83–0
.172
–1.0
83–1
.054
(4.8
5)(5
.01)
(3.5
2)(3
.57)
(3.1
8)(3
.34)
(1.0
7)(0
.99)
(0.6
2)(0
.58)
(3.4
0)(3
.26)
Cla
ss s
ize
–0.1
75–0
.207
–0.2
46–0
.280
–0.0
29–0
.089
–0.4
76–0
.423
–0.9
21–1
.261
–0.0
81–0
.061
(1.7
1)(2
.02)
(1.3
2)(1
.49)
(0.2
0)(0
.63)
(1.5
1)(1
.31)
(1.5
7)(2
.15)
(0.1
4)(0
.10)
Cla
ss s
ize
inte
ract
ion
–0.0
05–0
.004
–0.0
04–0
.004
–0.0
08–0
.007
0.00
40.
003
0.01
00.
013
–0.0
14–0
.012
wit
h. %
free
lunc
h(3
.66)
(3.3
4)(1
.74)
(1.6
2)(4
.50)
(3.9
1)(1
.06)
(0.7
5)(1
.46)
(1.9
5)(2
.10)
(1.7
4)C
lass
siz
e–0
.462
–0.4
68–0
.585
–0.5
73–0
.378
–0.3
96–0
.338
–0.3
71–0
.537
–0.5
04–0
.944
–0.8
56(5
.36)
(5.4
3)(4
.10)
(4.0
1)(3
.03)
(3.1
8)(1
.37)
(1.4
8)(1
.73)
(1.6
0)(2
.27)
(2.0
1)C
lass
siz
e in
tera
ctio
n0.
007
0.00
60.
009
0.00
80.
000
0.00
10.
017
0.02
50.
020
0.02
0–0
.005
–0.0
08w
ith.
% b
lack
(2.4
1)(2
.25)
(2.3
4)(1
.99)
(0.0
9)(0
.22)
(1.0
1)(1
.42)
(3.4
3)(3
.11)
(0.5
2)(0
.72)
No.
of o
bser
vati
ons
7,62
67,
626
2,96
62,
966
3,49
43,
494
1,16
61,
166
816
816
644
644
Rea
ding
Cla
ss s
ize
–0.2
55–0
.264
–0.3
80–0
.385
–0.2
14–0
.222
–0.0
95–0
.070
–0.1
76–0
.149
–0.8
82–0
.837
(3.8
5)(3
.99)
(3.4
1)(3
.46)
(2.3
2)(2
.42)
(0.4
9)(0
.36)
(0.6
9)(0
.58)
(3.3
0)(3
.09)
Cla
ss s
ize
–0.1
02–0
.127
–0.2
34–0
.268
0.02
40.
006
–0.1
48–0
.117
–0.8
75–1
.010
–0.6
61–0
.377
(1.2
4)(1
.53)
(1.5
1)(1
.72)
(0.2
2)(0
.05)
(0.5
5)(0
.43)
(1.7
3)(1
.97)
(1.3
7)(0
.72)
Cla
ss s
ize
inte
ract
ion
–0.0
03–0
.003
–0.0
02–0
.002
–0.0
05–0
.005
0.00
10.
000
0.00
90.
011
–0.0
03–0
.004
wit
h. %
free
lunc
h(3
.11)
(2.8
8)(1
.37)
(1.2
3)(3
.95)
(3.7
3)(0
.28)
(0.0
2)(1
.60)
(1.8
3)(0
.55)
(0.7
1)C
lass
siz
e–0
.242
–0.2
45–0
.373
–0.3
65–0
.197
–0.2
02–0
.059
–0.0
44–0
.305
–0.2
08–0
.532
–0.3
86(3
.48)
(3.5
3)(3
.15)
(3.0
8)(2
.02)
(2.0
8)(0
.29)
(0.2
1)(1
.13)
(0.7
6)(1
.53)
(1.0
8)C
lass
siz
e in
tera
ctio
n–0
.001
–0.0
02–0
.001
–0.0
02–0
.002
–0.0
02–0
.007
–0.0
040.
007
0.00
4–0
.013
–0.0
15w
ith.
% b
lack
(0.6
2)(0
.86)
(0.1
8)(0
.64)
(0.5
3)(0
.49)
(0.4
8)(0
.27)
(1.4
2)(0
.77)
(1.5
7)(1
.76)
No.
of o
bser
vati
ons
7,61
27,
612
2,97
22,
972
3,48
43,
484
1,15
61,
156
816
816
646
646
NO
TE
S: A
bsol
ute
valu
e of
t-st
atis
tics
are
in p
aren
thes
es.
The
dep
ende
nt v
aria
ble
is th
e pe
rcen
tage
of t
hird
-gra
de s
tude
nts
who
exc
eed
the
50th
per
cent
ile o
n a
nati
onal
ly d
eter
min
ed b
asis
. A
ll re
gres
sion
s in
clud
e sc
hool
fixe
d ef
fect
s, u
se d
ata
from
199
7 an
d 19
99, a
nd a
re w
eigh
ted
byth
e nu
mbe
r of
test
-tak
ers.
Oth
er r
egre
ssor
s in
clud
e pe
rcen
tage
bla
ck, p
erce
ntag
e H
ispa
nic,
per
cent
age
Asi
an, p
erce
ntag
e of
stu
dent
s en
rolle
d in
free
or
redu
ced-
pric
e lu
nch
prog
ram
s, p
erce
ntag
e E
L, a
dum
my
vari
able
for
the
year
199
9, a
nd th
e 19
99 d
umm
y va
riab
le in
tera
cted
wit
h a
dum
my
vari
able
for
scho
ols
adop
ting
CSR
in 1
998
or 1
999.
The
mod
els
wit
h te
ache
r ch
arac
teri
stic
s in
clud
e ad
diti
onal
con
trol
s fo
r ex
peri
ence
,ce
rtifi
cati
on, a
nd e
duca
tion
.T
he c
olum
n he
adin
gs la
bele
d ye
s or
no
indi
cate
whe
ther
teac
her
char
acte
rist
ics
are
incl
uded
.
98
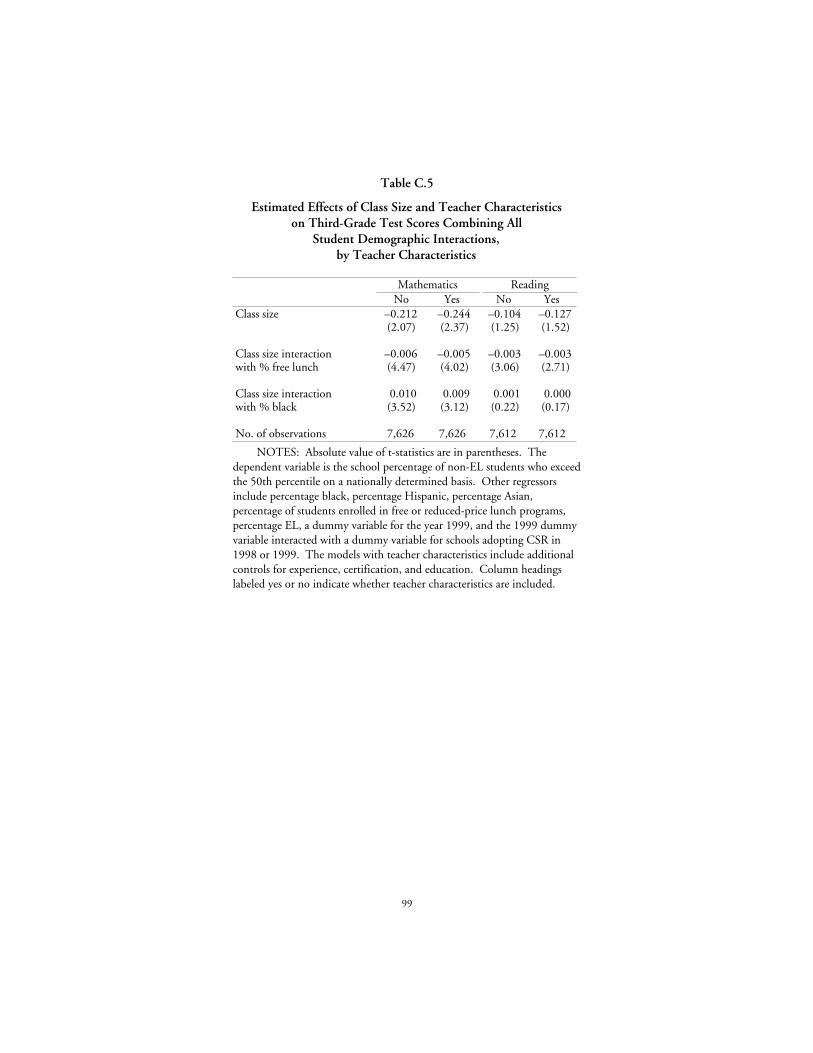
99
Table C.5
Estimated Effects of Class Size and Teacher Characteristicson Third-Grade Test Scores Combining All
Student Demographic Interactions,by Teacher Characteristics
Mathematics ReadingNo Yes No Yes
Class size –0.212 –0.244 –0.104 –0.127(2.07) (2.37) (1.25) (1.52)
Class size interaction –0.006 –0.005 –0.003 –0.003with % free lunch (4.47) (4.02) (3.06) (2.71)
Class size interaction 0.010 0.009 0.001 0.000with % black (3.52) (3.12) (0.22) (0.17)
No. of observations 7,626 7,626 7,612 7,612
NOTES: Absolute value of t-statistics are in parentheses. Thedependent variable is the school percentage of non-EL students who exceedthe 50th percentile on a nationally determined basis. Other regressorsinclude percentage black, percentage Hispanic, percentage Asian,percentage of students enrolled in free or reduced-price lunch programs,percentage EL, a dummy variable for the year 1999, and the 1999 dummyvariable interacted with a dummy variable for schools adopting CSR in1998 or 1999. The models with teacher characteristics include additionalcontrols for experience, certification, and education. Column headingslabeled yes or no indicate whether teacher characteristics are included.
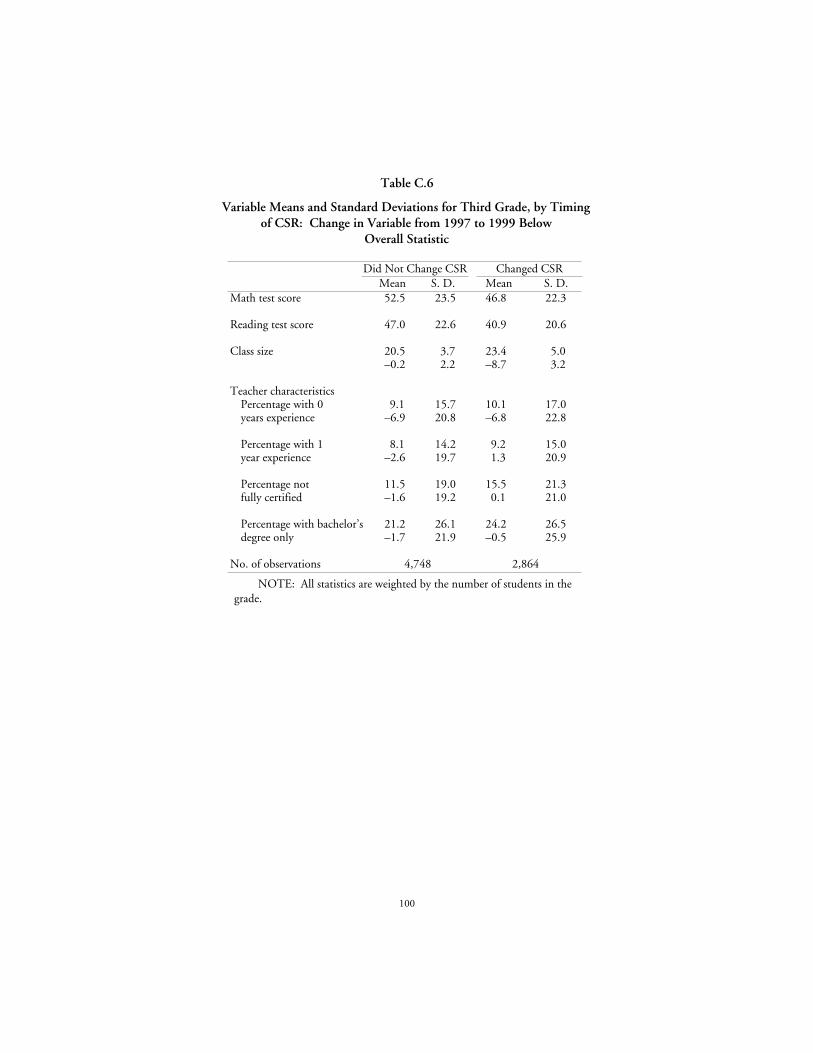
100
Table C.6
Variable Means and Standard Deviations for Third Grade, by Timingof CSR: Change in Variable from 1997 to 1999 Below
Overall Statistic
Did Not Change CSR Changed CSRMean S. D. Mean S. D.
Math test score 52.5 23.5 46.8 22.3
Reading test score 47.0 22.6 40.9 20.6
Class size 20.5 3.7 23.4 5.0–0.2 2.2 –8.7 3.2
Teacher characteristicsPercentage with 0 9.1 15.7 10.1 17.0years experience –6.9 20.8 –6.8 22.8
Percentage with 1 8.1 14.2 9.2 15.0year experience –2.6 19.7 1.3 20.9
Percentage not 11.5 19.0 15.5 21.3fully certified –1.6 19.2 0.1 21.0
Percentage with bachelor’sdegree only
21.2–1.7
26.121.9
24.2–0.5
26.525.9
No. of observations 4,748 2,864
NOTE: All statistics are weighted by the number of students in thegrade.
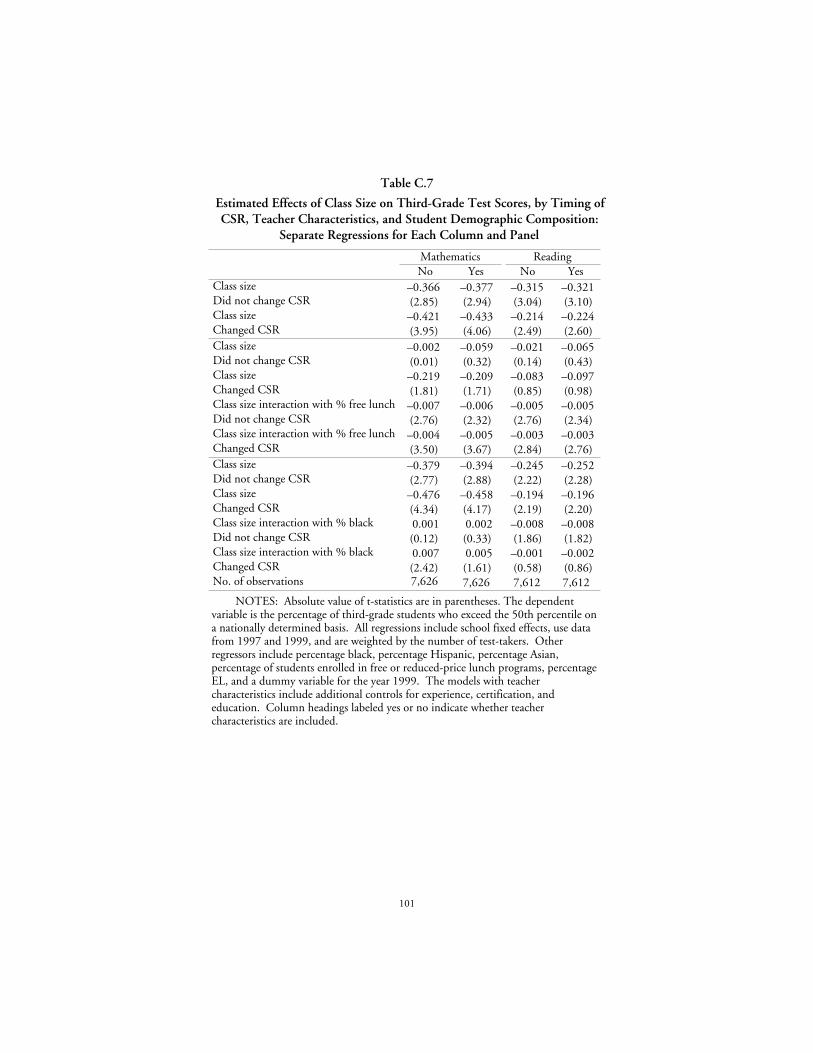
101
Table C.7
Estimated Effects of Class Size on Third-Grade Test Scores, by Timing ofCSR, Teacher Characteristics, and Student Demographic Composition:
Separate Regressions for Each Column and Panel
Mathematics ReadingNo Yes No Yes
Class size –0.366 –0.377 –0.315 –0.321Did not change CSR (2.85) (2.94) (3.04) (3.10)Class size –0.421 –0.433 –0.214 –0.224Changed CSR (3.95) (4.06) (2.49) (2.60)Class size –0.002 –0.059 –0.021 –0.065Did not change CSR (0.01) (0.32) (0.14) (0.43)Class size –0.219 –0.209 –0.083 –0.097Changed CSR (1.81) (1.71) (0.85) (0.98)Class size interaction with % free lunch –0.007 –0.006 –0.005 –0.005Did not change CSR (2.76) (2.32) (2.76) (2.34)Class size interaction with % free lunch –0.004 –0.005 –0.003 –0.003Changed CSR (3.50) (3.67) (2.84) (2.76)Class size –0.379 –0.394 –0.245 –0.252Did not change CSR (2.77) (2.88) (2.22) (2.28)Class size –0.476 –0.458 –0.194 –0.196Changed CSR (4.34) (4.17) (2.19) (2.20)Class size interaction with % black 0.001 0.002 –0.008 –0.008Did not change CSR (0.12) (0.33) (1.86) (1.82)Class size interaction with % black 0.007 0.005 –0.001 –0.002Changed CSR (2.42) (1.61) (0.58) (0.86)No. of observations 7,626 7,626 7,612 7,612
NOTES: Absolute value of t-statistics are in parentheses. The dependentvariable is the percentage of third-grade students who exceed the 50th percentile ona nationally determined basis. All regressions include school fixed effects, use datafrom 1997 and 1999, and are weighted by the number of test-takers. Otherregressors include percentage black, percentage Hispanic, percentage Asian,percentage of students enrolled in free or reduced-price lunch programs, percentageEL, and a dummy variable for the year 1999. The models with teachercharacteristics include additional controls for experience, certification, andeducation. Column headings labeled yes or no indicate whether teachercharacteristics are included.
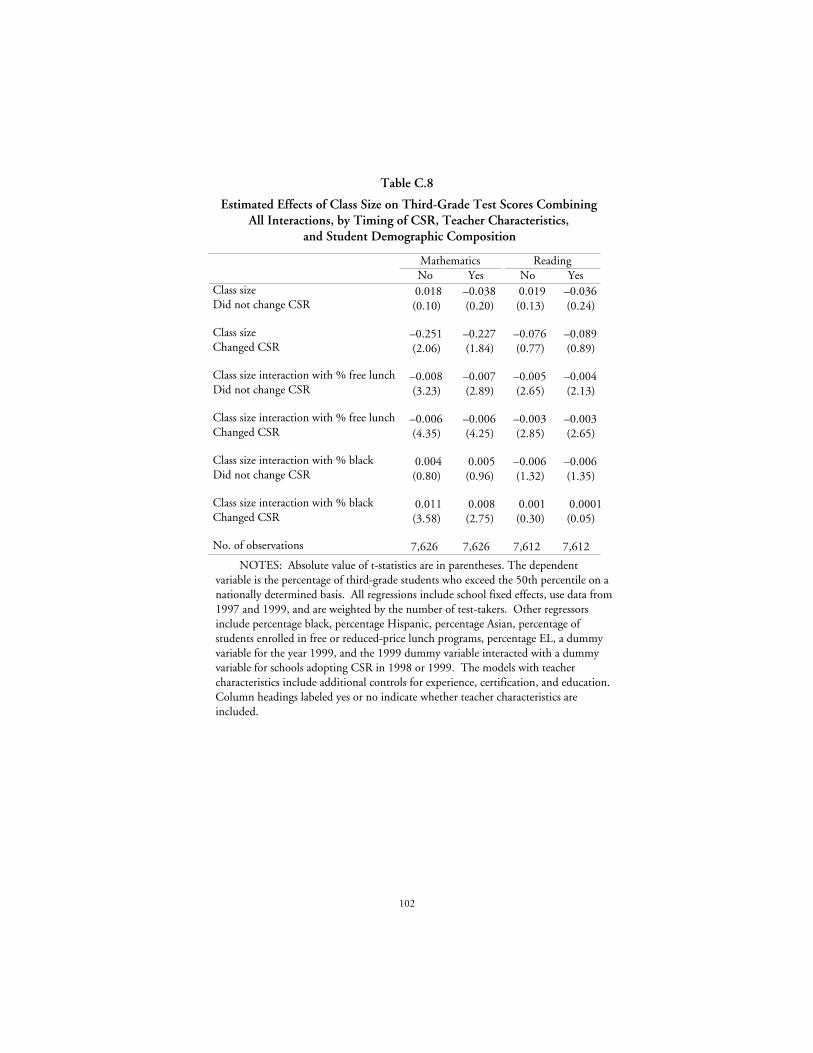
102
Table C.8
Estimated Effects of Class Size on Third-Grade Test Scores CombiningAll Interactions, by Timing of CSR, Teacher Characteristics,
and Student Demographic Composition
Mathematics ReadingNo Yes No Yes
Class size 0.018 –0.038 0.019 –0.036Did not change CSR (0.10) (0.20) (0.13) (0.24)
Class size –0.251 –0.227 –0.076 –0.089Changed CSR (2.06) (1.84) (0.77) (0.89)
Class size interaction with % free lunch –0.008 –0.007 –0.005 –0.004Did not change CSR (3.23) (2.89) (2.65) (2.13)
Class size interaction with % free lunch –0.006 –0.006 –0.003 –0.003Changed CSR (4.35) (4.25) (2.85) (2.65)
Class size interaction with % black 0.004 0.005 –0.006 –0.006Did not change CSR (0.80) (0.96) (1.32) (1.35)
Class size interaction with % black 0.011 0.008 0.001 0.0001Changed CSR (3.58) (2.75) (0.30) (0.05)
No. of observations 7,626 7,626 7,612 7,612
NOTES: Absolute value of t-statistics are in parentheses. The dependentvariable is the percentage of third-grade students who exceed the 50th percentile on anationally determined basis. All regressions include school fixed effects, use data from1997 and 1999, and are weighted by the number of test-takers. Other regressorsinclude percentage black, percentage Hispanic, percentage Asian, percentage ofstudents enrolled in free or reduced-price lunch programs, percentage EL, a dummyvariable for the year 1999, and the 1999 dummy variable interacted with a dummyvariable for schools adopting CSR in 1998 or 1999. The models with teachercharacteristics include additional controls for experience, certification, and education.Column headings labeled yes or no indicate whether teacher characteristics areincluded.
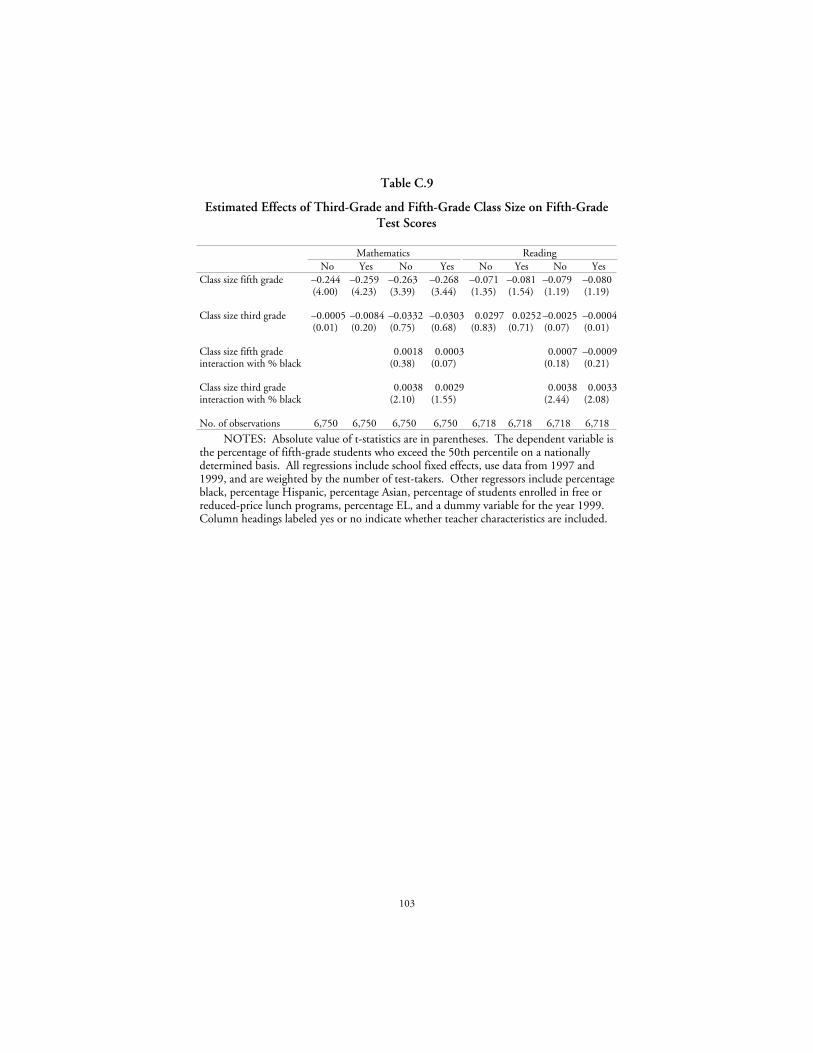
103
Table C.9
Estimated Effects of Third-Grade and Fifth-Grade Class Size on Fifth-GradeTest Scores
Mathematics ReadingNo Yes No Yes No Yes No Yes
Class size fifth grade –0.244 –0.259 –0.263 –0.268 –0.071 –0.081 –0.079 –0.080(4.00) (4.23) (3.39) (3.44) (1.35) (1.54) (1.19) (1.19)
Class size third grade –0.0005 –0.0084 –0.0332 –0.0303 0.0297 0.0252–0.0025 –0.0004(0.01) (0.20) (0.75) (0.68) (0.83) (0.71) (0.07) (0.01)
Class size fifth grade 0.0018 0.0003 0.0007 –0.0009interaction with % black (0.38) (0.07) (0.18) (0.21)
Class size third grade 0.0038 0.0029 0.0038 0.0033interaction with % black (2.10) (1.55) (2.44) (2.08)
No. of observations 6,750 6,750 6,750 6,750 6,718 6,718 6,718 6,718
NOTES: Absolute value of t-statistics are in parentheses. The dependent variable isthe percentage of fifth-grade students who exceed the 50th percentile on a nationallydetermined basis. All regressions include school fixed effects, use data from 1997 and1999, and are weighted by the number of test-takers. Other regressors include percentageblack, percentage Hispanic, percentage Asian, percentage of students enrolled in free orreduced-price lunch programs, percentage EL, and a dummy variable for the year 1999.Column headings labeled yes or no indicate whether teacher characteristics are included.
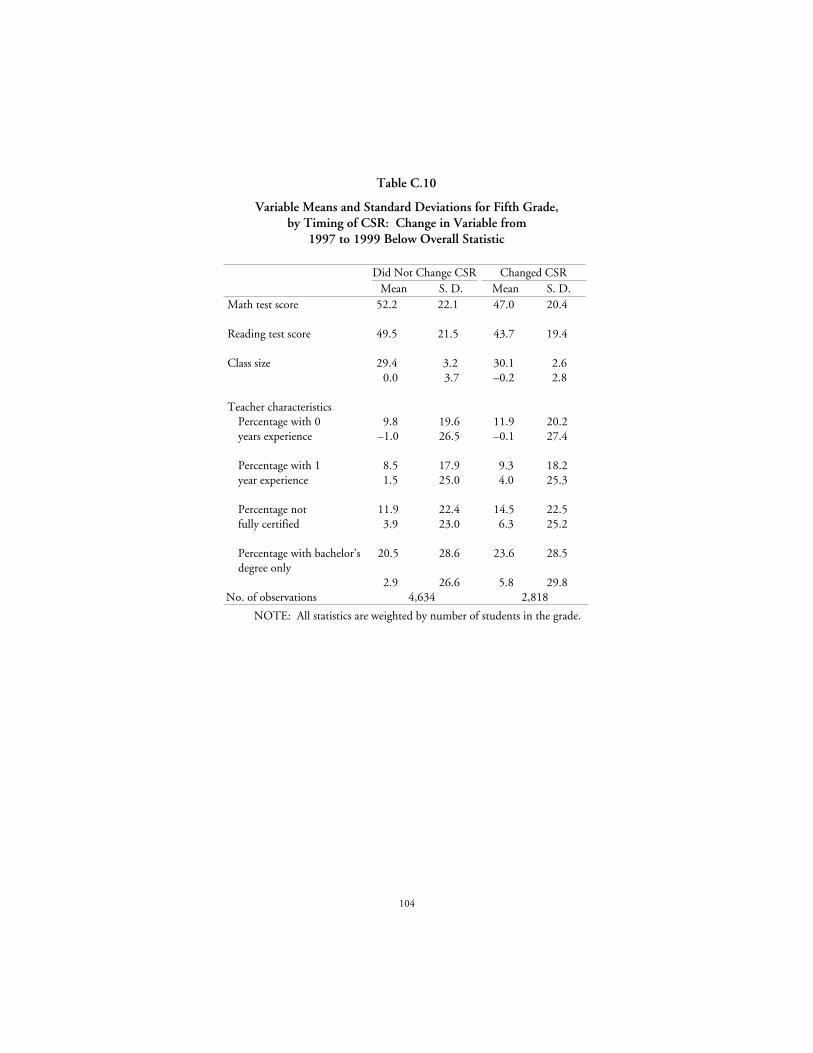
104
Table C.10
Variable Means and Standard Deviations for Fifth Grade,by Timing of CSR: Change in Variable from
1997 to 1999 Below Overall Statistic
Did Not Change CSR Changed CSRMean S. D. Mean S. D.
Math test score 52.2 22.1 47.0 20.4
Reading test score 49.5 21.5 43.7 19.4
Class size 29.4 3.2 30.1 2.60.0 3.7 –0.2 2.8
Teacher characteristicsPercentage with 0 9.8 19.6 11.9 20.2years experience –1.0 26.5 –0.1 27.4
Percentage with 1 8.5 17.9 9.3 18.2year experience 1.5 25.0 4.0 25.3
Percentage not 11.9 22.4 14.5 22.5fully certified 3.9 23.0 6.3 25.2
Percentage with bachelor’sdegree only
20.5 28.6 23.6 28.5
2.9 26.6 5.8 29.8No. of observations 4,634 2,818
NOTE: All statistics are weighted by number of students in the grade.
105
References
Angrist, Joshua D., and Victor Lavy, “Using Maimonides’ Rule toEstimate the Effect of Class Size on Scholastic Achievement,”Quarterly Journal of Economics, Vol. 114, No. 2, 1999, pp. 533–576.
Betts, Julian R., Kim S. Rueben, and Anne Danenberg, Equal Resources,Equal Outcomes? The Distribution of School Resources and StudentAchievement in California, Public Policy Institute of California,San Francisco, California, 2000.
Bohrnstedt, George W., and Brian M. Stecher, eds., Class Size Reductionin California: Early Evaluation Findings, 1996–1998, AmericanInstitutes for Research, Palo Alto, California, 1999.
Bohrnstedt, George W., and Brian M. Stecher, eds., Class Size Reductionin California: The 1998–1999 Evaluation Findings, CaliforniaDepartment of Education, Sacramento, California, 2000.
Bohrnstedt, George W., and Brian M. Stecher, eds., Class Size Reductionin California: Findings from 1999–00 and 2000–01, CaliforniaDepartment of Education, Sacramento, California, 2002.
Ehrenberg, Ronald G., and Dominic Brewer, “Do School and TeacherCharacteristics Matter? Evidence from High School and Beyond,”Economics of Education Review, Vol. 13, No. 1, 1994, pp. 1–17.
Ehrenberg, Ronald G., Dominic Brewer, Adam Gamoran, and J.Douglas Willms, “Class Size and Student Achievement,”Psychological Science in the Public Interest, Vol. 2, No. 1, 2001, pp.1–30.
Ferguson, Ronald F., “Teachers’ Perceptions and Expectations and theBlack-White Test Score Gap,” in Christopher Jencks andMeredith Phillips, eds., The Black-White Test Score Gap, TheBrookings Institution Press, Washington, D.C., 1998, pp. 273–317.
106
Fetler, Mark, “High School Staff Characteristics and Mathematics TestResults,” Education Policy Analysis Archives , Vol. 7, No. 9, 1999.
Goldhaber, Dan D., and Dominic J. Brewer, “Does TeacherCertification Matter? High School Teacher Certification Statusand Student Achievement,” Educational Evaluation and PolicyAnalysis, Vol. 22, No. 2, 2000, pp. 129–145.
Hanushek, Eric A., Steven G. Rivkin, and John F. Kain, “Do HigherSalaries Buy Better Teachers?” NBER Working Paper Number7082, Cambridge, Massachusetts, 1999.
Hoxby, Caroline Minter, “The Effects of Class Size on StudentAchievement: New Evidence from Population Variation,”Quarterly Journal of Economics, Vol. 115, No. 4, 2000, pp. 1239–1286.
Krueger, Alan B., “Experimental Estimates of Education ProductionFunctions,” Quarterly Journal of Economics, Vol. 114, No. 2, 1999,pp. 497–532.
Krueger, Alan B., and Diane Whitmore, “The Effect of Attending aSmall Class in the Early Grades on College-Test Taking andMiddle School Test Results: Evidence from Project Star,” TheEconomic Journal, Vol. 111, No. 2, 2001, pp. 1–28.
Lankford, Hamilton, Susanna Loeb, and James Wyckoff, “TeacherPreferences and the Plight of Urban Schools: A DescriptiveAnalysis of the New York State Teaching Force,” Working Paper,SUNY, Albany, New York, 2001.
Lazear, Edward P., “Educational Production,” Quarterly Journal ofEconomics, Vol. 116, No. 3, 2001, pp. 777–804.
Raymond, Margaret, Stephen Fletcher, and Javier Luque, “Teach forAmerica: An Evaluation of Teacher Differences and StudentOutcomes in Houston, Texas,” Working Paper, StanfordUniversity, Stanford, California, 2001.
Reichardt, Robert E., The Cost of Class Size Reduction: Advice forPolicymakers, Ph.D. Dissertation, The RAND Graduate School,Santa Monica, California, 2000.
107
Rivkin, Steven G., Eric A. Hanushek, and John F. Kain, “Teachers,Schools, and Academic Achievement,” Working Paper, Universityof Texas, Dallas, Texas, 2000.
Ross, Randy, “How Class-Size Reduction Harms Kids in PoorNeighborhoods,” Education Week, May 26, 1999.
Sanders, William L., and Sandra P. Horn, “The Tennessee Value-AddedAssessment System (TVAAS): Mixed-Model Methodology inEducational Assessment,” Journal of Personnel Evaluation inEducation, Vol. 8, No. 2, 1994, pp. 299–311.
Summers, Anita A., and Barbara L. Wolfe, “Do Schools Make aDifference?” American Economic Review, Vol. 67, No. 3, 1977, pp.639–652.
Wayne, Andrew J., and Peter Youngs, “Teacher Characteristics andStudent Achievement Gains: A Review,” paper presented at theannual meetings of the Association for Public Policy andManagement, Washington, D.C., 2001.

109
About the Authors
CHRISTOPHER JEPSEN
Christopher Jepsen is a research fellow at the Public Policy Instituteof California, where he studies student demographics, studentachievement, teacher labor markets, and school choice. He also hasresearch interests in demographic economics and law and economics. Hereceived a B.A. in mathematics from Grinnell College and a Ph.D. ineconomics from Northwestern University.
STEVEN RIVKIN
Steven Rivkin is an associate professor of economics at AmherstCollege. He is a specialist in labor economics whose areas of expertiseinclude the economics and sociology of K–12 education and race andgender differences in schooling, earnings, and employment. In recentwork, he has investigated changes in education productivity, differencesin school and teacher quality, teacher labor markets, schooldesegregation, peer group influences, the efficacy of special educationprograms, student mobility, and charter schools. He holds a B.A. ineconomics from the University of Michigan and an M.A. and Ph.D. ineconomics from the University of California, Los Angeles.

111
Other PPIC Publications onEducation
The Changing Role of Education in the California Labor MarketJulian R. Betts
Equal Resources, Equal Outcomes? The Distribution of School Resources andStudent Achievement in CaliforniaJulian R. Betts, Kim S. Rueben, Anne Danenberg
“At Home and in School: Racial and Ethnic Gaps in EducationalPreparedness”California Counts: Population Trends and ProfilesVolume 3, Number 2, November 2001Jennifer Y. Cheng
Math Matters: The Links Between High School Curriculum, CollegeGraduation, and EarningsHeather Rose, Julian R. Betts
For Better or For Worse? School Finance Reform in CaliforniaJon Sonstelie, Eric Brunner, Kenneth Ardon
School Finance and California’s Master Plan for EducationJon Sonstelie, Peter Richardson (editors) et al.
“The Linguistic Landscape of California Schools”California Counts: Population Trends and ProfilesVolume 3, Number 4, February 2002Sonya M. Tafoya
PPIC publications may be ordered by phone or from our website(800) 232-5343 [mainland U.S.]
(415) 291-4400 [Canada, Hawaii, overseas]www.ppic.org