Embed Size (px)
Citation preview
Teacher and Teaching Effects onStudents' Academic Performance,
Attitudes, and BehaviorsThe Harvard community has made this
article openly available. Please share howthis access benefits you. Your story matters
Citation Blazar, David. 2016. Teacher and Teaching Effects on Students'Academic Performance, Attitudes, and Behaviors. Doctoraldissertation, Harvard Graduate School of Education.
Citable link http://nrs.harvard.edu/urn-3:HUL.InstRepos:27112692
Terms of Use This article was downloaded from Harvard University’s DASHrepository, and is made available under the terms and conditionsapplicable to Other Posted Material, as set forth at http://nrs.harvard.edu/urn-3:HUL.InstRepos:dash.current.terms-of-use#LAA
Teacher and Teaching Effects on Students’ Academic Performance, Attitudes, and
Behaviors:
Extensions of the Literature
David Blazar
Dissertation Chair: Martin West
Heather C. Hill
Thomas Kane
Thesis Presented to the Faculty
of the Graduate School of Education of Harvard University
in Partial Fulfillment of the Requirements
for the Degree of Doctor of Education
2016

1
© 2016
David Blazar
All Rights Reserved
i
Dedication Page
I thank my advisors, colleagues, family, and friends for all of their help and support
throughout graduate school and the dissertation process.
ii
Acknowledgements
The research reported here was supported in part by the Institute of Education
Sciences, U.S. Department of Education (Grant R305C090023) to the President and
Fellows of Harvard College to support the National Center for Teacher Effectiveness.
Additional support comes from the National Science Foundation (Grant 0918383). The
opinions expressed are those of the author and do not represent views of the Institute or
the U.S. Department of Education. Additional support came from Mathematica Policy
Research’s summer fellowship. I thank, in alphabetical order, Mark Chin, Heather Hill,
Tom Kane, Dick Murnane, Matt Kraft, Marty West, and John Willett for their guidance
and for comments on earlier drafts of these papers.
iii
Table of Contents
Abstract…………………………………………………………………………… p. iv
Introduction………………………………………………………………………. p. 1
Paper 1……………………………………………………………………………. p. 4
Paper 2……………………………………………………………………………. p. 52
Paper 3……………………………………………………………………………. p. 112
Conclusion………………………………………………………………………... p. 160
iv
Abstract
Research confirms that teachers have substantial impacts on their students’
academic and life-long success. However, little is known about specific dimensions of
teaching practice that explain these relationships or whether these effects differ between
academic and “non-cognitive” outcomes. Drawing on data from teachers in four urban
school districts, I document the relationship between individual teachers and students’
math performance, as well as their self-reported self-efficacy in math, happiness in class,
and behavior in class. In addition, I estimate the relationship between domains of
teaching practice captured by two observation instruments and the set of student
outcomes. Finally, I examine the predictive validity of teacher effect estimates on
students’ attitudes and behaviors amongst a subset of teachers who were randomly
assigned to class rosters within schools.
I find that upper-elementary teachers have large effects on a range of students’
attitudes and behaviors in addition to their academic performance. These teacher effect
estimates have moderate to strong predictive validity. Further, student outcomes are
predicted by teaching practices most proximal to these measures (e.g., between teachers’
math errors and students’ math achievement, and between teachers’ classroom
organization and students’ behavior in class). However, teachers who are effective at
improving some outcomes often are not equally effective at improving others. Together,
these findings lend important empirical evidence to well-established theory on the
multidimensional nature of teaching and student learning and, thus, the need for policies
that account for and incentivize this complexity.
1
Introduction
Over the past decade, research has confirmed that teachers have substantial
impacts on their students’ academic and life-long success (e.g., Chetty, Friedman, &
Rockoff, 2014; Jackson, 2012; Nye, Konstantopoulos, & Hedges, 2004). Recent
investigations also have uncovered some characteristics of effective classroom
environments, including teachers’ organizational skills and interactions with students
(e.g., Grosmman, Loeb, Cohen, & Wyckoff, 2013; McCaffrey, Miller, & Staiger, 2013).
However, in order to leverage policy tools such as evaluation and professional
development that seek to improve the quality of the teacher workforce, additional
questions must be answered about the nature of effective teachers and teaching: Which
content-specific practices improve student achievement? Are teachers who impact test-
scores the same as those who impact non-cognitive outcomes? What is the relationship
between instructional practices and “non-cognitive” or “non-tested” outcomes? Can these
“non-tested” outcomes be used to estimate valid measures of teacher effectiveness?
To answer these questions, I present three papers all drawing on data collected by
the National Center for Teacher Effectiveness (NCTE) that includes a broad set of
variables rarely available to researchers in one dataset. The sample includes over 300
upper elementary teachers from four school districts during the 2010-11 through 2012-13
school years. Teachers’ instruction was scored on two established observation
instruments – the Mathematical Quality of Instruction (MQI) and the Classroom
Assessment Scoring System (CLASS) – that together capture a range of content-specific
and general teaching practices. Further, administrative data and a student survey
developed and administered by the project team allow me to capture both self-report and
2
behavioral measures of student outcomes beyond test scores – which I refer to as “non-
tested” outcomes – including their behavior in class, self-efficacy in math, happiness in
class, and days absent, all of which are linked to long-term life outcomes (Bell, Rosen, &
Dynlacht, 1994; Chetty et al., 2011; Duckworth et al., 2007; Hawkins et al., 1998; John &
Srivastava, 1999; Loeber & Farrington, 2000; Robins & Ratcliff, 1980; Schaeffer, Petras,
Ialongo, Poduska, & Kellam, 2003; Tsukayama, Duckworth, & Kim, 2013). Other
student outcomes include student achievement on both high-stakes standardized tests and
a project-administered mathematics assessment. Finally, the data include a range of
teacher background characteristics that have been shown to contribute both to
instructional quality and student outcomes in this and other datasets, thereby allowing me
to isolate instructional practices from omitted variables that might bias results. In the
third year of the study, the NCTE project engaged in a random assignment study in which
teachers were randomly assigned to class rosters within schools. This design allows me to
validate teacher effects against potential threats to internal validity.
In the first paper of this dissertation, I estimate the relationship between
instructional quality measures captured on the MQI and CLASS instruments and students’
academic achievement on the low-stakes math test. In the second paper, I extend this
work to the set of non-cognitive outcomes. Further, I examine whether teachers who have
large impacts on test-score outcomes are the same teachers who impact non-tested ones.
In the third paper of the dissertation, I test the validity of teacher effects on non-tested
outcomes by examining whether non-experimental estimates predict student outcomes
following random assignment.
3
Together, these papers can inform ongoing teacher improvement efforts,
particularly around evaluation and professional development.
4
Paper 1
Effective Teaching in Elementary Mathematics:
Identifying Classroom Practices that Support Student Achievement1
Abstract
Recent investigations into the education production function have moved beyond
traditional teacher inputs, such as education, certification, and salary, focusing instead on
observational measures of teaching practice. However, challenges to identification mean
that this work has yet to coalesce around specific instructional dimensions that increase
student achievement. I build on this discussion by exploiting within-school, between-
grade, and cross-cohort variation in scores from two observation instruments; further, I
condition on a uniquely rich set of teacher characteristics, practices, and skills. Findings
indicate that inquiry-oriented instruction positively predicts student achievement. Content
errors and imprecisions are negatively related, though these estimates are sensitive to the
set of covariates included in the model. Two other dimensions of instruction, classroom
emotional support and classroom organization, are not related to this outcome. Findings
can inform recruitment and development efforts aimed at improving the quality of the
teacher workforce.
1 Paper currently published at Economics of Education Review. Full citation: Blazar, D. (2015). Effective teaching in elementary mathematics: Identifying classroom practices that support student achievement. Economics of Education Review, 48, 16-29.
5
1. Introduction
Over the past decade, research has confirmed that teachers have substantial
impacts on their students’ academic and life-long success (e.g., Nye, Konstantopoulos, &
Hedges, 2004; Chetty, Friedman, & Rockoff, 2014). Despite concerted efforts to identify
characteristics such as experience, education, and certification that might be correlated
with effectiveness (for a review, see Wayne & Youngs, 2003), however, the nature of
effective teaching still largely remains a black box. Given that the effect of teachers on
achievement must occur at least in part through instruction, it is critical that researchers
identify the types of classroom practices that matter most to student outcomes. This is
especially true as schools and districts work to meet the more rigorous goals for student
achievement set by the Common Core State Standards (Porter, McMaken, Hwang, &
Yang, 2011), particularly in mathematics (Duncan, 2010; Johnson, 2012; U.S.
Department of Education, 2010).
Our limited progress toward understanding the impact of teaching practice on
student outcomes stems from two main research challenges. The first barrier is
developing appropriate tools to measure the quality of teachers’ instruction. Much of the
work in this area tends to examine instruction either in laboratory settings or in
classrooms over short periods of time (e.g., Anderson, Everston, & Brophy, 1979; Star &
Rittle-Johnson, 2009), neither of which is likely to capture the most important kinds of
variation in teachers’ practices that occur over the course of a school year. The second is
a persistent issue in economics of education research of designing studies that support
causal inferences (Murnane & Willett, 2011). Non-random sorting of students to teachers
(Clotfelter, Ladd, & Vigdor, 2006; Rothstein, 2010) and omitted measures of teachers’
6
skills and practices limit the success of prior research.
I address these challenges through use of a unique dataset on fourth- and fifth-
grade teachers and their students from three anonymous school districts on the East Coast
of the United States. Over the course of two school years, the project captured observed
measures of teachers’ classroom practices on the Mathematical Quality of Instruction
(MQI) and Classroom Assessment Scoring System (CLASS) instruments, focusing on
mathematics-specific and general teaching practices, respectively. The project also
collected data on a range of other teacher characteristics, as well as student outcomes on a
low-stakes achievement test that was common across participants.
My identification strategy has two key features that distinguish it from prior work
on this topic. First, to account for sorting of students to schools and teachers, I exploit
variation in observation scores within schools, across adjacent grades and years.
Specifically, I specify models that include school fixed effects and instructional quality
scores averaged to the school-grade-year level. This approach assumes that student and
teacher assignments are random within schools and across grades or years, which I
explore in detail below. Second, to isolate the independent contribution of instructional
practices to student achievement, I condition on a uniquely rich set of teacher
characteristics, skills, and practices. I expect that there likely are additional factors that
are difficult to observe and, thus, are excluded from my data. Therefore, to explore the
possible degree of bias in my estimates, I test the sensitivity of results to models that
include different sets of covariates. Further, I interpret findings in light of limitations
associated with this approach.

7
Results point to a positive relationship between ambitious or inquiry-oriented
mathematics instruction and performance on a low-stakes test of students’ math
knowledge of roughly 0.10 standard deviations. I also find suggestive evidence for a
negative relationship between mathematical errors and student achievement, though
estimates are sensitive to the specific set of teacher characteristics included in the model.
I find no relationships between two other dimensions of teaching practice – classroom
emotional support and classroom organization – and student achievement. Teachers
included in this study have value-added scores calculated from state assessment data
similar to those of other fourth- and fifth-grade teachers in their respective districts,
leading me to conclude that findings likely generalize to these populations beyond my
identification sample. I argue that results can inform recruitment and development efforts
aimed at improving the quality of the teacher workforce
The remainder of this paper is organized as follows. In the second section, I
discuss previous research on the relationship between observational measures of teacher
quality and student achievement. In the third section, I describe the research design,
including the sample and data. In the fourth section, I present my identification strategy
and tests of assumptions. In the fifth section, I provide main results and threats to internal
and external validity. I conclude by discussing the implications of my findings for
ongoing research and policy on teacher and teaching quality.
2. Background and Context
Although improving the quality of the teacher workforce is seen as an economic
imperative (Hanushek, 2009), long-standing traditions that reward education and training
or offer financial incentives based on student achievement have been met with limited
8
success (Boyd, Grossman, Lankford, Loeb, & Wyckoff, 2006; Fryer, 2013; Harris & Sass,
2011; Springer et al., 2010). One reason for this posed by Murnane and Cohen (1986)
almost three decades ago is the “nature of teachers’ work” (p. 3). They argued that the
“imprecise nature of the activity” makes it difficult to describe why some teachers are
good and what other teachers can do to improve (p. 7).
Recent investigations have sought to test this theory by comparing subjective and
objective (i.e., “value-added”) measures of teacher performance. In one such study, Jacob
and Lefgren (2008) found that principals were able to distinguish between teachers in the
tails of the achievement distribution but not in the middle. Correlations between principal
ratings of teacher effectiveness and value added were weak to moderate: 0.25 and 0.18 in
math and reading, respectively (0.32 and 0.29 when adjusted for measurement error).
Further, while subjective ratings were a statistically significantly predictor of future
student achievement, they performed worse than objective measures. Including both in
the same regression model, estimates for principal ratings were 0.08 standard deviations
(sd) in math and 0.05 sd in reading; comparatively, estimates for value-added scores were
0.18 sd in math and 0.10 sd in reading. This evidence led the authors to conclude that
“good teaching is, at least to some extent, observable by those close to the education
process even though it may not be easily captured in those variables commonly available
to the econometrician” (p. 103).
Two other studies found similar results. Using data from New York City, Rockoff,
Staiger, Kane, and Taylor (2012) estimated correlations of roughly 0.21 between
principal evaluations of teacher effectiveness and value-added scores averaged across
math and reading. These relationships corresponded to effect sizes of 0.07 sd in math and
9
0.08 sd in reading when predicting future student achievement. Extending this work to
mentor evaluations of teacher effectiveness, Rockoff and Speroni (2010) found smaller
relationships to future student achievement in math between 0.02 sd and 0.05 sd.
Together, these studies suggest that principals and other outside observers understand
some but not all of the production function that converts classroom teaching and
professional expertise into student outcomes.
In more recent years, there has been a growing interest amongst educators and
economists alike in exploring teaching practice more directly. This now is possible
through the use of observation instruments that quantitatively capture the nature and
quality of teachers’ instruction. In one of the first econometric analyses of this kind, Kane,
Taylor, Tyler, and Wooten (2011) examined teaching quality scores captured on the
Framework for Teaching instrument as a predictor of math and reading test scores. Data
came from Cincinnati and widespread use of this instrument in a peer evaluation system.
Relationships to student achievement of 0.11 sd in math and 0.14 sd in reading provided
suggestive evidence of the importance of general classroom practices captured on this
instrument (e.g., classroom climate, organization, routines) in explaining teacher
productivity.
At the same time, this work highlighted a central challenge associated with
looking at relationships between scores from observation instruments and student test
scores. Non-random sorting of students to teachers and non-random variation in
classroom practices across teachers means that there likely are unobserved characteristics
related both to instructional quality and student achievement. As one way to address this
concern, the authors’ preferred model included school fixed effects to account for factors
10
at the school level, apart from instructional quality, that could lead to differences in
achievement gains. In addition, they relied on out-of-year observation scores that, by
design, could not be correlated with the error term predicting current student achievement.
This approach is similar to those taken by Jacob and Lefgren (2008), Rockoff, Staiger,
Kane, and Taylor (2012), and Rockoff and Speroni (2010), who use principal/mentor
ratings of teacher effectiveness to predict future student achievement. Finally, as a
robustness test, the authors fit models with teacher fixed effects to account for time-
invariant teacher characteristics that might be related to observation scores and student
outcomes; however, they noted that these estimates were much noisier because of small
samples of teachers.
The largest and most ambitious study to date to conduct these sorts of analyses is
the Measures of Effective Teaching (MET) project, which collected data from teachers
across six urban school districts on multiple observation instruments. By randomly
assigning teachers to class rosters within schools and using out-of-year observation
scores, Kane, McCaffrey, Miller, and Staiger (2013) were able to limit some of the
sources of bias described above. In math, relationships between scores from the
Framework for Teaching and prior student achievement fell between 0.09 sd and 0.11 sd.
In the non-random assignment portion of the study, Kane and Staiger (2012) found
correlations between scores from other observation instruments and prior-year
achievement gains in math from 0.09 (for the Mathematical Quality of Instruction) to
0.27 (for the UTeach Teacher Observation Protocol). The authors did not report these as
effect size estimates. As a point of comparison, the correlation for the Framework for
Teaching and prior-year gains was 0.13.
11
Notably, these relationships between observation scores and student achievement
from both the Cincinnati and MET studies are equal to or larger in magnitude than those
that focus on principal or mentor ratings of teacher quality. This is somewhat surprising
given that principal ratings of teacher effectiveness – often worded specifically as
teachers’ ability to raise student achievement – and actual student achievement are meant
to measure the same underlying construct. Comparatively, dimensions of teaching quality
included on these instruments are thought to be important contributors to student
outcomes but are not meant to capture every aspect of the classroom environment that
influence learning (Pianta & Hamre, 2009). Therefore, using findings from Jacob and
Lefgren (2008), Rockoff, Staiger, Kane, and Taylor (2012), and Rockoff and Speroni
(2010) as a benchmark, estimates describing the relationship between observed classroom
practices and student achievement are, at a minimum, substantively meaningful; at a
maximum, they may be viewed as large. Following Murnane and Cohen’s intuition, then,
continued exploration into the “nature of teachers’ work” (1986, p. 3), the practices that
comprise high-quality teaching, and their role in the education production function will
be a central component of efforts aimed at raising teacher quality and student
achievement.
At the same time that work by Kane and his co-authors (2011, 2012, 2013) has
greatly expanded conversation in the economics of education literature to include
teaching quality when considering teacher quality, this work has yet to coalesce around
specific instructional dimensions that increase student outcomes. Random assignment of
teachers to students – and other econometric methods such as use of school fixed effects,
teacher fixed effects, and out-of-year observation ratings – likely provide internally valid
12
estimates of the effect of having a teacher who provides high-quality instruction on
student outcomes. This approach is useful when validating different measures of teacher
quality, as was the stated goal of many of the studies described above including MET.
However, these approaches are insufficient to produce internally valid estimates of the
effect of high-quality instruction itself on student outcomes. This is because teachers
whose measured instructional practices are high quality might have a true, positive effect
on student achievement even though other practices and skills – e.g., spending more time
with students, knowledge of students – are responsible for the higher achievement. Kane
et al. (2011) fit models with teacher fixed effects in order to “control for all time-
invariant teacher characteristics that might be correlated with both student achievement
growth and observed classroom practices” (p. 549). However, it is likely that there are
other time-variant skills related both to instructional quality and student achievement.
I address this challenge to identification in two ways. First, my analyses explore
an additional approach to account for the non-random sorting of students to teachers.
Second, I attempt to isolate the unique contribution of specific teaching dimensions to
student outcomes by conditioning on a broad set of teacher characteristics, practices, and
skills. Specifically, I include observation scores captured on two instruments (both
content-specific and general dimensions of instruction), background characteristics
(education, certification, and teaching experience), knowledge (mathematical content
knowledge and knowledge of student performance), and non-instructional classroom
behaviors (preparation for class and formative assessment) that are thought to relate both
to instructional quality and student achievement. Comparatively, in their preferred model,
Kane et al. (2011) included scores from one observation instrument, controlling for
13
teaching experience. While I am not able to capture every possible characteristic, I argue
that these analyses are an important advance beyond what currently exists in the field.
3. Sample and Data
3.1 Sample
Data come from the National Center for Teacher Effectiveness (NCTE), which
focused on collection of instructional quality scores and other teacher characteristics in
three anonymous districts (henceforth Districts 1 through 3).2 Districts 1 and 2 are located
in the same state. Data was collected from participating fourth- and fifth-grade math
teachers in the 2010-2011 and 2011-2012 school years. Due to the nature of the study and
the requirement for teachers to be videotaped over the course of a school year,
participants consist of a non-random sample of schools and teachers who agreed to
participate. During recruitment, study information was presented to schools based on
district referrals and size; the study required a minimum of two teachers at each of the
sampled grades. Of eligible teachers, 143 (roughly 55%) agreed to participate. My
identification strategy focuses on school-grade-years in which I have the full sample of
teachers who work in non-specialized classrooms (i.e., not self-contained special
education or limited English proficient classes) in that school-grade-year. I further restrict
the sample to schools that have at least two complete grade-year cells. This includes 111
teachers in 26 schools and 76 school-grade-years; 45 of these teachers, 17 of these
schools, and 27 of these school-grade-years are in the sample for both school years.
2 This project also includes a fourth district that I exclude here due to data and sample limitations. In the first year of the study, students did not take the baseline achievement test. In the second year, there were only three schools in which all teachers in the relevant grades participated in data collection, which is an important requirement of my identification strategy. At the same time, when I include these few observations in my analyses, patterns of results are the same.
14
In Table 1, I present descriptive statistics on the students and teachers in this
sample. Students in District 1 are predominantly African American or Hispanic, with
over 80% eligible for free- or reduced-price lunch (FRPL), 15% designated as in need of
special education (SPED) services, and roughly 24% designated as limited English
proficient (LEP). In District 2, there is a greater percentage of white students (29%) and
fewer FRPL (71%), SPED (10%), and LEP students (18%). In District 3, there is a
greater percentage of African-American students (67%) and fewer FRPL (58%), SPED
(8%), and LEP students (7%). Across all districts, teachers have roughly nine years of
experience. Teachers in Districts 1 and 2 were certified predominantly through traditional
programs (74% and 93%, respectively), while more teachers in District 3 entered the
profession through alternative programs or were not certified at all (55%). Relative to all
study participants, teachers in Districts 1 through 3 have above average, average, and
below average mathematical content knowledge, respectively.
3.2 Main Predictor and Outcome Measures
3.2.1 Video-Recorded Lesson of Instruction
Mathematics lessons were captured over a two-year period, with a maximum of
three lessons per teacher per year. Capture occurred with a three-camera, unmanned unit
and lasted between 45 and 80 minutes. Teachers were allowed to choose the dates for
capture in advance, and were directed to select typical lessons and exclude days on which
students were taking a test. Although it is possible that these lessons are unique from
teachers’ general instruction, teachers did not have any incentive to select lessons
strategically as no rewards or sanctions were involved with data collection. In addition,
analyses from the MET project indicate that teachers are ranked almost identically when
15
they choose lessons themselves compared to when lessons are chosen for them (Ho &
Kane, 2013).
Trained raters scored these lessons on two established observational instruments:
the Mathematical Quality of Instruction (MQI), focused on mathematics-specific
practices, and the Classroom Assessment Scoring System (CLASS), focused on general
teaching practices. For the MQI, two certified and trained raters watched each lesson and
scored teachers’ instruction on 17 items for each seven-and-a-half minute segment on a
scale from Low (1) to High (3) (see Table 2 for a full list of items). Lessons have
different numbers of segments, depending on their length. Analyses of these data (Blazar,
Braslow, Charalambous, & Hill, 2015) show that items cluster into two main factors:
Ambitious Mathematics Instruction, which corresponds to many elements contained
within the mathematics reforms of the 1990s (National Council of Teachers of
Mathematics, 1989, 1991, 2000) and the Common Core State Standards for Mathematics
(National Governors Association for Best Practices, 2010); and Mathematical Errors and
Imprecisions, which captures any mathematical errors the teacher introduces into the
lesson. For Ambitious Mathematics Instruction, higher scores indicate better
performance. For Mathematical Errors and Imprecisions, higher scores indicate that
teachers make more errors in their instruction and, therefore, worse performance. I
estimate reliability for these metrics by calculating the amount of variance in teacher
scores that is attributable to the teacher (i.e., the intraclass correlation), adjusted for the
modal number of lessons. These estimates are 0.69 and 0.52 for Ambitious Mathematics
Instruction and Mathematical Errors and Imprecisions, respectively. Though this latter
estimate is lower than conventionally acceptable levels (0.7), it is consistent with those
16
generated from similar studies (Bell, Gitomer, McCaffrey, Hamre, & Pianta, 2012; Kane
& Staiger, 2012).3
The CLASS instrument captures more general classroom quality. By design, the
instrument is split into three dimensions. Based on factor analyses described above, I
utilize two: Classroom Emotional Support, which focuses on the classroom climate and
teachers’ interactions with students; and Classroom Organization, including behavior
management and productivity of the lesson. Following the protocol provided by
instrument developers, one certified and trained rater watched and scored each lesson on
11 items for each fifteen-minute segment on a scale from Low (1) to High (7). I reverse
code one item from the Classroom Organization dimension, “Negative Climate,” to align
with the valence of the other items. Therefore, in all cases, higher scores indicate better
performance. Using the same method as above, I estimate reliabilities of 0.55 for
Classroom Emotional Support and 0.65 for Classroom Organization.
In Table 2, I present summary statistics of teacher-level scores that are averaged
across raters (for the MQI), segments, and lessons. For the MQI, mean scores are slightly
lower than the middle of the scale itself: 1.26 for Ambitious Mathematics Instruction (out
of 3; sd = 0.12) and 1.12 for Mathematical Errors and Imprecisions (out of 3; sd = 0.12).
For the CLASS, mean scores are centered above the middle of the scale: 4.26 for
3 Reliability estimates for the MQI from the MET study were lower. One reason for this may be that MET used the MQI Lite and not the full MQI instrument used in this study. The MQI Lite has raters provide only overarching dimension scores, while the full instrument asks raters to score teachers on up to five items before assessing an overall score. Another reason likely is related to differences in scoring designs. MET had raters score 30 minutes of instruction from each lesson. Comparatively, in this study, raters provided scores for the whole lesson, which is in line with recommendations made by Hill, Charalambous, and Kraft (2012) in a formal generalizability study. Finally, given MET’s intent to validate observation instruments for the purpose of new teacher evaluation systems, they utilized a set of raters similar to the school leaders and staff who will conduct these evaluations in practice. In contrast, other research shows that raters who are selectively recruited due to a background in mathematics or mathematics education and who complete initial training and ongoing calibration score more accurately on the MQI than those who are not selectively recruited (Hill et al., 2012).
17
Classroom Emotional Support (out of 7; sd = 0.55) and 6.52 for Classroom Organization
(out of 7; sd = 0.44). Pairwise correlations between these teacher-level scores range from
roughly zero (between Mathematical Errors and Imprecisions and the two dimensions on
the CLASS instrument) to 0.44 between Classroom Emotional Support and Classroom
Organization. Ambitious Mathematics Instruction is more consistently related to the other
instructional quality dimensions, with correlations between 0.19 and 0.34. These
correlations are high enough to suggest that high-quality teachers who engage in one type
of instructional practice may also engage in others, but not too high to indicate that
dimensions measure the same construct.
As I discuss below, my identification strategy relies on instructional quality scores
at the school-grade-year level. While this strategy loses between-teacher variation, which
likely is the majority of the variation in instructional quality scores, I still find substantive
variation in instructional quality scores within schools, across grades and years. In Table
3, I decompose the variation in school-grade-year scores into two components: the
school-level component, which describes the percent of variation that lies across schools,
and the residual component, which describes the rest of the variation that lies within
schools. For all four instructional quality dimensions, I find that at least 40% of the
variation in school-grade-year scores lies within schools. This leads me to conclude that
there is substantive variation within schools at the school-grade-year level to exploit in
this analysis.
In order to minimize noise in these observational measures, I use all available
lessons for each teacher (Hill, Charalambous, & Kraft, 2012). Teachers who participated
in the study for one year had three lessons, on average, while those who participated in
18
the study for two years generally had six lessons. A second benefit of this approach is
that it reduces the possibility for bias due to unobserved classroom characteristics that
affect both instructional quality and student outcomes (Kane, Taylor, Tyler, & Wooten,
2011).4 This is because, in roughly half of cases, scores represent elements of teachers’
instruction from the prior year or future year, in addition to the current year. Specifically,
I utilize empirical Bayes estimation to shrink scores back toward the mean based on their
precision (see Raudenbush & Bryk, 2002). To do so, I specify the following hierarchical
linear model using all available data, including teachers beyond my identification sample:
(1) 𝑂𝐵𝑆𝐸𝑅𝑉𝐴𝑇𝐼𝑂𝑁!" = 𝜇! + 𝜀!"
where the outcome is the observation score for lesson l and teacher j, 𝜇! is a random
effect for each teacher j, and 𝜀!" is the error term. I utilize standardized estimates of the
teacher-level random effect as each teacher’s observation score. Most distributions of
these variables are roughly normal. For identification, I average these scores within each
school-grade-year. I do not re-standardize these school-grade-year scores in order to
interpret estimates in teacher-level standard deviation units, which are more meaningful
than school-grade-year units.
3.2.2 Student Demographic and Test-Score Data
4 Kane et al. (2011) argue that cotemporaneous measurement of teacher observation scores and student outcomes may bias estimates due to class characteristics that affect both the predictor and the outcome. I do not do so here for both practical and substantive reasons. The sample of school-grade-years in which all teachers have out-of-year observation scores is too limited to conduct the same sort of analysis. In addition, as this study is interested in the effect of instruction on student outcomes, I want to utilize scores that capture the types of practices and activities in which students themselves are engaged.
At the same time, I am able to examine the extent to which Kane et al.’s hypothesis plays out in my own data. To do so, I explore whether changes in classroom composition predict changes in instructional quality for those 45 teachers for whom I have two years of observation data. In Appendix Table A1, I present estimates from models that regress each instructional quality dimension on a vector of observable class characteristics and teacher fixed effects. Here, I observe that classroom composition only predicts within-teacher, cross-year differences in Classroom Emotional Support (F = 2.219, p = 0.035). This suggests that attention to omitted variables related both to Classroom Emotional Support and student achievement may be important.
19
One source of student-level data is district administrative records. Demographic
data include gender, race/ethnicity, special education (SPED) status, limited English
proficiency (LEP) status, and free- or reduced-price lunch (FRPL) eligibility. I also
utilize prior-year test scores on state assessments in both math and reading, which are
standardized within district by grade, subject, and year using the entire sample of students
in each district, grade, subject, and year.
Student outcomes were measured in both fall and spring on a new assessment
developed by researchers who created the MQI in conjunction with the Educational
Testing Service (see Hickman, Fu, & Hill, 2012). Validity evidence indicates internal
consistency reliability of 0.82 or higher for each form across the relevant grade levels and
school years. Three key features of this test make it ideal for this study. First, the test is
common across all districts and students in the sample, which is important given evidence
on the sensitivity of statistical models of teacher effectiveness to different achievement
tests (Lockwood, McCaffrey, Hamilton, Stecher, Le, & Martinez, 2007; Papay, 2011).
Second, the test is vertically aligned, allowing me to compare achievement scores for
students in fourth versus fifth grade. Third, the assessment is a relatively cognitively
demanding test, thereby well aligned to many of the teacher-level practices assessed in
this study, particularly those captured on the MQI instrument. It likely also is similar to
new mathematics assessments administered under the Common Core (National
Governors Association for Best Practices, 2010). Lynch, Chin, and Blazar (2015) coded
items from this assessment for format and cognitive demand using the Surveys of Enacted
Curriculum framework (Porter, 2002). They found that the assessment often asked
20
students to solve non-routine problems, including looking for patterns and explaining
their reasoning. Roughly 20% of items required short responses.
3.2.3 Teacher Survey
Information on teachers’ background, knowledge, and skills were captured on a
teacher questionnaire administered in the fall of each year. Survey items about teachers’
background include whether or not the teacher earned a bachelor’s degree in education,
amount of undergraduate or graduate coursework in math and math courses for teaching
(2 items scored from 1 [No Classes] to 4 [Six or More Classes], internal consistency
reliability (𝛼) = 0.66), route to certification, and whether or not the teacher had a master’s
degree (in any subject). Relatedly, the survey also asked about the number of years of
teaching experience in math.
Next, I capture teachers’ knowledge of content and of their students. Teachers’
content knowledge was assessed on items from both the Mathematical Knowledge for
Teaching assessment (Hill, Schilling, & Ball, 2004) and the Massachusetts Test for
Educator Licensure. Teacher scores were generated by IRTPro software and were
standardized in these models using all available teachers, with a reliability of 0.92.
Second are scores from a test of teachers’ knowledge of student performance. These
scores were generated by providing teachers with student test items, asking them to
predict the percent of students who would answer each item correctly, then calculating
the distance between each teacher’s estimate and the actual percent of students in their
class who got each item correct. Similar to instructional quality scores, I report reliability
as adjusted intraclass correlations, which are 0.71 and 0.74 for grades four and five,
respectively. To arrive at a final scale, I averaged across items and standardized.
21
Finally, two items refer to additional classroom behaviors that aim to increase
student achievement. The first is teachers’ preparation for class, which asks about the
amount of time each week that teachers devoted to out-of-class activities such as grading,
preparing lesson materials, reviewing the content of the lesson, and talking with parents
(4 items scored from 1 [No Time] to 5 [More than Six Hours], 𝛼 = 0.84). The second
construct is formative assessment, which asks how often teachers evaluated student work
and provided feedback (5 items scored from 1 [Never] to 5 [Daily or Almost Daily], 𝛼 =
0.74).5
In Table 4, I present correlations between these characteristics and the four
instructional quality dimensions. The strongest correlation is between Mathematical
Errors and Imprecisions and mathematical content knowledge (r = -0.46). This suggests
that teachers’ knowledge of the content area is moderately to strongly related to their
ability to present correct material in class. The sign of this relationship is correct, in that
higher scores on Mathematical Errors and Imprecisions means that more errors are made
in instruction, while higher scores on the content knowledge test indicate stronger
understanding of math. Content knowledge also is related to Ambitious Mathematics
Instruction (r = 0.26). Interestingly, math coursework is related to Classroom
Organization, and Mathematical Errors and Imprecisions is related to formative
assessment (r = 0.24), even though these constructs are not theoretically related. Together,
this suggests that the dimensions of instructional quality generally are distinct from other
measures often used as a proxy for teacher or teaching quality.
4. Identification Strategy and Tests of Assumptions 5 Between three and six teachers are missing data for each of these constructs. Given that these data are used for descriptive purposes and as controls, in these instances I impute the mean value for the district. For more information on these scales, see Hill, Blazar, and Lynch (2015).
22
In order to estimate the relationship between high-quality instruction and students’
mathematics achievement, my identification strategy must address two main challenges:
non-random sorting of students to teachers and omitted measures of teachers’ skills and
practices. I focus on each in turn.
4.1 Non-Random Sorting of Students to Teachers
Non-random sorting of students to teachers consists of two possible components:
the sorting of students to schools and of students to classes or teachers within schools. In
Table 5, I explore the extent to which these types of sorting might bias results by
regressing baseline test scores on all four dimensions of instructional quality (see Kane et
al., 2011). Comparing teachers within districts, Ambitious Mathematics Instruction is
positively related to baseline achievement. This suggests, unsurprisingly, that teachers
with higher-quality math instruction tend to be assigned to higher-achieving students.
Interestingly, though, only part of this relationship is explained by differences in
instructional quality and student achievement across schools. Comparing teachers within
schools, the magnitude of the relationship between Ambitious Mathematics Instruction
and baseline achievement is substantively smaller but still statistically significant. Further,
I now observe a positive relationship between Classroom Organization and baseline test
scores. This indicates that within-school sorting and the matching of students to teachers
may occur differently than across-school sorting but that it likely serves as an additional
source of bias.
In light of non-random sorting, I begin by specifying models that control for a
host of observable student and class characteristics, including prior achievement. Further,
following Kane, Taylor, Tyler, and Wooten (2011), I include school fixed effects to
23
account for unobserved differences across schools, other than instructional quality, that
also affect student achievement. Finally, to address sorting of students to classes or
teachers within schools, I exploit an important logistical and structural constraint of
schools – that students may be sorted within but not across grades and years. This is
because, in most cases, students advance with a given cohort from one grade to the next.
Therefore, similar to Rivkin, Hanushek, and Kain (2005), I exploit between-cohort
differences by aggregating teachers’ observation scores to the school-grade-year level.
They argue that “aggregation to the grade level circumvents any problems resulting from
classroom assignment” (p. 426). Doing so restricts identifying variation to that observed
across grades – e.g., between fourth-grade teachers in one year and fifth-grade teachers in
the same, following, or former school year. In a few instances where grade-level
composition changes from one year to the next, there also is identifying variation
between the set of fourth-grade teachers in one year and the set of fourth-grade teachers
in the following or former school year, and similarly for fifth-grade teachers in one year
and fifth-grade teachers in another year
The hypothesized model that describes this relationship is outlined in equation 2:
(2) 𝐴!"#$%&' = 𝛽𝑂𝐵𝑆𝐸𝑅𝑉𝐴𝑇𝐼𝑂𝑁!"#$ + ζ 𝑓(𝐴!"#$%&'!!) + 𝜋𝑋!"#$%&' + 𝜑𝑋!"#$%& +
𝜎!"# + 𝜃! + 𝜀!"#$%&'
where 𝐴!"#$%&'is the end-of-year test score for student i in district d, school s, grade g,
and class c with teacher j at time t; 𝑂𝐵𝑆𝐸𝑅𝑉𝐴𝑇𝐼𝑂𝑁!"#$ is a vector of instructional
quality scores that are averaged across teachers within each school-grade-year;
𝑓(𝐴!"#$%&'!!) is a cubic function of prior achievement on the fall baseline assessment, as
well as on the prior-year state assessments in both math and reading; 𝑋! is a vector of
24
observable student-level characteristics; 𝑋!"#!"# aggregates these and prior achievement
measures to the class level. I include district-by-grade-by-year fixed effects, 𝜎!"#, to
account for differences in the scaling of state standardized test scores. As discussed above,
I also include fixed effects for schools, 𝜃!, as part of my identification strategy. I
calculate standard errors that are clustered at the school-grade-year level to account for
heteroskedasticity in the student-level errors, 𝜀!"#$%&', and non-zero covariance among
those students attending the same school in the same grade and year (Kane, Rockoff, &
Staiger, 2008).
The key identifying assumption of this model is that within-school, between-
grade, and cross-cohort differences in average instructional quality scores are exogenous
(see Woessmann & West, 2006 for a discussion of this assumption and strategy as it
pertains to class size). While the validity of this assumption is difficult to test directly, I
can examine ways that it may play out in practice. In particular, this assumption would be
violated by strategic grade assignments in which teachers are shifted across grades due to
a particularly strong or weak incoming class, or where students are held back or advanced
an additional grade in order to be matched to a specific teacher.
Although these practices are possible in theory, I present evidence that such
behavior does not threaten inferences about variation in instructional quality scores. I do
observe that 30 teachers were newly assigned to their grade, either because they switched
from a different grade in the prior year (before joining the study) or because they moved
into the district. In Table 6, I examine differences between switchers and non-switchers
on observable characteristics within school-year cells. In addition to comparing teachers
on the characteristics listed in Tables 1 and 2, I include average scores on all three
25
baseline achievement tests; I also include state value-added scores in math.6 Here, I find
that switchers have students with lower prior-year achievement on state math and reading
exams (p = 0.037 and 0.002, respectively). Importantly, though, there are no differences
between switchers and non-switchers on any of the observational rubric dimensions, any
of the teacher survey constructs, or state value-added scores. Nor can I detect differences
between these two groups when all observable traits are tested jointly (F = 1.159, p =
0.315).7 This suggests that, even though switchers tend to have lower-achieving students,
they are unlikely to be matched to these classes based on observed quality. With regard to
sorting of students to grade, fewer than 20 were retained from the previous year or
skipped a grade. I drop these from the analytic sample.
A second assumption underlying the logic of this strategy is that identification
holds only when all teachers at a given school-grade-year are in the study. If only a
portion of the teachers participate, then there may be bias due to the selection of students
assigned to these teachers. To address this concern, I limit my final analytic sample to
school-grade-years in which I have full participation of teachers. I am able to identify
these teachers as I have access to class rosters for all teachers who work in the sample
districts. I exclude from these school-grade-year teams teachers who teach self-contained
6 Value-added scores are calculated from a model similar to equation (2). Here, I regress end-of-year student mathematics test scores on state assessments on a vector of prior achievement; student-, class-, and school-level covariates; and district-by-grade-by-year fixed effects. I predict a teacher-level random effect as the value-added score. I utilize all years of data and all teachers in the sample districts and grades to increase the precision of my estimates (Goldhaber & Hansen, 2012; Koedel & Betts 2011; Schochet & Chiang, 2013). 7 In some instances, mean scores for both switchers and non-switchers on standardized variables fall below or above zero (e.g., Classroom Emotional Support). This is possible given that variables were standardized across all teachers in the study, not just those in the identification sample.
26
special education or bilingual classes, as the general population of students would not be
sorted to these teachers’ classes.8
By dropping certain school-grade-year observations, I limit the sample from
which I am able to generalize results. In this sense, I compromise external validity for
internal validity. However, below I discuss the comparability of teachers and school-
grade-years included in my identification sample to those that I exclude either because
they did not participate in data collection through the NCTE project or because they did
not meet the sample conditions I describe above.
4.2 Omitted Variables Bias
Given non-random sorting of instructional quality to teachers, estimating the
effect of these practices on mathematics achievement also requires isolating them from
other characteristics that are related both to observation rubric scores and to student test
scores. I focus on characteristics that prior research suggests may fit the definition of
omitted variables bias in this type of analysis.
Review of prior research indicates that several observable characteristics are
related both to student achievement and instructional quality. Studies indicate that
students experience larger test score gains in math from teachers with prior education and
coursework in this content area (Boyd, Grossman, Lankford, Loeb, & Wyckoff, 2009;
Wayne & Youngs, 2003), some forms of alternative certification such as Teach for
America relative to traditional certification (Clark et al, 2013; Decker, Mayer, &
Glazerman, 2004), more experience in the classroom (Chetty et al., 2011; Papay & Kraft,
forthcoming; Rockoff, 2004), and stronger content knowledge (Metzler & Woessmann,
2012). Emerging work also highlights the possible role of additional professional 8 I identify these specialized classes in cases where more than 50% of students have this designation.
27
competencies, such as knowledge of student performance, in raising student achievement
(Kunter, Klusmann, Baumert, Richter, Voss, & Hachfeld, 2013; Sadler, Sonnert, Coyle,
Cook-Smith, & Miller, 2013). These factors also appear to predict some dimensions of
instructional quality in this or other datasets (see Table 3 and Hill, Blazar, & Lynch, 2015
for further discussion).
Because it is possible that I am missing other important characteristics – namely
unobservable ones – I test the sensitivity of results to models that include different sets of
teacher-level covariates. I also interpret results cautiously. Despite this limitation, I
believe that my ability to isolate instructional practices from a range of other teacher
traits and skills is an advance beyond similar studies.
5. Results
5.1 Main Results
In Table 7a, I present models examining the relationship between instructional
quality and student achievement. This first set of models examines the robustness of
estimates to specifications that attempt to account for the non-random sorting of students
to schools and teachers. I begin with a basic model (Model A) that regresses students’
spring test score on teacher-level observation scores. I include a cubic function of
fall/prior achievement on the project-administered test and state standardized tests in
math and reading; utilizing all three tests of prior achievement allows me to compare
students with similar scores on low- and high-stakes tests across both subjects, increasing
the precision of my estimates. I also include district-by-grade-by-year dummy variables
to account for differences in scaling of tests; and vectors of student-, class-, and school-
level covariates. Next, I replace school-level covariates with school fixed effects (Model
28
B). In Model C, I retain the school fixed effects and replace observation scores at the
teacher level with those at the school-grade-year level. This model matches equation (2)
above. Finally, in order to ensure that school-specific year effects do not drive results, I
replace school fixed effects with school-by-year fixed effects in Models D. For all models,
I limit the sample to those school-grade-years where all teachers from participating
school-grades-years are in the study. Robust standard errors clustered at the school-grade-
year level are reported in parentheses.9
In Model C, intended to account for non-random sorting of students to schools
and teachers, I find that instructional quality dimensions focused on the mathematics
presented in the classroom are related to students’ math achievement. Specifically, I find
a statistically significant and positive coefficient for Ambitious Mathematics Instruction
of 0.10 sd; the coefficient for Mathematical Errors and Imprecisions of -0.05 sd is
marginally significant.
Interestingly, these estimates are larger in magnitude than those from Models A
and B. Comparison of estimates to Model A implies that schools and/or classrooms
where instruction is higher quality tend to have below-average test-score growth. The fact
that estimates in Model C are larger than those in Model B is surprising. By limiting
variation to school-grade-years, I expected to calculate lower-bound estimates of the
relationship between instructional quality and student achievement (see Rivkin,
Hanushek, & Kain, 2005). One possible explanation for my findings may be that school-
grade-year scores are picking up the quality of teaching teams, which also is related to
student achievement. At the same time, these differences are not large. Further, standard
9 I also test the robustness of results to clustering of standard errors at the school-year level, and find that standard errors and significance levels presented below do not change substantively.
29
errors are larger in Model C than in Model B, as I would expect given more limited
variation in my main predictor variables. Finally, I find that estimates in Model D, which
replace school fixed effects with school-by-year fixed effects, are similar in magnitude to
those in Model C. This indicates that year effects do not drive results. As before, standard
errors are larger than those in Model C given more limited identifying variation. I find no
statistically significant relationships for the two other dimensions of instruction.
In Table 7b, I re-estimate results from Model C controlling for different sets of
teacher characteristics. I focus on four categories of covariates: education and
certification (Model E), teaching experience (Model F), knowledge (Model G), and non-
instructional classroom behaviors (Model H). In Model I, I include all four sets of
predictors. Similar to instructional quality dimensions, these covariates are averaged to
the school-grade-year level. Here, I find that estimates for Ambitious Mathematics
Instruction are fairly robust to inclusion of these control variables. In Model G, which
controls for two measures of teacher knowledge, I find a marginally significant estimate
of 0.08 sd. This slight attenuation makes sense given the positive relationship between
mathematical content knowledge and Ambitious Mathematics Instruction noted earlier.
Interestingly, coefficients from models that include other sets of covariates are slightly
larger than my estimate of 0.10 sd from Model C; in Model I, which controls for all
teacher characteristics, the resulting estimate is roughly 0.11 sd. One reason for this may
be that be these additional predictors are negatively related either to instructional quality
or to student achievement. Earlier, I showed a negative, though not statistically
significant, correlation between Ambitious Mathematics Instruction and bachelor’s
degree in education; here, I observe small but negative relationships to student
30
achievement for bachelor’s degree in education, math coursework, traditional
certification, and preparation for class. I am cautious in placing too much emphasis on
these differences, as they are not large. However, these patterns suggest that some
omitted variables may lead to upward bias while others lead to downward bias.
The relationship between Mathematical Errors and Imprecisions and student
achievement is more sensitive to inclusion of control variables. Original estimates from
Model C are attenuated most significantly when controlling for teachers’ mathematical
content knowledge; the resulting estimate of roughly -0.04 sd in Model G is no longer
marginally statistically significant. This attenuation is unsurprising given a moderate to
strong relationship between Mathematical Errors and Imprecisions and mathematical
content knowledge noted earlier (r = -0.46). Therefore, it is difficult to tell whether
student achievement is negatively impacted by teachers’ lack of content knowledge, the
way that this lack of knowledge leads to errors and imprecisions in the presentation of
material, or a related construct. When I include all sets of predictors in the same model
(Model I), the estimate for Mathematical Errors and Imprecisions is -0.03 sd and not
statistically significant.
5.2 Generalizability of Results Beyond Identification Sample
Finally, in Table 8, I examine whether teachers and schools included in my
identification sample are representative of those in their respective districts. Because I do
not have instructional quality scores for all district teachers, for this analysis I draw on
mathematics value-added scores using state assessment data. I also compare observable
characteristics of school-grade-years from my identification sample to those across the
rest of the sample districts, looking for differences on each characteristic individually and
31
as a group. P-values testing the difference between sample means are calculated through
a regression framework that controls for district, as recruitment of schools and teachers
occurred at this level. In both cases of teachers and school-grade-years, I cannot reject the
null hypothesis that my identification sample is the same as the rest of the district
populations (for differences in teachers’ value-added scores: p = 0.123; for joint
differences in observable characteristics of school-grade-years: F = 0.902, p = 0.531).
Therefore, I conclude that results likely generalizable to these populations.
6. Discussion and Conclusion
This study provides some of the strongest evidence to date on the relationship
between specific instructional dimensions and students’ mathematics achievement. Like
others (e.g., Kane et al., 2013; Kane & Staiger, 2012; Kane et al., 2011), I utilize
observation instruments that capture instructional quality within teachers’ own
classrooms. I also draw on established econometric methods to account for the non-
random sorting of students to teachers (e.g., Rivkin, Hanushek, & Kain, 2005).
Importantly, I build on past work by examining multiple dimensions of teaching practice,
including content-specific elements of instruction and more general pedagogical
strategies. Further, I examine the sensitivity of results to models that control for different
sets of teacher characteristics. This allows me to isolate dimensions of instructional
quality from the most likely observable characteristics that might threaten the internal
validity of my results. To my knowledge, no other studies are able to control for this
broad set of teaching practices and teacher characteristics. While it is possible that
estimates are sensitive to other observed or unobserved characteristics not included in
32
these data, my findings provide strong suggestive evidence of teaching dimensions that
support student achievement.
Results indicate that inquiry-oriented instruction is positively related to student
outcomes on a low-stakes math test, with an effect size of roughly 0.10 sd. This finding
lends support to decades worth of reform to refocus mathematics instruction toward
inquiry and concept-based teaching (National Council of Teachers of Mathematics, 1989,
1991, 2000), as well as positive results of some of these types of activities in laboratory
settings (e.g., Star & Rittle-Johnson, 2009). In some analyses, I also find smaller effect
sizes for incorrect presentation of content, though estimates are sensitive to the set of
covariates included in the model, particularly teachers’ content knowledge. At the same
time, even the smallest estimate of roughly 0.03 sd (see Model I in Table 7b) is similar in
magnitude to estimates of the relationship between mentor evaluations and student
achievement (Rockoff & Speroni, 2010), suggesting that this finding may still be
substantively significant.
Finally, I find no relationship between classroom climate or classroom
management and student achievement. These results diverge from recent research
highlighting the importance of classroom organization and interactions with students,
often above other classroom features (Grossman, Loeb, Cohen, & Wyckoff, 2013;
Stronge, Ward, & Grant, 2011). In particular, Kane and co-authors (2011, 2012, 2013)
found positive relationships between these sorts of classroom practices, as captured on
the Framework for Teaching observation instrument, and student achievement; estimates
were similar in magnitude to the relationship I find between Ambitious Mathematics
Instruction and student outcomes. One reason for these differences may be that these

33
other studies did not account for additional dimensions of teacher and teaching quality.
Therefore, the observed relationship between classroom organization and student
achievement may be driven by other practices and skills that are related to this type of
instruction. Another reason may be that the outcome used to measure math achievement
in this study is a low-stakes test that emphasizes cognitively demanding mathematics
practices. Classroom organization and interactions with students may in fact be important
contributors to high-stakes achievement tests or non-cognitive outcomes. This is an
important topic for future research.
Evidence on the relationship between specific types of teaching and student
achievement raises the question of how to get more teachers who engage in these
practices into classrooms. Following Murnane and Cohen (1986), I argue that incentives
are unlikely to prove effective here, as teachers may not know how to improve their
instruction. Therefore, I propose two possible pathways. First, an array of recent literature
highlights the potential use of observation instruments themselves to remediate teacher
practice. Despite mixed results on the effect of standard professional development
programs on teachers’ content knowledge, instructional practices, or student achievement
(Garet et al., 2011; Yoon, Duncan, Lee, Scarloss, & Shapley, 2007), new experimental
studies highlight positive effects of more intensive coaching programs that utilize
observation instruments to improve teacher behaviors and, in some cases, student
outcomes (Allen et al., 2011; Blazar & Kraft, forthcoming; McCollum, Hemmeter, &
Hsieh, 2011; Taylor & Tyler, 2012). Thus far, this sort of work has focused on use of
observation instruments to capture general teaching practices and those specific to
34
literacy instruction. However, it is possible that findings also extend to inquiry-oriented
practices in mathematics.
A second pathway to increase the quality of classroom teaching may also focus on
selective recruitment of teachers with content-area expertise. My findings show a
moderate to strong relationship between teachers’ knowledge of math and the way that
this content is enacted in the classroom. Further, I find suggestive evidence of a
relationship between incorrect presentation of content and student outcomes. While more
research is needed to confirm these relationships, these patterns may inform processes by
which education preparation programs and state licensing agencies screen prospective
elementary math teachers. A survey of degree pathways indicates minimal requirements
for entry and a high degree of variability in the type of training pre-service teachers
receive in mathematics. In addition, in all but a few states, elementary teachers can pass
their licensing exam without passing the math sub-section (Epstein & Miller, 2011). It is
possible that creating more stringent requirements into the workforce related to math
knowledge could lead to more accurate and precise presentation of content and to better
student outcomes.
Filling elementary classrooms with teachers who engage in effective mathematics
teaching practices will take time. Doing so likely will entail a variety of efforts, including
improvements in professional development offerings that engage teachers substantively
around their own teaching practices and stronger efforts to hire teachers with deep
knowledge of mathematics. Importantly, though, the education community is beginning
to gain an understanding of the types of teaching that contribute to student achievement.
35
Works Cited
Allen, J. P., Pianta, R. C., Gregory, A., Mikami, A. Y., & Lun, J. (2011). An interaction-
based approach to enhancing secondary school instruction and student
achievement. Science, 333, 1034-1037.
Anderson, L. M., Evertson, C. M., & Brophy, J. E. (1979). An experimental study of
effective teaching in first-grade reading groups. The Elementary School Journal,
79(4), 193-223.
Bell, C. A., Gitomer, D. H., McCaffrey, D. F., Hamre, B. K., Pianta, R. C., & Qi, Y.
(2012). An argument approach to observation protocol validity. Educational
Assessment, 17(2-3), 62-87.
Blazar, D., Braslow, D., Charalambous, C. Y., & Hill, H. C. (2015). Attending to general
and content-specific dimensions of teaching: Exploring factors across two
observation instruments. Working Paper. Cambridge, MA: National Center for
Teacher Effectiveness, Harvard University.
Blazar, D., & Kraft, M. A. (Forthcoming). Exploring mechanisms of effective teacher
coaching: A tale of two cohorts from a randomized experiment. Educational
Evaluation and Policy Analysis.
Boyd, D., Grossman, P., Lankford, H., Loeb, S., & Wyckoff, J. (2006). How changes in
entry requirements alter the teacher workforce and affect student
achievement. Education Finance and Policy, 1(2), 176-216.
Boyd, D. J., Grossman, P. L., Lankford, H., Loeb, S., & Wyckoff, J. (2009). Teacher
preparation and student achievement. Educational Evaluation and Policy
Analysis, 31(4), 416-440.
36
Chetty, R., Friedman, J. N., Hilger, N., Saez, E., Schazenbach, D. W., & Yagan, D.
(2011). How does your kindergarten classroom affect your earnings? Evidence
from Project Star. Quarterly Journal of Economics, 126(4), 1593-1660.
Chetty, R., Friedman, J. N., & Rockoff, J. E. (2014). Measuring the impacts of teachers
II: Teacher value-added and student outcomes in adulthood. American Economic
Review, 104(9), 2633-79.
Clark, M.A., Chiang, H.S., Silva, T., McConnell, S., Sonnenfeld, K., Erbe, A., & Puma,
M. (2013). The effectiveness of secondary math teachers from Teach For America
and the Teaching Fellows programs. Washington, DC: U.S. Department of
Education.
Clotfelter, C. T., Ladd, H. F., & Vigdor, J. L. (2006). Teacher-student matching and the
assessment of teacher effectiveness. Journal of Human Resources, 41(4), 778-820.
Decker, P. T., Mayer, D. P., & Glazerman, S. (2004). The effects of Teach for America on
students: Findings from a national evaluation. Princeton, NJ: Mathematica Policy
Research, Inc.
Duncan, A. (2010). Back to school: Enhancing U.S. education and competitiveness.
Foreign Affairs, 89(6), 65-74.
Epstein, D., & Miller, R. T. (2011). Slow off the Mark: Elementary School Teachers and
the Crisis in STEM Education. Education Digest: Essential Readings Condensed
for Quick Review, 77(1), 4-10.
Fryer, R. (2013). Teacher incentives and student achievement. Evidence from New York
City public schools. Journal of Labor Economics, 31(2), 373-427.
37
Garet, M. S., Wayne, A. J., Stancavage, F., Taylor, J., Eaton, M., Walters, K., Song, M.,
Brown, S., Hurlburt, S., Zhu, P., Sepanik, S., & Doolittle, F. (2011). Middle
school mathematics professional development impact study: Findings after the
second year of implementation. Washington, DC: U.S. Department of Education.
Goldhaber, D., & Hansen, M. (2012). Is it just a bad class? Assessing the long‐term
stability of estimated teacher performance. Economica, 80(319), 589-612.
Grossman, P., Loeb, S., Cohen, J., & Wyckoff, J. (2013). Measure for measure: The
relationship between measures of instructional practice in middle school English
language arts and teachers’ value-added. American Journal of Education, 119(3),
445-470.
Hanushek, E. A. (2009). Teacher deselection. In D. Goldhaber & J. Hannaway (Eds.),
Creating a new teaching profession (p. 165-180). Washington, D C: Urban
Institute Press.
Harris, D. N., & Sass, T. R. (2011). Teacher training, teacher quality and student
achievement. Journal of Public Economics, 95(7), 798-812.
Hickman, J. J., Fu, J., & Hill, H. C. (2012). Technical report: Creation and dissemination
of upper-elementary mathematics assessment modules. Princeton, NJ: Educational
Testing Service.
Hill, H. C., Blazar, D., Lynch, K. (2015). Predicting teachers’ instructional practices:
Elements that support strong instruction. Working Paper. Cambridge, MA:
National Center for Teacher Effectiveness, Harvard University.
Hill, H. C., Charalambous, C. Y., Blazar, D., McGinn, D., Kraft, M. A., Beisiegel, M.,
Humez, A., Litke, E., & Lynch, K. (2012). Validating arguments for observational
38
instruments: Attending to multiple sources of variation. Educational Assessment,
17(2-3), 88-106.
Hill, H. C., Charalambous, C. Y., & Kraft, M. A. (2012). When rater reliability is not
enough: Teacher observation systems and a case for the generalizability study.
Educational Researchers, 41(2), 56-64.
Hill, H.C., Schilling, S.G., & Ball, D.L. (2004). Developing measures of teachers’
mathematics knowledge for teaching. Elementary School Journal, 105, 11-30.
Ho, A. D., & Kane, T. J. (2013). The reliability of classroom observations by school
personnel. Seattle, WA: Measures of Effective Teaching Project, Bill and
Melinda Gates Foundation.
Jacob B. A., & Lefgren L. (2008). Can principals identify effective teachers? Evidence on
subjective performance evaluation in education. Journal of Labor Economics,
20(1), 101-136.
Johnson, C. (2012). Implementation of STEM education policy: Challenges, progress,
and lessons learned. School Science and Mathematics, 112(1), 45-55.
Kane, T. J., McCaffrey, D. F., Miller, T., & Staiger, D. O. (2013). Have we identified
effective teachers? Validating measures of effective teaching using random
assignment. Seattle: The Bill and Melinda Gates Foundation.
Kane, T. J., Rockoff, J. E., & Staiger, D. O. (2008). What does certification tell us about
teacher effectiveness? Evidence from New York City. Economics of Education
Review, 27(6), 615-631.
39
Kane, T. J., & Staiger, D. O. (2012). Gathering feedback for teaching: Combining high-
quality observations student surveys and achievement gains. Seattle: The Bill and
Melinda Gates Foundation.
Kane, T. J., Taylor, E. S., Tyler, J. H., & Wooten, A. L. (2011). Identifying effective
classroom practices using student achievement data. Journal of Human Resources,
46(3), 587-613.
Koedel, C., & Betts, J. R. (2011). Does student sorting invalidate value-added models of
teacher effectiveness? An extended analysis of the Rothstein critique. Education
Finance and Policy, 6(1), 18-42.
Kunter, M., Klusmann, U., Baumert, J., Richter, D., Voss, T., & Hachfeld, A. (2013).
Professional competence of teachers: Effects on instructional quality and student
development. Journal of Educational Psychology, 105(3), 805-820.
Lockwood, J. R., McCaffrey, D. F., Hamilton, L. S., Stecher, B., Le V., & Martinez, J. F.
(2007). The sensitivity of value-added teacher effect estimates to different
mathematics achievement measures. Journal of Educational Measurement, 44(1),
47-67.
Lynch, K., Chin, M., & Blazar, D. (2015). How well do teacher observations of
elementary mathematics instruction predict value-added? Exploring variability
across districts. Working Paper. Cambridge, MA: National Center for Teacher
Effectiveness, Harvard University.
McCollum, J. A., Hemmeter, M. L., & Hsieh, W. (2011). Coaching teachers for emergent
literacy instruction using performance-based feedback. Topics in Early Childhood
Education, 20(10), 1-10.
40
Metzler, J., & Woessmann, L. (2012). The impact of teacher subject knowledge on
student achievement: Evidence from within-teacher within-student variation.
Journal of Development Economics, 99(2), 486-496.
Murnane, R. J., & Cohen, D. K. (1986). Merit pay and the evaluation problem: Why most
merit pay plans fail and a few survive. Harvard Educational Review, 56(1), 1-18.
Murnane, R. J., & Willett, J. B. (2011). Methods matter: Improving causal inference in
educational and social science research. New York: Oxford University Press.
National Council of Teachers of Mathematics. (1989). Curriculum and evaluation
standards for school mathematics. Reston, VA: Author.
National Council of Teachers of Mathematics. (1991). Professional standards for
teaching mathematics. Reston, VA: NCTM.
National Council of Teachers of Mathematics. (2000). Principles and standards for
school mathematics. Reston, VA: Author.
National Governors Association Center for Best Practices, Council of Chief State School
Officers. (2010). Common core state standards for mathematics. Washington,
DC: Author.
Nye, B., Konstantopoulos, S., & Hedges, L. V. (2004). How large are teacher effects?
Educational Evaluation and Policy Analysis, 26(3), 237–257.
Papay, J. P. (2011). Different tests, different answers: The stability of teacher value-
added estimates across outcome measures. American Educational Research
Journal, 48(1), 163-193.
41
Papay, J. P., & Kraft, M. A. (Forthcoming). Productivity returns to experience in the
teacher labor market: Methodological challenges and new evidence on long-term
career improvement. Journal of Public Economics.
Pianta, R. C., & Hamre, B. K. (2009). Conceptualization, measurement, and
improvement of classroom processes: Standardized observation can leverage
capacity. Educational Researcher, 38(2), 109-119.
Porter, A. C. (2002). Measuring the content of instruction: Uses in research and practice.
Educational Researcher, 31(7), 3-14.
Porter, A., McMaken, J., Hwang, J., & Yang, R. (2011). Common core standards: The
new U.S. intended curriculum. Educational Researcher, 40(3), 103-116.
Raudenbush, S. W., & Bryk, A. S. (2002). Hierarchical linear models: Applications and
data analysis methods. Second Edition. Thousand Oaks, CA: Sage Publications.
Rivkin, S. G., Hanushek, E. A., & Kain, J. F. (2005). Teachers, schools, and academic
achievement. Econometrica, 73(2), 417-458.
Rockoff, J. E. (2004). The impact of individual teachers on student achievement:
Evidence from panel data. American Economic Review, 94(2), 247–252.
Rockoff, J. E., & Speroni, C. (2010). Subjective and objective evaluations of teacher
effectiveness. American Economic Review, 261-266.
Rockoff, J. E., Staiger, D. O., Kane, T.J., & Taylor, E. S. (2012). Information and
employee evaluation: Evidence from a randomized intervention in public
schools. American Economic Review, 102(7), 3184-3213.
Rothstein, J. (2010). Teacher quality in educational production: Tracking, decay, and
student achievement. Quarterly Journal of Economics, 125(1), 175-214.
42
Sadler, P. M., Sonnert, G., Coyle, H. P., Cook-Smith, N., & Miller, J. L (2013). The
influence of teachers’ knowledge on student learning in middle school physical
science classrooms. American Educational Research Journal, 50(5), 1020-1049.
Schochet, P. Z., & Chiang, H. S. (2013). What are error rates for classifying teacher and
school performance using value-added models? Journal of Educational and
Behavioral Statistics, 38(2), 142-171.
Springer, M. G., Ballou, D., Hamilton, L., Le, V., Lockwood, J. R., McCaffrey, D. F.,
Pepper, M., & Stecher, B. M. (2010). Teacher pay for performance: Experimental
evidence from the project on incentives in teaching. RAND Corporation.
Star, J. R., & Rittle-Johnson, B. (2009). It pays to compare: An experimental study on
computational estimation. Journal of Experimental Child Psychology, 102(4),
408-426.
Stronge, J. H., Ward, T. J., & Grant, L. W. (2011). What makes good teachers good? A
cross-case analysis of the connection between teacher effectiveness and student
achievement. Journal of Teacher Education, 62(4), 339-355.
Taylor, E. S., & Tyler, J. H. (2012). The effect of evaluation on teacher performance. The
American Economic Review, 102(7), 3628-3651.
U.S. Department of Education (2010). A blueprint for reform: Reauthorization of the
Elementary and Secondary Education Act. Washington, DC: U.S. Department of
Education, Office of Planning, Evaluation and Policy Development.
Wayne, A. J., & Youngs, P. (2003). Teacher characteristics and student achievement
gains: A review. Review of Educational Research, 73(1), 89-122.
43
Woessmann, L., & West, M. (2006). Class-size effects in school systems around the
world: Evidence from between-grade variation in TIMSS. European Economic
Review, 50, 695-736.
Yoon, K. S., Duncan, T., Lee, S. W. Y., Scarloss, B., & Shapley, K. (2007). Reviewing
the evidence on how teacher professional development affects student
achievement. Washington, DC: U.S. Department of Education.
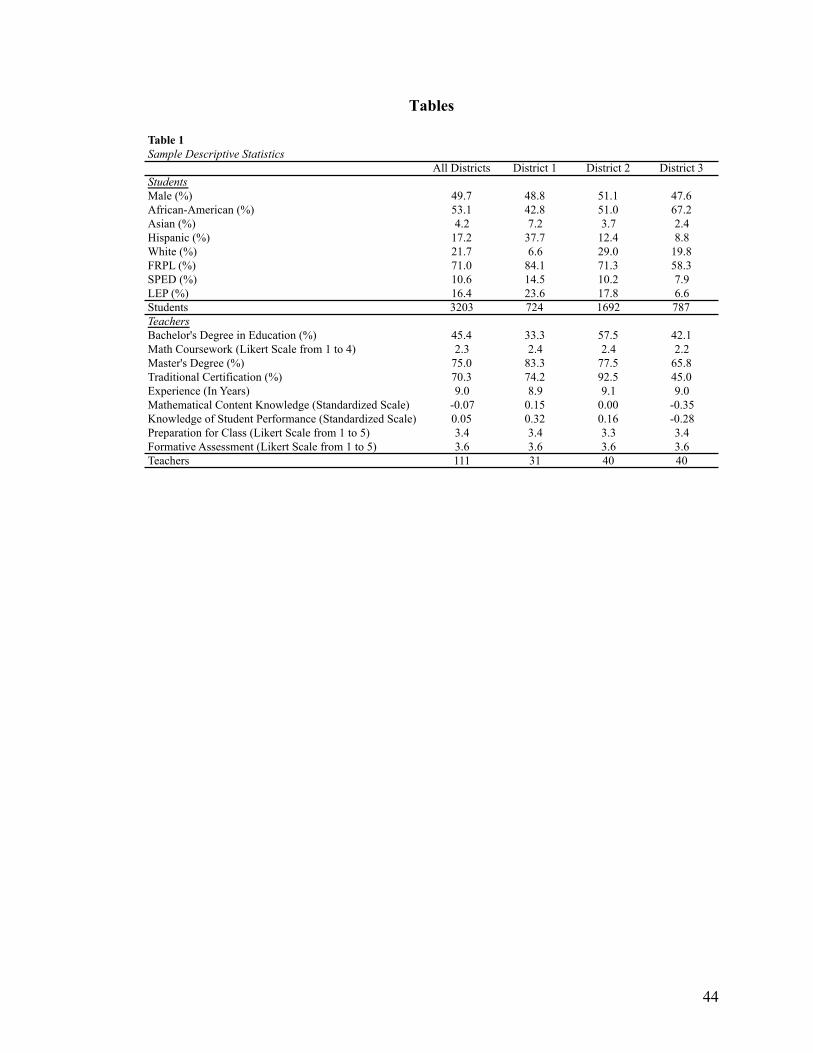
44
Tables
Table 1Sample Descriptive Statistics
All Districts District 1 District 2 District 3StudentsMale (%) 49.7 48.8 51.1 47.6African-American (%) 53.1 42.8 51.0 67.2Asian (%) 4.2 7.2 3.7 2.4Hispanic (%) 17.2 37.7 12.4 8.8White (%) 21.7 6.6 29.0 19.8FRPL (%) 71.0 84.1 71.3 58.3SPED (%) 10.6 14.5 10.2 7.9LEP (%) 16.4 23.6 17.8 6.6Students 3203 724 1692 787TeachersBachelor's Degree in Education (%) 45.4 33.3 57.5 42.1Math Coursework (Likert Scale from 1 to 4) 2.3 2.4 2.4 2.2Master's Degree (%) 75.0 83.3 77.5 65.8Traditional Certification (%) 70.3 74.2 92.5 45.0Experience (In Years) 9.0 8.9 9.1 9.0Mathematical Content Knowledge (Standardized Scale) -0.07 0.15 0.00 -0.35Knowledge of Student Performance (Standardized Scale) 0.05 0.32 0.16 -0.28Preparation for Class (Likert Scale from 1 to 5) 3.4 3.4 3.3 3.4Formative Assessment (Likert Scale from 1 to 5) 3.6 3.6 3.6 3.6Teachers 111 31 40 40
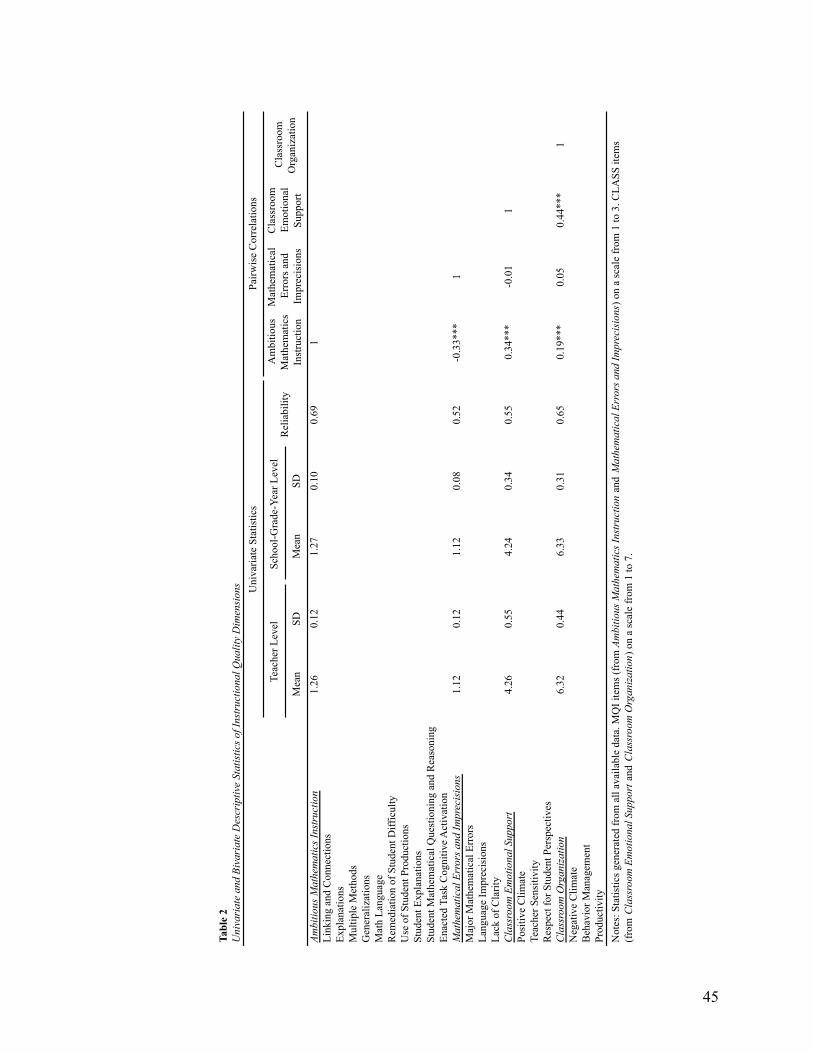
45
Tabl
e 2
Uni
vari
ate
and
Biva
riat
e D
escr
iptiv
e St
atis
tics o
f Ins
truc
tiona
l Qua
lity
Dim
ensi
ons
Mea
nSD
Mea
nSD
Ambi
tious
Mat
hem
atic
s Ins
truc
tion
1.26
0.12
1.27
0.10
0.69
1Li
nkin
g an
d C
onne
ctio
nsEx
plan
atio
nsM
ultip
le M
etho
dsG
ener
aliz
atio
nsM
ath
Lang
uage
Rem
edia
tion
of S
tude
nt D
iffic
ulty
Use
of S
tude
nt P
rodu
ctio
nsSt
uden
t Exp
lana
tions
Stud
ent M
athe
mat
ical
Que
stio
ning
and
Rea
soni
ngEn
acte
d Ta
sk C
ogni
tive A
ctiv
atio
nM
athe
mat
ical
Err
ors a
nd Im
prec
isio
ns1.
120.
121.
120.
080.
52-0
.33*
**1
Maj
or M
athe
mat
ical
Err
ors
Lang
uage
Impr
ecis
ions
Lack
of C
larit
yC
lass
room
Em
otio
nal S
uppo
rt4.
260.
554.
240.
340.
550.
34**
*-0
.01
1Po
sitiv
e C
limat
eTe
ache
r Sen
sitiv
ityR
espe
ct fo
r Stu
dent
Per
spec
tives
Cla
ssro
om O
rgan
izat
ion
6.32
0.44
6.33
0.31
0.65
0.19
***
0.05
0.44
***
1N
egat
ive
Clim
ate
Beh
avio
r Man
agem
ent
Prod
uctiv
ity
Uni
varia
te S
tatis
tics
Pairw
ise
Cor
rela
tions
Not
es: S
tatis
tics g
ener
ated
from
all
avai
labl
e da
ta. M
QI i
tem
s (fr
om A
mbi
tious
Mat
hem
atic
s Ins
truc
tion
and
Mat
hem
atic
al E
rror
s and
Impr
ecis
ions
) on
a sc
ale
from
1 to
3. C
LASS
item
s (f
rom
Cla
ssro
om E
mot
iona
l Sup
port
and
Cla
ssro
om O
rgan
izat
ion)
on
a sc
ale
from
1 to
7.
Teac
her L
evel
Scho
ol-G
rade
-Yea
r Lev
elR
elia
bilit
yA
mbi
tious
M
athe
mat
ics
Inst
ruct
ion
Mat
hem
atic
al
Erro
rs a
nd
Impr
ecis
ions
Cla
ssro
om
Emot
iona
l Su
ppor
t
Cla
ssro
om
Org
aniz
atio
n
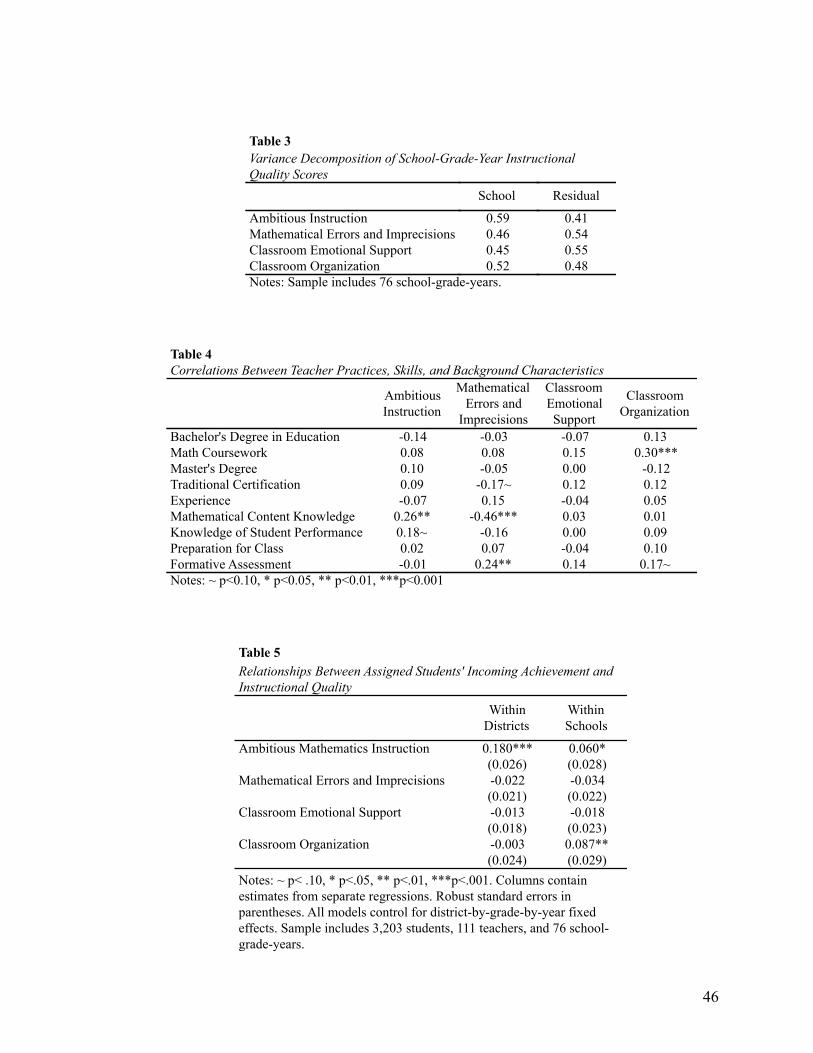
46
Table 3Variance Decomposition of School-Grade-Year Instructional Quality ScoresVariance Decomposition of School-Grade-Year Instructional Quality ScoresVariance Decomposition of School-Grade-Year Instructional Quality Scores
School Residual
Ambitious InstructionMathematical Errors and ImprecisionsClassroom Emotional SupportClassroom Organization
0.590.460.450.52
0.410.540.550.48
Notes: Sample includes 76 school-grade-years.Notes: Sample includes 76 school-grade-years.
Table 4Correlations Between Teacher Practices, Skills, and Background Characteristics
Ambitious Instruction
Mathematical Errors and
Imprecisions
Classroom Emotional Support
Classroom Organization
Bachelor's Degree in Education -0.14 -0.03 -0.07 0.13Math Coursework 0.08 0.08 0.15 0.30***Master's Degree 0.10 -0.05 0.00 -0.12Traditional Certification 0.09 -0.17~ 0.12 0.12Experience -0.07 0.15 -0.04 0.05Mathematical Content Knowledge 0.26** -0.46*** 0.03 0.01Knowledge of Student Performance 0.18~ -0.16 0.00 0.09Preparation for Class 0.02 0.07 -0.04 0.10Formative Assessment -0.01 0.24** 0.14 0.17~Notes: ~ p<0.10, * p<0.05, ** p<0.01, ***p<0.001
Table 5
Within Districts
Within Schools
Ambitious Mathematics Instruction 0.180*** 0.060*(0.026) (0.028)
Mathematical Errors and Imprecisions -0.022 -0.034(0.021) (0.022)
Classroom Emotional Support -0.013 -0.018(0.018) (0.023)
Classroom Organization -0.003 0.087**(0.024) (0.029)
Relationships Between Assigned Students' Incoming Achievement and Instructional Quality
Notes: ~ p< .10, * p<.05, ** p<.01, ***p<.001. Columns contain estimates from separate regressions. Robust standard errors in parentheses. All models control for district-by-grade-by-year fixed effects. Sample includes 3,203 students, 111 teachers, and 76 school-grade-years.
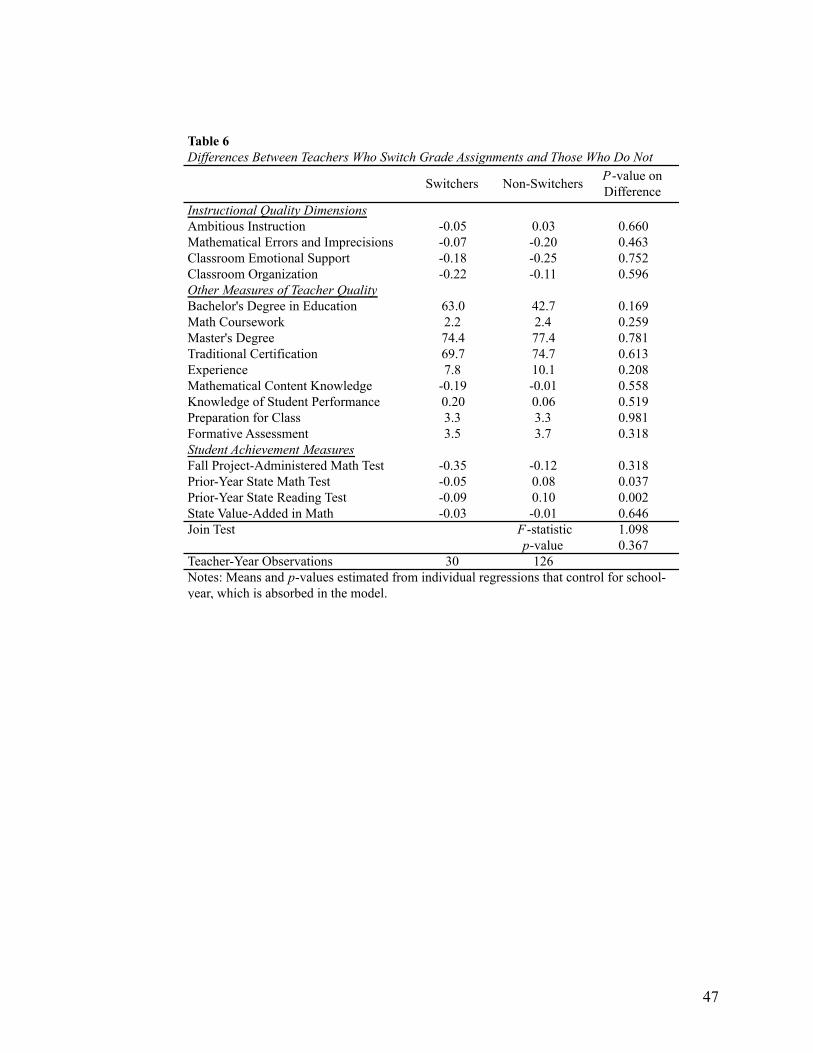
47
Table 6
Switchers Non-Switchers P-value on Difference
Instructional Quality DimensionsAmbitious Instruction -0.05 0.03 0.660Mathematical Errors and Imprecisions -0.07 -0.20 0.463Classroom Emotional Support -0.18 -0.25 0.752Classroom Organization -0.22 -0.11 0.596Other Measures of Teacher QualityBachelor's Degree in Education 63.0 42.7 0.169Math Coursework 2.2 2.4 0.259Master's Degree 74.4 77.4 0.781Traditional Certification 69.7 74.7 0.613Experience 7.8 10.1 0.208Mathematical Content Knowledge -0.19 -0.01 0.558Knowledge of Student Performance 0.20 0.06 0.519Preparation for Class 3.3 3.3 0.981Formative Assessment 3.5 3.7 0.318Student Achievement MeasuresFall Project-Administered Math Test -0.35 -0.12 0.318Prior-Year State Math Test -0.05 0.08 0.037Prior-Year State Reading Test -0.09 0.10 0.002State Value-Added in Math -0.03 -0.01 0.646Join Test F-statistic 1.098
p-value 0.367Teacher-Year Observations 30 126Notes: Means and p-values estimated from individual regressions that control for school-year, which is absorbed in the model.
Differences Between Teachers Who Switch Grade Assignments and Those Who Do Not
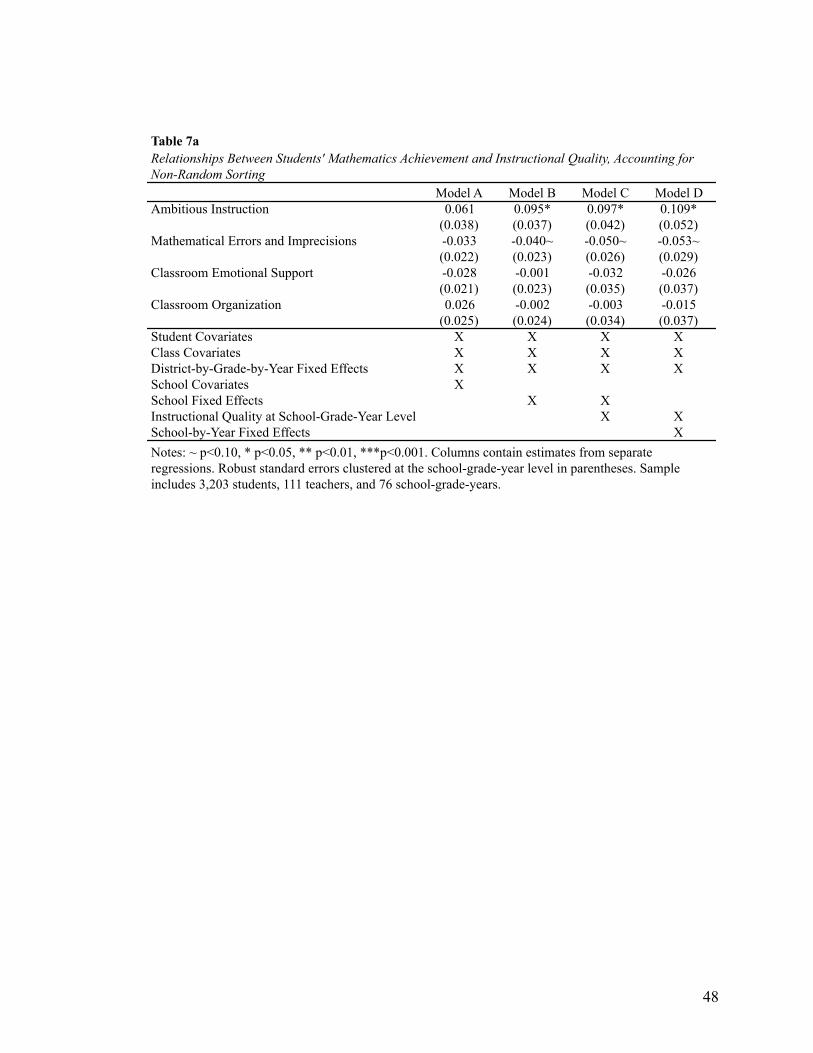
48
Table 7a
Model A Model B Model C Model DAmbitious Instruction 0.061 0.095* 0.097* 0.109*
(0.038) (0.037) (0.042) (0.052)Mathematical Errors and Imprecisions -0.033 -0.040~ -0.050~ -0.053~
(0.022) (0.023) (0.026) (0.029)Classroom Emotional Support -0.028 -0.001 -0.032 -0.026
(0.021) (0.023) (0.035) (0.037)Classroom Organization 0.026 -0.002 -0.003 -0.015
(0.025) (0.024) (0.034) (0.037)Student Covariates X X X XClass Covariates X X X XDistrict-by-Grade-by-Year Fixed Effects X X X XSchool Covariates XSchool Fixed Effects X XInstructional Quality at School-Grade-Year Level X XSchool-by-Year Fixed Effects X
Relationships Between Students' Mathematics Achievement and Instructional Quality, Accounting for Non-Random Sorting
Notes: ~ p<0.10, * p<0.05, ** p<0.01, ***p<0.001. Columns contain estimates from separate regressions. Robust standard errors clustered at the school-grade-year level in parentheses. Sample includes 3,203 students, 111 teachers, and 76 school-grade-years.
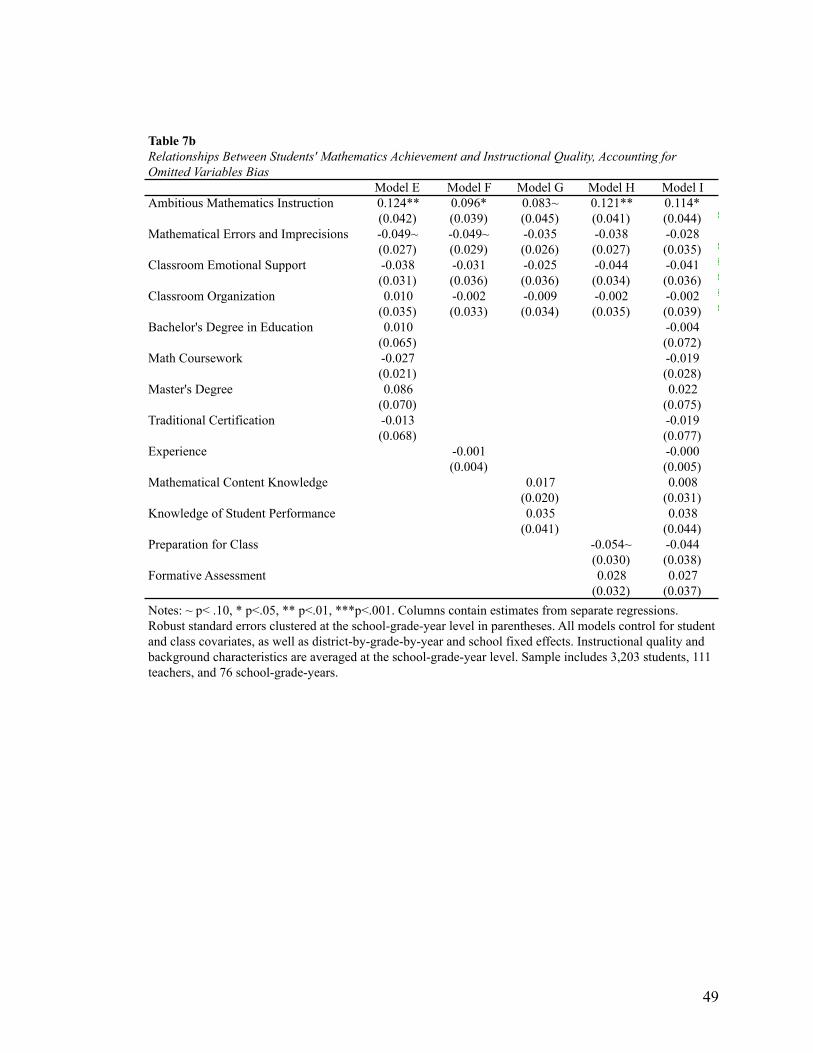
49
Table 7b
Model E Model F Model G Model H Model IAmbitious Mathematics Instruction 0.124** 0.096* 0.083~ 0.121** 0.114*
(0.042) (0.039) (0.045) (0.041) (0.044)Mathematical Errors and Imprecisions -0.049~ -0.049~ -0.035 -0.038 -0.028
(0.027) (0.029) (0.026) (0.027) (0.035)Classroom Emotional Support -0.038 -0.031 -0.025 -0.044 -0.041
(0.031) (0.036) (0.036) (0.034) (0.036)Classroom Organization 0.010 -0.002 -0.009 -0.002 -0.002
(0.035) (0.033) (0.034) (0.035) (0.039)Bachelor's Degree in Education 0.010 -0.004
(0.065) (0.072)Math Coursework -0.027 -0.019
(0.021) (0.028)Master's Degree 0.086 0.022
(0.070) (0.075)Traditional Certification -0.013 -0.019
(0.068) (0.077)Experience -0.001 -0.000
(0.004) (0.005)Mathematical Content Knowledge 0.017 0.008
(0.020) (0.031)Knowledge of Student Performance 0.035 0.038
(0.041) (0.044)Preparation for Class -0.054~ -0.044
(0.030) (0.038)Formative Assessment 0.028 0.027
(0.032) (0.037)
Relationships Between Students' Mathematics Achievement and Instructional Quality, Accounting for Omitted Variables Bias
Notes: ~ p< .10, * p<.05, ** p<.01, ***p<.001. Columns contain estimates from separate regressions. Robust standard errors clustered at the school-grade-year level in parentheses. All models control for student and class covariates, as well as district-by-grade-by-year and school fixed effects. Instructional quality and background characteristics are averaged at the school-grade-year level. Sample includes 3,203 students, 111 teachers, and 76 school-grade-years.
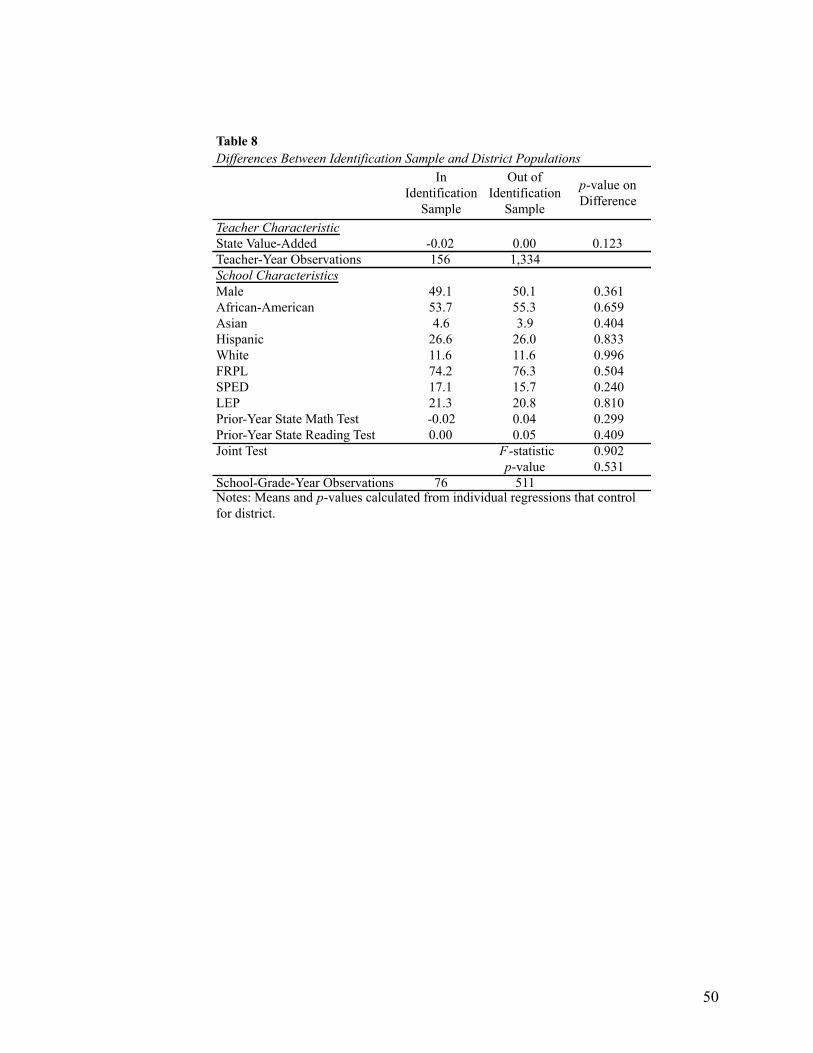
50
Table 8
In Identification
Sample
Out of Identification
Sample
p-value on Difference
Teacher CharacteristicState Value-Added -0.02 0.00 0.123
Differences Between Identification Sample and District Populations
Teacher-Year Observations 156 1,334School CharacteristicsMale 49.1 50.1 0.361African-American 53.7 55.3 0.659Asian 4.6 3.9 0.404Hispanic 26.6 26.0 0.833White 11.6 11.6 0.996FRPL 74.2 76.3 0.504SPED 17.1 15.7 0.240LEP 21.3 20.8 0.810Prior-Year State Math Test -0.02 0.04 0.299Prior-Year State Reading Test 0.00 0.05 0.409Joint Test F-statistic 0.902
p-value 0.531School-Grade-Year Observations 76 511Notes: Means and p-values calculated from individual regressions that control for district.
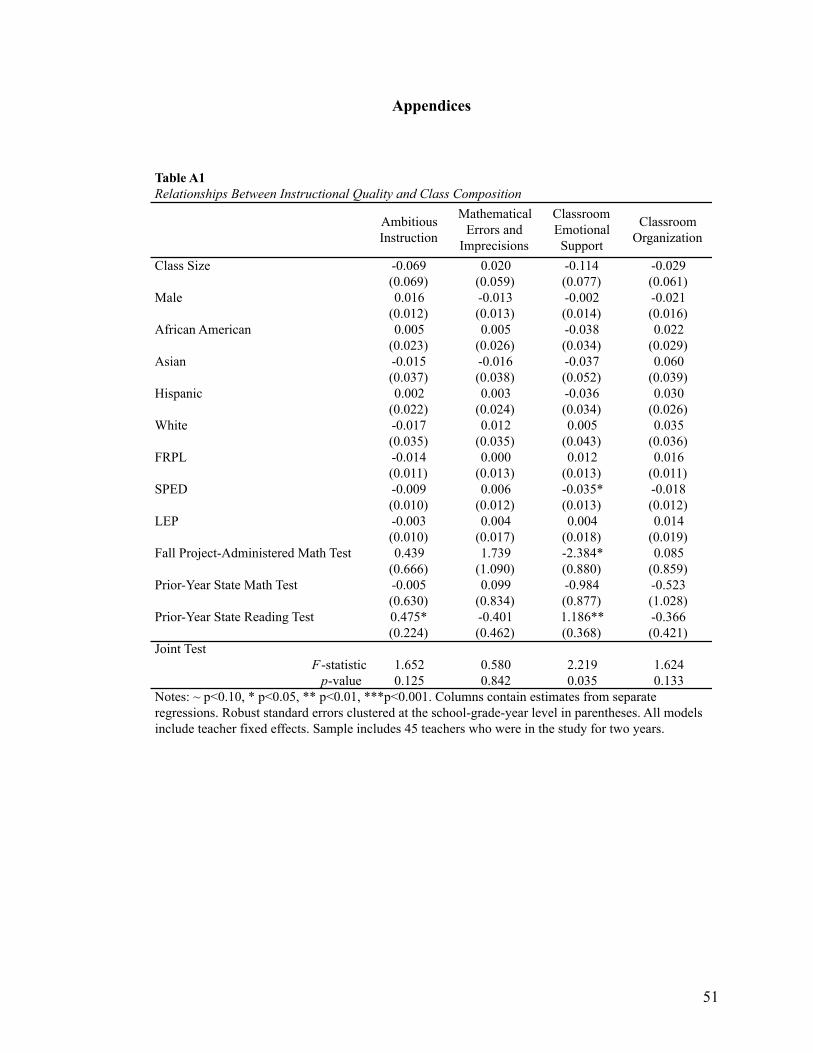
51
Appendices
Table A1Relationships Between Instructional Quality and Class Composition
Ambitious Instruction
Mathematical Errors and
Imprecisions
Classroom Emotional Support
Classroom Organization
Class Size -0.069 0.020 -0.114 -0.029(0.069) (0.059) (0.077) (0.061)
Male 0.016 -0.013 -0.002 -0.021(0.012) (0.013) (0.014) (0.016)
African American 0.005 0.005 -0.038 0.022(0.023) (0.026) (0.034) (0.029)
Asian -0.015 -0.016 -0.037 0.060(0.037) (0.038) (0.052) (0.039)
Hispanic 0.002 0.003 -0.036 0.030(0.022) (0.024) (0.034) (0.026)
White -0.017 0.012 0.005 0.035(0.035) (0.035) (0.043) (0.036)
FRPL -0.014 0.000 0.012 0.016(0.011) (0.013) (0.013) (0.011)
SPED -0.009 0.006 -0.035* -0.018(0.010) (0.012) (0.013) (0.012)
LEP -0.003 0.004 0.004 0.014(0.010) (0.017) (0.018) (0.019)
Fall Project-Administered Math Test 0.439 1.739 -2.384* 0.085(0.666) (1.090) (0.880) (0.859)
Prior-Year State Math Test -0.005 0.099 -0.984 -0.523(0.630) (0.834) (0.877) (1.028)
Prior-Year State Reading Test 0.475* -0.401 1.186** -0.366(0.224) (0.462) (0.368) (0.421)
Joint TestF-statistic 1.652 0.580 2.219 1.624
p-value 0.125 0.842 0.035 0.133Notes: ~ p<0.10, * p<0.05, ** p<0.01, ***p<0.001. Columns contain estimates from separate regressions. Robust standard errors clustered at the school-grade-year level in parentheses. All models include teacher fixed effects. Sample includes 45 teachers who were in the study for two years.
52
Paper 2
Teacher and Teaching Effects on Students’ Attitudes and Behaviors10
Abstract
Research has focused predominantly on how teachers affect students’
achievement on tests despite evidence that a broad range of attitudes and behaviors are
equally important to their long-term success. We find that upper-elementary teachers
have large effects on self-reported measures of students’ self-efficacy in math, and
happiness and behavior in class. Students’ attitudes and behaviors are predicted by
teaching practices most proximal to these measures, including teachers’ emotional
support and classroom organization. However, teachers who are effective at improving
math test scores often are not equally effective at improving students’ attitudes and
behaviors. These findings lend evidence to well-established theory on the
multidimensional nature of teaching and the need to identify strategies for improving the
full range of teachers’ skills.
10 Paper is a collaboration with Matthew A. Kraft.
53
1. Introduction
Empirical research on the education production function traditionally has
examined how teachers and their background characteristics contribute to students’
performance on standardized tests (Todd & Wolpin, 2003; Hanushek & Rivkin, 2010).
However, a substantial body of evidence indicates that student learning is
multidimensional, with many factors beyond their core academic knowledge as important
contributors to both short- and long-term success.11 For example, psychologists find that
emotion and personality influence the quality of one’s thinking (Baron, 1982) and how
much a child learns in school (Duckworth, Quinn, & Tsukayama, 2012). Longitudinal
studies document the strong predictive power of measures of childhood self-control,
emotional stability, persistence, and motivation on health and labor market outcomes in
adulthood (Borghans, Duckworth, Heckman, & Ter Weel, 2008; Chetty et al., 2011;
Moffitt et. al., 2011). In fact, these sorts of attitudes and behaviors are stronger predictors
of some long-term outcomes than test scores (Chetty et al., 2011).
Consistent with these findings, decades worth of theory also have described
teaching as multidimensional. High-quality teachers are thought and expected not only to
raise test scores but also to provide emotionally supportive environments that contribute
to students’ social and emotional development, to manage classroom behaviors, to deliver
accurate content, and to support critical thinking (Cohen, 2011; Lampert, 2001; Pianta &
Hamre, 2009). In recent years, two research traditions have emerged to test this theory
using empirical evidence. The first tradition has focused on observations of classrooms as
11 Although student outcomes beyond test scores often are referred to as “non-cognitive” skills, our preference, like others (Duckworth & Yeager, 2015; Farrington et al., 2012), is to refer to each competency by name. For brevity, we refer to them as “attitudes and behaviors.” We adopt these terms because they most closely characterize the measure we focus on in this paper.
54
a means of identifying unique domains of teaching practice (Blazar, Braslow,
Charalambous, & Hill, 2015; Hamre et al., 2013). Several of these domains, including
teachers’ interactions with students, classroom organization, and emphasis on critical
thinking within specific content areas, aim to support students’ development in areas
beyond their core academic skill. The second research tradition has focused on estimating
internally valid estimates of teachers’ contribution to student outcomes, often referred to
as “teacher effects” (Chetty et al., 2011; Hanushek & Rivkin, 2010). These studies have
found that, as with test scores, teachers vary considerably in their ability to impact
students’ social and emotional development and a variety of observed school behaviors
(Backes & Hansen, 2015; Gershenson, 2016; Jackson, 2012; Jennings & DiPrete, 2010;
Kraft & Grace, 2016; Koedel, 2008; Ladd & Sorensen, 2015; Ruzek et al., 2014).
Further, weak to moderate correlations between teacher effects on different student
outcomes suggest that test scores alone cannot identify teachers’ skill in the classroom
(Gershenson, 2016; Jackson, 2012; Jennings & DiPrete, 2010; Kraft & Grace, 2016).
Our study is among the first to integrate these two research traditions, which
largely have developed in isolation. Working at the intersection of these traditions, we
aim both to maximize internal validity and to open up the “black box” of teacher effects
by examining whether certain dimensions of teaching practice predict students’ attitudes
and behaviors. We refer to these relationships between teaching practice and student
outcomes as “teaching effects.” Specifically, we ask three research questions:
(1) To what extent do teachers impact students’ attitudes and behaviors in
class?
55
(2) To what extent do specific teaching practices impact students’ attitudes
and behaviors in class?
(3) Are teachers who are effective at raising test-score outcomes equally
effective at developing positive attitudes and behaviors in class?
To answer our research questions, we draw on a rich dataset from the National
Center for Teacher Effectiveness (NCTE) of upper-elementary teachers’ math instruction
that collected teacher-student links, observations of teaching practice on two established
observation instruments, students’ math performance on both high- and low-stakes tests,
and a student survey that captured their attitudes and behaviors in class. We used this
survey to construct our three primary outcomes: students’ self-reported self-efficacy in
math, happiness in class, and behavior in class. Although the specific attitudes and
behaviors we examine are limited to those available in NCTE data, they are important
outcomes of interest to researchers, policymakers, and parents (Borghans et al., 2008;
Chetty et al., 2011; Farrington et al., 2012). They also align with theories linking teachers
and teaching practice to outcomes beyond students’ core academic skills (Bandura,
Barbaranelli, Caprara, & Pastorelli, 1996; Pianta & Hamre, 2009), allowing us to test
these theories explicitly.
We find that upper-elementary teachers in our sample have substantive impacts
on students’ self-reported attitudes and behaviors in addition to their math performance.
We estimate that the variation in teacher effects on students’ self-efficacy in math and
behavior in class is of similar magnitude to the variation in teacher effects on math test
scores. Teacher effects on students’ happiness in class are even larger than those for test-
based outcomes. Further, these outcomes are predicted by teaching practices most
56
proximal to these measures, thus aligning with theory and providing important face and
construct validity to these measures. Specifically, teachers’ emotional support for
students is related both to their self-efficacy in math and their happiness in class.
Teachers’ classroom organization predicts students’ reports of their own behavior in
class. Errors in teachers’ presentation of mathematical content are negatively related to
students’ self-efficacy in math and happiness in class, as well as students’ math
performance. Finally, we find that teachers are not equally effective at improving all
outcomes. Compared to an unadjusted correlation between teacher effects on our two
math achievement tests of 0.64, the strongest unadjusted correlation between teacher
effects on students’ math achievement and effects on their attitudes or behavior is 0.19.
Together, these findings add further evidence for the multidimensional nature of
teaching and, thus, the need for researchers, policymakers, and practitioners to identify
strategies for improving these skills. In our conclusion, we discuss several instances in
which policymakers and practitioners may start to do so, including the design and
implementation of teacher evaluation systems, teacher recruitment policies, and strategic
teacher assignments. We situate this discussion within existing resource constraints and
challenges associated with outcome-based accountability, both of which make this a
complicated task.
2. Review of Related Research
Theories of teaching and learning have long emphasized the important role
teachers play in supporting students’ development in areas beyond their core academic
skill. For example, in their conceptualization of high-quality teaching, Pianta and Hamre
(2009) describe a set of emotional supports and organizational techniques that are equally
57
important to learners as teachers’ instructional methods. They posit that, by providing
“emotional support and a predictable, consistent, and safe environment” (p. 113),
teachers can help students become more self-reliant, motivated to learn, and willing to
take risks. Further, by modeling strong organizational and management structures,
teachers can help build students’ own ability to self-regulate. Content-specific views of
teaching also highlight the importance of teacher behaviors that develop students’
attitudes and behaviors in ways that may not directly impact test scores. In mathematics,
which is the focus of this paper, researchers and professional organizations have
advocated for teaching practices that emphasize critical thinking and problem solving
around authentic tasks (Lampert, 2001; National Council of Teachers of Mathematics
[NCTM], 1989, 2014). Understanding the considerable stresses that this content can
create for students, others have pointed to teachers’ equally important role of developing
students’ self-efficacy and decreasing their anxiety in math (Bandura et al., 1996; Usher
& Pajares, 2008; Wigfield & Meece, 1988).
In recent years, development and use of observation instruments that capture the
quality of teachers’ instruction have provided a unique opportunity to examine these
theories empirically. One instrument in particular, the Classroom Assessment Scoring
System (CLASS), is organized around “meaningful patterns of [teacher] behavior…tied
to underlying developmental processes [in students]” (Pianta & Hamre, 2009, p. 112).
Factor analyses of data collected by this instrument have identified several unique aspects
of teachers’ instruction: teachers’ social and emotional interactions with students, their
ability to organize and manage the classroom environment, and their instructional
supports in the delivery of content (Hafen et al., 2015; Hamre et al., 2013). A number of
58
studies from developers of the CLASS instrument and their colleagues have described
relationships between these dimensions and closely related student attitudes and
behaviors. For example, teachers’ interactions with students predicts students’ social
competence, engagement, and risk-taking; teachers’ classroom organization predicts
students’ engagement and behavior in class (Burchinal et al., 2008; Downer, Rimm-
Kaufman, & Pianta, 2007; Hamre, Hatfield, Pianta, & Jamil, 2014; Hamre & Pianta,
2001; Luckner & Pianta, 2011; Mashburn et al., 2008; Pianta, La Paro, Payne, Cox, &
Bradley, 2002). To date, these studies have focused predominantly on pre-kindergarten
settings (for a few exceptions, see Downer et al., 2007; Hamre & Pianta, 2001; Luckner
& Pianta, 2011). Further, none of the studies can rule out the possibility of omitted
variables bias – that is, that teachers who have strong interactions with students or
behavior management techniques might also engage in additional practices that are
responsible for higher student outcomes.
Additional content-specific observation instruments highlight several other
teaching competencies with links to students’ attitudes and behaviors. For example, in
this study we draw on the Mathematical Quality of Instruction (MQI) to capture math-
specific dimensions of teachers’ classroom practice. Factor analyses of data captured both
by this instrument and the CLASS identified two teaching skills in addition to those
described above: the cognitive demand of math activities that teachers provide to students
and the precision with which they deliver this content (Blazar et al., 2015). To date,
validity evidence for the MQI has focused on the relationship between these teaching
practices and students’ math test scores (Blazar, 2015; Kane & Staiger, 2012), which
makes sense given the theoretical link between teachers’ content knowledge, delivery of
59
this content in the classroom, and students’ own understanding of the content (Hill et al.,
2008). However, as noted above, professional organizations and researchers also describe
theoretical links between the sorts of teaching practices captured on the MQI and student
outcomes beyond test scores (e.g., critical thinking, self-efficacy in math; Bandura et al.,
1996; Lampert, 2001; NCTM, 1989, 2014; Usher & Pajares, 2008; Wigfield & Meece,
1988) that, to our knowledge, have not been tested.
In a separate line of research, several recent studies have borrowed from the
literature on teachers’ “value-added” to student test scores in order to document the
magnitude of teacher effects on a range of other outcomes. Consistent with the teacher
effectiveness literature more broadly, these studies attempt to isolate the unique effect of
teachers on non-tested outcomes from factors outside of teachers’ control (e.g., students’
prior achievement, race, gender, socioeconomic status) and to limit any bias due to non-
random sorting. In one of the first studies of this kind, Jennings and DiPrete (2010) used
the Early Childhood Longitudinal Study – Kindergarten Cohort (ECLS-K) to estimate the
role that teachers play in a composite measure of kindergarten and first-grade students’
social and behavioral outcomes. They found teacher effects on social and behavioral
outcomes that were even larger (0.35 standard deviations [sd]) than effects on academic
achievement. In a study of 35 middle school math teachers, Ruzek et al. (2014) found
small but meaningful teacher effects on motivation between 0.03 sd and 0.08 sd among
seventh graders. Kraft and Grace (2016) found teacher effects on students’ self-reported
measures of grit, growth mindset and effort in class ranging between 0.14 and 0.17 sd.
Additional studies identified teacher effects on observed school behaviors, including
60
absences, suspensions, grades, grade progression, and graduation (Backes & Hansen,
2015; Gershenson, 2016; Jackson, 2012; Koedel, 2008; Ladd & Sorensen, 2015).
To date, evidence is mixed on the extent to which teachers who improve test
scores also improve other outcomes. Four of the studies described above found weak
relationships between teacher effects on students’ academic performance and effects on
other outcome measures. Compared to a correlation of 0.42 between teacher effects on
math achievement versus effects on reading achievement, Jennings and DiPrete (2010)
found correlations of 0.15 between teacher effects on students’ social and behavioral
outcomes and effects on either math or reading achievement. Kraft and Grace (2016)
found correlations between teacher effects on achievement outcomes and multiple social-
emotional competencies were sometimes non-existent and never greater than 0.23.
Similarly, Gershenson (2016) and Jackson (2012) found weak or null relationships
between teacher effects on students’ academic performance and effects on observed
schools behaviors. However, correlations from two other studies were larger. Ruzek et al.
(2014) estimated a correlation of 0.50 between teacher effects on achievement versus
effects on students’ motivation in math class. Drawing on data from the MET project,
Mihaly, McCaffrey, Staiger, and Lockwood (2013) found a correlation of 0.57 between
middle school teacher effects on students’ self-reported effort versus effects on math test
scores.
Our analyses extend this body of research in several ways. First, we estimate
teacher effects on additional attitudes and behaviors captured by students in upper-
elementary grades. We also are able to leverage data that offer the unique combination of
a moderately sized sample of teachers and students with lagged survey measures. Second,
61
we utilize similar econometric approaches to test the relationship between teaching
practice and these same attitudes and behaviors. These analyses allow us to examine the
face and construct validity of our teacher effect estimates and the extent to which they
align with theory. Finally, we examine teacher and teaching effects in the context of
mathematics, which is essential for policy given a growing focus of education reform on
STEM education (Duncan, 2010; U.S. Department of Education, 2010).
3. Data and Sample
Beginning in the 2010-2011 school year, the NCTE engaged in a three-year data
collection process. Data came from participating fourth- and fifth-grade teachers (N =
310) in four anonymous, urban school districts on the East coast of the United States who
agreed to have their classes videotaped, complete a teacher questionnaire, and help
collect a set of student outcomes. Teachers were clustered within 52 schools, with an
average of six teachers per school. Teacher-student links were verified for all study
participants based on class rosters provided by teachers. While this study focused on
teachers’ math instruction, participants were generalists who taught all subject areas. This
is important, as it allowed us to consider the contribution of individual teachers to
students’ attitudes and behaviors that was not confounded by the influence of multiple
teachers in the same year. Despite having a non-random sample of teachers, evidence
from these same data indicated that teachers who participated in the study did not differ
on their effectiveness at improving students’ math test scores as those who did not
participate (Blazar, Litke, & Barmore, in press). We describe this sample in more depth
below.
3.1. Students’ Attitudes and Behaviors
62
As part of the expansive data collection effort, researchers administered a student
survey with items (N = 18) that were adapted from other large-scale surveys including the
TRIPOD survey project, the MET project, the National Assessment of Educational
Progress (NAEP), and the Trends in International Mathematics and Science Study
(TIMSS) (see Appendix Table 1 for a full list of items). Items were selected based on a
review of the research literature and identification of constructs thought most likely to be
influenced by upper-elementary teachers and math-specific teaching practices. Students
rated all items on a five-point Likert scale where 1 = Totally Untrue and 5 = Totally True.
We reverse coded items with negative valence in order to form composites with other
items.
Researchers and policymakers have raised several concerns about the use of self-
reported survey data to capture students’ underlying attitudes and behaviors. Students –
and elementary students in particular – may not be accurate reporters of their own
attitudes and behaviors. Their responses can be prone to “social desirability bias,” in
which students “provide answers that are desirable but not accurate” (Duckworth &
Yeager, 2015, p. 239). Different frames of reference also can bias responses. For
example, school-wide norms around behavior and effort may change the implicit
standards of comparison that students use to judge their own behavior and effort (West et
al., 2016). In response to these concerns, we describe validity evidence both from our
own and other studies as we present each of our student outcomes below. We also
attempted to minimize the potential threat posed by reference bias through our modeling
strategy. Specifically, we restricted comparisons to teachers and students in the same
63
school, which helps limit potential differences in reference groups and social norms
across schools that could confound our analyses.
We identified a parsimonious set of three outcome measures based on a
combination of theory and exploratory factor analyses (see Appendix Table 1).12 The first
outcome, which we call Self-Efficacy in Math (10 items), is a variation on well-known
constructs related to students’ effort, initiative, and perception that they can complete
tasks. In other datasets focused on elementary students, academic self-efficacy is
correlated with math achievement around 0.21 (Multon, Brown, & Lent, 1991), which is
quite close to the correlation we find between Self-Efficacy in Math and the two math test
scores (r = 0.25 and 0.22; see Table 1). These similarities provide important validity
evidence for our construct. The second related outcome measure is Happiness in Class (5
items), which was collected in the second and third years of the study. Exploratory factor
analyses suggested that these items clustered together with those from Self-Efficacy in
Math to form a single construct. However, post-hoc review of these items against the
psychology literature from which they were derived suggests that they can be divided
into a separate domain. As above, this measure is a school-specific version of well-
known scales that capture students’ affect and enjoyment (Diener, 2000). Both Self-
Efficacy in Math and Happiness in Class have relatively high internal consistency
reliabilities (0.76 and 0.82, respectively) that are similar to those of self-reported attitudes
12 We conducted factor analyses separately by year, given that there were fewer items in the first year. The NCTE project added additional items in subsequent years to help increase reliability. In the second and third years, each of the two factors has an eigenvalue above one, a conventionally used threshold for selecting factors (Kline, 1994). Even though the second factor consists of three items that also have loadings on the first factor between 0.35 and 0.48 – often taken as the minimum acceptable factor loading (Field, 2013; Kline, 1994) – this second factor explains roughly 20% more of the variation across teachers and, therefore, has strong support for a substantively separate construct (Field, 2013; Tabachnick & Fidell, 2001). In the first year of the study, the eigenvalue on this second factor is less strong (0.78), and the two items that load onto it also load onto the first factor.
64
and behaviors explored in other studies (Duckworth et al., 2007; John & Srivastava,
1999; Tsukayama et al., 2013). Further, self-reported measures of similar constructs have
been linked to long-term outcomes, including academic engagement and earnings in
adulthood, even conditioning on cognitive ability (King, McInerney, Ganotice, &
Villarosa, 2015; Lyubomirsky, King, & Diener, 2005).
The third and final construct consists of three items that were meant to hold
together and which we call Behavior in Class (internal consistency reliability is 0.74).
Higher scores reflect better, less disruptive behavior. Teacher reports of students’
classroom behavior have been found to relate to antisocial behaviors in adolescence,
criminal behavior in adulthood, and earnings (Chetty et al., 2011; Segal, 2013; Moffitt et
al., 2011; Tremblay et al., 1992). Our analysis differs from these other studies in the self-
reported nature of behavior outcomes. That said, other studies also drawing on
elementary school students found correlations between self-reported and either parent- or
teacher-reported measures of behavior that were similar in magnitude to correlations
between parent and teacher reports of student behavior (Achenbach, McConaughy, &
Howell, 1987; Goodman, 2001). Further, other studies have found correlations between
teacher-reported behavior of elementary school students and either reading or math
achievement (r = 0.22 to 0.28; Miles & Stipek, 2006; Tremblay et al., 1992) similar to the
correlation we find between students’ self-reported Behavior in Class and our two math
test scores (r = 0.24 and 0.26; see Table 1). Together, this evidence provides both
convergent and consequential validity evidence for this outcome measure. For all three of
these outcomes, we created final scales by averaging raw student responses across all
available items and standardizing measures to have a mean of zero and a standard
65
deviation of one within each school year.13 We standardized within years, given that, for
some measures, the set of survey items varied across years.
3.2. Student Demographic and Test Score Information
Student demographic and achievement data came from district administrative
records. Demographic data include gender, race/ethnicity, free- or reduced-price lunch
(FRPL) eligibility, limited English proficiency (LEP) status, and special education
(SPED) status. These records also included current- and prior-year test scores in math and
English Language Arts (ELA) on state assessments, which we standardized within
districts by grade, subject, and year using the entire sample of students in each district,
grade, subject, and year.
The project also administered a low-stakes mathematics assessment to all students
in the study. Validity evidence indicates internal consistency reliability of 0.82 or higher
for each form across grade levels and school years (Hickman, Fu, & Hill, 2012). We used
this assessment in addition to high-stakes tests given that teacher effects on two outcomes
that aim to capture similar underlying constructs (i.e., math achievement) provide a
unique point of comparison when examining the relationship between teacher effects on
student outcomes that are less closely related (i.e., math achievement versus attitudes and
behaviors). Indeed, students’ high- and low-stake math test scores are correlated more
strongly (r = 0.70) than any other two outcomes (see Table 1). Coding of items from both
the low- and high-stakes tests also identify a large degree of overlap in terms of content
coverage and cognitive demand (Lynch, Chin, & Blazar, 2015). All tests focused most on
numbers and operations (40% to 60%), followed by geometry (roughly 15%), and algebra
13 Depending on the outcome, between 4% and 8% of students were missing a subset of items from survey scales. In these instances, we created final scores by averaging across all available information.
66
(15% to 20%). By asking students to provide explanations of their thinking solve non-
routine problems such as identifying patterns, the low-stakes test also was similar to the
high-stakes tests in two districts; in the other two districts, items often asked students to
execute basic procedures.
3.3. Mathematics Lessons
Teachers’ mathematics lessons were captured over a three-year period, with an
average of three lessons per teacher per year.14 This number corresponds to
recommendations by Hill, Charalambous, and Kraft (2012) to achieve sufficiently high
levels of predictive reliability. Trained raters scored these lessons on two established
observational instruments, the CLASS and the MQI. Analyses of these same data show
that items cluster into four main factors (Blazar et al., 2015). The two dimensions from
the CLASS instrument capture general teaching practices: Emotional Support focuses on
teachers’ interactions with students and the emotional environment in the classroom, and
is thought to increase students’ social and emotional development; and Classroom
Organization focuses on behavior management and productivity of the lesson, and is
thought to improve students’ self-regulatory behaviors (Pianta & Hamre, 2009).15 The
two dimensions from the MQI capture mathematics-specific practices: Ambitious
Mathematics Instruction focuses on the complexity of the tasks that teachers provide to
14 As described by Blazar (2015), capture occurred with a three-camera, digital recording device and lasted between 45 and 60 minutes. Teachers were allowed to choose the dates for capture in advance and directed to select typical lessons and exclude days on which students were taking a test. Although it is possible that these lessons were unique from a teachers’ general instruction, teachers did not have any incentive to select lessons strategically as no rewards or sanctions were involved with data collection or analyses. In addition, analyses from the MET project indicate that teachers are ranked almost identically when they choose lessons themselves compared to when lessons are chosen for them (Ho & Kane, 2013). 15 Developers of the CLASS instrument identify a third dimension, Classroom Instructional Support. Factor analyses of data used in this study showed that items from this dimension formed a single construct with items from Emotional Support (Blazar et al., 2015). Given theoretical overlap between Classroom Instructional Support and dimensions from the MQI instrument, we excluded these items from our work and focused only on Classroom Emotional Support.
67
their students and their interactions around the content, thus corresponding to the set of
professional standards described by NCTM (1989, 2014) and many elements contained
within the Common Core State Standards for Mathematics (National Governors
Association Center for Best Practices, 2010); Mathematical Errors identifies any
mathematical errors or imprecisions the teacher introduces into the lesson. Both
dimensions from the MQI are linked to teachers’ mathematical knowledge for teaching
and, in turn, to students’ math achievement (Blazar, 2015; Hill et al., 2008; Hill,
Schilling, & Ball, 2004).
We estimate reliability for these metrics by calculating the amount of variance in
teacher scores that is attributable to the teacher (the intraclass correlation [ICC]), adjusted
for the modal number of lessons. These estimates are: 0.53, 0.63, 0.74, and 0.56 for
Emotional Support, Classroom Organization, Ambitious Mathematics Instruction, and
Mathematical Errors, respectively (see Table 2). Though some of these estimates are
lower than conventionally acceptable levels (0.7), they are consistent with those
generated from similar studies (Kane & Staiger, 2012). Correlations between dimensions
range from roughly 0 (between Emotional Support and Mathematical Errors) to 0.46
(between Emotional Support and Classroom Organization). Given that teachers
contributed different number of lessons to the project, which could lead to noise in these
observational measures, we utilized empirical Bayes estimation to shrink scores back to
the mean based on their precision (see below for more details). We standardized final
scores within the full sample of teachers to have a mean of zero and a standard deviation
of one.
3.4. Sample Restrictions
68
In choosing our analysis sample, we faced a tradeoff between precision and
internal validity. Including all possible teachers would maximize the precision of our
estimates. At the same time, we lacked critical data for some students and teachers that
could have been used to guard against potential sources of bias. Thus, we chose to make
two important restrictions to our original sample of teachers in order to strengthen the
internal validity of our findings. First, for all analyses predicting students’ attitudes and
behaviors, we only included fifth grade teachers who happened to have students who also
had been part of the project in the fourth grade and, therefore, took the survey in the prior
year. This group included between 51 and 111 teachers and between 548 and 1,529
students. For analyses predicting test score outcomes, we were able to maintain the full
sample of 310 teachers, whose 10,575 students all had test scores in the previous year.
Second, in analyses relating domains of teaching practice to student outcomes, we further
restricted our sample to teachers who themselves were part of the study for more than one
year, which allowed us to use out-of-year observation scores that were not confounded
with the specific set of students in the classroom. This reduced our analysis samples to
between 47 and 93 teachers and between 517 and 1,362 students when predicting
students’ attitudes and behaviors, and 196 teachers and 8,660 students when predicting
math test scores. We describe the rationale for these restrictions in more detail below.
In Table 3, we present descriptive statistics on teachers and their students in the
full sample (column 1), as well as those who were ever in any of our analyses predicting
students’ attitudes and behaviors (column 2).16 We find that teachers look relatively
16 Information on teachers’ background and knowledge were captured on a questionnaire administered in the fall of each year. Survey items included gender, race/ethnicity, years teaching math, route to certification, and amount of undergraduate or graduate coursework in math and math courses for teaching (scored on a Likert scale from 1 to 4). For simplicity, we averaged these last two items to form one
69
similar across these two analytic samples, with no statistically significant differences on
any observable characteristics.17 Sixteen percent of teachers were male and 65% were
white. Eight percent received their teaching certification through an alternative pathway.
The average number of years of teaching experience was roughly 10. Value-added scores
on state math tests were right around the mean for each district (0.01 sd). Blazar et al. (in
press) tested formally for differences in these value-added scores between project
teachers and the full population of teachers in each district and found none, lending
important external validity to our findings
We do observe some statistically significant differences between student
characteristics in the full sample versus the subsample. For example, the percentage of
students identified as limited English proficient was 20% in the full sample compared to
14% in the sample of students who ever were part of analyses drawing on our survey
measures. Average prior achievement scores were 0.10 sd and 0.09 sd in math and ELA
in the full sample, respectively, compared to 0.18 sd and 0.20 sd in the subsample.
Although variation in samples could result in dissimilar estimates across models, the
overall character of our findings is unlikely to be driven by these modest differences.
Further, students in our samples look similar to those in many urban districts in the
United States, where roughly 68% are eligible for free or reduced-price lunch, 14% are
classified as in need of special education services, and 16% are identified as limited
English proficient; roughly 31% are African American, 39% are Hispanic, and 28% are construct capturing teachers’ mathematics coursework. Further, the survey included a test of teachers’ mathematical content knowledge, with items from both the Mathematical Knowledge for Teaching assessment (Hill, Schilling, & Ball, 2004), which captures math-specific pedagogical knowledge, and the Massachusetts Test for Educator Licensure. Teacher scores were generated by IRTPro software and standardized in these models, with a reliability of 0.92. (For more information about these constructs, see Hill, Blazar, & Lynch, 2015.) 17 Descriptive statistics and formal comparisons of other samples show similar patterns and are available upon request.
70
white. Comparatively, in the country as a whole, a much higher percentage of students
are white (roughly 52%), and lower percentages are eligible for free or reduced-price
lunch (49%) or classified as limited English proficient (9%) (Council of the Great City
Schools, 2013).
4. Empirical Strategy
4.1. Estimating Teacher Effects on Students’ Attitudes and Behaviors
Like others who aim to examine the contribution of individual teachers to student
outcomes, we began by specifying an education production function model of each
outcome for student i in district d, school s, grade g, class c with teacher j at time t:
(1) 𝑂𝑈𝑇𝐶𝑂𝑀𝐸!"#$%&' = 𝛼𝑓(𝐴!"!!)+ 𝜋𝑋!" + 𝜑𝑋!"! + 𝜏!"# + (𝜇! + 𝛿!" + 𝜀!"#$%&')
𝑂𝑈𝑇𝐶𝑂𝑀𝐸!"#$%&' is used interchangeably for both math test scores and students’
attitudes and behaviors, which we modeled in separate equations as a cubic function of
students’ prior achievement, 𝐴!"!!, in both math and ELA on the high-stakes district
tests18; demographic characteristics, 𝑋!", including gender, race, FRPL eligibility, SPED
status, and LEP status; these same test-score variables and demographic characteristics
averaged to the class level, 𝑋!"! ; and district-by-grade-by-year fixed effects, 𝜏!"#, that
account for scaling of high-stakes test scores at this level. The error structure consists of
both teacher- and class-level random effects, 𝜇! and 𝛿!", respectively, and a student-
specific error term, 𝜀!"#$%&'. Given our focus on elementary teachers, over 97% of
18 We controlled for prior-year scores only on the high-stakes assessments and not on the low-stakes assessment for three reasons. First, including prior low-stakes test scores would reduce our full sample by more than 2,200 students. This is because the assessment was not given to students in District 4 in the first year of the study (N = 1,826 students). Further, an additional 413 students were missing fall test scores given that they were not present in class on the day it was administered. Second, prior-year scores on the high- and low-stakes test are correlated at 0.71, suggesting that including both would not help to explain substantively more variation in our outcomes. Third, sorting of students to teachers is most likely to occur based on student performance on the high-stakes assessments since it was readily observable to schools; achievement on the low-stakes test was not.
71
teachers in our sample worked with just one set of students in a given year. Thus, class
effects are estimated by observing teachers in multiple years and are analogous to
teacher-by-year effects.
The key identifying assumption of this model is that estimates are not biased by
non-random sorting of students to teachers. Recent experimental (Kane, McCaffrey,
Miller, & Staiger, 2013) and quasi-experimental (Chetty et al., 2014) analyses provide
strong empirical support for this claim when student achievement is the outcome of
interest. However, much less is known about bias and sorting mechanisms when other
outcomes are used. For example, it is quite possible that students were sorted to teachers
based on their classroom behavior in ways that were unrelated to their prior achievement.
To address this possibility, we made two modifications to equation (2). First, we included
school fixed effects, 𝜎!, to account for sorting of students and teachers across schools.
This means that estimates rely only on between-school variation, which has been
common practice in the research literature when estimating teacher effects on student
achievement. In their review of this literature, Hanushek and Rivkin (2010) propose
ignoring the between-school component because it is “surprisingly small” and because
including this component leads to “potential sorting, testing, and other interpretative
problems” (p. 268). Other recent studies estimating teacher effects on student outcomes
beyond test scores have used this same approach (Backes & Hansen, 2015; Gershenson,
2016; Jackson, 2012; Ladd & Sorensen, 2015). Another important benefit of within-
school comparisons is that it minimizes the possibility of reference bias in our self-
reported measures (Duckworth & Yeager, 2015; West et al., 2016). As a second
modification for models that predict each of our three student survey measures, we
72
included 𝑂𝑈𝑇𝐶𝑂𝑀𝐸!"!! on the right-hand side of the equation in addition to prior
achievement – that is, when predicting students’ Behavior in Class, we controlled for
students’ self-reported Behavior in Class in the prior year.19 This strategy helps account
for within-school sorting on factors other than prior achievement.
Using equation (1), we estimated the variance of 𝜇!, which is the stable
component of teacher effects. We report the standard deviation of these estimates across
outcomes. This parameter captures the magnitude of the variability of teacher effects.
With the exception of teacher effects on students’ Happiness in Class, where survey
items were not available in the first year of the study, we included 𝛿!" in order to separate
out the time-varying portion of teacher effects, combined with peer effects and any other
class-level shocks. The fact that we are able to separate class effects from teacher effects
is an important extension of prior studies examining teacher effects on outcomes beyond
test scores, many of which only observed teachers at one point in time. Because 𝜇! is
measured imprecisely given typical class sizes, unadjusted estimates would overstate the
true variation in teacher effects. Thus, we utilized empirical Bayes estimation to shrink
each score for teacher j back toward the mean based on its precision (Raudenbush &
Bryk, 2002), where precision is a function of the number of students attributed to each
teacher or class. Like others interested in the variance of teacher effects (e.g., Chetty et al.,
19 It is important to note that adding prior survey responses to the education production function is not entirely analogous to doing so with prior achievement scores. While achievement outcomes have roughly the same reference group across administrations, the surveys do not. This is because survey items often asked about students’ experiences “in this class.” All three Behavior in Class items and all five Happiness in Class items included this or similar language, as did five of the 10 items from Self-Efficacy in Math. That said, moderate year-to-year correlations of 0.39, 0.38, and 0.53 for Self-Efficacy in Math, Happiness in Class, and Behavior in Class, respectively, suggest that these items do serve as important controls. Comparatively, year-to-year correlations for the high- and low-stakes tests are 0.75 and 0.77.
73
2011), we specified this parameter as a random effect, which provides unbiased model-
based estimates of the true population variance of teacher effects.20
4.2. Estimating Teaching Effects on Students’ Attitudes and Behaviors
We examined the contribution of teachers’ classroom practices to our set of
student outcomes by estimating a variation of equation (1):
(2) 𝑂𝑈𝑇𝐶𝑂𝑀𝐸!"#$%&' = 𝛽𝑂𝐵𝑆𝐸𝑅𝑉𝐴𝑇𝐼𝑂𝑁!",!! + 𝛼𝑓(𝐴!"!!)+ 𝛾𝑂𝑈𝑇𝐶𝑂𝑀𝐸!"!! +
𝜋𝑋!" + 𝜑𝑋!"! + 𝜎! + 𝜏!"# + (𝜇! + 𝛿!" + 𝜀!"#$%&')
This multi-level model includes the same set of control variables as above in order to
account for the non-random sorting of students to teachers and for factors beyond
teachers’ control that might influence each of our outcomes. We further included a vector
of their teacher j’s observation scores, 𝑂𝐵𝑆𝐸𝑅𝑉𝐴𝑇𝐼𝑂𝑁!",!!. The coefficients on these
variables are our main parameters of interest and can be interpreted as the change in
standard deviation units for each outcome associated with exposure to teaching practice
one standard deviation above the mean.21
One concern when relating observation scores to student survey outcomes is that
they may capture the same behaviors. For example, teachers may receive credit on the
Classroom Organization domain when their students demonstrate orderly behavior. In
this case, we would have the same observed behaviors on both the left and right side of
20 We estimated these variance components using restricted maximum likelihood estimation because full maximum likelihood estimates tend to be biased downward (Harville, 1977; Raudenbush & Bryk, 2002) and may be particularly problematic in our smaller subsample of students and teachers who had prior-year measures of their attitudes and behaviors. 21 Models were fit using full maximum likelihood, given our focus in this analysis on the fixed rather than the stochastic portion of the model; full maximum likelihood allows us to compare estimates from the fixed portion of the equation between nested models (Harville, 1977; Raudenbush & Bryk, 2002).
74
our equation relating instructional quality to student outcomes, which would inflate our
teaching effect estimates. A related concern is that the specific students in the classroom
may influence teachers’ instructional quality (Hill, Blazar, & Lynch, 2015; Steinberg &
Garrett, in press; Whitehurst, Chingos, & Lindquist, 2014).22 While the direction of bias
is not as clear here – as either lesser- or higher-quality teachers could be sorted to harder
to educate classrooms – this possibility also could lead to incorrect estimates. To avoid
these sources of bias, we only included lessons captured in years other than those in
which student outcomes were measured, denoted by –t in the subscript of
𝑂𝐵𝑆𝐸𝑅𝑉𝐴𝑇𝐼𝑂𝑁!",!!. As noted above, these are predicted estimates that aim to reduce
measurement error in our observation measures.23 To the extent that instructional quality
varies across years, using out-of-year observation scores creates a lower-bound estimate
of the true relationship between instructional quality and student outcomes. We consider
this an important tradeoff to minimize potential bias.
An additional concern for identification is the endogeneity of observed classroom
quality. Our preferred analytic approach attempted to account for potential sources of
bias by conditioning estimates of the relationship between one dimension of teaching
22 In our dataset, observable classroom characteristics do not appear to influence teachers’ observation ratings. Correlations between observation scores adjusted for classroom characteristics, including gender, race, free or reduced-price lunch eligibility, special education status, limited English proficiency, and prior achievement in both math and English language arts – and unadjusted scores range from 0.93 (for Classroom Organization) to 0.97 (for Mathematical Errors). Further, patterns of results in our teaching effect estimates are almost identical when we use adjusted versus unadjusted scores. Below, we present findings with unadjusted scores. 23 To estimate these scores, we specified the following hierarchical linear model separately for each school year:
𝑂𝐵𝑆𝐸𝑅𝑉𝐴𝑇𝐼𝑂𝑁!",!! = 𝛾! + 𝜀!"#
The outcome is the observation score for lesson l from teacher j in years other than t; 𝛾! is a random effect for each teacher, and 𝜀!"# is the residual. For each domain of teaching practice and school year, we utilized standardized estimates of the teacher-level residual as each teacher’s observation score in that year. Thus, scores vary across time. In the main text, we refer to these teacher-level residual as 𝑂𝐵𝑆𝐸𝑅𝑉𝐴𝑇𝐼𝑂𝑁!",!! rather than 𝛾! for ease of interpretation for readers.
75
practice and student outcomes on the three other dimensions.24 An important caveat here
is that we only observed teachers’ instruction during math lessons and, thus, may not
capture important pedagogical practices teachers used with these students when teaching
other subjects. Including dimensions from the CLASS instrument, which are meant to
capture instructional quality across subject areas (Pianta & Hamre, 2009), helps account
for some of this concern. However, given that we were not able to isolate one dimension
of teaching quality from all others, we consider this approach as providing suggestive
rather than conclusive evidence on the underlying causal relationship between teaching
practice and students’ attitudes and behaviors.
4.3. Estimating the Relationship Between Teacher Effects Across Multiple Student
Outcomes
In our third and final set of analyses, we examined whether teachers who are
effective at raising math test scores are equally effective at developing students’ attitudes
and behaviors. To do so, we drew on equation (1) to estimate 𝜇! for each outcome and
teacher j. These estimates capture the residual variation in each outcome attributable to
each teacher, or their “value-added” score. Then, we generated a correlation matrix of
these teacher effect estimates. For consistency, we continued to specify this parameter as
a random effect rather than fixed effects.
24 For our main analyses, we chose not to control for other observable characteristics of teachers (e.g., teaching experience, math content knowledge, certification pathway, education), as these factors may be tied directly to teachers’ practices. From a policy perspective, we are less interested in where and how teachers picked up good practices, so long as they have them. That said, in separate analyses (available upon request), we re-ran models controlling for the four background characteristics listed above and found that patterns of results were unchanged. None of these teacher characteristics predicted student outcomes when also controlling for dimensions of teaching quality.
76
Despite attempts to increase the precision of these estimates through empirical
Bayes estimation, estimates of individual teacher effects are measured with error that will
attenuate these correlations (Spearman, 1904). Thus, if we were to find weak to moderate
correlations between different measures of teacher effectiveness, this could identify
multidimensionality or could result from measurement challenges, including the validity
and reliability of individual constructs (Chin & Goldhaber, 2015). For example, prior
research suggests that different tests of students’ academic performance can lead to
differences in teacher rankings, even when those tests measure similar underlying
constructs (Lockwood et al., 2007; Papay, 2011). To address this concern, we focus our
discussion on relative rankings in correlations between teacher effect estimates rather
than their absolute magnitudes. Specifically, we examine how correlations between
teacher effects on two closely related student outcomes (e.g., two math achievement
tests) compare with correlations between teacher effects on outcomes that aim to capture
different underlying constructs. In light of research highlighted above, we did not expect
the correlation between teacher effects on high- and low-stakes math tests to be 1 (or, for
that matter, close to 1). However, we hypothesized that these relationships should be
stronger than the relationship between teacher effects on students’ math performance and
effects on their attitudes and behaviors. We also present disattenuated correlations in an
online appendix to confirm that the conclusions we draw from these comparisons are not
a product of differential measurement properties across outcomes.
5. Results
5.1. Do Teachers Impact Students’ Attitudes and Behaviors?
77
We begin by presenting results of the magnitude of teacher effects in Table 4.
Here, we observe sizable teacher effects on students’ attitudes and behaviors that are
similar to teacher effects on students’ academic performance. Starting first with teacher
effects on students’ academic performance, we find that a one standard deviation
difference in teacher effectiveness is equivalent to a 0.17 sd or 0.18 sd difference in
students’ math achievement. In other words, relative to an average teacher, teachers at the
84th percentile of the distribution of effectiveness move the medium student up to roughly
the 57th percentile of math achievement. Notably, these findings are similar to those from
other studies that also estimate within-school teacher effects in large administrative
datasets (Hanushek & Rivkin, 2010). This suggests that our use of school fixed effects
with a more limited number of teachers observed within a given school does not appear
to overly restrict our identifying variation. Estimated teacher effects on students’ self-
reported Self-Efficacy in Math and Behavior in Class are 0.14 sd and 0.15 sd,
respectively. The largest teacher effects we observe are on students’ Happiness in Class,
of 0.31 sd. Given that we do not have multiple years of data to separate out class effects
for this measure, we interpret this estimate as the upward bound of true teacher effects on
Happiness in Class. Rescaling this estimate by the ratio of teacher effects with and
without class effects for Self-Efficacy in Math (0.14/0.19 = 0.74) produces an estimate of
stable teacher effects on Happiness in Class of 0.23 sd, still larger than effects for other
outcomes.25
5.2. Do Specific Teaching Practices Impact Students’ Attitudes and Behaviors?
25 We find that teacher effects from models that exclude class effects are between 13% to 36% larger in magnitude than effects from models that include these class effects. This suggests that analyses that do not take into account classroom level shocks likely produce upwardly biased estimates of stable teacher effects.
78
Next, we examine whether certain characteristics of teachers’ instructional
practice help explain the sizable teacher effects described above (see Table 5). We
present unconditional estimates in Panel A, where the relationship between one
dimension of teaching practice and student outcomes is estimated without controlling for
the other three dimensions. Thus, cells contain estimates from separate regression
models. In Panel B, we present conditional estimates, where all four dimensions of
teaching quality are included in the same regression model. Here, columns contain
estimates from separate regression models. In all models, we control for student and class
characteristics, and school fixed effects. We present all estimates as standardized effect
sizes, which allows us to make comparisons across models and outcome measures.
Unconditional and conditional estimates generally are quite similar. Therefore, we focus
our discussion on our preferred conditional estimates.
We find that students’ attitudes and behaviors are predicted by both general and
content-specific teaching practices in ways that generally align with theory. For example,
teachers’ Emotional Support is positively associated with the two closely related student
constructs, Self-Efficacy in Math and Happiness in Class. Specifically, a one standard
deviation increase in teachers’ Emotional Support is associated with a 0.14 sd increase in
students’ Self-Efficacy in Math and a 0.37 sd increase in students’ Happiness in Class.
These finding makes sense given that Emotional Support captures teacher behaviors such
as their sensitivity to students, regard for students’ perspective, and the extent to which
they create a positive climate in the classroom. We also find that Classroom
Organization, which captures teachers’ behavior management skills and productivity in
delivering content, is positively related to students’ reports of their own Behavior in
79
Class (0.08 sd). This suggests that teachers who create an orderly classroom likely create
a model for students’ own ability to self-regulate. Despite this positive relationship, we
find that Classroom Organization is negatively associated with Happiness in Class (-0.23
sd), suggesting that classrooms that are overly focused on routines and management are
negatively related to students’ enjoyment in class. At the same time, this is one instance
where our estimate is sensitive to whether or not other teaching characteristics are
included in the model. When we estimate the relationship between teachers’ Classroom
Organization and students’ Happiness in Class without controlling for the three other
dimensions of teaching quality, this estimate is roughly 0 sd and is not statistically
significant. Similarly, in our unconditional models, Ambitious Mathematics Instruction is
positively related to students’ Self-Efficacy in Math. However, this estimate is much
smaller and no longer statistically significant once we control for other teaching
practices, suggesting that other related teaching practices likely are responsible for higher
outcomes. Finally, we find that the degree to which teachers commit Mathematical
Errors is negatively related to students’ Self-Efficacy in Math (-0.09 sd) and Happiness in
Class (-0.18 sd). These findings illuminate how a teacher’s ability to present mathematics
with clarity and without serious mistakes is related to their students’ perceptions that they
can complete math tasks and their enjoyment in class.26
Comparatively, when predicting scores on both math tests, we only find one
marginally significant relationship – between Mathematical Errors and the high-stakes
math test (-0.02 sd). For two other dimensions of teaching quality, Emotional Support
26 When we adjusted p-values for estimates presented in Table 5 to account for multiple hypothesis testing using both the Šidák and Bonferroni algorithms (Dunn, 1961; Šidák, 1967), relationships between Emotional Support and both Self-Efficacy in Math and Happiness in Class, as well as between Mathematical Errors and Self-Efficacy in Math remained statistically significant.
80
and Ambitious Mathematics Instruction, estimates are signed in the way we would expect
and with similar magnitudes, though they are not statistically significant. Given the
consistency of estimates across the two math tests and our restricted sample size, it is
possible that non-significant results are due to limited statistical power.27 At the same
time, even if true relationships exist between these teaching practices and students’ math
test scores, they are likely weaker than those between teaching practices and students’
attitudes and behaviors. For example, we find that the 95% confidence intervals relating
Classroom Emotional Support to Self-Efficacy in Math [0.068, 0.202] and Happiness in
Class [0.162, 0.544] do not overlap with the 95% confidence intervals for any of the
point estimates predicting math test scores. This suggests that, still, very little is known
about how specific classroom teaching practices are related to student achievement in
math.
5.3. Are Teachers Equally Effective at Raising Different Student Outcomes?
In Table 6, we present correlations between teacher effects on each of our student
outcomes. The fact that teacher effects are measured with error makes it difficult to
estimate the precise magnitude of these correlations. Instead, we describe relative
differences in correlations, focusing on the extent to which teacher effects within
outcome type – i.e., teacher effects on the two math achievement tests or effects on
students’ attitudes and behaviors – are similar or different from correlations between
teacher effects across outcome type. We illustrate these differences in Figure 1, where 27 In similar analyses in a subset of the NCTE data, Blazar (2015) did find a statistically significant relationship between Ambitious Mathematics Instruction and the low-stakes math test of 0.11 sd. The 95% confidence interval around that point estimate overlaps with the 95% confidence interval relating Ambitious Mathematics Instruction to the low-stakes math test in this analysis. Estimates of the relationship between the other three domains of teaching practice and low-stakes math test scores were of smaller magnitude and not statistically significant. Differences between the two studies likely emerge from the fact that we drew on a larger sample with an additional year of data, as well as slight modifications to our identification strategy.
81
Panel A presents scatter plots of these relationships between teacher effects within
outcome type and Panel B does the same across outcome type. Recognizing that not all of
our survey outcomes are meant to capture the same underlying construct, we also
describe relative differences in correlations between teacher effects on these different
measures. We also note that even an extremely conservative adjustment that scales
correlations by the inverse of the square root reliabilities lead to a similar overall pattern
of results (see Appendix Table 2 for reliabilities and Appendix Table 3 for disattenuated
correlations).28
Examining the correlations of teacher effect estimates reveals that individual
teachers vary considerably in their ability to impact different students outcomes. As
hypothesized, we find the strongest correlations between teacher effects within outcome
type. Similar to Corcoran, Jennings, and Beveridge (2012), we estimate a correlation of
0.64 between teacher effects on our high- and low-stakes math achievement tests. We
28 We estimated the reliability of our teacher effects estimate through the signal-to-noise ratio:
𝑉𝑎𝑟(𝜇!)
𝑉𝑎𝑟(𝜇!) +!"!!!
!!!
!
The numerator is the observed variance in the teacher effect, or the squared value of the standard deviation of 𝜇!, which is our main parameter of interest. The denominator is an estimate of the true teacher-level variance, which we approximate as the sum of the estimated variance in the teacher effect and the average squared standard error of individual teacher effect estimates. The number of teachers in the sample is detonated by n, and 𝑠𝑒! is the standard error of the teacher effect for teacher j. See McCaffrey, Sass, Lockwood, & Mihaly (2009) for a similar approach. In Appendix Table 2, we calculate two sets of estimates. The first calculates the precision of our main teacher effect estimates, which we use to calculate disattenuated correlations in Appendix Table 3. Given that these teacher effect estimates are derived from models with slightly different samples, which could impact reliability, we also calculated these estimates of precision in a balanced sample of teachers and students who had complete data on all measures (column 2; N = 51 teachers and 548 students). Here, we found that precision was quite comparable across teacher effects, ranging from 0.50 (for teacher effects on Self Efficacy in Math) to 0.56 (for teacher effects on Happiness in Class).
In Appendix Table 3, relative differences in disattenuated correlations are similar to those presented above. We still observe much stronger relationships between teacher effects on the two math tests and between teacher effects on Behavior in Class and Self-Efficacy in Math than between other outcome measures. In some cases, these disattenuated correlations are close to 1, which we argue are unlikely to be the true relationships in the population. Overcorrections likely are driven by moderate reliabilities and moderate sample sizes (Zimmerman & Williams, 1997).
82
also observe a strong correlation of 0.49 between teacher effects on two of the student
survey measures, students’ Behavior in Class and Self-Efficacy in Math. Comparatively,
the correlations between teacher effects across outcome type are much weaker.
Examining the scatter plots in Figure 1, we observe much more dispersion around the
best-fit line in Panel B than in Panel A. The strongest relationship we observe across
outcome types is between teacher effects on the low-stakes math test and effects on Self-
Efficacy in Math (r = 0.19). The lower bound of the 95% confidence interval around the
correlation between teacher effects on the two achievement measures [0.56, 0.72] does
not overlap with the 95% confidence interval of the correlation between teacher effects
on the low-stakes math test and effects on Self-Efficacy in Math [-0.01, 0.39], indicating
that these two correlations are substantively and statistically significantly different from
each other. Using this same approach, we also can distinguish the correlation describing
the relationship between teacher effects on the two math tests from all other correlations
relating teacher effects on test scores to effects on students’ attitudes and behaviors. We
caution against placing too much emphasis on the negative correlations between teacher
effects on test scores and effects on Happiness in Class (r = -0.09 and -0.21 for the high-
and low-stakes tests, respectively). Given limited precision of this relationship, we cannot
reject the null hypothesis of no relationship or rule out weak, positive or negative
correlations among these measures.
Although it would be useful to make comparisons between teacher effects on
different measures of students’ attitudes and behaviors, error in these estimates makes us
less confident in our ability to do so. At face value, we find correlations between teacher
effects on Happiness in Class and effects on the two other survey measures (r = 0.26 for
83
Self-Efficacy in Math and 0.21 for Behavior in Class) that are weaker than the correlation
between teacher effects on Self-Efficacy in Math and effects on Behavior in Class
described above (r = 0.49). One possible interpretation of these findings is that teachers
who improve students’ Happiness in Class are not equally effective at raising other
attitudes and behaviors. For example, teachers might make students happy in class in
unconstructive ways that do not also benefit their self-efficacy or behavior. At the same
time, these correlations between teacher effects on Happiness in Class and the other two
survey measures have large confidence intervals, likely due to imprecision in our
estimate of teacher effects on Happiness in Class. Thus, we are not able to distinguish
either correlation from the correlation between teacher effects on Behavior in Class and
effects on Self-Efficacy in Math.
6. Discussion and Conclusion
The teacher effectiveness literature has profoundly shaped education policy over
the last decade and has served as the catalyst for sweeping reforms around teacher
recruitment, evaluation, development, and retention. However, by and large, this
literature has focused on teachers’ contribution to students’ test scores. Even research
studies such as the MET project and new teacher evaluation systems that focus on
“multiple measures” of teacher effectiveness (Center on Great Teachers and Leaders,
2013; Kane et al., 2013) generally attempt to validate other measures, such as
observations of teaching practice, by examining their relationship to students’ academic
performance.
Our study extends an emerging body of research examining the effect of teachers
on student outcomes beyond test scores. In many ways, our findings align with
84
conclusions drawn from previous studies that also identify teacher effects on students’
attitudes and behaviors (Jennings & DiPrete, 2010; Kraft & Grace, 2016; Ruzek et al.,
2014), as well as weak relationships between different measures of teacher effectiveness
(Gershenson, 2016; Jackson, 2012; Jennings & DiPrete, 2010; Kane & Staiger, 2012).
Although our study focuses on a small to moderate sample of teachers, our rich dataset
builds on prior work in several ways. To our knowledge, this study is the first to identify
teacher effects on measures of students’ self-efficacy in math and happiness in class, as
well as on a self-reported measure of student behavior. By interpreting teacher effects
alongside teaching effects, we also provide strong face and construct validity for our
teacher effect estimates. Specifically, we find that improvements in upper-elementary
students’ attitudes and behaviors are predicted by general teaching practices in ways that
align with hypotheses laid out by instrument developers (Pianta & Hamre, 2009).
Findings linking errors in teachers’ presentation of math content to students’ self-efficacy
in math, in addition to their math performance, also are consistent with theory (Bandura
et al., 1996). Finally, the broad data collection effort from NCTE allows us to examine
relative differences in relationships between measures of teacher effectiveness, thus
avoiding some concerns about how best to interpret correlations that differ substantively
across studies (Chin & Goldhaber, 2015). Indeed, correlations between teacher effects on
student outcomes that aim to capture different underlying constructs (e.g., math test
scores and behavior in class) are weaker than correlations between teacher effects on two
outcomes that are much more closely related (e.g., math achievement).
Our findings can help inform policy and practice in several key ways. Beginning
first with policy, our evidence may generate interest among some policymakers to
85
incorporate teacher effect estimates on students’ attitudes and behaviors into high-stakes
personnel decisions. This may be particularly true after passage of the Every Student
Succeeds Act (ESSA) in December of 2015, which mandates that states select one
nonacademic indicator with which to assess students’ success in school (ESSA, 2015).
Our findings suggest that teachers can and do help develop attitudes and behaviors
among their students that are important for success in life. Including measures of
students’ attitudes and behaviors in accountability or evaluation systems, even with very
small associated weights, could serve as a strong signal that schools and educators should
value and attend to developing these skills in the classroom. But, like other researchers
(Duckworth & Yeager, 2015), we caution against a rush to incorporate these measures
into high-stakes decisions. Despite growing attention to these metrics, the science behind
developing measures of students’ attitudes and behaviors is relatively new compared to
the long history of developing valid and reliable assessment of cognitive aptitude and
content knowledge. Most existing measures, including those used in this study, were
developed for research purposes rather than large-scale testing with repeated
administrations. In particular, open questions remain about whether reference bias
substantially distorts comparisons across schools and the susceptibility of these measures
to “survey” coaching when high-stakes incentives are attached. Such incentives likely
would render teacher assessments of their students’ attitudes and behaviors inappropriate.
Thus, there is a clear need for additional research on the reliability and validity of
students’ attitudes and behaviors, as well as the development of objective performance
measures that can capture these outcomes.
86
In light of these concerns, we make three specific recommendations for the design
and implementation of teacher performance evaluation. First, it is possible that measures
of teachers’ effectiveness at improving students’ attitudes and behaviors may be suitable
for low-stakes decision-making in schools. For example, these metrics could be used for
early intervention efforts that diagnose areas of weakness and connect teachers to
targeted professional development, which many argue should be the primary focus of
teacher evaluation (Darling-Hammond, 2013; Hill & Grossman, 2013; Papay, 2012).
Second, an alternative approach to incorporating teacher effects on students’ attitudes and
behaviors into teacher evaluation may be through observations of teaching practice. Our
findings suggest that specific domains captured on classroom observation instruments
(i.e., Emotional Support and Classroom Organization from the CLASS and
Mathematical Errors from the MQI) may serve as indirect proxy measures of
improvements in students’ attitudes and behaviors. One benefit of this approach is that
districts commonly collect related measures as part of teacher evaluation systems (Center
on Great Teachers and Leaders, 2013), and such measures are not restricted to teachers
who work in tested grades and subjects. Third, performance evaluations – whether
formative or summative – should avoid placing teachers into a single performance
category whenever possible. Although many researchers and policymakers argue for
creating a single weighted composite of different measures of teachers’ effectiveness
(Center on Great Teachers and Leaders, 2013; Kane et al., 2013), doing so likely
oversimplifies the complex nature of teaching. For example, a teacher who excels at
developing students’ core math content knowledge but struggles to promote joy in
learning or students’ own self-efficacy in math is a very different teacher than one who is
87
middling across all three measures. Looking at these two teachers’ composite scores
would suggest they are similarly effective. A single overall evaluation score can facilitate
a systematized process for making binary decisions such as whether to grant teachers
tenure, but the decisions informed by teacher evaluations should reflect the complexity of
classroom practice.
Next, we consider the implications of our findings for the teaching profession
more broadly. While our findings lend empirical support to research on the
multidimensional nature of teaching (Cohen, 2011; Lampert, 2001; Pianta & Hamre,
2009), we also identify tensions inherent in this sort of complexity and potential tradeoffs
between some teaching practices. In our primary analyses, we find that high-quality
instruction around classroom organization is positively related to students’ self-reported
behavior in class but negatively related to their happiness in class. Our results here are
not conclusive, as the negative relationship between classroom organization and students’
happiness in class is sensitive to model specification. However, if there indeed is a causal
relationship, further research will be critical to gain a better understanding of how
teachers can develop classroom environments that engender both constructive classroom
behavior and students’ happiness in class. Our findings also demonstrate a need to
integrate general and more content-specific perspectives on teaching, a historical
challenge in both research and practice (Grossman & McDonald, 2008; Hamre et al.,
2013). We find that both math-specific and general teaching practices predict a range of
student outcomes. Yet, particularly at the elementary level, teachers’ math training often
is overlooked. Prospective elementary teachers often gain licensure without taking
college-level math classes; in many states, they do not need to pass the math sub-section
88
of their licensure exam in order to earn a passing grade overall (Epstein & Miller, 2011).
Striking the right balance between general and content-specific teaching practices is not a
trivial task, but it likely is a necessary one.
Finally, we see opportunities to maximize students’ exposure to the range of
teaching skill we examine through strategic teacher assignments. Creating a teacher
workforce skilled in all or most areas of teaching practice is, in our view, the ultimate
goal. However, this goal likely will require substantial changes to teacher preparation
programs and curriculum materials, as well as new policies around teacher recruitment,
evaluation, and development. In middle and high schools, content-area specialization or
departmentalization often is used to ensure that students have access to teachers with
skills in distinct content areas. Some, including the National Association of Elementary
School Principals, also see this as a viable strategy at the elementary level (Chan &
Jarman, 2004). Similar approaches may be taken to expose students to a collection of
teachers who together can develop a range of academic skills, attitudes and behaviors.
For example, when configuring grade-level teams, principals may pair a math teacher
who excels in her ability to improve students’ behavior with an ELA or reading teacher
who excels in his ability to improve students’ happiness and engagement. Viewing
teachers as complements to each other may help maximize outcomes within existing
resource constraints.
For decades, efforts to improve the quality of the teacher workforce have focused
on teachers’ abilities to raise students’ academic achievement. Our work further
illustrates the potential and importance of expanding this focus to include teachers’
89
abilities to promote students’ attitudes and behaviors that are equally important for
students’ long-term success.
90
Works Cited
Achenbach, T. M., McConaughy, S. H., & Howell, C. T. (1987). Child/adolescent
behavioral and emotional problems: implications of cross-informant correlations
for situational specificity. Psychological Bulletin, 101(2), 213.
Backes, B., & Hansen, M. (2015). Teach for America impact estimates on nontested
student outcomes. Working Paper 146. Washington, D C: National Center for
Analysis of Longitudinal in Education Research. Retrieved from
http://www.caldercenter.org/sites/default/files/WP%20146.pdf
Bandura, A., Barbaranelli, C., Caprara, G. V., & Pastorelli, C. (1996). Multifaceted
impact of self-efficacy beliefs on academic functioning. Child Development, 1206-
1222.
Baron, J. (1982). Personality and intelligence. In R. J. Sternberg (Ed.), Handbook of
human intelligence (pp. 308-351). New York: Cambridge University Press.
Blazar, D. (2015). Effective teaching in elementary mathematics: Identifying classroom
practices that support student achievement. Economics of Education Review, 48, 16-
29.
Blazar, D., Braslow, D., Charalambous, C. Y., & Hill, H. C. (2015). Attending to general
and content-specific dimensions of teaching: Exploring factors across two
observation instruments. Working paper. Harvard University. Retrieved from
http://scholar.harvard.edu/files/david_blazar/files/blazar_et_al_attending_to_genera
l_and_content_specific_dimensions_of_teaching_0.pdf
91
Blazar, D., Litke, E., & Barmore, J. (In Press). What does it mean to be ranked a “high”
or “low” value-added teacher? Observing differences in instructional quality across
districts. American Educational Research Journal.
Borghans, L., Duckworth, A. L., Heckman, J. J., & Ter Weel, B. (2008). The economics
and psychology of personality traits. Journal of Human Resources, 43(4), 972-
1059.
Burchinal, M., Howes, C., Pianta, R., Bryant, D., Early, D., Clifford, R., & Barbarin, O.
(2008). Predicting child outcomes at the end of kindergarten from the quality of
pre-kindergarten teacher-child interactions and instruction. Applied Developmental
Science, 12(3), 140-153.
Center on Great Teachers and Leaders (2013). Databases on state teacher and principal
policies. Retrieved from: http:// http://resource.tqsource.org/stateevaldb.
Chan, T. C., & Jarman, D. (2004). Departmentalize elementary schools. Principal, 84(1),
70-72.
Chetty, R., Friedman, J. N., Hilger, N., Saez, E., Schanzenbach, D., & Yagan, D. (2011).
How does your kindergarten classroom affect your earnings? Evidence from Project
STAR. Quarterly Journal of Economics, 126(4), 1593-1660.
Chetty, R., Friedman, J. N., & Rockoff, J. E. (2014). Measuring the impacts of teachers I:
Evaluating Bias in Teacher Value-Added Estimates. American Economic Review,
104(9), 2593-2632.
Chin, M., & Goldhaber, D. (2015). Exploring explanations for the “weak” relationship
between value added and observation-based measures of teacher performance.
Working Paper. Cambridge, MA: National Center for Teacher Effectiveness.
92
Retrieved from:
http://cepr.harvard.edu/files/cepr/files/sree2015_simulation_working_paper.pdf?m=
1436541369
Cohen, D. K. (2011). Teaching and its predicaments. Cambridge, MA: Harvard
University Press.
Corcoran, S. P., Jennings, J. L., & Beveridge, A. A (2012). Teacher effectiveness on
high- and low-stakes tests. Unpublished manuscript. Retrieved from
http://citeseerx.ist.psu.edu/viewdoc/download?doi=10.1.1.269.5537&rep=rep1&typ
e=pdf
Council of the Great City Schools. (2013). Beating the odds: Analysis of student
performance on state assessments results from the 2012-2013 school year.
Washington, DC: Author
Darling-Hammond, L. (2013). Getting teacher evaluation right: What really matters for
effectiveness and improvement. New York: Teachers College Press.
Diener, E. (2000). Subjective well-being: The science of happiness and a proposal for a
national index. American Psychologist, 55(1), 34-43.
Downer, J. T., Rimm-Kaufman, S., & Pianta, R. C. (2007). How do classroom conditions
and children's risk for school problems contribute to children's behavioral
engagement in learning? School Psychology Review, 36(3), 413-432.
Duckworth, A. L., Peterson, C., Matthews, M. D., & Kelly, D. R. (2007). Grit:
Perseverance and passion for long-term goals. Journal of Personality and Social
Psychology, 92(6), 1087-1101.
93
Duckworth, A. L., Quinn, P. D., & Tsukayama, E. (2012). What No Child Left Behind
leaves behind: The roles of IQ and self-control in predicting standardized
achievement test scores and report card grades. Journal of Educational Psychology,
104(2), 439-451.
Duckworth, A. L., & Yeager, D. S. (2015). Measurement matters: Assessing personal
qualities other than cognitive ability for educational purposes. Educational
Researcher, 44(4), 237-251.
Duncan, A. (2010). Back to school: Enhancing U.S. education and competitiveness.
Foreign Affairs, 89(6), 65–74.
Dunn, O. J. (1961). Multiple comparisons among means. Journal of the American
Statistical Association, 56(293), 52-64.
Epstein, D., & Miller, R. T. (2011). Slow off the mark: Elementary school teachers and
the crisis in science, technology, engineering, and math education. Washington,
DC: Center for American Progress.
The Every Student Succeeds Act, Public Law 114-95, 114th Cong., 1st sess. (December
10, 2015), available at https://www.congress.gov/bill/114th-congress/senate-
bill/1177/text.
Farrington, C. A., Roderick, M., Allensworth, E., Nagaoka, J., Keyes, T. S., Johnson, D.
W., & Beechum, N. O. (2012). Teaching adolescents to become learners: The role
of non-cognitive factors in shaping school performance, a critical literature review.
Chicago: University of Chicago Consortium on Chicago School Reform.
Field, A. (2013). Discovering statistics using IBM SPSS statistics (4th ed.). London:
SAGE publications.
94
Gershenson, S. (forthcoming). Linking teacher quality, student attendance, and student
achievement. Education Finance and Policy.
Goodman, R. (2001). Psychometric properties of the strengths and difficulties
questionnaire. Journal of the American Academy of Child & Adolescent
Psychiatry, 40(11), 1337-1345.
Gregory, A., Allen, J. P., Mikami, A. Y., Hafen, C. A., & Pianta, R. C. (2014). Effects of
a professional development program on behavioral engagement of students in
middle and high school. Psychology in the Schools, 51(2), 143-163.
Grossman, P., & McDonald, M. (2008). Back to the future: Directions for research in
teaching and teacher education. American Educational Research Journal, 45,
184-205.
Hafen, C. A., Hamre, B. K., Allen, J. P., Bell, C. A., Gitomer, D. H., & Pianta, R. C.
(2015). Teaching through interactions in secondary school classrooms: Revisiting
the factor structure and practical application of the classroom assessment scoring
system–secondary. The Journal of Early Adolescence, 35(5-6), 651-680.
Hamre, B., Hatfield, B., Pianta, R., & Jamil, F. (2014). Evidence for general and domain-
specific elements of teacher–child interactions: Associations with preschool
children's development. Child Development, 85(3), 1257-1274.
Hamre, B. K., & Pianta, R. C. (2001). Early teacher–child relationships and the trajectory
of children's school outcomes through eighth grade. Child Development, 72(2),
625-638.
Hamre, B. K., Pianta, R. C., Downer, J. T., DeCoster, J., Mashburn, A. J., Jones, S. M., ...
& Brackett, M. A. (2013). Teaching through interactions: Testing a
95
developmental framework of teacher effectiveness in over 4,000 classrooms. The
Elementary School Journal, 113(4), 461-487.
Hanushek, E. A., & Rivkin, S. G. (2010). Generalizations about using value-added
measures of teacher quality. American Economic Review, 100(2), 267-271.
Harville, D. A. (1977). Maximum likelihood approaches to variance component
estimation and to related problems. Journal of the American Statistical Association,
72(358), 320-338.
Hickman, J. J., Fu, J., & Hill, H. C. (2012). Technical report: Creation and dissemination
of upper-elementary mathematics assessment modules. Princeton, NJ: Educational
Testing Service.
Hill, H. C., Blazar, D., & Lynch, K. (2015). Resources for teaching: Examining personal
and institutional predictors of high-quality instruction. AERA Open, 1(4), 1-23.
Hill, H. C., Blunk, M. L., Charalambous, C. Y., Lewis, J. M., Phelps, G. C., Sleep, L., &
Ball, D. L. (2008). Mathematical knowledge for teaching and the mathematical
quality of instruction: An exploratory study. Cognition and Instruction, 26(4), 430-
511.
Hill, H. C., Charalambous, C. Y., & Kraft, M. A. (2012). When rater reliability is not
enough teacher observation systems and a case for the generalizability
study. Educational Researcher, 41(2), 56-64.
Hill, H. C., & Grossman, P. (2013). Learning from teacher observations: Challenges and
opportunities posed by new teacher evaluation systems. Harvard Educational
Review, 83(2), 371-384.
96
Hill, H.C., Schilling, S.G., & Ball, D.L. (2004). Developing measures of teachers’
mathematics knowledge for teaching. Elementary School Journal, 105, 11-30.
Ho, A. D., & Kane, T. J. (2013). The reliability of classroom observations by school
personnel. Seattle, WA: Measures of Effective Teaching Project, Bill and Melinda
Gates Foundation.
Jackson, C. K. (2012). Non-cognitive ability, test scores, and teacher quality: Evidence
from ninth grade teachers in North Carolina. NBER Working Paper No. 18624.
Cambridge, MA: National Bureau for Economic Research.
Jennings, J. L. & DiPrete, T. A. (2010). Teacher effects on social and behavioral skills in
early elementary school. Sociology of Education, 83(2), 135-159.
John, O. P., & Srivastava, S. (1999). The Big Five trait taxonomy: History, measurement,
and theoretical perspectives. Handbook of personality: Theory and research,
2(1999), 102-138.
Kane, T. J., McCaffrey, D. F., Miller, T., & Staiger, D. O. (2013). Have we identified
effective teachers? Validating measures of effective teaching using random
assignment. Seattle, WA: Measures of Effective Teaching Project, Bill and Melinda
Gates Foundation.
Kane, T. J., & Staiger, D. O. (2012). Gathering feedback for teaching. Seattle, WA:
Measures of Effective Teaching Project, Bill and Melinda Gates Foundation.
King, R. B., McInerney, D. M., Ganotice, F. A., & Villarosa, J. B. (2015). Positive affect
catalyzes academic engagement: Cross-sectional, longitudinal, and experimental
evidence. Learning and Individual Differences, 39, 64-72.
Kline, P. (1994). An easy guide to factor analysis. London: Routledge.
97
Koedel, C. (2008). Teacher quality and dropout outcomes in a large, urban school district.
Journal of Urban Economics, 64(3), 560-572.
Kraft, M. A., & Grace, S. (2016). Teaching for tomorrow’s economy? Elementary
teacher effects on complex tasks, grit, and growth mindset. Working Paper.
Brown University. Retrieved from
http://scholar.harvard.edu/files/mkraft/files/teaching_for_tomorrows_economy_-
_final_public.pdf?m=1455588369
Ladd, H. F., & Sorensen, L. C. (2015). Returns to teacher experience: Student
achievement and motivation in middle school. Working Paper No. 112.
Washington, D C: National Center for Analysis of Longitudinal in Education
Research. Retrieved from
http://www.caldercenter.org/sites/default/files/WP%20112%20Update_0.pdf
Lampert, M. (2001). Teaching problems and the problems of teaching. Yale University
Press.
Lockwood, J. R., McCaffrey, D. F., Hamilton, L. S., Stecher, B., Le V., & Martinez, J. F.
(2007). The sensitivity of value-added teacher effect estimates to different
mathematics achievement measures. Journal of Educational Measurement, 44(1),
47-67.
Luckner, A. E., & Pianta, R. C. (2011). Teacher-student interactions in fifth grade
classrooms: Relations with children's peer behavior. Journal of Applied
Developmental Psychology, 32(5), 257-266.
98
Lynch, K., Chin, M., & Blazar, D. (2015). Relationship between observations of
elementary teacher mathematics instruction and student achievement: Exploring
variability across districts. Working Paper. Harvard University.
Lyubomirsky, S., King, L., & Diener, E. (2005). The benefits of frequent positive affect:
Does happiness lead to success? Psychological Bulletin, 131(6), 803-855.
Mashburn, A. J., Pianta, R. C., Hamre, B. K., Downer, J. T., Barbarin, O. A., Bryant, D., .
. . Howes, C. (2008). Measures of classroom quality in prekindergarten and
children's development of academic, language, and social skills. Child
Development, 79(3), 732-749.
McCaffrey, D. F., Sass, T. R., Lockwood, J. R., & Mihaly, K. (2009). The intertemporal
variability of teacher effect estimates. Education Finance and Policy, 4(4), 572-
606.
Mihaly, K., McCaffrey, D. F., Staiger, D. O., & Lockwood, J. R. (2013). A composite
estimator of effective teaching. Seattle, WA: Measures of Effective Teaching
Project, Bill and Melinda Gates Foundation.
Miles, S. B., & Stipek, D. (2006). Contemporaneous and longitudinal associations
between social behavior and literacy achievement in a sample of low‐income
elementary school children. Child Development, 77(1), 103-117.
Moffitt, T.E., Arseneault, L., Belsky, D., Dickson, N., Hancox, R.J., Harrington, H.,
Houts, R., Poulton, R., Roberts, B.W., & Ross, S. (2011). A gradient of childhood
self-control predicts health, wealth, and public safety. Proceedings of the National
Academy of Sciences, 108(7), 2693-2698.
99
Multon, K. D., Brown, S. D., & Lent, R. W. (1991). Relation of self-efficacy beliefs to
academic outcomes: A meta-analytic investigation. Journal of Counseling
Psychology, 38(1), 30.
National Council of Teachers of Mathematics. (1989). Curriculum and evaluation
standards for school mathematics. Reston, VA: Author.
National Council of Teachers of Mathematics (2014). Principles to actions: Ensuring
mathematical success for all. Reston, VA: Author.
National Governors Association Center for Best Practices. (2010). Common core state
standards for mathematics. Washington, DC: Author.
Papay, J. P. (2011). Different tests, different answers: The stability of teacher value-
added estimates across outcome measures. American Educational Research Journal,
48(1), 163-193.
Papay, J. P. (2012). Refocusing the debate: Assessing the purposes and tools of teacher
evaluation. Harvard Educational Review, 82(1), 123-141.
Pianta, R. C., & Hamre, B. K. (2009). Conceptualization, measurement, and
improvement of classroom processes: Standardized observation can leverage
capacity. Educational Researcher, 38(2), 109-119.
Pianta, R., La Paro, K., Payne, C., Cox, M., & Bradley, R. (2002). The relation of
kindergarten classroom environment to teacher, family, and school characteristics
and child outcomes. Elementary School Journal, 102, 225–38.
Raudenbush, S. W., & Bryk, A. S. (2002). Hierarchical linear models: Applications and
data analysis methods. Second Edition. Thousand Oaks, CA: Sage Publications.
100
Ruzek, E. A., Domina, T., Conley, A. M., Duncan, G.J., & Karabenick, S. A. (2014).
Using value-added models to measure teacher effects on students’ motivation and
achievement. The Journal of Early Adolescence, 1-31.
Segal, C. (2013). Misbehavior, education, and labor market outcomes. Journal of the
European Economic Association, 11(4), 743-779.
Šidák, Z. (1967). Rectangular confidence regions for the means of multivariate normal
distributions. Journal of the American Statistical Association, 62(318), 626-633.
Spearman, C. (1904). “General Intelligence,” objectively determined and measured. The
American Journal of Psychology, 15(2), 201-292.
Steinberg, M. P., & Garrett, R. (In Press). Classroom composition and measured teacher
performance: What do teacher observation scores really measure? Educational
Evaluation and Policy Analysis.
Tabachnick, B. G., & Fidell, L. S. (2001). Using multivariate statistics (4th ed.). New
York: Harper Collins.
Todd, P. E., & Wolpin, K. I. (2003). On the specification and estimation of the
production function for cognitive achievement. The Economic Journal, 113(485),
F3-F33.
Tremblay, R. E., Masse, B., Perron, D., LeBlanc, M., Schwartzman, A. E., & Ledingham,
J. E. (1992). Early disruptive behavior, poor school achievement, delinquent
behavior, and delinquent personality: Longitudinal analyses. Journal of Consulting
and Clinical Psychology, 60(1), 64.
Tsukayama, E., Duckworth, A.L., & Kim, B. (2013). Domain-specific impulsivity in
school-age children. Developmental Science, 16(6), 879-893.
101
U.S. Department of Education (2010). A blueprint for reform: Reauthorization of the
elementary and secondary education act. Washington, DC: U.S. Department of
Education, Office of Planning, Evaluation and Policy Development.
Usher, E. L., & Pajares, F. (2008). Sources of self-efficacy in school: Critical review of
the literature and future directions. Review of Educational Research,78(4), 751-796.
West, M. R., Kraft, M. A., Finn, A. S., Martin, R. E., Duckworth, A. L., Gabrieli, C. F.,
& Gabrieli, J. D. (2016). Promise and paradox: Measuring students’ non-cognitive
skills and the impact of schooling. Educational Evaluation and Policy Analysis,
38(1), 148-170.
Whitehurst, G. J., Chingos, M. M., & Lindquist, K. M. (2014). Evaluating teachers with
classroom observations: Lessons learned in four districts. Report published by the
Brown Center on Education Policy at the Brookings Institute. Washington, DC.
Retrieved from Brookings Institute website:
http://www.brookings.edu/~/media/research/files/reports/2014/05/13-teacher-
evaluation/evaluating-teachers-with-classroom-observations.pdf
Wigfield, A., & Meece, J. L. (1988). Math anxiety in elementary and secondary school
students. Journal of Educational Psychology, 80(2), 210.
Zimmerman, D. W., & Williams, R. H. (1997). Properties of the Spearman correction for
attenuation for normal and realistic non-normal distributions. Applied Psychological
Measurement, 21(3), 253-270.
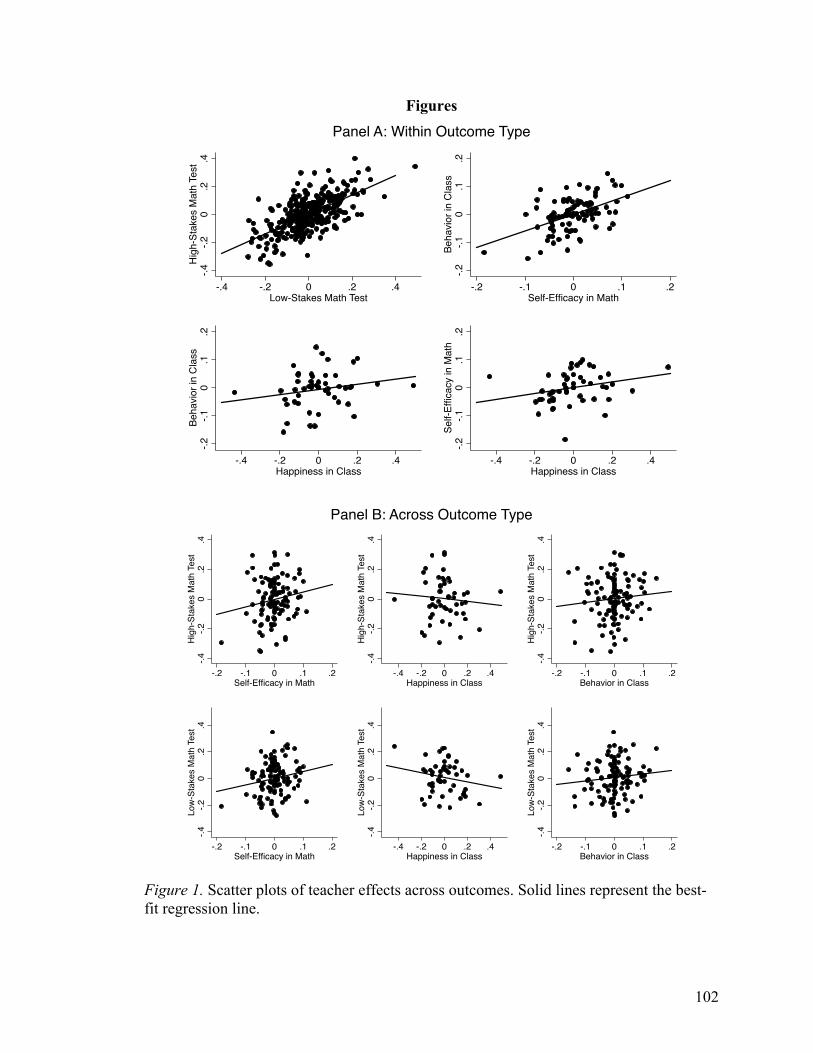
102
Figures
Figure 1. Scatter plots of teacher effects across outcomes. Solid lines represent the best-fit regression line.
-.4-.2
0.2
.4Hi
gh-S
take
s M
ath
Test
-.4 -.2 0 .2 .4Low-Stakes Math Test
-.2-.1
0.1
.2Be
havio
r in
Clas
s
-.2 -.1 0 .1 .2Self-Efficacy in Math
-.2-.1
0.1
.2Be
havio
r in
Clas
s
-.4 -.2 0 .2 .4Happiness in Class
-.2-.1
0.1
.2Se
lf-Ef
ficac
y in
Mat
h-.4 -.2 0 .2 .4
Happiness in Class
Panel A: Within Outcome Type
-.4-.2
0.2
.4Hi
gh-S
take
s M
ath
Test
-.2 -.1 0 .1 .2Self-Efficacy in Math
-.4-.2
0.2
.4Hi
gh-S
take
s M
ath
Test
-.4 -.2 0 .2 .4Happiness in Class
-.4-.2
0.2
.4Hi
gh-S
take
s M
ath
Test
-.2 -.1 0 .1 .2Behavior in Class
-.4-.2
0.2
.4Lo
w-St
akes
Mat
h Te
st
-.2 -.1 0 .1 .2Self-Efficacy in Math
-.4-.2
0.2
.4Lo
w-St
akes
Mat
h Te
st
-.4 -.2 0 .2 .4Happiness in Class
-.4-.2
0.2
.4Lo
w-St
akes
Mat
h Te
st
-.2 -.1 0 .1 .2Behavior in Class
Panel B: Across Outcome Type
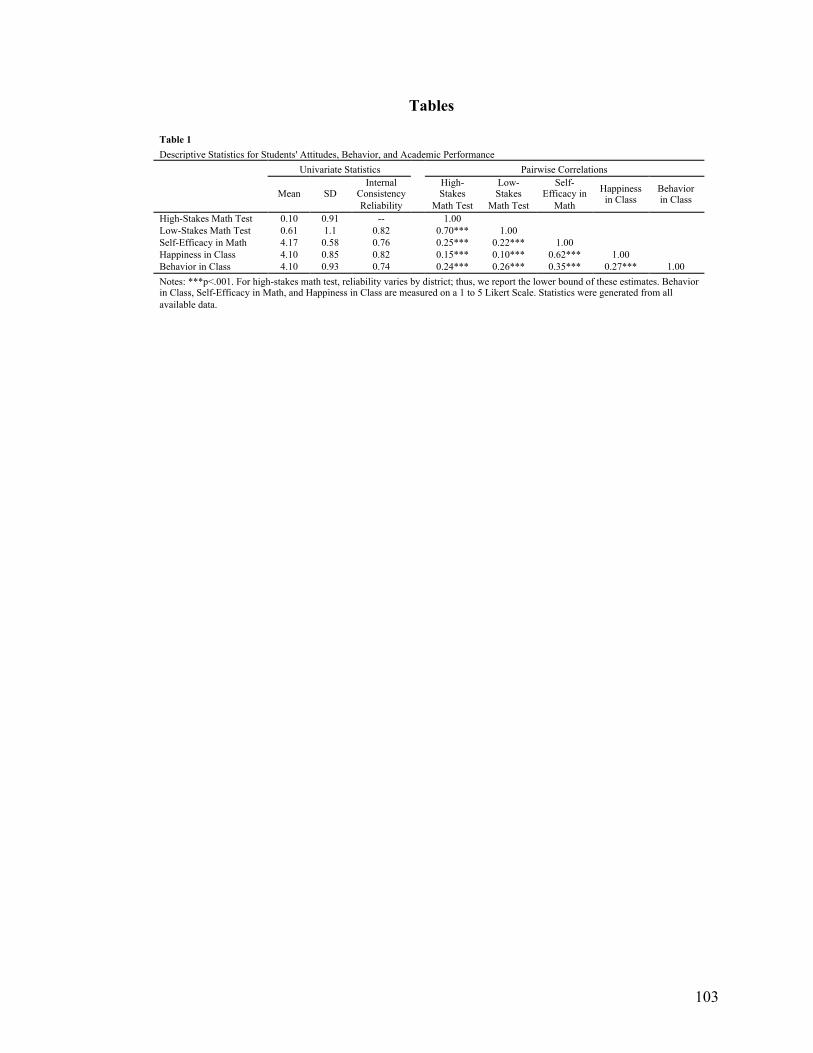
103
Tables
Table 1 Descriptive Statistics for Students' Attitudes, Behavior, and Academic Performance
Univariate Statistics Pairwise Correlations
Mean SD
Internal Consistency Reliability
High-Stakes
Math Test
Low-Stakes
Math Test
Self-Efficacy in
Math
Happiness in Class
Behavior in Class
High-Stakes Math Test 0.10 0.91 -- 1.00 Low-Stakes Math Test 0.61 1.1 0.82 0.70*** 1.00
Self-Efficacy in Math 4.17 0.58 0.76 0.25*** 0.22*** 1.00 Happiness in Class 4.10 0.85 0.82 0.15*** 0.10*** 0.62*** 1.00
Behavior in Class 4.10 0.93 0.74 0.24*** 0.26*** 0.35*** 0.27*** 1.00 Notes: ***p<.001. For high-stakes math test, reliability varies by district; thus, we report the lower bound of these estimates. Behavior in Class, Self-Efficacy in Math, and Happiness in Class are measured on a 1 to 5 Likert Scale. Statistics were generated from all available data.
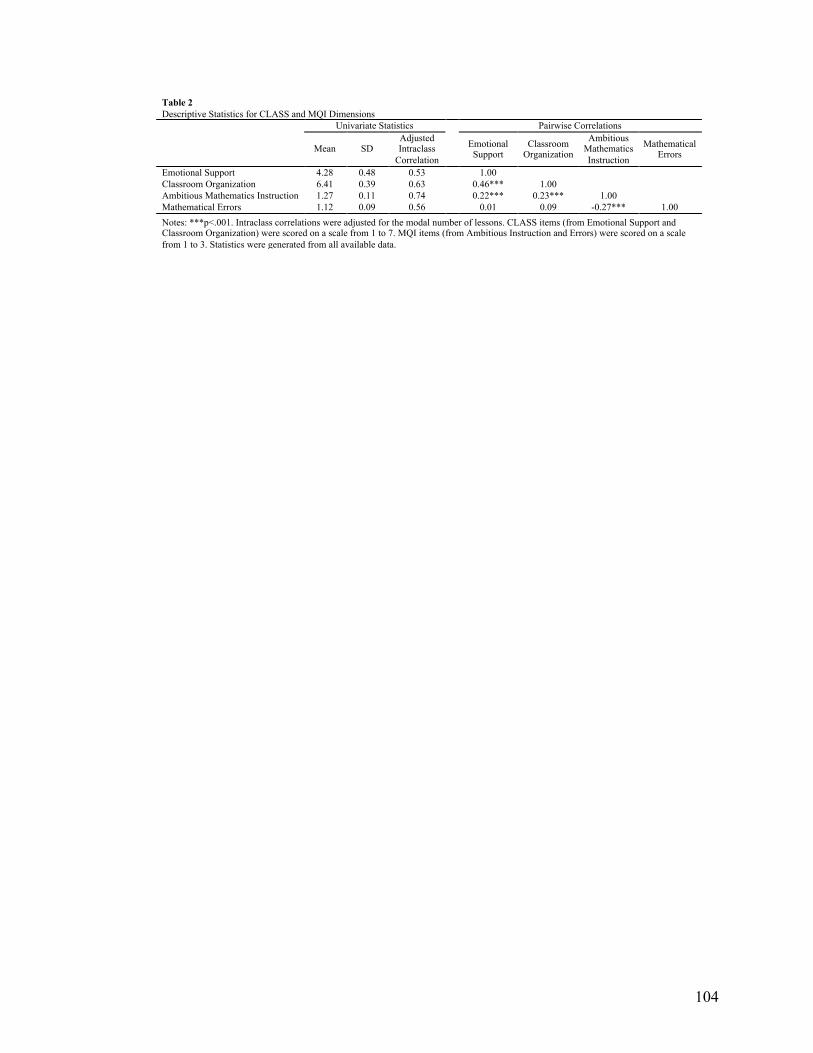
104
Table 2 Descriptive Statistics for CLASS and MQI Dimensions
Univariate Statistics Pairwise Correlations
Mean SD
Adjusted Intraclass
Correlation
Emotional Support
Classroom Organization
Ambitious Mathematics Instruction
Mathematical Errors
Emotional Support 4.28 0.48 0.53
1.00 Classroom Organization 6.41 0.39 0.63
0.46*** 1.00
Ambitious Mathematics Instruction 1.27 0.11 0.74
0.22*** 0.23*** 1.00 Mathematical Errors 1.12 0.09 0.56 0.01 0.09 -0.27*** 1.00
Notes: ***p<.001. Intraclass correlations were adjusted for the modal number of lessons. CLASS items (from Emotional Support and Classroom Organization) were scored on a scale from 1 to 7. MQI items (from Ambitious Instruction and Errors) were scored on a scale from 1 to 3. Statistics were generated from all available data.
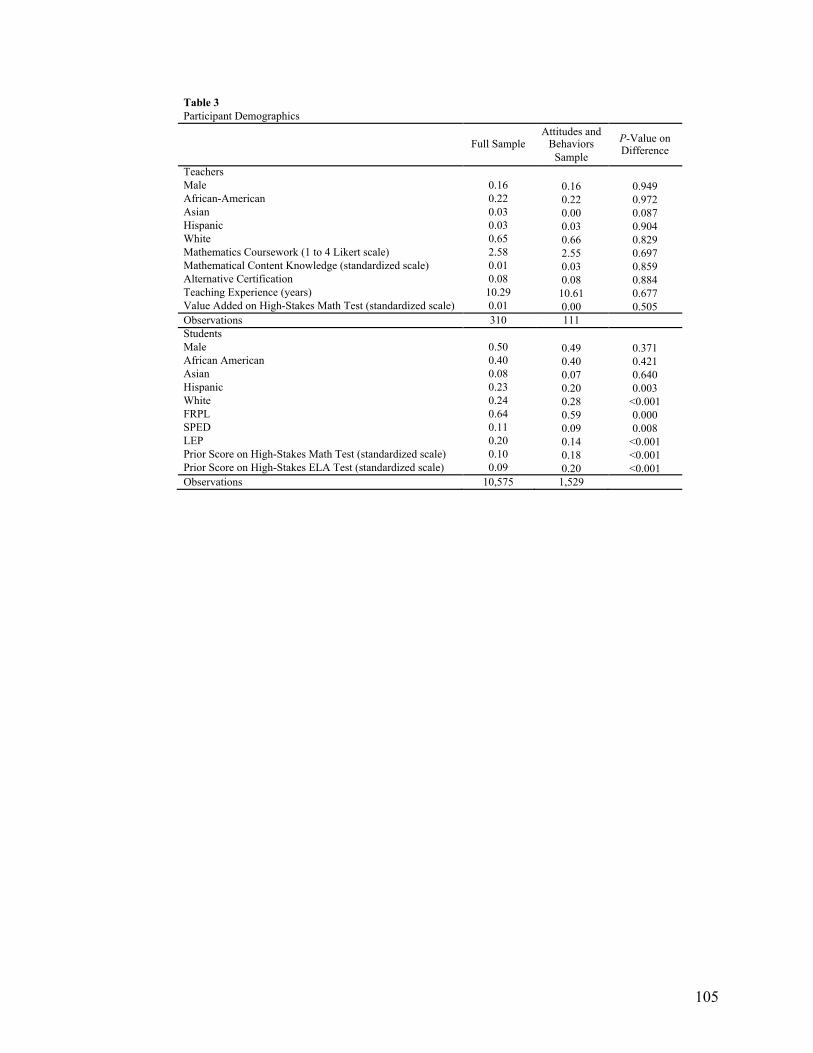
105
Table 3 Participant Demographics
Full Sample Attitudes and
Behaviors Sample
P-Value on Difference
Teachers Male 0.16 0.16 0.949 African-American 0.22 0.22 0.972 Asian 0.03 0.00 0.087 Hispanic 0.03 0.03 0.904 White 0.65 0.66 0.829 Mathematics Coursework (1 to 4 Likert scale) 2.58 2.55 0.697 Mathematical Content Knowledge (standardized scale) 0.01 0.03 0.859 Alternative Certification 0.08 0.08 0.884 Teaching Experience (years) 10.29 10.61 0.677 Value Added on High-Stakes Math Test (standardized scale) 0.01 0.00 0.505 Observations 310 111 Students Male 0.50 0.49 0.371 African American 0.40 0.40 0.421 Asian 0.08 0.07 0.640 Hispanic 0.23 0.20 0.003 White 0.24 0.28 <0.001 FRPL 0.64 0.59 0.000 SPED 0.11 0.09 0.008 LEP 0.20 0.14 <0.001 Prior Score on High-Stakes Math Test (standardized scale) 0.10 0.18 <0.001 Prior Score on High-Stakes ELA Test (standardized scale) 0.09 0.20 <0.001 Observations 10,575 1,529
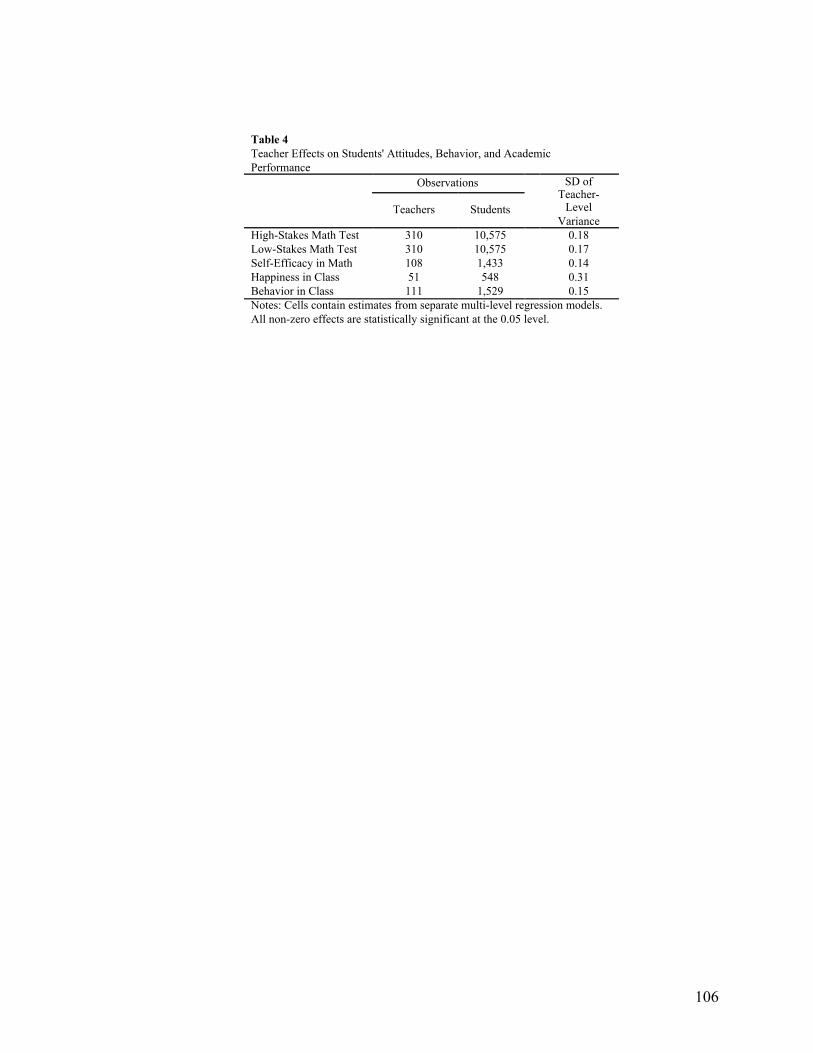
106
Table 4 Teacher Effects on Students' Attitudes, Behavior, and Academic Performance Observations SD of
Teacher-Level
Variance Teachers Students High-Stakes Math Test 310 10,575 0.18 Low-Stakes Math Test 310 10,575 0.17 Self-Efficacy in Math 108 1,433 0.14 Happiness in Class 51 548 0.31 Behavior in Class 111 1,529 0.15 Notes: Cells contain estimates from separate multi-level regression models. All non-zero effects are statistically significant at the 0.05 level.
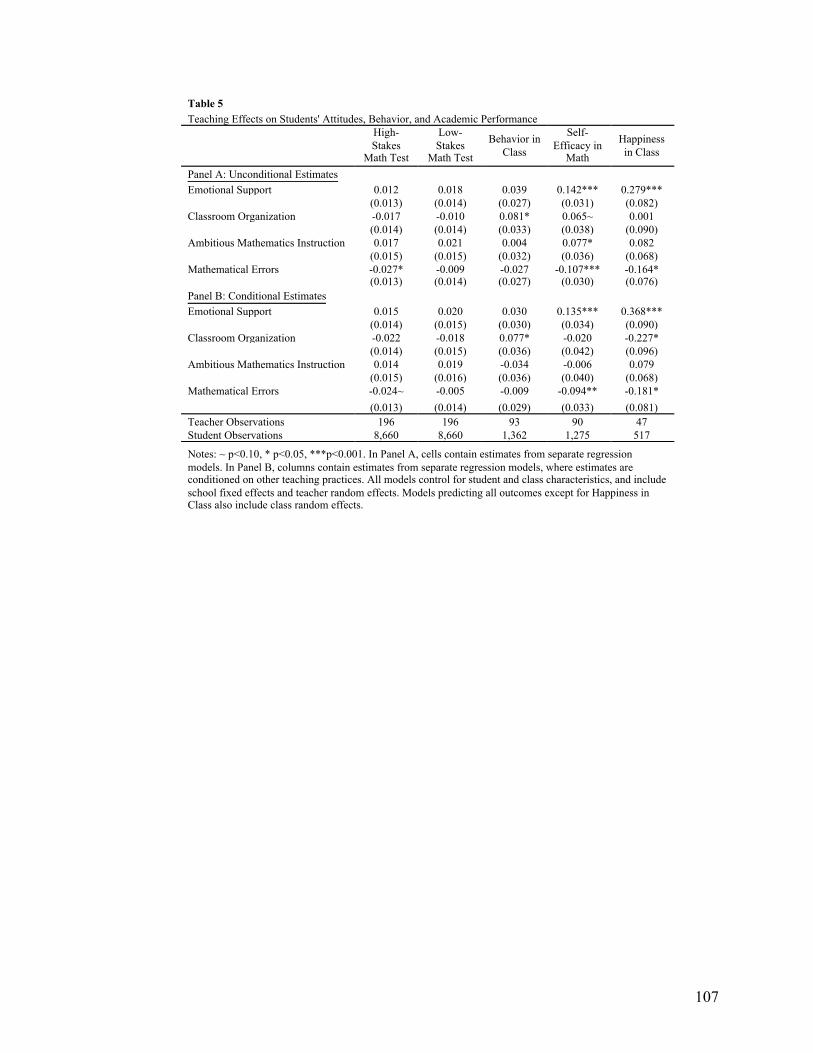
107
Table 5 Teaching Effects on Students' Attitudes, Behavior, and Academic Performance
High-Stakes
Math Test
Low-Stakes
Math Test
Behavior in Class
Self-Efficacy in
Math
Happiness in Class
Panel A: Unconditional Estimates Emotional Support 0.012 0.018 0.039 0.142*** 0.279***
(0.013) (0.014) (0.027) (0.031) (0.082)
Classroom Organization -0.017 -0.010 0.081* 0.065~ 0.001
(0.014) (0.014) (0.033) (0.038) (0.090)
Ambitious Mathematics Instruction 0.017 0.021 0.004 0.077* 0.082
(0.015) (0.015) (0.032) (0.036) (0.068)
Mathematical Errors -0.027* -0.009 -0.027 -0.107*** -0.164*
(0.013) (0.014) (0.027) (0.030) (0.076)
Panel B: Conditional Estimates Emotional Support 0.015 0.020 0.030 0.135*** 0.368***
(0.014) (0.015) (0.030) (0.034) (0.090)
Classroom Organization -0.022 -0.018 0.077* -0.020 -0.227*
(0.014) (0.015) (0.036) (0.042) (0.096)
Ambitious Mathematics Instruction 0.014 0.019 -0.034 -0.006 0.079
(0.015) (0.016) (0.036) (0.040) (0.068)
Mathematical Errors -0.024~ -0.005 -0.009 -0.094** -0.181*
(0.013) (0.014) (0.029) (0.033) (0.081)
Teacher Observations 196 196 93 90 47 Student Observations 8,660 8,660 1,362 1,275 517
Notes: ~ p<0.10, * p<0.05, ***p<0.001. In Panel A, cells contain estimates from separate regression models. In Panel B, columns contain estimates from separate regression models, where estimates are conditioned on other teaching practices. All models control for student and class characteristics, and include school fixed effects and teacher random effects. Models predicting all outcomes except for Happiness in Class also include class random effects.
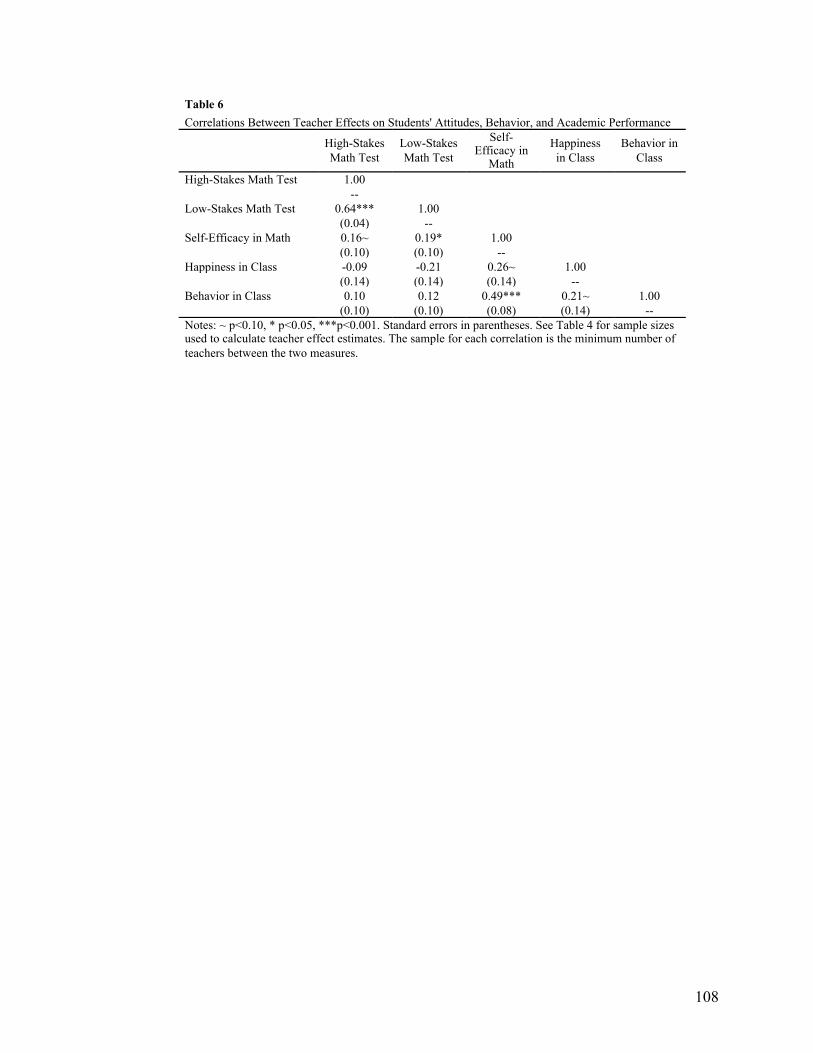
108
Table 6 Correlations Between Teacher Effects on Students' Attitudes, Behavior, and Academic Performance
High-Stakes Math Test
Low-Stakes Math Test
Self-Efficacy in
Math
Happiness in Class
Behavior in Class
High-Stakes Math Test 1.00 -- Low-Stakes Math Test 0.64*** 1.00 (0.04) -- Self-Efficacy in Math 0.16~ 0.19* 1.00 (0.10) (0.10) -- Happiness in Class -0.09 -0.21 0.26~ 1.00
(0.14) (0.14) (0.14) -- Behavior in Class 0.10 0.12 0.49*** 0.21~ 1.00
(0.10) (0.10) (0.08) (0.14) --
Notes: ~ p<0.10, * p<0.05, ***p<0.001. Standard errors in parentheses. See Table 4 for sample sizes used to calculate teacher effect estimates. The sample for each correlation is the minimum number of teachers between the two measures.
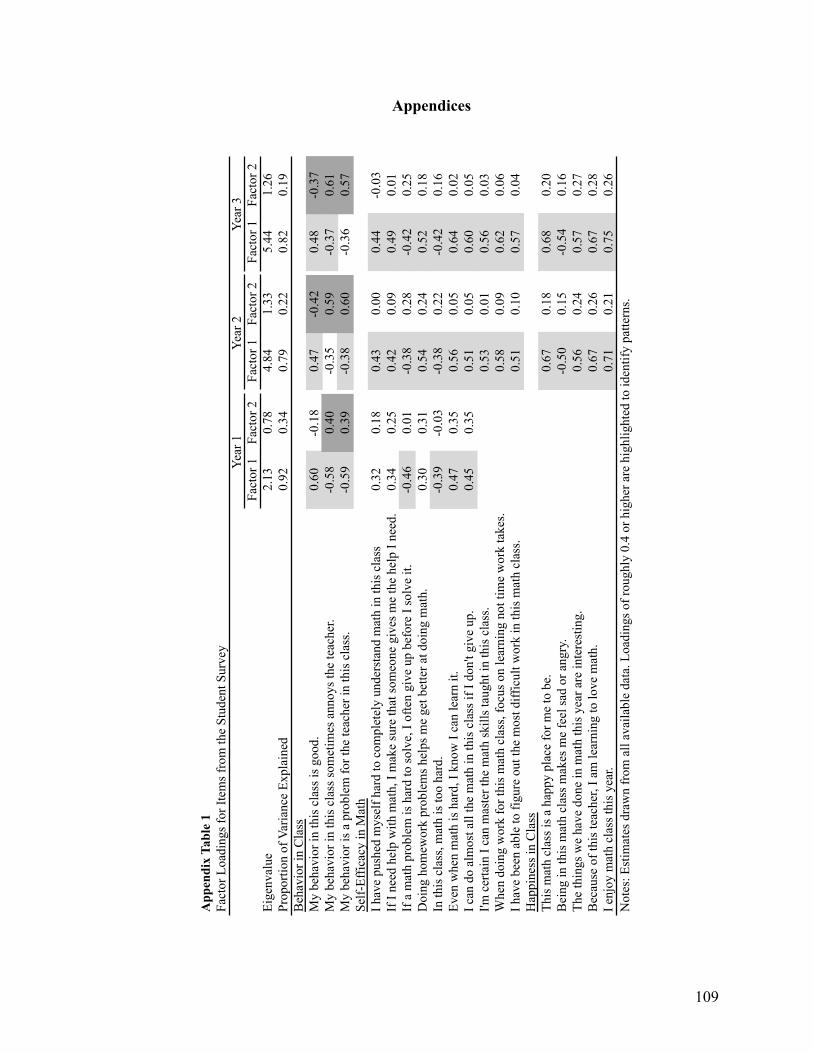
109
Appendices
A
ppen
dix
Tabl
e 1
Fact
or L
oadi
ngs f
or It
ems f
rom
the
Stud
ent S
urve
y
Fact
or 1
Fact
or 2
Fact
or 1
Fact
or 2
Fact
or 1
Fact
or 2
Eige
nval
ue2.
130.
784.
841.
335.
441.
26Pr
opor
tion
of V
aria
nce
Expl
aine
d0.
920.
340.
790.
220.
820.
19B
ehav
ior i
n C
lass
My
beha
vior
in th
is c
lass
is g
ood.
0.60
-0.1
80.
47-0
.42
0.48
-0.3
7M
y be
havi
or in
this
cla
ss so
met
imes
ann
oys t
he te
ache
r.-0
.58
0.40
-0.3
50.
59-0
.37
0.61
My
beha
vior
is a
pro
blem
for t
he te
ache
r in
this
cla
ss.
-0.5
90.
39-0
.38
0.60
-0.3
60.
57Se
lf-Ef
ficac
y in
Mat
hI h
ave
push
ed m
ysel
f har
d to
com
plet
ely
unde
rsta
nd m
ath
in th
is c
lass
0.32
0.18
0.43
0.00
0.44
-0.0
3If
I ne
ed h
elp
with
mat
h, I
mak
e su
re th
at so
meo
ne g
ives
me
the
help
I ne
ed.
0.34
0.25
0.42
0.09
0.49
0.01
If a
mat
h pr
oble
m is
har
d to
solv
e, I
ofte
n gi
ve u
p be
fore
I so
lve
it.-0
.46
0.01
-0.3
80.
28-0
.42
0.25
Doi
ng h
omew
ork
prob
lem
s hel
ps m
e ge
t bet
ter a
t doi
ng m
ath.
0.30
0.31
0.54
0.24
0.52
0.18
In th
is c
lass
, mat
h is
too
hard
.-0
.39
-0.0
3-0
.38
0.22
-0.4
20.
16Ev
en w
hen
mat
h is
har
d, I
know
I ca
n le
arn
it.0.
470.
350.
560.
050.
640.
02I c
an d
o al
mos
t all
the
mat
h in
this
cla
ss if
I do
n't g
ive
up.
0.45
0.35
0.51
0.05
0.60
0.05
I'm c
erta
in I
can
mas
ter t
he m
ath
skill
s tau
ght i
n th
is c
lass
.0.
530.
010.
560.
03W
hen
doin
g w
ork
for t
his m
ath
clas
s, fo
cus o
n le
arni
ng n
ot ti
me
wor
k ta
kes.
0.58
0.09
0.62
0.06
I hav
e be
en a
ble
to fi
gure
out
the
mos
t diff
icul
t wor
k in
this
mat
h cl
ass.
0.51
0.10
0.57
0.04
Hap
pine
ss in
Cla
ssTh
is m
ath
clas
s is a
hap
py p
lace
for m
e to
be.
0.67
0.18
0.68
0.20
Bei
ng in
this
mat
h cl
ass m
akes
me
feel
sad
or a
ngry
.-0
.50
0.15
-0.5
40.
16Th
e th
ings
we
have
don
e in
mat
h th
is y
ear a
re in
tere
stin
g.0.
560.
240.
570.
27B
ecau
se o
f thi
s tea
cher
, I a
m le
arni
ng to
love
mat
h.0.
670.
260.
670.
28I e
njoy
mat
h cl
ass t
his y
ear.
0.71
0.21
0.75
0.26
Year
1Ye
ar 2
Year
3
Not
es: E
stim
ates
dra
wn
from
all
avai
labl
e da
ta. L
oadi
ngs o
f rou
ghly
0.4
or h
ighe
r are
hig
hlig
hted
to id
entif
y pa
ttern
s.
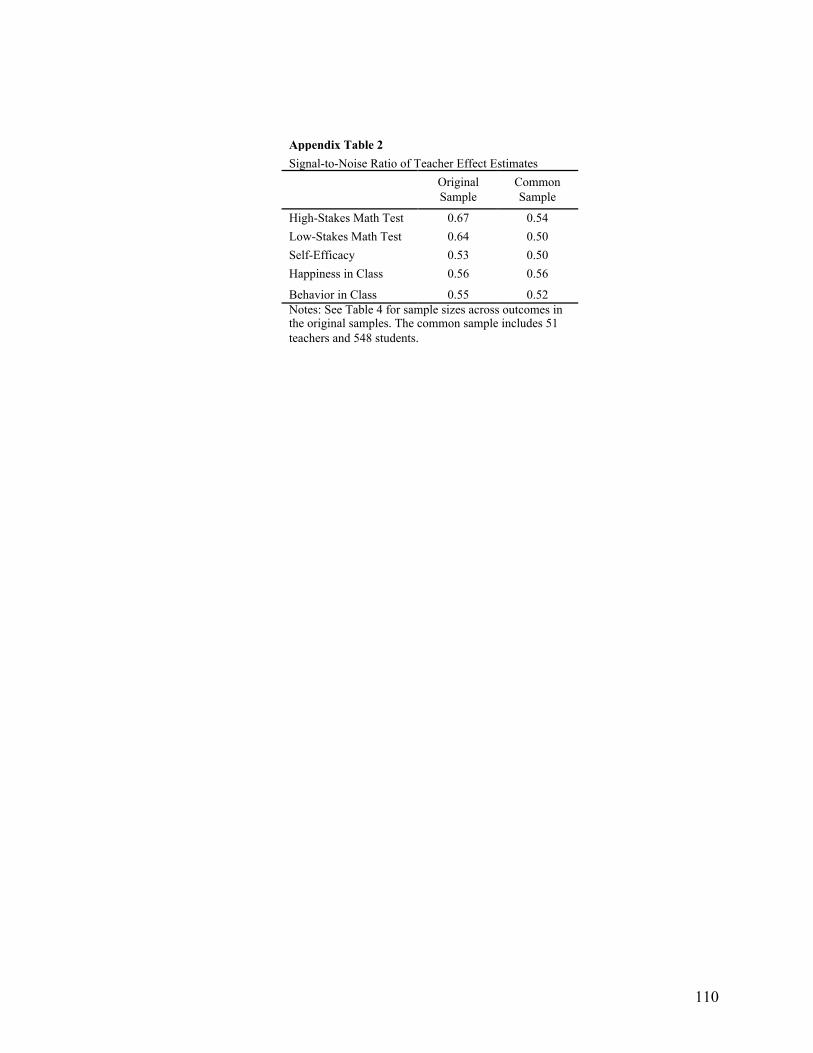
110
Appendix Table 2 Signal-to-Noise Ratio of Teacher Effect Estimates
Original Sample
Common Sample
High-Stakes Math Test 0.67 0.54 Low-Stakes Math Test 0.64 0.50 Self-Efficacy 0.53 0.50 Happiness in Class 0.56 0.56
Behavior in Class 0.55 0.52 Notes: See Table 4 for sample sizes across outcomes in the original samples. The common sample includes 51 teachers and 548 students.
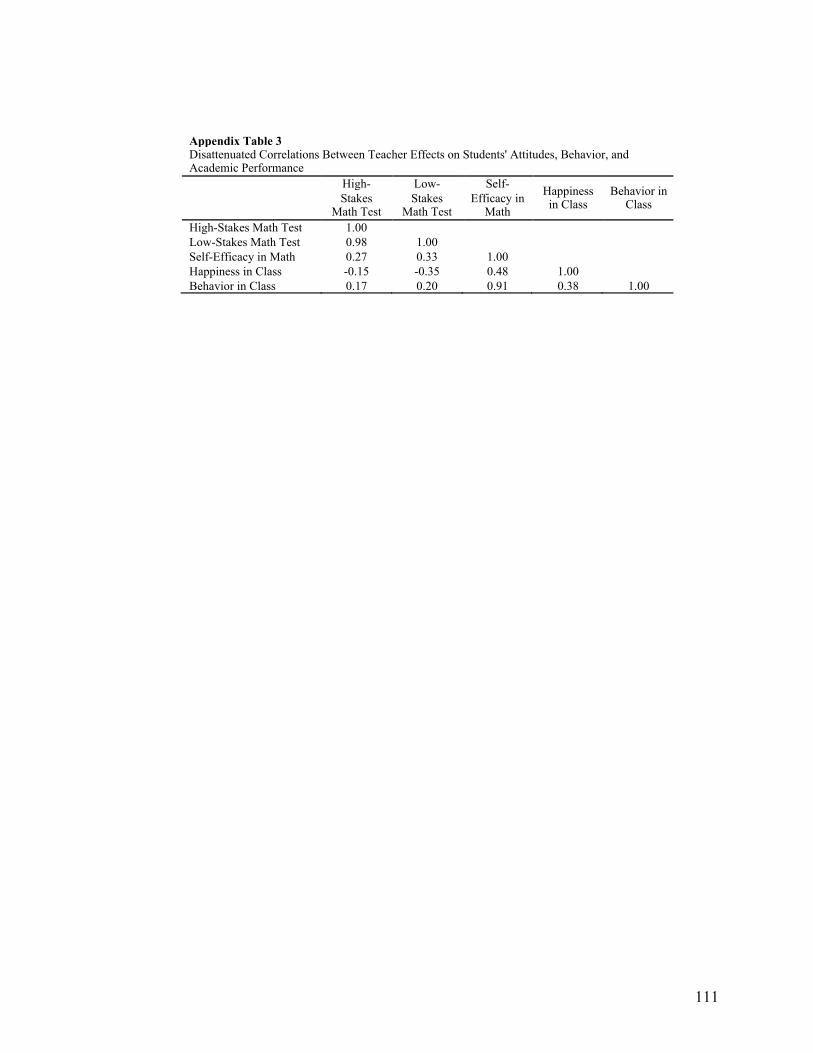
111
Appendix Table 3 Disattenuated Correlations Between Teacher Effects on Students' Attitudes, Behavior, and
Academic Performance
High-Stakes
Math Test
Low-Stakes
Math Test
Self-Efficacy in
Math
Happiness in Class
Behavior in Class
High-Stakes Math Test 1.00 Low-Stakes Math Test 0.98 1.00
Self-Efficacy in Math 0.27 0.33 1.00 Happiness in Class -0.15 -0.35 0.48 1.00
Behavior in Class 0.17 0.20 0.91 0.38 1.00
112
Paper 3
Validating Teacher Effects on Students’ Attitudes and Behaviors through Random
Assignment
Abstract
There is growing interest among researchers, policymakers, and practitioners in
identifying teachers who are skilled at improving student outcomes beyond test scores.
However, it is not clear whether the key identifying assumption underlying the estimation
of teacher effects – that estimates are not biased by non-random sorting of students to
teachers – holds when test scores are replaced with other student outcomes. Leveraging
the random assignment of teachers to students, I find that teachers have causal effects on
their students’ self-reported behavior in class, self-efficacy in math, and happiness in
class that are similar in magnitude to effects on test scores. At the same time, value-added
approaches to estimating these teacher effects often are insufficient to account for bias.
One exception is teacher effects on students’ behavior in class, where predicted
differences come close to actual differences following random assignment. Therefore, it
likely will be necessary to continue to rely on random assignment in order to identify
teachers who are effective at improving students’ attitudes and behaviors, as well as to
find ways to help teachers improve in these areas.

113
1. Introduction
Decades worth of research on education production have narrowed in on the
importance of teachers to student outcomes (Hanushek & Rivkin, 2010; Murnane &
Phillips, 1981; Todd & Wolpin, 2003). Over the last several years, these studies have
coalesced around two key findings. First, teachers vary considerably in their ability to
improve students’ academic performance (Hanushek & Rivkin, 2010; Nye,
Konstantopoulos, & Hedges, 2004), which in turn influences a variety of long-term
outcomes including teenage pregnancy rates, college attendance, and earnings in
adulthood (Chetty, Friedman, & Rockoff, 2014b). Second, experimental and quasi-
experimental studies indicate that “value-added” approaches to estimating teachers’
contribution to student test scores are valid ways to identify effective teachers (Bacher-
Hicks, Chin, Kane, & Staiger, 2015; Chetty, Friedman, & Rockoff, 2014a; Glazerman &
Pratik, 2015; Kane, McCaffrey, Miller, & Staiger, 2013; Kane & Staiger, 2008). In other
words, these teacher effect estimates are not confounded with the non-random sorting of
teachers to students, the specific set of students in the classroom, or factors beyond
teachers’ control. Policymakers have taken notice of these important findings, leading to
widespread changes in teacher evaluation (Dee & Wyckoff, 2015), compensation
(Podgursky & Springer, 2011), and promotion (Loeb, Miller, & Wyckoff, 2015).
While the studies described above have focused predominantly on teachers’
contribution to students’ academic performance, the research community is starting to
have evidence that teachers also impact a variety of other student outcomes in ways that
are only weakly related to their effects on test scores (Blazar & Kraft, 2015; Gershenson,
2016; Jackson, 2012; Jennings & DiPrete, 2010; Kraft & Grace, 2016). For example, in
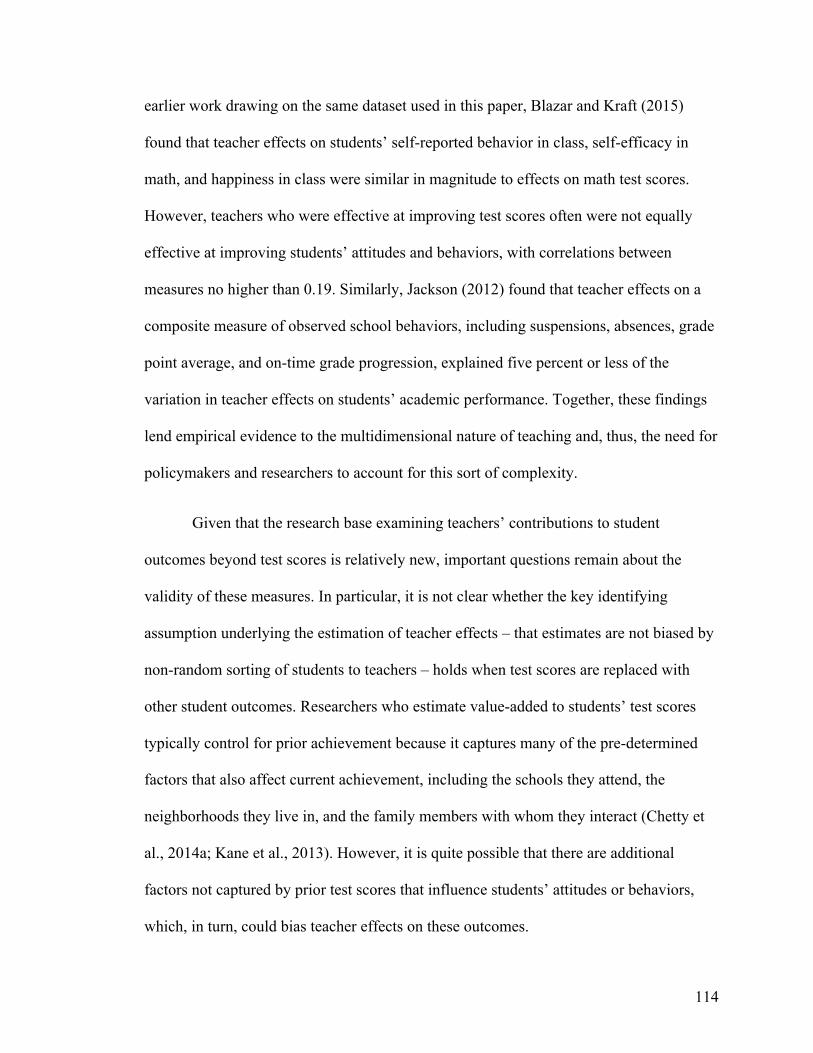
114
earlier work drawing on the same dataset used in this paper, Blazar and Kraft (2015)
found that teacher effects on students’ self-reported behavior in class, self-efficacy in
math, and happiness in class were similar in magnitude to effects on math test scores.
However, teachers who were effective at improving test scores often were not equally
effective at improving students’ attitudes and behaviors, with correlations between
measures no higher than 0.19. Similarly, Jackson (2012) found that teacher effects on a
composite measure of observed school behaviors, including suspensions, absences, grade
point average, and on-time grade progression, explained five percent or less of the
variation in teacher effects on students’ academic performance. Together, these findings
lend empirical evidence to the multidimensional nature of teaching and, thus, the need for
policymakers and researchers to account for this sort of complexity.
Given that the research base examining teachers’ contributions to student
outcomes beyond test scores is relatively new, important questions remain about the
validity of these measures. In particular, it is not clear whether the key identifying
assumption underlying the estimation of teacher effects – that estimates are not biased by
non-random sorting of students to teachers – holds when test scores are replaced with
other student outcomes. Researchers who estimate value-added to students’ test scores
typically control for prior achievement because it captures many of the pre-determined
factors that also affect current achievement, including the schools they attend, the
neighborhoods they live in, and the family members with whom they interact (Chetty et
al., 2014a; Kane et al., 2013). However, it is quite possible that there are additional
factors not captured by prior test scores that influence students’ attitudes or behaviors,
which, in turn, could bias teacher effects on these outcomes.
115
In this paper, I examine this concern by drawing on a unique dataset from the
National Center for Teacher Effectiveness in which participating students completed a
survey that asked about a range of attitudes and behaviors in class. In the third year of the
study, a subset of participating teachers were randomly assigned to class rosters within
schools. Together, these data allow me to examine the extent to which teachers vary in
their contribution to students’ attitudes and behaviors, even after random assignment; the
sensitivity of teacher effects on students’ attitudes and behaviors to different model
specifications, including those that control for students’ prior academic performance
versus prior attitudes and behaviors; and, ultimately, whether non-experimental estimates
of teacher effects on these attitudes and behaviors predict these same outcomes following
random assignment, which produces a measure of forecast bias.
Findings indicate that teachers have causal effects on their students’ self-reported
behavior in class, self-efficacy in math, and happiness in class. The magnitude of the
teacher-level variation on these outcomes is similar to that on test scores. However,
value-added approaches to estimating these teacher effects are insufficient to account for
bias in many cases. One exception is teacher effects on students’ behavior in class, where
predicted differences come close to actual differences following random assignment.
Interestingly, teacher effects are not particularly sensitive to models that control from
students’ prior achievement, student demographic characteristics, or prior survey
responses. Given that these are the tools and data typically available to the
econometrician, it likely will be necessary to continue to rely on random assignment in
order to identify teachers who are effective at improving students’ attitudes and behaviors,
as well as to find ways to help teachers improve in these areas.
116
Several caveats about the sample and data should guide readers’ interpretation of
these findings. First and foremost, student surveys where administered under low-stakes
conditions where individual student responses were not visible either to the teacher or to
other students in the classroom. Thus, it is possible that estimates of bias might differ
under high-stakes settings where survey responses could be coached or influenced by
other pressures. Second, the fact that teachers were randomly assigned to class rosters
within schools means that these findings cannot inform between-school comparisons.
Finally, in light of a small sample of teachers in the experimental portion of the study (N
= 41), additional studies are necessary to estimate magnitudes of bias more precisely. As
the first random assignment study to focus specifically on teacher effects on students’
attitudes and behaviors, though, these findings can serve as a benchmark for future work
and contribute to the evidence base validating measures of teacher effectiveness.
2. Background
2.1. The Importance of Schools and Teachers in Improving Student Outcomes Beyond
Test Scores
A growing body of research highlights the importance of student outcomes
beyond test scores to short- and long-term success, including earnings, health, and
community engagement (Chetty et al., 2011; Duckworth, Quinn, & Tsukayama, 2013;
Lindqvist & Vestman, 2011; Moffit et. al., 2011; Mueller & Plug, 2006; Murayama et al.,
2012). In turn, this work has led to investigations of the specific factors that improve
these outcomes, many of which have focused on schools and teachers. For example, in
some of the earliest work on this topic, Heckman, Stixrud, and Urzua (2006) analyzed
117
longitudinal data from the National Longitudinal Survey of Youth 1979 and found
relationships between additional years of high school and students’ locus of control and
self-esteem. Re-analyzing data from the HighScope Perry preschool experiment,
Heckman, Pinto, and Savelyev (2013) demonstrated how externalizing behavior and
academic motivation drove large increases in employment and earnings, as well as
reductions in criminal behavior for students randomly assigned to attend the preschool. In
a related re-analysis of the Tennessee STAR experiment, in which kindergarten students
were randomly assigned to small or large classes, Chetty et al. (2011) found that effort,
initiative, and disruptive behavior mediated the relationship between kindergarten class
quality and college attendance and adult earnings.
Several recent studies have borrowed from the literature on teachers’ “value-
added” to student test scores (e.g., Hanushek & Rivkin, 2010; Nye et al., 2004; Sanders,
Wright, & Horn, 1997) in order to document the magnitude of teacher effects on a range
of other outcomes. Without experimental designs, these studies have attempted to isolate
the unique effect of teachers on these outcomes and to limit bias due to non-random
sorting of students to teachers. To do so, they primarily control for prior measures of
students’ academic performance and basic demographic characteristics (e.g., gender, race,
socioeconomic status). In a few instances (Blazar & Kraft, 2015; Backes & Hansen,
2015; Gershenson, 2016), studies also controlled for prior measures of the outcome
variable when these measures were available at more than one point in time. Findings
suggest substantive teacher effects on students’ motivation, self-control, and
interpersonal skills (Blazar & Kraft, 2015; Jennings & DiPrete, 2010; Ruzek et al., 2014),
as well as on a range of observed school behaviors, including absences, suspensions,
118
grades, grade progression, and graduation, that are thought be proxies for students’
underlying social and emotional development (Backes & Hansen, 2015; Gershenson,
2016; Jackson, 2012; Koedel, 2008; Ladd & Sorenson, 2015). Drawing on the same data
as in this paper, Blazar and Kraft (2015) also found intuitive relationships between
teachers’ classroom practices and closely related student outcomes – e.g., between the
climate teachers created in the classroom and students’ self-efficacy in math and
happiness in class – thus providing strong face validity to these teacher effect estimates.
In the one experimental study of this kind, where teachers were randomly
assigned to class rosters within schools as part of the Measures of Effective Teaching
(MET) project, Kraft and Grace (2016) found teacher effects on students’ grit, growth
mindset, and effort in class similar in magnitude to teacher effects from non-experimental
studies. Specifically, they found that teachers identified as 1 standard deviation (sd)
above the mean in the distribution of effectiveness improved these outcomes by roughly
0.10 sd to 0.17 sd. However, there was considerable attrition of students who moved out
of their randomly assigned teachers’ classroom, thus limiting the conclusions of this
study. Further, given that measures of students’ grit, growth mindset, and effort in class
were collected in only one year, this study was not able to relate teacher effects calculated
under experimental conditions to effects calculated under non-experimental ones. Below,
I describe why this sort of validity evidence is crucial to inform use of these metrics.
2.2. Validating Teacher Effects on Student Outcomes
Over the last decade, several experimental and quasi-experimental studies have
tested the validity of non-experimental methods for estimating teacher effects on student
119
achievement. In the first of these, Kane and Staiger (2008) described the rationale and set
up for such a study: “Non-experimental estimates of teacher effects attempt to answer a
very specific question: If a given classroom of students were to have teacher A rather
than teacher B, how much different would their average test scores be at the end of the
year?” (p. 1). However, as these sorts of teacher effects estimates are derived from
conditions where non-random sorting is the norm (Clotfelter, Ladd, & Vigdor, 2006;
Rothstein, 2010), these models assume that statistical controls (e.g., students’ prior
achievement, demographic characteristics) are sufficient to isolate the talents and skills of
individual teachers rather than “principals’ preferential treatment of their favorite
colleagues, ability-tracking based on information not captured by prior test scores, or the
advocacy of engaged parents for specific teachers” (Kane & Staiger, 2008, p. 1).29
Random assignment of teachers to classes offers a way to test this assumption. If
non-experimental teacher effects are causal estimates that capture true differences in
quality between teachers, then these non-experimental or predicted differences should be
equal, on average, to actual differences following the random assignment of teachers to
classes. In other words, a 1 sd increase in predicted differences in achievement across
classrooms should result in a 1 sd increase in observed differences, on average. Estimates
greater than 0 sd would indicate that non-experimental teacher effects contain some
information content about teachers’ underlying talents and skills. However, deviations
from the 1:1 relationship would signal that these scores also are influenced by factors
beyond teachers’ control, including students’ background and skill, the composition of
29 See Bacher-Hicks et al., 2015 for an empirical analysis of persistent sorting in the classroom data used in this study.
120
students in the classroom, or strategic assignment policies. These deviations often are
referred to as “forecast bias.”
Results from Kane and Staiger (2008) and other experimental (Bacher-Hicks et al.,
2015; Glazerman & Pratik, 2015; Kane et al., 2013) studies have accumulated to provide
strong evidence against bias in teacher effects on students’ test scores. In a meta-analysis
of the three experimental studies with the same research design, where teachers were
randomly assigned to class rosters within schools,30 Bacher-Hicks et al. (2015) found a
pooled estimate of 0.95 sd relating predicted teacher effects on students’ math
achievement to actual differences in this same outcome. In all cases, predicted teacher
effects were calculated from models that controlled for students’ prior achievement.
Given the nature of their meta-analytic approach, the standard error around this estimate
(0.09) was much smaller than in each individual study and the corresponding 95%
confidence interval included 1 sd, thus indicting very little bias. This result was quite
similar to findings from three quasi-experimental studies in much larger administrative
datasets, which leveraged plausibly exogenous variation in teacher assignments due to
staffing changes at the school-grade level (Bacher-Hicks et al., 2014; Chetty et al, 2014a;
Rothstein, 2014).
Following a long line of inquiry around the sensitivity of value-added models to
different model specifications and which may be most appropriate for policy (Aaronson,
30 Glazerman and Protik (2015) exploited random assignment of teachers across schools as part of a merit pay program. Here, findings were more mixed. In the elementary sample, the authors estimated a standardized effect size relating non-experimental value-added scores (stacking across math and ELA) to student test scores following random assignment of roughly 1 sd. However, in their smaller sample, the standard error was large (0.34), meaning that they could not rule out potentially important degrees of bias. Further, in the middle school sample, they found no statistically significant relationship.
121
Barrow, & Sander, 2007; Blazar, Litke, & Barmore, 2016; Goldhaber & Theobald, 2012;
Hill, Kapitula, & Umland, 2011; Newton, Darling-Hammond, Haertel, & Thomas, 2010),
many of these studies also examined the predictive validity of alternative methods for
estimating teacher effects. For example, some have advocated for controlling for the
composition of students in the classroom, which is thought to influence test scores
beyond teachers themselves (Hanushek, Kain, Markman & Rivkin, 2003; Kupermintz,
2003; Thum & Bryk, 1997). Others have specified models that only compare teachers
within schools in order to limit bias due to sorting of teachers and students across schools
(Rivkin, Hanushek, & Kain, 2005); however, this approach can lead to large differences
in teacher rankings relative to models that compare teachers across schools (Goldhaber &
Theobald, 2012). The general conclusion across validation studies – both experimental
and quasi-experimental – is that controlling for students’ prior achievement is sufficient
to account for the vast majority of bias in teacher effect estimates on achievement (Chetty
et al., 2014a; Kane et al., 2013; Kane & Staiger, 2008). In other words, non-experimental
teacher effects on achievement that only control for students’ prior achievement come
closest to a 1:1 relationship when predicting current student outcomes.
To my knowledge, only one study has examined the validity of teacher effects on
student outcomes beyond test scores.31 Drawing on the quasi-experimental design
described by Chetty et al. (2014), Backes and Hansen (2015) examined the validity of
teacher effects on a range of observed school behaviors captured in administrative
records, including unexcused absences, suspensions, grade point average, percent of 31 In the MET project, Kane et al. (2013) examined whether a composite measure of teacher effectiveness predicted students’ attitudes and behaviors (i.e., grit, happiness in class, implicit theory of intelligence, student effort) following random assignment. However, given that measures used to calculate teacher effects differed across time, “there [was] no reason to expect the coefficient to be equal to one” (p. 35). Thus, findings should not be interpreted as evidence for or against bias in teacher effects on these outcomes.
122
classes failed, grade progression, and graduation from high school. Their study focused
specifically on teachers certified through Teach for America in Miami-Dade County.
Findings supported the validity of teacher effects on students’ suspensions and percent of
classes failed when looking across elementary, middle, and high schools, with estimates
that could be distinguished from 0 sd and could not be distinguished from 1 sd. Teacher
effects on unexcused absences, grade point average, and grade progression were valid at
some grade levels but biased at others. Interestingly, for both unexcused absences and
grade progression, predicted differences in student outcomes at the elementary level
overstated actual differences (i.e., coefficient less than 1 sd), likely due to sorting of
“better” students (i.e., those with few unexcused absences and who progressed from one
grade to the next on time) to “better” teachers in a way that could not be controlled for in
the model; the opposite was true at the high school level, where predicted differences
understated actual differences (i.e., coefficient greater than 1 sd). This suggests that bias
in teacher effects on outcomes beyond test scores may not be easily quantified or
classified across contexts.
3. Data and Sample
As in Bacher-Hicks et al. (2015) and Blazar and Kraft (2015), this paper draws on
data from the National Center for Teacher Effectiveness (NCTE), whose goal was to
develop valid measures of effective teaching in mathematics. Over the course of three
school years (2010-11 through 2012-13), the project collected data from participating
fourth- and fifth-grade teachers (N = 310) in four anonymous districts from three states
on the East coast of the United States. Participants were generalists who taught all subject
areas. This is important, as it provided an opportunity to estimate the contribution of
123
individual teachers to students’ attitudes and behaviors that was not confounded with the
effect of another teacher with whom a student engaged in the same year. Teacher-student
links were verified for all study participants based on class rosters provided by teachers.
Measures of students’ attitudes and behaviors came from a survey administered in
the spring of each school year (see Table 1 for a full list of items and descriptive statistics
generated from all available data). Based on theory and exploratory factor analyses (see
Blazar, Braslow, Charalambous, & Hill, 2015), I divided items into three constructs:
Behavior in Class (internal consistency reliability (𝛼) is 0.74), Self-Efficacy in Math (𝛼 =
0.76), and Happiness in Class (𝛼 = 0.82). Importantly, teacher reports of student behavior
and self-reports of versions of the latter two constructs have been linked to labor market
outcomes even controlling for cognitive ability (Chetty et al., 2011; Dee & West, 2011;
Lyubomirsky, King, & Diener, 2005; Mueller & Plug, 2006), lending strong
consequential validity to these metrics. Blazar and Kraft (2015) describe additional
validity evidence, including convergent validity, for these constructs. For each of these
outcomes, I created final scales by averaging student responses across all available items
and then standardizing to mean of zero and standard deviation of one.32 Standardization
occurred within school year but across grades.
Student demographic and achievement data came from district administrative
records. Demographic data included gender, race/ethnicity, free- or reduced-price lunch
(FRPL) eligibility, limited English proficiency (LEP) status, and special education
(SPED) status. These records also included current- and prior-year test scores in math and
32 For all three outcomes, composite scores that average across raw responses are correlated at 0.99 and above with scales that incorporate weights from the factor analyses.
124
English Language Arts (ELA) on state assessments, which were standardized within
district by grade, subject, and year using the entire sample of students in each district,
grade, subject, and year.
I focused on two subsamples from the larger group of 310 teachers. The primary
analytic sample includes the subset of 41 teachers who were part of the random
assignment portion of the NCTE study in the third year of data collection. I describe this
sample and the experimental design in detail below. The second sample includes the set
of teachers whose students took the project-administered survey in both the current and
prior years. This allowed me to test the sensitivity of teacher effect estimates to different
model specifications, including those that controlled for students’ prior survey responses,
from a balanced sample of teachers and students. As noted above, the student survey only
was administered in the spring of each year; therefore, this sample consisted of the group
of fifth-grade teachers who happened to have students who also were part of the NCTE
study in the fourth grade (N = 51).33
Generally, I found that average teacher characteristics, including their gender,
race, math course taking, math knowledge, route to certification, years of teaching
experience, and value-added scores calculated from state math tests, were similar across
samples.34 Given that teachers self-selected into the NCTE study, I also tested whether
33 This sample size is driven by teachers whose students had current- and prior-year survey responses for Happiness in Class, which was only available in two of the three years of the study. Additional teachers and students had current- and prior-year data for Behavior in Class (N = 111) and Self-Efficacy in Math (N = 108), both of which were available in all three years of the study. However, for consistency, I limit this sample to teachers and students who had current- and prior-year scores for all three survey measures. 34 Information on teachers’ background and knowledge were captured on a questionnaire administered in the fall of each year. Survey items included years teaching math, route to certification, amount of undergraduate or graduate coursework in math and math courses for teaching (1 = No classes, 2 = One or two classes, 3 = Three to five Classes, 4 = Six or more classes). For simplicity, I averaged these last two items to form one construct capturing teachers’ mathematics coursework. Further, the survey included a
125
these samples differed from the full population of fourth- and fifth-grade teachers in each
district with regard to value-added scores on the state math test. Although I found a
marginally significant difference between the full NCTE sample and the district
populations (0.02 sd in former and 0 sd in the latter; p = .065), I found no difference
between the district populations and either the experimental or non-experimental
subsamples used in this analysis (p = .890 and .652, respectively; not shown in Table 2).
These similarities lend important external validity to findings presented below.
4. Experimental Design
In the spring of 2012, the NCTE project team worked with staff at participating
schools to randomly assign sets of teachers to class rosters of the same grade level (i.e.,
fourth- or fifth-grade) that were constructed by principals or school leaders. To be
eligible for randomization, teachers had to work in schools and grades in which there was
at least one other participating teacher. In addition, their principal had to consider these
teachers as capable of teaching any of the rosters of students designated for the group of
teachers.
In order to fully leverage this experimental design, it was important to limit the
most pertinent threat to internal validity: attrition caused by non-compliance amongst
participating teachers and students (Murnane & Willet, 2011). My general approach here
was to focus on randomization blocks in which attrition and non-compliance was not a
concern. As these blocks are analogous to individual experiments, dropping them should
test of teachers’ mathematical content knowledge, with items from both the Mathematical Knowledge for Teaching assessment (Hill, Schilling, & Ball, 2004) and the Massachusetts Test for Educator Licensure. Teacher scores were generated by IRTPro software and standardized in these models, with a reliability of 0.92. (For more information about these constructs, see Hill, Blazar, & Lynch, 2015).
126
not threaten the internal validity of my results. First, I restricted the sample to
randomization blocks where teachers had both current-year student outcomes and prior-
year teacher effect estimates. Of the original 79 teachers who agreed to participate and
were randomly assigned to class rosters within schools, seven teachers dropped before
the beginning of the 2012-13 school year for reasons unrelated to the experiment.35 One
teacher left the district, one left teaching, one was on maternity leave for part of the year,
and four moved teaching positions making them ineligible for random assignment (e.g.,
team teaching, moved to third grade, grade departmentalized). An additional 11 teachers
only were part of the NCTE study in the third year and, therefore, did not have the
necessary data from prior years to calculate non-experimental teacher effects on students’
attitudes and behaviors. This is because student surveys only were collected through the
NCTE project and were not available in pre-existing administrative data. I further
dropped the seven teachers whose random assignment partner left from the study for
either of the two reasons above.36
Next, I restricted the remaining sample to randomization blocks with low levels of
non-compliance amongst participating students. Here, non-compliance refers to the fact
that some students switched out of their randomly assigned teacher’s classroom. Other
studies that exploit random assignment between teachers and students, such as MET,
35 Two other teachers from the same randomization block also agreed to participate. However, the principal decided that it was not possible to randomly assign rosters to these teachers. Thus, I exclude them from all analyses. 36 One concern with dropping teachers in this way is that they may differ from other teachers on post-randomization outcomes, which could bias results. Comparing attriters for whom I had post-randomization data (N = 21, which excludes the four teachers who either left teaching, left the district, moved to third grade and therefore out of my dataset, or were on maternity leave) to the remaining teachers (N = 54) on their observed effectiveness at raising student achievement in the 2012-13 school year, I found no difference (p = .899). Further, to ensure strong external validity, I compared attriters to the experimental sample on each of the teacher characteristics listed in Table 2 and found no difference on any (results available upon request).
127
have accounted for non-compliance through instrumental variables estimation and
calculation of treatment on the treated (Bacher-Hicks et al., 2015; Glazerman & Protik,
2015; Kane et al., 2013). However, this approach was not possible in this study, given
that students who transferred out of an NCTE teacher’s classroom no longer had survey
data to calculate teacher effects on these outcomes. Further, I would have needed to know
the prior student survey results for these students’ actual teachers, which I did not. In
total, 28% of students moved out of their randomly assigned teachers’ classroom (see
Appendix Table 1 for information on reasons for and patterns of non-compliance).
However, non-compliance was nested within a small subset of six randomization blocks.
In these blocks, rates of non-compliance ranged from 40% to 82%, due predominantly to
principals and school leaders who made changes to the originally constructed class
rosters. By eliminating these blocks, I am able to focus on a sample with a much lower
rate of non-compliance (11%) and where patterns of non-compliance are much more
typical. The remaining 18 blocks had a total of 67 non-compliers and an average rate of
non-compliance of 9% per block; three randomization blocks had full compliance.
In Table 3, I confirm the success of the randomization process among the teachers
in my final analytic sample (N = 41) and the students on their randomly assigned rosters
(N = 598).37 In a traditional experiment, one can examine balance at baseline by
calculating differences in average student characteristics between the treatment and
control groups. In this context, though, treatment consisted of multiple possible teachers
within a given randomization block. Thus, to examine balance, I instead examined the
relationship between the assigned teacher’s predicted effectiveness at improving students’
37 Thirty-eight students were hand placed in teachers’ classrooms after the random assignment process. As these students were no part of the experiment, they were excluded from these analyses.
128
state math test scores in the 2012-13 school year and baseline student characteristics
captured in 2011-12.38 Specifically, I regressed these teacher effect estimates on a vector
of observable student characteristics and fixed effects for randomization blocks. As
expected, observable student characteristics were not related to teacher effects on math
test scores, either tested individually or as a group (p = .279), supporting the fidelity of
the randomization process. Even though this sample includes some non-compliers, these
students looked similar to compliers on observable baseline characteristics, as well as the
observed effectiveness of their randomly assigned teacher at improving state math test
scores in years prior to random assignment (see Table 4).39 This latter comparison is
particularly important, as it suggests that students were not more likely to leave their
teachers’ classroom if they were assigned to a low-quality one. If the opposite were true,
this could lead to bias, as I would be left only with students who liked their randomly
assigned teacher. As such, I am less concerned about having to drop the few non-
compliers left in my sample from all subsequent analyses.
5. Empirical Strategy
For all analyses, I began with the following model of student production:
(1) 𝑂𝑈𝑇𝐶𝑂𝑀𝐸!"#$%& = 𝛼𝑓(𝐴!"!!)+ 𝜁𝑂𝑈𝑇𝐶𝑂𝑀𝐸!"!! + 𝜋𝑋!" + 𝜑𝑋!"! + 𝜑𝑋!"! +
𝜙!"# +
38 See Equation (1) below for more details on these predictions. 39 Twenty-six students were missing baseline data on at least one characteristic. In order to retain all students, I imputed missing data to the mean of the students’ randomization block. I take the same approach to missing data in all subsequent analyses. This includes the 19 students who were part of my main analytic sample but happened to be absent on the day that project managers administered the student survey and, thus, were missing outcome data. This approach to imputation seems reasonable given that there was no reason to believe that students were absent on purpose to avoid taking the survey.
129
𝜀!"#$%&
𝑂𝑈𝑇𝐶𝑂𝑀𝐸!"#$%&' was used interchangeably for each student survey construct – i.e.,
Behavior in Class, Self-Efficacy in Math, and Happiness in Class – for student i in district
d, school s, grade g taught by teacher j in year t. Throughout the paper, I test a variety of
alternative value-added models that include different combinations of control variables.
The full set of controls includes a cubic function of students’ prior achievement, 𝐴!"!!, in
both math and ELA; a prior measure of the outcome variable, 𝑂𝑈𝑇𝐶𝑂𝑀𝐸!"!!; student
demographic characteristics, 𝑋!", including gender, race, free or reduced-price lunch
eligibility, special education status, and limited English proficiency; these same test-score
variables and demographic characteristics averaged to the class level, 𝑋!"! , and school
level, 𝑋!"! ; school fixed effects, 𝜎!, or school-by-grade fixed effect, 𝜎!", which replace
school characteristics in some models; and district-by-grade-by-year fixed effects, 𝜙!"#,
that account for scaling of prior-year test scores at this level.
To generate teacher effect estimates, 𝜏!"! , from Equation (1), I took two
approaches. Each has both strengths and limitations. First, I calculated teacher effects by
averaging student-level residuals to the teacher level. I did so separately for each outcome
measure, as well as with several different model specifications denoted by the superscript,
S. This approach is intuitive, as it creates estimates of the contribution of teachers to
student outcomes above and beyond factors already controlled for in the model. It also is
computational simple.40 At the same time, measurement error in these estimates due to
40 An alternative fixed-effects specification is preferred by some because it does not assume that teacher assignment is correlated with factors that predict student achievement (Guarino, Maxfield, Reckase, Thompson, & Woolridge, 2015). However, in these data, this approach returned similar estimates in models
130
sampling idiosyncrasies, adverse conditions for data collection, etc. will lead me to
overstate the variance of true teacher effects; it also will attenuate the relationship
between different measures of teacher effectiveness (e.g., measures at two points in time),
even if they capture the same underlying construct. Therefore, I also calculated Empirical
Bayes (EB) estimates that take into account measurement error and shrink teacher effects
back toward the mean based on their precision. To do so, I included a teacher-level
random effect in the model in order to generate model-based estimates. These models
were fit using restricted maximum likelihood. While shrinking teacher effects is
commonplace in both research and policy (Koedel, Mihaly, & Rockoff, 2015), EB
estimates are biased downward relative to the size of the measurement error (Jacob &
Lefgren, 2005).
I utilized these teacher effect estimates for three subsequent analyses. First, I
estimated the variance of 𝜏!"! in order to examine whether teachers vary in their
contributions to students’ attitudes and behaviors. I compared the variance of teacher
effects generated from the experimental sample, my preferred estimates, to those
generated from the non-experimental sample. Given that the true variance of teacher
effects are bounded between the unshrunken and shrunken estimates (Raudenbush &
Bryk, 2002), I present an average of the two (see Kraft & Grace, 2016 for a similar
approach).
Second, I examined the sensitivity of 𝜏!"! to different model specifications. Here, I
focused on the non-experimental, balanced sample of teachers and samples with full data
where it was feasible to include teacher fixed effects in addition to the other set of control variables, with correlations of 0.99 or above.
131
on all possible background measures. Prior experimental and quasi-experimental research
indicates that controlling for students’ prior test scores accounts for the vast majority of
bias in teacher effects on students’ academic achievement (Chetty et al., 2014a; Kane et
al., 2013; Kane & Staiger, 2008). If bias in these teacher effects is due predominantly to
sorting mechanisms, then this approach may also work to reduce bias in teacher effects
on student outcomes beyond test scores. This is because sorting is an organizational
process in schools that should operate in the same way no matter the outcome of interest.
At the same time, there may be unobservable characteristics that are related to students’
attitudes and behaviors but not to achievement outcomes. Therefore, I examined whether
teacher effects were sensitive to additional controls often available in administrative
datasets (e.g., student, class, and school characteristics), as well as students’ prior survey
responses. Some researchers also have raised concern about “reference bias” in students’
self-reported survey responses (Duckworth & Yeager, 2015; West et al., 2016). By
reference bias I mean that school-wide norms around behavior or engagement likely
create an implicit standard of comparison that students use when they judge their own
behavior or engagement. Thus, I also examined models that estimated teacher effects
using school fixed effects, which compare students and teachers only to others within the
same school.
In my third and final set of analyses, I examined whether non-experimental
teacher effect estimates calculated in years prior to 2012-13 predicted student outcomes
following random assignment. The randomized design allowed for a straightforward
analytic model:
(2) 𝑂𝑈𝑇𝐶𝑂𝑀𝐸!"#$!"#!!!" = 𝛿𝜏!"!!"#!!!"! + 𝜈!" + 𝜖!"#$%
132
As above, 𝑂𝑈𝑇𝐶𝑂𝑀𝐸!"#$!"#!!!" was used interchangeably for each of my measures of
students’ attitudes and behaviors. I predicted these outcome measures in the random
assignment year, 2012-13, with predicted, pre-experimental teacher effect estimates,
𝜏!"!!"#!!!"! .41 That is, when Behavior in Class is the outcome of interest, 𝜏!"!!"#!!!"! ,
represents teachers’ effectiveness at improving Behavior in Class in prior years; when
Self-Efficacy in Math is the outcome of interest, 𝜏!"!!"#!!!"! , represents teachers’
effectiveness at improving Self-Efficacy in Math in prior years. Following the research
design, I included fixed effects for each randomization block, 𝜈!". In order to increase the
precision of my estimates, I estimated non-experimental teacher effects using all
available teacher-years outside of the experimental sample. For the same reason, in
Equation (2), I also controlled for students’ prior achievement, demographic
characteristics, and class characteristics captured from the randomly assigned rosters.
Standard errors were clustered at the class level to account for the nested structure of the
data.
My parameter of interest is 𝛿, which describes the relationship between non-
experimental teacher effect estimates and current student outcomes. As in Kane and
Staiger (2008), I examined whether these estimates had any predictive validity (i.e.,
whether they were statistically significantly different from 0 sd) and whether they
contained some degree of bias (i.e., whether they were statistically significantly different
from 1 sd).
6. Results
41 In order to increase the precision of these estimates, I included all available teacher-years outside of the experimental sample.
133
6.1. Magnitude of Teacher Effects on Students’ Attitudes and Behaviors
In Table 5, I present results describing the extent to which teachers vary in their
contribution to students’ attitudes and behaviors. Estimates represent the standard
deviation of the teacher-level variance, averaged across the model-based EB estimates
and the unshrunken estimates. For both the experimental and non-experimental samples, I
vary the control set within certain constraints. All models control for students’ prior
achievement in math and ELA, which is standard practice when estimating teacher
effects. All models drawing on the non-experimental sample further control for student
characteristics, class characteristics, and either school or school-by-grade fixed effects to
attempt to limit bias due to non-random sorting. Classroom-level controls in these models
and some of the experimental sample models also aim to remove the contribution of peer
effects from the teacher effect estimates. It was not possible to model classroom-level
shocks directly, as data were not available over multiple school years. In the experimental
sample, class characteristics describe the set of students included on the randomly
assigned rosters rather than the students who ultimately stayed in that classroom. Finally,
all models drawing on the experimental sample include school-by-grade fixed effects to
match the randomized design.
Drawing on the preferred experimental sample, I find that indeed teachers have
substantive impacts on students’ Behavior in Class, Self-Efficacy in Math, and Happiness
in Class. The largest of these effects is for Happiness in Class, where a 1 sd increase in
teacher effectiveness leads to a roughly 0.30 sd increase in this self-reported outcome. To
place this estimate in perspective, average within-school teacher effects on students’
academic performance are 0.15 sd in math and 0.11 sd in reading (Hanushek & Rivik,
134
2010). In the experimental sample from this dataset, I find teacher effects on student test
scores between 0.14 sd and 0.18 sd. The magnitude of teacher effects on students’
Behavior in Class and Self-Efficacy in Math are much closer to these estimates, in the
range of 0.12 sd to 0.17 sd. Unlike for Self-Efficacy in Math and Happiness in Class,
results for Behavior in Class are somewhat sensitive to the set of controls included in the
model, with the smallest estimate for the model that includes student and class
characteristics. This is consistent with other literature suggesting that, if anything,
controlling for observable class or peer characteristics produces a conservative estimate
of the magnitude of teacher effects on student test scores (Kane et al., 2013; Thompson,
Guarino, &Wooldridge, 2015).
Compared to estimates from the experimental sample, those in the non-
experimental sample are similar in magnitude for Behavior in Class and Happiness in
Class but smaller for Self-Efficacy in Math. These differences may be due to sampling
idiosyncrasies. Or, it could be that non-experimental conditions understate the variance of
true teacher effects on students’ Self-Efficacy in Math. Notably, limiting variation to
school-by-grade cells as opposed to schools or excluding prior-year survey responses
does not appear to change results.
6.2. Sensitivity of Teacher Effects Across Model Specifications
In Tables 6a and 6b, I present results describing the relationship between teacher
effects on students’ attitudes and behaviors across model specifications. I only present
correlations between EB teacher effect estimates, as patterns of results are almost
identical when using the unshrunken estimates.
135
In the first of these tables, I examine the correlations between teacher effects that
control for prior achievement (Model 1), for prior measures of the survey outcomes
(Model 2), or both (Model 3). For all three outcome measures – Behavior in Class, Self-
Efficacy in Math, and Happiness in Class – I find correlations of teacher effects across
model specifications above 0.86. As expected, the smallest of these correlations describe
the relationship between teacher effects that control either for prior achievement (Model
1) or for students’ prior survey responses (Model 2), of 0.90 for teacher effects on
Behavior in Class, 0.86 for Self-Efficacy in Math, and 0.96 for Happiness in Class.
However, these correlations still are quite strong. Correlations between teacher effects
from models that have overlapping sets of controls (i.e., between Models 1 and 3 or
between Models 2 and 3) are stronger, between 0.90 and 0.99. This suggests that teacher
effects on these student attitudes and behaviors are not particularly sensitive to inclusion
of prior achievement or prior survey responses. In light of these findings, I exclude prior
measures of students’ attitudes and behaviors from all subsequent analyses, which allows
me to retain the largest possible sample of teachers and students. As noted above, only a
subset of students completed the survey in the prior year, while all students had prior test
scores.
Next, I examine the sensitivity of teacher effects on students’ attitudes and
behaviors from this baseline model (Model 1) to models that control for additional
student, class, and school characteristics (see Table 6b). Here, I find that teacher effects
on these outcomes are not sensitive to student demographic characteristics but are
sensitive to additional control variables. Correlations between teacher effect estimates
from Model 1 (which controls for prior test scores) and from Model 4 (which builds on
136
Model 1 by adding student demographic characteristics) are between 0.98 and 0.99. For
Behavior in Class and Self-Efficacy in Math, correlations between estimates from Model
1 and from Model 5 (which builds on previous models by adding classroom
characteristics) are substantively smaller, at 0.69 and 0.82, respectively; for Happiness in
Class, the correlation stays above 0.90. Adding school characteristics to teacher effect
specifications appears to have the largest impact on teacher rankings. Correlations
between estimates from Model 1 and from Model 6 (which builds on previous models by
adding school characteristics) range from 0.63 to 0.71, while correlations between
estimates from Model 1 and from Model 7 (which replaces school characteristics with
school fixed effects) range from 0.41 to 0.66. Correlations between estimates from
Models 6 and 7 (not shown in Table 6) are 0.70, 0.71, and 0.92 for Behavior in Class,
Self-Efficacy in Math, and Happiness in Class, respectively.
One explanation for these lower correlations in models that do and do not control
for school fixed effects may be related to reference bias, which has been shown to
influence measurement of students’ survey responses across school settings (West et al.,
2016). This may be particularly relevant for Behavior in Class, where management
policies – and, thus, students’ perception of what good or bad behavior looks like – often
are set at the school level. At the same time, these correlations are well within the range
reported in other studies looking at the sensitivity of teacher effects on test scores across
models that control for school characteristics or school fixed effects, between roughly 0.5
and 0.9 (Aaronson et al., 2007; Goldhaber & Theobald, 2012; Hill et al., 2011).
6.3. Predictive Validity of Non-Experimental Teacher Effects
137
In Table 7, I report estimates describing the relationship between non-
experimental teacher effects on students’ attitudes and behaviors and these same
outcomes following random assignment. Non-experimental estimates in Panel A are EB
estimates, while those in Panel B are unshrunken estimates. Cells contain estimates from
separate regression models of each attitude or behavior listed in each column on teacher
effects on this same outcome modeled from five separate equations. As noted above, I
exclude teacher effects calculated from Models 2 and 3, both of which controlled for
prior measures of students’ attitudes and behaviors. P-values testing the null hypothesis
that effect sizes are equal to 1 sd are presented next to each estimate.
Comparison of estimates across Panel A and Panel B reveals two patterns. First,
estimates relating non-experimental EB teacher effect estimates to current student
outcomes are larger than estimates relating unshrunken estimates to current outcomes.
This makes sense, as EB estimates are adjusted for the amount of measurement error the
unshrunken estimates contain. Measurement error will attenuate the relationship between
two teacher effect estimates, even if the true relationship is equal to 1 sd. At the same
time, relationships between EB estimates and current student outcomes are measured less
precisely than relationships drawing on unshrunken teacher effect estimates in Panel B.
This also makes sense, as EB estimates provide a lower bound on the variation of true
teacher effects, and decreased variation in the independent variable decreases statistical
power. Thus, in interpreting the predictive validity of non-experimental teacher effects, I
focus on trends across these two sets of results.
For Behavior in Class, I find that non-experimental teacher effect estimates have
strong predictive validity. Examining the EB estimates, I find that teacher effects with the
138
best predictive validity come from Model 1, which calculates non-experimental teacher
effects only controlling for students’ prior achievement. Here, I find an estimate of 1.06
sd that is close to the hypothesis described by Kane and Staiger (2008), that predicted
differences across classroom should equal observed differences. At the same time, the
standard error around this estimate is large (0.25) and, thus, does not allow me to rule out
potentially large and important degrees of bias. In other models in Panel A, predicted
differences in student outcomes understate actual differences (i.e. coefficient greater than
1 sd), suggesting that students with lower self-reported behavior are sorted to higher-
quality teachers. Examining the unshrunken estimates, predicted differences all overstate
actual differences (i.e., coefficient less than 1 sd). This contradictory finding likely can be
attributed to measurement error in the unshurnken estimates, which attenuate the
relationship between prior- and current-year outcomes. Here, too, the relationships
between non-experimental teacher effects and current student outcomes come close to 1
sd but still do not allow me to rule out bias completely.
For both Self-Efficacy in Math and Happiness in Class, non-experimental teacher
effect estimates have moderate predictive validity. Generally, I can distinguish estimates
from 0 sd, indicating that they contain some information content on teachers. The
exception is EB estimates for Self-Efficacy in Math. Here, magnitudes fall in the range of
0.49 sd to 0.57 sd, which is similar to patterns of results drawing on the unshrunken
estimates. However, standard errors are much larger, and in all cases the 90% confidence
intervals cross 0 sd. For these two outcomes, in almost all cases I also can distinguish
these estimates from 1 sd, indicating that they do contain some bias. For Happiness in
139
Class, the sample size is reduced by one teacher who did not have non-experimental
teacher effects on this outcome.
7. Conclusion
Random assignment of teachers to students provides a unique opportunity to
validate different measures of teacher effectiveness. In the Project STAR experiment
from the 1970s, random assignment helped researchers confirm the substantive effect that
teachers have on their students’ academic performance (Nye et al., 2004). Over the last
decade, researchers have leveraged data from subsequent experiments to validate the use
of non-experimental methods for estimating teacher effects on students’ test scores
(Bacher-Hicks et al., 2015; Kane et al., 2013; Kane & Staiger, 2008; Glazerman & Protik,
2015). These studies have been consistent in their findings: controlling for students’ prior
achievement accounts for the vast majority of bias in teacher effects on students’ current
achievement. Thus, the evidence to date suggests that researchers and policymakers may
no longer not need to rely on experiments and random assignment in order to identify
teachers who are effective at raising test scores.
It is not clear that the same conclusion holds with regard to identifying teachers
who are effective at improving students’ attitudes and behaviors beyond test scores. In
this study, I leverage random assignment of teachers to students in order to confirm the
effect that teachers have on students’ self-reported attitudes and behaviors. Indeed,
teachers do vary in their contributions to students’ Behavior in Class, Self-Efficacy in
Math, and Happiness in Class. In fact, teacher effects on this latter outcome (roughly
0.30 sd) are almost twice as large as teacher effects on students’ academic performance,
140
both in this and a number of other studies (Hanushek & Rivkin, 2010). These results are
consistent with findings from the other random assignment study examining the
magnitude of teacher effects on students’ growth mindset, grit, and effort in class (Kraft
& Grace, 2016). They also are consistent with a handful of non-experimental studies
examining the magnitude of teacher effects on other attitudes and behaviors reported
from surveys (Jennings & DiPrete, 2010; Ruzek et al., 2014), as well as students’
observed school behaviors (Backes & Hansen, 2015; Gershenson, 2016; Jackson, 2012;
Koedel, 2008; Ladd & Sorenson, 2015).
Unlike for teacher effects on students’ academic performance, though, prior test
scores (and other data easily available in administrative datasets) often are insufficient to
account for bias due to the non-random sorting of students to teachers and the
confounding effects of past experiences on current student outcomes. For all three
attitudes and behaviors assessed in this study, non-experimental teacher effects predict
the same outcomes following random assignment with estimates that can be distinguished
from 0 sd. Thus, these non-experimental teacher effect estimates do contain important
information content on teachers’ true underlying ability. At the same time, I can confirm
that many of these teacher effects also contain important degrees of bias. For Self-
Efficacy in Math and Happiness in Class, in particular, predicted differences fall short of
actual differences following random assignment. One exception here is teacher effects on
students’ Behavior in Class, where I find estimates relating non-experimental teacher
effects to current student outcomes quite close to 1 sd. However, the confidence intervals
around these estimates are sizeable. Thus, additional evidence from larger studies with
greater statistical power is necessary before determining that teacher effects on students’
141
Behavior in Class contain no bias. In the only other study to assess the validity of teacher
effects on student outcomes beyond test scores, Backes and Hansen (2015) also find
variation in the degree of bias across measures. For example, non-experimental teacher
effects on students’ suspensions and percent of classes failed seem to contain little bias
(with estimates of 0.92 sd [se = 0.12] and 0.94 [se = 0.08], respectively), while teacher
effects on GPA do contain bias (estimate of 1.23 sd [se = 0.07]). The degree of bias also
changes substantively across grade levels.
It is still possible that, with access to additional sets of controls, value-added
approaches may be able to produce non-biased estimates of teacher effects on students’
attitudes and behaviors. Notably, though, the sorts of control variables that may be
necessary to reduce bias even further likely are not easily accessible in administrative
datasets. In this study, teacher effects on students’ attitudes and behaviors were not
particularly sensitive to inclusion of students’ prior survey responses in addition to their
prior achievement. Although I did not assess the degree of bias in teacher effects that
controlled for both prior achievement and prior survey responses due to a small sample in
the experimental portion of the study with both sets of measures, correlations across
model specification in the non-experimental sample suggest that findings would not be
any different. Backes and Hansen (2016) controlled for prior measures of their non-tested
outcomes in all models and still found large degrees of bias in some instances. If prior
measures of the outcome, in addition to prior achievement, are insufficient to eliminate
bias, it is unclear what would be sufficient.
Where does this leave policy and research? As I (Blazar & Kraft, 2015) and
others (Duckworth & Yeager, 2015; Kraft & Grace, 2016; West et al., 2016) have argued
142
elsewhere, there are a number of reasons to be concerned about incorporating these sorts
of measures into policy settings. The discussion of possible bias that others discuss in the
abstract (Duckworth & Yeager, 2015) and that I show empirically suggest that these
measures are not currently appropriate for use in accountability systems, such as teacher
evaluation, despite the fact that many states and districts already are moving in this
direction. As of 2016, 36 states list student surveys or “non-cognitive” school behaviors
as possible sources of data when evaluating their teacher workforces (Center of Great
Teachers and Leaders, 2013). The Every Student Succeeds Act (ESSA) also mandates
that states select a non-academic indicator with which to assess students’ success in
school (ESSA, 2015). Perhaps teacher effects on students’ behavior in class is an
exception. However, it is still important to remind readers that results from this study
come from data collected under low-stakes conditions. It is quite possible that high-stakes
environments may introduce additional sources of bias including cheating. Prior to using
student surveys – or even more objective measures of students’ attitudes and behaviors
such as absences and suspensions – when evaluating teachers, school leaders will need
assurance that use of these measures does not result in “corrupt[ion of] the social
processes [they are] intended to monitor” (Campbell, 1977, p. 85), which many argue
already has occurred with use of test scores (Fuller, Wright, Gesicki, & Kang, 2007;
Koretz, 2008).
Instead, the important task of identifying ways for teachers to improve students’
attitudes and behaviors likely falls on researchers. In particular, we likely want to conduct
more and learn as much as possible from random assignment studies.
143
Works Cited
Aaronson, D., Barrow, L., & Sander, W. (2007). Teachers and student achievement in the
Chicago public high schools. Journal of Labor Economics, 25(1), 95-135.
Bacher-Hicks, A., Chin, M., Kane, T. J., & Staiger, D. O. (2015, March). Validating
components of teacher effectiveness: A random assignment study of value added,
classroom observation, and student perception survey scores. Paper presented at
the Society for Research on Educational Effectiveness annual conference,
Washington, DC.
Bacher-Hicks, A., Kane, T. J., & Staiger, D. O. (2014). Validating Teacher Effect
Estimates Using Changes in Teacher Assignments in Los Angeles (No. w20657).
National Bureau of Economic Research.
Backes, B., & Hansen, M. (2015). Teach for America impact estimates on nontested
student outcomes. Working Paper 146. Washington, D C: National Center for
Analysis of Longitudinal in Education Research.
Blazar, D. & Kraft, M. A. (2015). Teacher and teaching effects on students’ academic
behaviors and mindsets. Working Paper No. 41. Cambridge, MA: Mathematica
Policy Research. Retrieved from: https://www.mathematica-mpr.com/our-publications-
and-findings/publications/teacher-and-teaching-effects-on-students-academic-behaviors-
and-mindsets
Blazar, D., Litke, E., & Barmore, J. (2016). What does it mean to be ranked a “high” or
“low” value-added teacher? Observing differences in instructional quality across
districts. American Educational Research Journal, 53(2), 324-359.
144
Campbell, D. T. (1979). Assessing the impact of planned social change. Evaluation and
Program Planning, 2(1), 67-90.
Center on Great Teachers and Leaders (2013). Databases on state teacher and principal
policies. Retrieved from: http://resource.tqsource.org/stateevaldb.
Chetty, R., Friedman, J. N., Hilger, N., Saez, E., Schanzenbach, D., & Yagan, D. (2011).
How does your kindergarten classroom affect your earnings? Evidence from
Project STAR. Quarterly Journal of Economics, 126(4), 1593-1660.
Chetty, R., Friedman, J. N., & Rockoff, J. E. (2014a). Measuring the impacts of teachers
I: Evaluating Bias in Teacher Value-Added Estimates. American Economic
Review, 104(9), 2593-2632.
Chetty, R., Friedman, J. N., & Rockoff, J. E. (2014b). Measuring the impacts of teachers
II: Teacher Value-Added and Student Outcomes in Adulthood. American
Economic Review, 104(9), 2633-2679.
Clotfelter, C. T., Ladd, H. F., & Vigdor, J. L. (2006). Teacher-student matching and the
assessment of teacher effectiveness. Journal of Human Resources, 41(4), 778-820.
Dee, T. S., & West, M. R. (2011). The non-cognitive returns to class size. Educational
Evaluation and Policy Analysis, 33(1), 23-46.
Dee, T. S., & Wyckoff, J. (2015). Incentives, selection, and teacher performance:
Evidence from IMPACT. Journal of Policy Analysis and Management, 34(2),
267-297.
Duckworth, A. L., Quinn, P. D., & Tsukayama, E. (2012). What No Child Left Behind
leaves behind: The roles of IQ and self-control in predicting standardized
145
achievement test scores and report card grades. Journal of Educational
Psychology, 104(2), 439-451.
Duckworth, A. L., & Yeager, D. S. (2015). Measurement matters: Assessing personal
qualities other than cognitive ability for educational purposes. Educational
Researcher, 44(4), 237-251.
The Every Student Succeeds Act, Public Law 114-95, 114th Cong., 1st sess. (December
10, 2015), available at https://www.congress.gov/bill/114th-congress/senate-
bill/1177/text.
Fuller, B., Wright, J., Gesicki, K., & Kang, E. (2007). Gauging growth: How to judge No
Child Left Behind? Educational Researcher, 36(5), 268-278.
Gershenson, S. (2016). Linking teacher quality, student attendance, and student
achievement. Education Finance and Policy, 11(2).
Glazerman, S. & Protik, A., (2015). Validating Value-Added Measures of Teacher
Performance. Working Paper. Retrieved from:
https://www.aeaweb.org/aea/2015conference/program/retrieve.php?pdfid=1241
Goldhaber, D., & Theobald, R. (2012). Do different value-added models tell us the same
things? Retrieved from: http://www.carnegieknowledgenetwork.org/wp-
content/uploads/2012/10/CKN_2012-10_Goldhaber.pdf
Guarino, C., Maxfield, M., Reckase, M., Thompson, P., and Wooldridge, J. (2015) An
evaluation of Empirical Bayes’ estimation of value-added teacher performance
measures, Journal of Educational and Behavioral Statistics, 40(2), 190-222.
Hanushek, E. A., Kain, J. F., Markman, J. M., & Rivkin, S. G. (2003). Does peer ability
146
affect student achievement? Journal of Applied Econometrics, 18(5), 527–544.
Hanushek, E. A., & Rivkin, S. G. (2010). Generalizations about using value-added
measures of teacher quality. American Economic Review, 100(2), 267-271.
Heckman, J. J., Pinto, R. & Savelyev, P. (2013). Understanding the mechanisms through
which an influential early childhood program boosted adult outcomes. American
Economic Review 103(6), 2052-2086.
Heckman, J. J., Stixrud, J., & Urzua, S. (2006). The effects of cognitive and non
cognitive abilities on labor market outcomes and social behavior. Journal of
Labor Economics, 24(3), 411-482.
Hill, H. C., Blazar, D., & Lynch, K. (2015). Resources for teaching: Examining personal
and institutional predictors of high-quality instruction. AERA Open, 1(4), 1-23.
Hill, H. C., Kapitula, L., & Umland, K. (2011). A validity argument approach to
evaluating teacher value-added scores. American Educational Research
Journal, 48(3), 794-831.
Hill, H. C., Schilling, S. G., & Ball, D. L. (2004). Developing measures of teachers’
mathematics knowledge for teaching. The Elementary School Journal, 105(1), 11-
30.
Jackson, C. K. (2012). Non-cognitive ability, test scores, and teacher quality: Evidence
from ninth grade teachers in North Carolina. NBER Working Paper No. 18624.
Cambridge, MA: National Bureau for Economic Research.
147
Jacob, B., & Lefgren, L. (2005). Principals as agents: Subjective performance
assessment in education. NBER Working Paper No. 11463. Cambridge, MA:
National Bureau for Economic Research.
Jennings, J. L. & DiPrete, T. A. (2010). Teacher effects on social and behavioral skills in
early elementary school. Sociology of Education, 83(2), 135-159.
Kane, T. J., McCaffrey, D. F., Miller, T., & Staiger, D. O. (2013). Have we identified
effective teachers? Validating measures of effective teaching using random
assignment. Seattle, WA: Bill and Melinda Gates Foundation.
Kane, T. J., & Staiger, D. O. (2008). Estimating teacher impacts on student achievement:
An experimental evaluation (No. w14607). National Bureau of Economic
Research.
Koedel, C. (2008). Teacher quality and dropout outcomes in a large, urban school district.
Journal of Urban Economics, 64(3), 560-572.
Koedel, C., Mihaly, K., & Rockoff, J. E. (2015). Value-added modeling: A
review. Economics of Education Review, 47, 180-195.
Koretz, D. M. (2008). Measuring up. Harvard University Press.
Kraft, M. A., & Grace, S. (2016). Teaching for tomorrow’s economy? Teacher effects on
complex cognitive skills and social-emotional competencies. Working Paper.
Brown University. Retrieved from:
http://scholar.harvard.edu/files/mkraft/files/teaching_for_tomorrows_economy_-
_final_public.pdf?m=1455588369
148
Kupermintz, H. (2003). Teacher effects and teacher effectiveness: A validity
investigation of the Tennessee Value Added Assessment System. Educational
Evaluation and Policy Analysis, 25(3), 287–298.
Ladd, H. F., & Sorensen, L. C. (2015). Returns to teacher experience: Student
achievement and motivation in middle school. Calder Working Paper No. 112.
Retrieved from
http://www.caldercenter.org/sites/default/files/WP%20112%20Update_0.pdf
Lindqvist, E., & Vestman, R. (2011). The labor market returns to cognitive and non-
cognitive ability: Evidence from the Swedish enlistment. American Economic
Journal: Applied Economics, 3(1), 101-128.
Loeb, S., Miller, L. C., & Wyckoff, J. (2015). Performance screens for school
improvement: The case of teacher tenure reform in New York City. Educational
Researcher, 44(4), 199-212.
Lyubomirsky, S., King, L., & Diener, E. (2005). The benefits of frequent positive affect:
Does happiness lead to success? Psychological Bulletin, 131(6), 803-855.
Moffitt, T.E., Arseneault, L., Belsky, D., Dickson, N., Hancox, R.J., Harrington, H.,
Houts, R., Poulton, R., Roberts, B.W., & Ross, S. (2011). A gradient of childhood
self-control predicts health, wealth, and public safety. Proceedings of the National
Academy of Sciences, 108(7), 2693-2698.
Mueller, G., & Plug, E. (2006). Estimating the effect of personality on male and female
earnings. Industrial & Labor Relations Review, 60(1), 3-22.
149
Murayama, K., Pekrun, R., Lichtenfeld, S., & vom Hofe, R. (2012). Predicting long-term
growth in students’ mathematics achievement: The unique contributions of
motivations and cognitive strategies. Child Development, 00(0), 1-16.
Murnane, R. J., & Phillips, B. R. (1981). What do effective teachers of inner-city children
have in common?. Social Science Research, 10(1), 83-100.
Murnane, R. J., & Willett, J. B. (2010). Methods matter: Improving causal inference in
educational and social science research. Oxford University Press.
Newton, X. A., Darling-Hammond, L., Haertel, E., & Thomas, E. (2010). Value-added
modeling of teacher effectiveness: An exploration of stability across models and
contexts. Education Policy Analysis Archives, 18(23), 1–27.
Nye, B., Konstantopoulos, S., & Hedges, L. V. (2004). How large are teacher
effects? Educational Evaluation and Policy Analysis, 26(3), 237-257.
Podgursky, M., & Springer, M. (2011). Teacher compensation systems in the United
States K-12 public school system. National Tax Journal, 64(1), 165-192.
Raudenbush, S. W., & Bryk, A. S. (2002). Hierarchical linear models: Applications and
data analysis methods. Second Edition. Thousand Oaks, CA: Sage Publications.
Rivkin, S. G., Hanushek, E. A., & Kain, J. F. (2005). Teachers, schools, and academic
achievement. Econometrica, 73(2), 417–458.
Rothstein, J. (2010). Teacher quality in educational production: Tracking, decay, and
student achievement. The Quarterly Journal of Economics, 125(1), 175-214.
150
Rothstein, J. (2014). Revisiting the impacts of teachers. Unpublished working paper.
Retrieved from: http://eml.berkeley.edu/~jrothst/workingpapers/rothstein_cfr.pdf
Ruzek, E. A., Domina, T., Conley, A. M., Duncan, G.J., & Karabenick, S. A. (2014).
Using value-added models to measure teacher effects on students’ motivation and
achievement. The Journal of Early Adolescence, 1-31.
Sanders, W. L., Wright, S. P., & Horn, S. P. (1997). Teacher and classroom context
effects on student achievement: Implications for teacher evaluation. Journal of
Personnel Evaluation in Education, 11(1), 57-67.
Thompson, P. N., Guarino, C. M., & Wooldridge, J. M. (2015). An evaluation of teacher
value-added models with peer effects. Working Paper. Retrieved from:
https://aefpweb.org/sites/default/files/webform/aefp40/Thompson_Guarino_Wool
dridge_AEFP.pdf
Thum, Y. M., & Bryk, A. S. (1997). Value-added productivity indicators: The Dallas
system. In Jason Millman (Ed.) Grading teachers, grading schools: Is student
achievement a valid evaluation measure? (pp. 100–119). Thousand Oaks, CA:
Corwin.
Todd, P. E., & Wolpin, K. I. (2003). On the specification and estimation of the
production function for cognitive achievement. The Economic Journal, 113(485),
F3-F33.
West, M. R., Kraft, M. A., Finn, A. S., Martin, R., Duckworth, A. L., Gabrieli, C. F., &
Gabrieli, J. D. (2016). Promise and paradox: Measuring students’ non-cognitive
151
skills and the impact of schooling. Educational Evaluation and Policy Analysis,
38(1), 148-170.
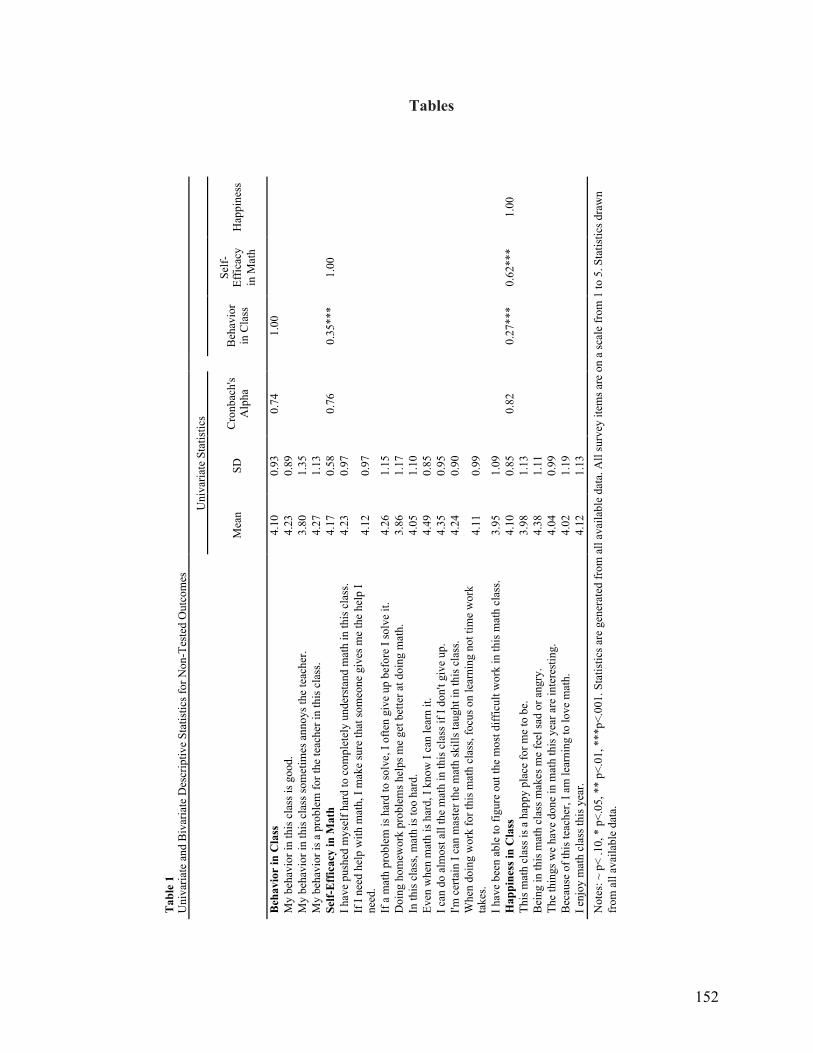
152
Tables
Tab
le 1
Uni
varia
te a
nd B
ivar
iate
Des
crip
tive
Stat
istic
s for
Non
-Tes
ted
Out
com
es
U
niva
riate
Sta
tistic
s
!!
M
ean
SD
Cro
nbac
h's
Alp
ha
Beh
avio
r in
Cla
ss
Self-
Effic
acy
in M
ath
Hap
pine
ss
Beh
avio
r in
Cla
ss
4.10
0.
93
0.74
1.00
M
y be
havi
or in
this
cla
ss is
goo
d.
4.23
0.
89
M
y be
havi
or in
this
cla
ss so
met
imes
ann
oys t
he te
ache
r. 3.
80
1.35
My
beha
vior
is a
pro
blem
for t
he te
ache
r in
this
cla
ss.
4.27
1.
13
Se
lf-E
ffic
acy
in M
ath
4.17
0.
58
0.76
0.35
***
1.00
I hav
e pu
shed
mys
elf h
ard
to c
ompl
etel
y un
ders
tand
mat
h in
this
cla
ss.
4.23
0.
97
If
I ne
ed h
elp
with
mat
h, I
mak
e su
re th
at so
meo
ne g
ives
me
the
help
I ne
ed.
4.12
0.
97
If
a m
ath
prob
lem
is h
ard
to so
lve,
I of
ten
give
up
befo
re I
solv
e it.
4.
26
1.15
Doi
ng h
omew
ork
prob
lem
s hel
ps m
e ge
t bet
ter a
t doi
ng m
ath.
3.
86
1.17
In th
is c
lass
, mat
h is
too
hard
. 4.
05
1.10
Even
whe
n m
ath
is h
ard,
I kn
ow I
can
lear
n it.
4.
49
0.85
I can
do
alm
ost a
ll th
e m
ath
in th
is c
lass
if I
don'
t giv
e up
. 4.
35
0.95
I'm c
erta
in I
can
mas
ter t
he m
ath
skill
s tau
ght i
n th
is c
lass
. 4.
24
0.90
Whe
n do
ing
wor
k fo
r thi
s mat
h cl
ass,
focu
s on
lear
ning
not
tim
e w
ork
take
s. 4.
11
0.99
I hav
e be
en a
ble
to fi
gure
out
the
mos
t diff
icul
t wor
k in
this
mat
h cl
ass.
3.95
1.
09
H
appi
ness
in C
lass
4.
10
0.85
0.
82
0.
27**
* 0.
62**
* 1.
00
This
mat
h cl
ass i
s a h
appy
pla
ce fo
r me
to b
e.
3.98
1.
13
B
eing
in th
is m
ath
clas
s mak
es m
e fe
el sa
d or
ang
ry.
4.38
1.
11
Th
e th
ings
we
have
don
e in
mat
h th
is y
ear a
re in
tere
stin
g.
4.04
0.
99
B
ecau
se o
f thi
s tea
cher
, I a
m le
arni
ng to
love
mat
h.
4.02
1.
19
I e
njoy
mat
h cl
ass t
his y
ear.
4.12
1.
13
N
otes
: ~ p
< .1
0, *
p<.
05, *
* p<
.01,
***
p<.0
01. S
tatis
tics a
re g
ener
ated
from
all
avai
labl
e da
ta. A
ll su
rvey
item
s are
on
a sc
ale
from
1 to
5. S
tatis
tics d
raw
n fr
om a
ll av
aila
ble
data
.
!
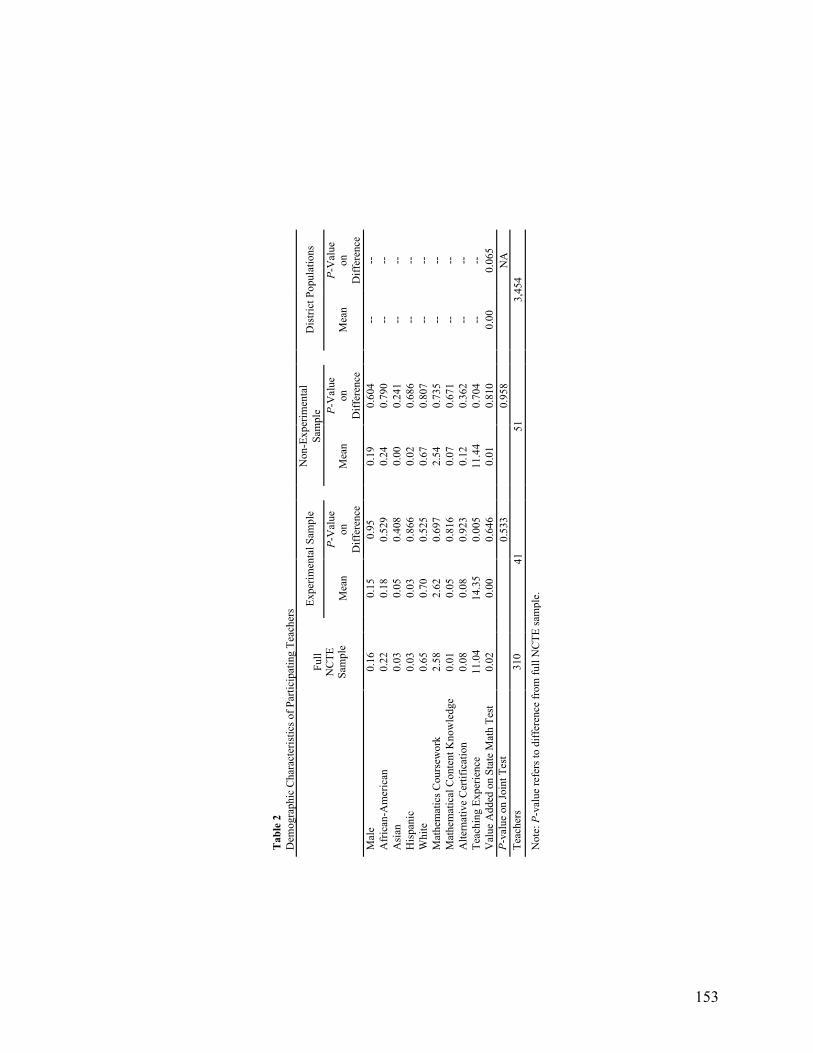
153
Tab
le 2
D
emog
raph
ic C
hara
cter
istic
s of P
artic
ipat
ing
Teac
hers
Fu
ll N
CTE
Sa
mpl
e
!!Ex
perim
enta
l Sam
ple
N
on-E
xper
imen
tal
Sam
ple
!!D
istri
ct P
opul
atio
ns
Mea
n P-
Val
ue
on
Diff
eren
ce
M
ean
P-V
alue
on
D
iffer
ence
Mea
n P-
Val
ue
on
Diff
eren
ce
Mal
e 0.
16
0.
15
0.95
0.19
0.
604
--
--
A
fric
an-A
mer
ican
0.
22
0.
18
0.52
9
0.24
0.
790
--
--
A
sian
0.
03
0.
05
0.40
8
0.00
0.
241
--
--
H
ispa
nic
0.03
0.03
0.
866
0.
02
0.68
6
--
--
Whi
te
0.65
0.70
0.
525
0.
67
0.80
7
--
--
Mat
hem
atic
s Cou
rsew
ork
2.58
2.62
0.
697
2.
54
0.73
5
--
--
Mat
hem
atic
al C
onte
nt K
now
ledg
e 0.
01
0.
05
0.81
6
0.07
0.
671
--
--
A
ltern
ativ
e C
ertif
icat
ion
0.08
0.08
0.
923
0.
12
0.36
2
--
--
Teac
hing
Exp
erie
nce
11.0
4
14.3
5 0.
005
11
.44
0.70
4
--
--
Val
ue A
dded
on
Stat
e M
ath
Test
0.
02
0.
00
0.64
6
0.01
0.
810
0.
00
0.06
5 P-
valu
e on
Join
t Tes
t
0.53
3
0.
958
NA
Te
ache
rs
310
41
51
3,
454
Not
e: P
-val
ue re
fers
to d
iffer
ence
from
full
NC
TE sa
mpl
e.
!
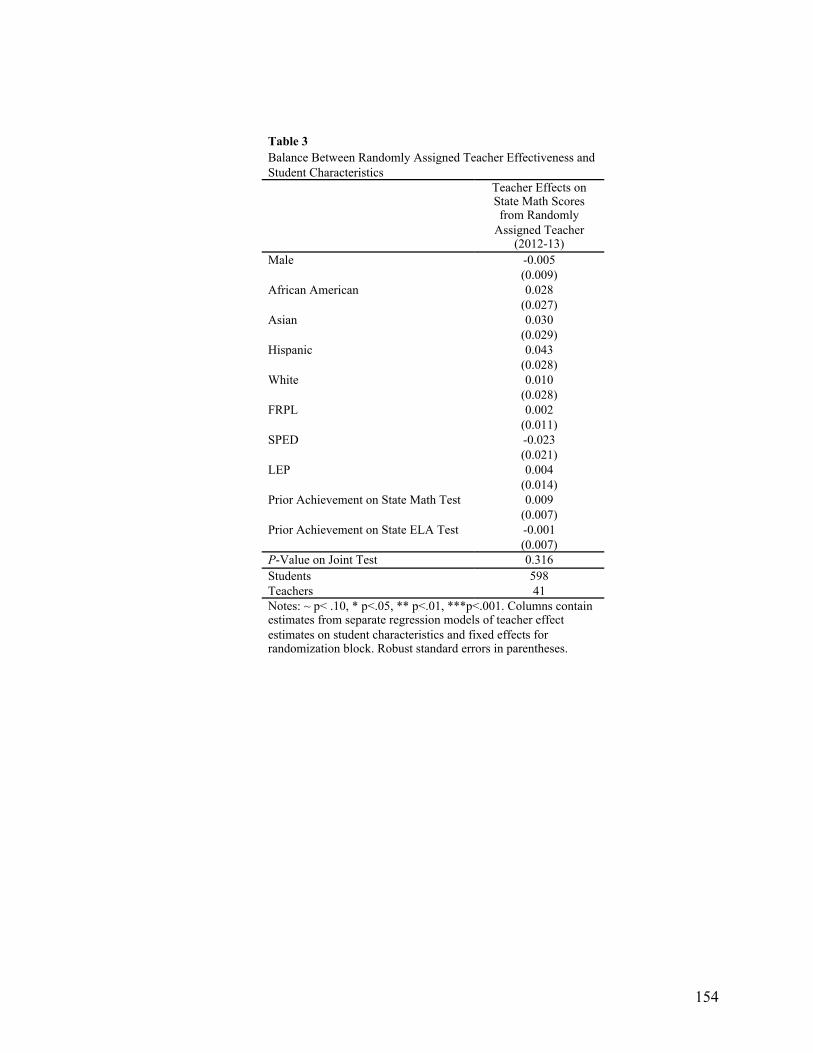
154
Table 3 Balance Between Randomly Assigned Teacher Effectiveness and
Student Characteristics
Teacher Effects on State Math Scores from Randomly
Assigned Teacher (2012-13)
Male -0.005
(0.009)
African American 0.028
(0.027)
Asian 0.030
(0.029)
Hispanic 0.043
(0.028)
White 0.010
(0.028)
FRPL 0.002
(0.011)
SPED -0.023
(0.021)
LEP 0.004
(0.014)
Prior Achievement on State Math Test 0.009
(0.007)
Prior Achievement on State ELA Test -0.001
(0.007)
P-Value on Joint Test 0.316 Students 598 Teachers 41 Notes: ~ p< .10, * p<.05, ** p<.01, ***p<.001. Columns contain estimates from separate regression models of teacher effect estimates on student characteristics and fixed effects for randomization block. Robust standard errors in parentheses.
!
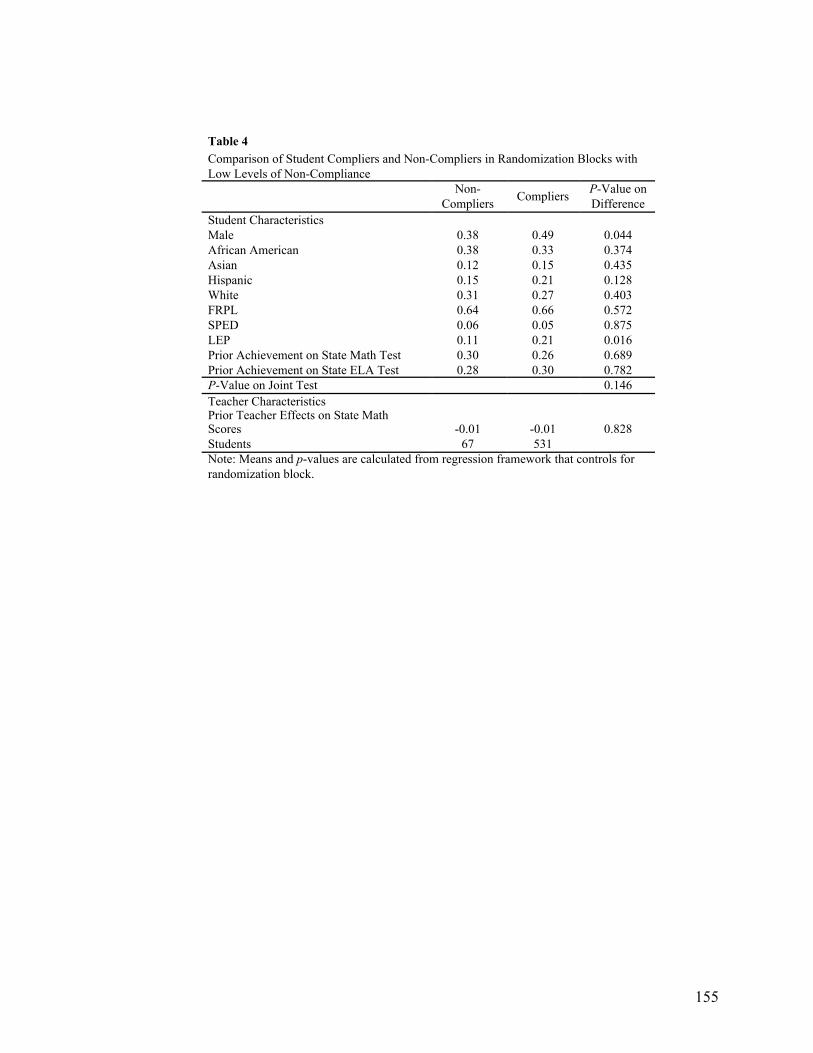
155
Table 4 Comparison of Student Compliers and Non-Compliers in Randomization Blocks with
Low Levels of Non-Compliance
Non-
Compliers Compliers P-Value on Difference
Student Characteristics Male 0.38 0.49 0.044 African American 0.38 0.33 0.374 Asian 0.12 0.15 0.435 Hispanic 0.15 0.21 0.128 White 0.31 0.27 0.403 FRPL 0.64 0.66 0.572 SPED 0.06 0.05 0.875 LEP 0.11 0.21 0.016 Prior Achievement on State Math Test 0.30 0.26 0.689 Prior Achievement on State ELA Test 0.28 0.30 0.782 P-Value on Joint Test 0.146 Teacher Characteristics
Prior Teacher Effects on State Math Scores -0.01 -0.01 0.828 Students 67 531 Note: Means and p-values are calculated from regression framework that controls for randomization block.
!
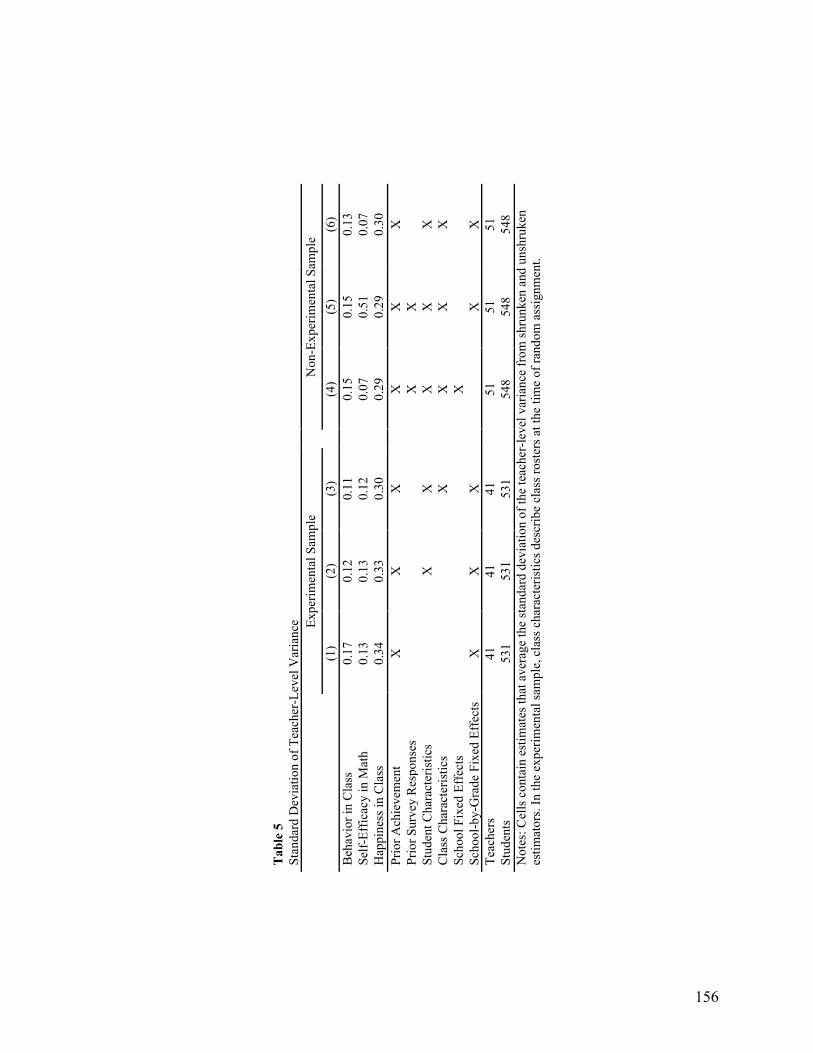
156
Tab
le 5
Stan
dard
Dev
iatio
n of
Tea
cher
-Lev
el V
aria
nce
Ex
perim
enta
l Sam
ple
N
on-E
xper
imen
tal S
ampl
e
(1)
(2)
(3)
(4
) (5
) (6
) B
ehav
ior i
n C
lass
0.
17
0.12
0.
11
0.
15
0.15
0.
13
Self-
Effic
acy
in M
ath
0.13
0.
13
0.12
0.07
0.
51
0.07
H
appi
ness
in C
lass
0.
34
0.33
0.
30
0.
29
0.29
0.
30
Prio
r Ach
ieve
men
t X
X
X
X
X
X
Prio
r Sur
vey
Res
pons
es
X
X
St
uden
t Cha
ract
eris
tics
X
X
X
X
X
Cla
ss C
hara
cter
istic
s
X
X
X
X
Scho
ol F
ixed
Eff
ects
X
Sc
hool
-by-
Gra
de F
ixed
Eff
ects
X
X
X
X
X
Te
ache
rs
41
41
41
51
51
51
St
uden
ts
531
531
531
54
8 54
8 54
8 N
otes
: Cel
ls c
onta
in e
stim
ates
that
ave
rage
the
stan
dard
dev
iatio
n of
the
teac
her-
leve
l var
ianc
e fr
om sh
runk
en a
nd u
nshr
uken
es
timat
ors.
In th
e ex
perim
enta
l sam
ple,
cla
ss c
hara
cter
istic
s des
crib
e cl
ass r
oste
rs a
t the
tim
e of
rand
om a
ssig
nmen
t.
!
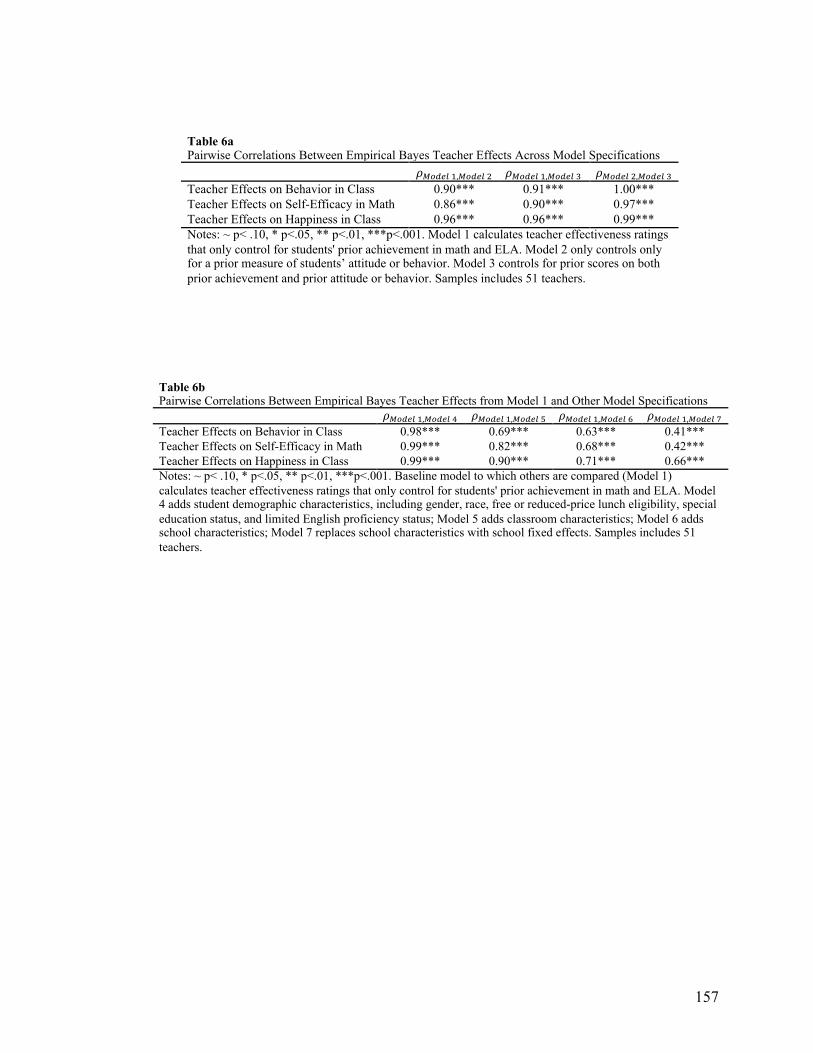
157
Table 6a Pairwise Correlations Between Empirical Bayes Teacher Effects Across Model Specifications
!!"#$%!!,!"#$%!! !!"#$%!!,!"#$%!! !!"#$%!!,!"#$%!! Teacher Effects on Behavior in Class 0.90*** 0.91*** 1.00*** Teacher Effects on Self-Efficacy in Math 0.86*** 0.90*** 0.97*** Teacher Effects on Happiness in Class 0.96*** 0.96*** 0.99*** Notes: ~ p< .10, * p<.05, ** p<.01, ***p<.001. Model 1 calculates teacher effectiveness ratings that only control for students' prior achievement in math and ELA. Model 2 only controls only for a prior measure of students’ attitude or behavior. Model 3 controls for prior scores on both prior achievement and prior attitude or behavior. Samples includes 51 teachers.
!
Table 6b Pairwise Correlations Between Empirical Bayes Teacher Effects from Model 1 and Other Model Specifications
!!"#$%!!,!"#$%!! !!"#$%!!,!"#$%!! !!"#$%!!,!"#$%!! !!"#$%!!,!"#$%!! Teacher Effects on Behavior in Class 0.98*** 0.69*** 0.63*** 0.41*** Teacher Effects on Self-Efficacy in Math 0.99*** 0.82*** 0.68*** 0.42*** Teacher Effects on Happiness in Class 0.99*** 0.90*** 0.71*** 0.66*** Notes: ~ p< .10, * p<.05, ** p<.01, ***p<.001. Baseline model to which others are compared (Model 1) calculates teacher effectiveness ratings that only control for students' prior achievement in math and ELA. Model 4 adds student demographic characteristics, including gender, race, free or reduced-price lunch eligibility, special education status, and limited English proficiency status; Model 5 adds classroom characteristics; Model 6 adds school characteristics; Model 7 replaces school characteristics with school fixed effects. Samples includes 51 teachers.
!
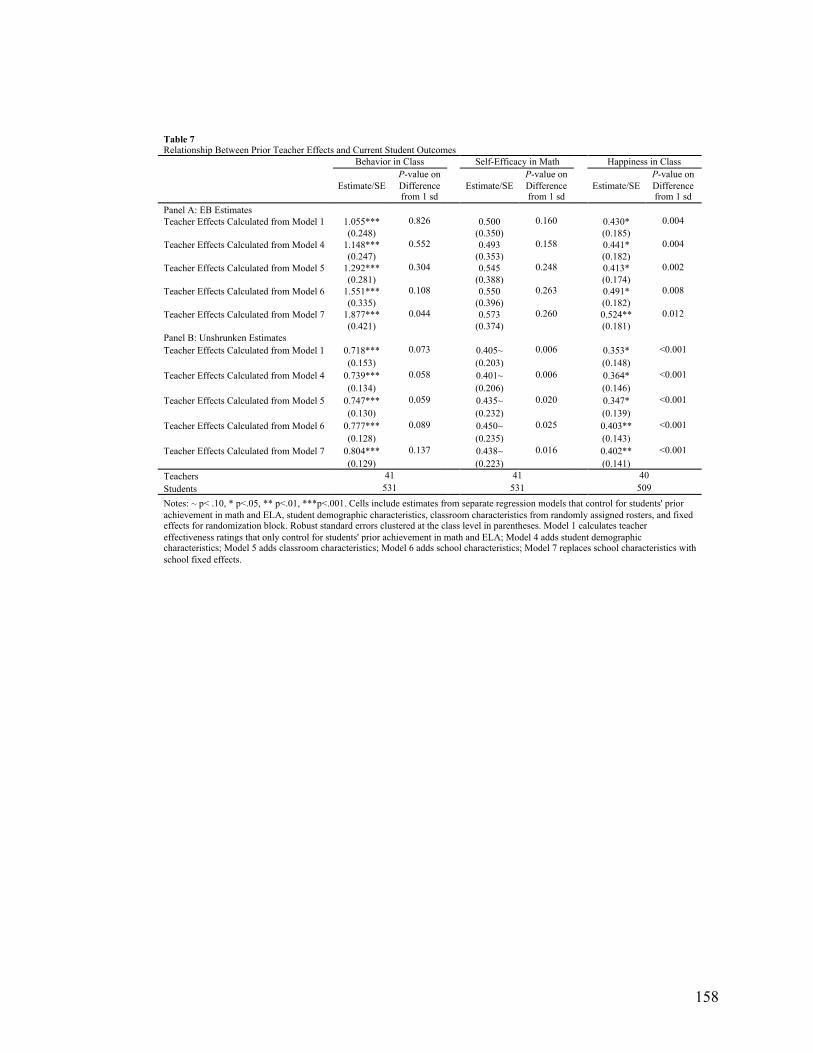
158
Table 7 Relationship Between Prior Teacher Effects and Current Student Outcomes Behavior in Class Self-Efficacy in Math Happiness in Class
Estimate/SE
P-value on Difference from 1 sd
Estimate/SE P-value on Difference from 1 sd
Estimate/SE P-value on Difference from 1 sd
Panel A: EB Estimates Teacher Effects Calculated from Model 1 1.055*** 0.826 0.500 0.160 0.430* 0.004
(0.248) (0.350) (0.185)
Teacher Effects Calculated from Model 4 1.148*** 0.552 0.493 0.158 0.441* 0.004
(0.247) (0.353) (0.182)
Teacher Effects Calculated from Model 5 1.292*** 0.304 0.545 0.248 0.413* 0.002
(0.281) (0.388) (0.174)
Teacher Effects Calculated from Model 6 1.551*** 0.108 0.550 0.263 0.491* 0.008
(0.335) (0.396) (0.182)
Teacher Effects Calculated from Model 7 1.877*** 0.044 0.573 0.260 0.524** 0.012
(0.421) (0.374) (0.181)
Panel B: Unshrunken Estimates Teacher Effects Calculated from Model 1 0.718*** 0.073 0.405~ 0.006 0.353* <0.001
(0.153) (0.203) (0.148)
Teacher Effects Calculated from Model 4 0.739*** 0.058 0.401~ 0.006 0.364* <0.001
(0.134) (0.206) (0.146)
Teacher Effects Calculated from Model 5 0.747*** 0.059 0.435~ 0.020 0.347* <0.001
(0.130) (0.232) (0.139)
Teacher Effects Calculated from Model 6 0.777*** 0.089 0.450~ 0.025 0.403** <0.001
(0.128) (0.235) (0.143)
Teacher Effects Calculated from Model 7 0.804*** 0.137 0.438~ 0.016 0.402** <0.001
(0.129) (0.223) (0.141)
Teachers 41 41 40 Students 531 531 509 Notes: ~ p< .10, * p<.05, ** p<.01, ***p<.001. Cells include estimates from separate regression models that control for students' prior achievement in math and ELA, student demographic characteristics, classroom characteristics from randomly assigned rosters, and fixed effects for randomization block. Robust standard errors clustered at the class level in parentheses. Model 1 calculates teacher effectiveness ratings that only control for students' prior achievement in math and ELA; Model 4 adds student demographic characteristics; Model 5 adds classroom characteristics; Model 6 adds school characteristics; Model 7 replaces school characteristics with school fixed effects.
!
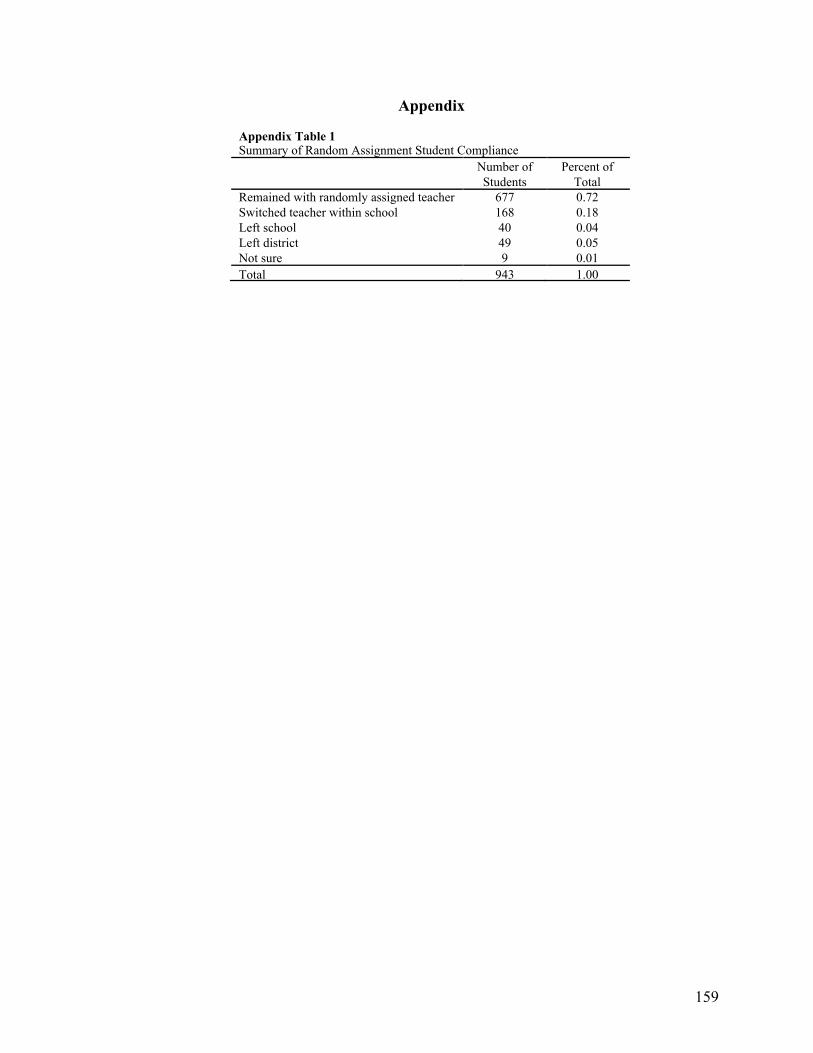
159
Appendix
Appendix Table 1 Summary of Random Assignment Student Compliance
Number of Students
Percent of Total
Remained with randomly assigned teacher 677 0.72 Switched teacher within school 168 0.18 Left school 40 0.04 Left district 49 0.05 Not sure 9 0.01 Total 943 1.00
!
160
Conclusion
This study is among the first attempts to identify teacher and teaching effects
using observations of instruction inside teachers’ own classrooms. To my knowledge, it is
the only study to date to use random assignment to estimate the predictive validity of
teacher effects on students’ attitudes and behaviors. Therefore, results from this work are
likely to inform policy and practice in at least two ways.
First, exploring the impact of specific types of mathematics teaching on student
outcomes may help policymakers and school leaders ways to get more teachers who
engage in these effective teaching practices into classrooms. This may occur either
through evaluation or development practices. That is, when observing classrooms, school
leaders may look specifically for those elements of instruction shown to contribute to
student outcomes – either academic or non-tested. Further, school leaders may use this
information to link teachers to professional development opportunities aimed at
improving their skill in a particular instructional domain.
Second, results showing substantive teacher effects on a range of student attitudes
and behaviors, as well as weak correlations between teacher effects across outcome types,
highlight the multidimensional nature of teaching. Thus, improvement efforts likely need
to account for this complexity. However, in light of persistent concerns about how best to
measure these outcomes and potential bias in teacher effect estimates on these outcomes,
it likely is not appropriate to incorporate these specific survey items directly into teacher
evaluation systems. Instead, evidence linking specific teaching practices to non-tested
outcomes suggests that evaluations might place greater weight on these measures.
Further, as above, these teaching practices may be a focus of development efforts.
161
Filling elementary classrooms with teachers who engage in effective mathematics
teaching practices will take time. Doing so likely will entail a variety of efforts, including
improvements in professional development offerings that engage teachers substantively
around their own teaching practices and stronger efforts to hire teachers with deep
knowledge of mathematics. Importantly, though, the education community is beginning
to gain an understanding of the types of teaching that students are exposed to that raise
outcomes.