Embed Size (px)
Citation preview

Class Presentation November 24th 2009
Project AoA – GaTech
Ahmad El Tannir, Christopher A. Klug, Felix Friemann,
Jason Philip, Manuel Klennert, Sven Christian Mueller

2 Project „Distribution from port to dealers, 11-24-09
Audi of America Supply Chain Optimization
Agenda
I. Project Introduction
II. Results
III. Discussion
IV. Summary
V. Recommendations
Source: http://www.ovwinsum.nl

3 Project „Distribution from port to dealers, 11-24-09
I. Project Introduction
► Audi of America
► Sells ~80k vehicles at ~260 dealerships
in USA
► Manufacture vehicles in Germany
► Ship to East, Gulf, and West coasts
► Train and truck network from 4 ports
► Bigger Picture
► Part of Volkswagen logistics network
• e.g. use of VW vessels, share rail cars
► Looking to merge Audi & Porsche
supply chains
► ~1% of cars sold in America
► ~2/3rds sold in California, Florida, &
New England
Source: http://www.hypertuned.com

4 Project „Distribution from port to dealers, 11-24-09
Planned Sales by Dealership 2009

5 Project „Distribution from port to dealers, 11-24-09
I. Project Introduction
► Project Goals
► Develop Greenfield approach from
port to dealer
► Evaluate current logistics network
► Evaluate synergies between
Porsche Logistics and Audi
► Develop concept on how to
differentiate between sold vs. stock
orders
► Evaluate logistics network with
target growth
Source: http://www.andreasbard.com

6 Project „Distribution from port to dealers, 11-24-09
II. Results – Cost Summary per Audi
0%
20%
40%
60%
80%
100%
120%
Current Greenfield Differentiated Porsche Projected Growth
Inventory
Transport
Time
-4 %-7%-14% -8%
+5%
-4% -6%+1 %
7 Project „Distribution from port to dealers, 11-24-09
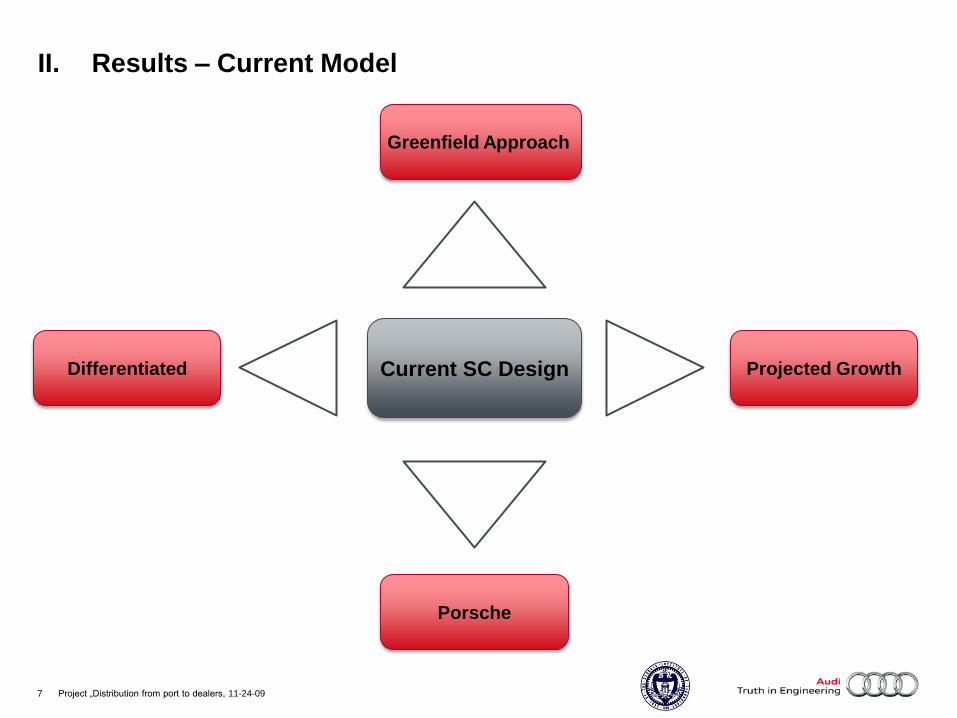
Current SC Design
Greenfield Approach
Differentiated Projected Growth
Porsche
II. Results – Current Model
8 Project „Distribution from port to dealers, 11-24-09
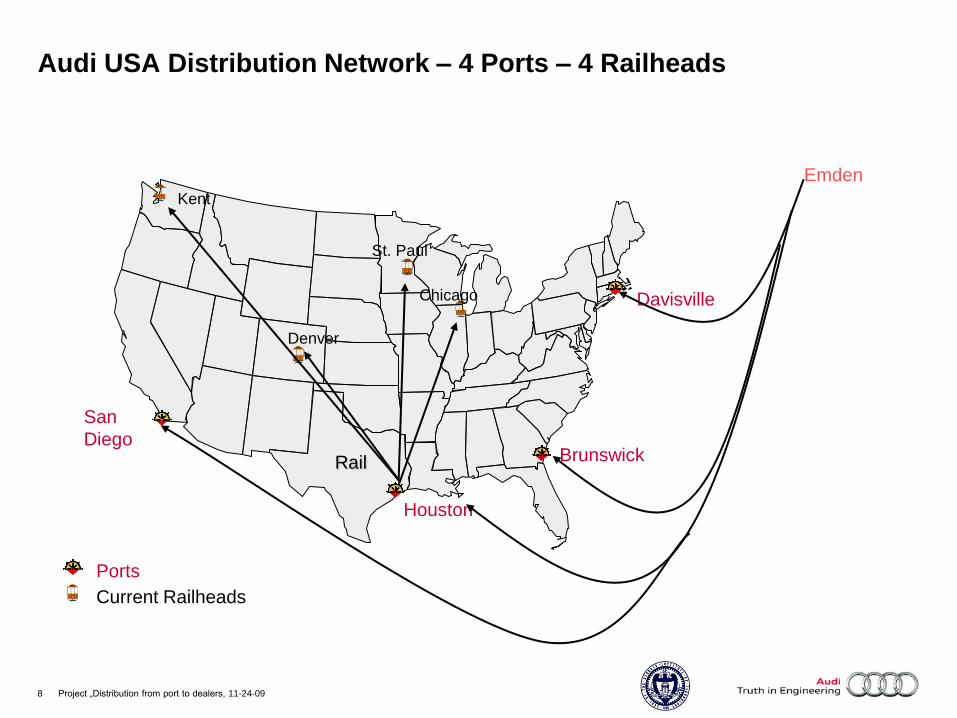
Houston
San
DiegoBrunswick
Davisville
Kent
St. Paul
Denver
Chicago
Rail
Ports
Current Railheads
Audi USA Distribution Network – 4 Ports – 4 Railheads
Emden

9 Project „Distribution from port to dealers, 11-24-09
Current SC Design
Greenfield Approach
Differentiated Projected Growth
Porsche
II. Results – Greenfield Model
Minimal cost

10 Project „Distribution from port to dealers, 11-24-09
Houston
Los
Angeles
Baltimore
Newark
Denver
Chicago
Ports
Railheads
Greenfield Distribution Network – 6 Ports – 5 Railheads
Emden
Miami
Atlanta
San
Francisco
Framingham

11 Project „Distribution from port to dealers, 11-24-09
Key Differences
► Current Model
► 4 Ports
► 4 Railheads
► Greenfield
► 6 Ports
Close Brunswick, Davisville, San
Diego
Open Baltimore, LA, Miami,
Seattle, Newark
► 5 Railheads
Close Seattle, St. Paul
Open Atlanta, San Francisco,
Framingham0%
20%
40%
60%
80%
100%
120%
Inventory
Transport
Time-14%
+5 %

12 Project „Distribution from port to dealers, 11-24-09
Sensitivity Analysis – Ports
0%
20%
40%
60%
80%
100%
120%
3 Ports 4 Ports 5 Ports 6 Ports
Inventory
Transport
Time
Newark
Brunswick
LA
Newark
Miami
Houston
LA
Seattle
Newark
Baltimore
Miami
Houston
LA
Seattle
Newark
Miami
Houston
LA

13 Project „Distribution from port to dealers, 11-24-09
Sensitivity Analysis – Inventory Costs
0%
20%
40%
60%
80%
100%
120%
140%
0% 5% 10%
Inventory
Transport
TimeGreenfield<1%
less
+6%
~80 %
more
-9%+10%

14 Project „Distribution from port to dealers, 11-24-09
Current SC Design
Greenfield Approach
Differentiated Projected Growth
Porsche
II. Results – Differentiated Supply Chain
time focus for
sold order and high value
cars (trucking)

15 Project „Distribution from port to dealers, 11-24-09
Results – Differentiated Supply Chain
0
2
4
6
8
10
12
14
16
18
20
Days
Time
High Value Orders
Sold Orders
Stock Orders 0%
20%
40%
60%
80%
100%
120%
Cost
Inven
Trans-7 %
-4 %
Note:
Differentiated has 5%
higher costs than Greenfield

16 Project „Distribution from port to dealers, 11-24-09
Key Differences
► Current
► 4 Railheads
► 4 Ports
► Differentiated SC
► 3 Railheads (Chattanooga,
Chicago, Denver)
► Opens Chattanooga, Closes
Seattle and St. Paul
► 6 Ports (Baltimore, Houston, Los
Angeles, Miami, San Francisco,
Newark)
► Keeps only Houston
Source: http://www.aldarin-electronics.com

17 Project „Distribution from port to dealers, 11-24-09
Current SC Design
Greenfield Approach
Differentiated Projected Growth
Porsche
II. Results – Add Porsche to the differentiated Audi Supply Chain
Include Porsche volumes,
time focus for Porsche,
sold + high value Audis
18 Project „Distribution from port to dealers, 11-24-09
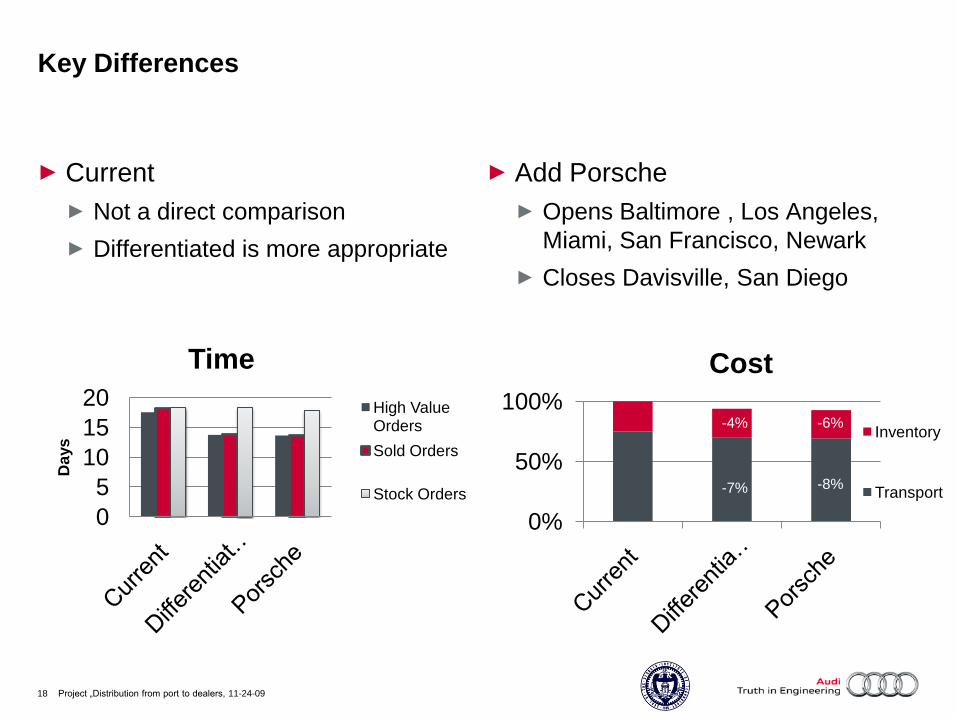
Key Differences
► Current
► Not a direct comparison
► Differentiated is more appropriate
► Add Porsche
► Opens Baltimore , Los Angeles,
Miami, San Francisco, Newark
► Closes Davisville, San Diego
0
5
10
15
20
Days
Time
High Value Orders
Sold Orders
Stock Orders
0%
50%
100%
Cost
Inventory
Transport-7% -8%
-7%
-4% -6%

19 Project „Distribution from port to dealers, 11-24-09
Current SC Design
Greenfield Approach
Differentiated Projected Growth
Porsche
II. Results – Projected Audi Growth
Increased volumes,
more sold and high value
(time focus as in diff.)

20 Project „Distribution from port to dealers, 11-24-09
Key Differences
►Current
► X% sold order
► Y% high value orders
►Projected Audi Growth
► Increased volume
► Higher amount of sold and high
value orders
0%
50%
100%
Cost
Inventory
Transport
0
5
10
15
20
Days
Time
High Value Orders
Sold Orders
Stock Orders
-4%
+1%
-7% -4%
+1%-4%

21 Project „Distribution from port to dealers, 11-24-09
III. Discussion – Assumptions
► Linear time and cost assumption
► Context: VW Network
► Inventory of 5 cars per rail lane usage
► Fixed opening cost for ports
► Times
► Port: 4 days (target of AoA)
► Railhead: 1 day
► Vessel: provided by AoA (VW vessels)
► Rail: Union Pacific + 2 days
► Trucking: distance / 500 miles
► Costs
► Avg. Audi Values: $ X / Y
► Avg. Porsche Value: $ Z
► Inventory holding costs: 5%
► Opening ports: $ P
► Transportation costs provided by AoASource: http://www.adcet.edu.au/

22 Project „Distribution from port to dealers, 11-24-09
Considered Supply Chain Facilities for Greenfield Approach

23 Project „Distribution from port to dealers, 11-24-09
Approach: Multiple Flow Model (AMPL)
► Choice of potential ports and railheads
► 4 “types“ of cars modeled separately:
► Audi‘s: Stock order / Sold order / High
Value
► Porsche
► Difference: different average values and
the option to focus on speed (by pure
trucking from east-/gulfcoast)
► Minimum # of cars per year to use a port
or a rail lane
► Objective: Minimize cost
(inventory + transport)
► Optional constraints (e.g. use certain #
of ports, focus on speed for certain type
of cars by trucking,..)

24 Project „Distribution from port to dealers, 11-24-09
IV. Summary
0%
20%
40%
60%
80%
100%
120%
Current Greenfield Differentiated Porsche Projected Growth
Inventory
Transport
Time
-4 %-7%-14% -8%
+5%
-4% -6%+1 %

25 Project „Distribution from port to dealers, 11-24-09
V. Recommendations
► Implementation
► Fast delivery of non-stock orders: 6% cost saving with 4 days delivery savings
► Change railheads: Serve Chicago via East coast port
► Due to low sensitivity over 3-6 ports: Brunswick to Miami (stay at 4 ports)
► Minimal impact of Porsche on Audi network: Assess savings on Porsche network
► Change current model assumptions for Growth model
► Non-linear increase in transportation costs under current assumptions
► Take advantage of concave costs & time
► Consider influence of VW in more detail
► Scale of synergies, e.g. share fixed costs, share trains, concave costs and time
► Possible disadvantages, e.g. choice of ports maybe optimal for VW but not for Audi

26 Project „Distribution from port to dealers, 11-24-09
Comments/Questions
Source: http://malcolmmarler.com/
27 Project „Distribution from port to dealers, 11-24-09
Thank you.